Article

Effects of Variety and Growth Stage on UAV Multispectral Estimation of Plant Nitrogen Content of Winter Wheat

1
College of Information and Management Science, Henan Agricultural University, Zhengzhou 450002, China
2
Institute of Agricultural Information Technology, Henan Academy of Agricultural Sciences, Zhengzhou 450002, China
3
Key Laboratory of Huang-Huai-Hai Smart Agricultural Technology, Ministry of Agriculture and Rural Affairs, Zhengzhou 450002, China
4
College of Land Science and Technology, China Agricultural University, Beijing 100091, China
5
Information Technology Research Center, Beijing Academy of Agriculture and Forestry Sciences, Beijing 100097, China
*
Author to whom correspondence should be addressed.
Agriculture 2024, 14(10), 1775; https://doi.org/10.3390/agriculture14101775
Submission received: 7 August 2024 / Revised: 13 September 2024 / Accepted: 1 October 2024 / Published: 9 October 2024

Abstract

:
The accurate estimation of nitrogen content in crop plants is the basis of precise nitrogen fertilizer management. Unmanned aerial vehicle (UAV) imaging technology has been widely used to rapidly estimate the nitrogen in crop plants, but the accuracy will still be affected by the variety, the growth stage, and other factors. We aimed to (1) analyze the correlation between the plant nitrogen content of winter wheat and spectral, texture, and structural information; (2) compare the accuracy of nitrogen estimation at single versus multiple growth stages; (3) assess the consistency of UAV multispectral images in estimating nitrogen content across different wheat varieties; (4) identify the best model for estimating plant nitrogen content (PNC) by comparing five machine learning algorithms. The results indicated that for the estimation of PNC across all varieties and growth stages, the random forest regression (RFR) model performed best among the five models, obtaining R2, RMSE, MAE, and MAPE values of 0.90, 0.10%, 0.08, and 0.06%, respectively. Additionally, the RFR estimation model achieved commendable accuracy in estimating PNC in three different varieties, with R2 values of 0.91, 0.93, and 0.72. For the dataset of the single growth stage, Gaussian process regression (GPR) performed best among the five regression models, with R2 values ranging from 0.66 to 0.81. Due to the varying nitrogen sensitivities, the accuracy of UAV multispectral nitrogen estimation was also different among the three varieties. Among the three varieties, the estimation accuracy of SL02-1 PNC was the worst. This study is helpful for the rapid diagnosis of crop nitrogen nutrition through UAV multispectral imaging technology.

1. Introduction

Winter wheat is one of the significant food crops [1,2]. Nitrogen is a crucial nutrient for crop growth, yield, and quality [3,4]. The improper application of nitrogen fertilizer has detrimental effects on both crops and the farm environment. Nitrogen deficiency will hinder photosynthesis and reduce yield, while excessive nitrogen fertilizer will reduce fertilizer utilization and pollute the environment [5]. Hence, accurate and real-time monitoring of nitrogen content is essential for precise fertilization decision-making and for maintaining stable yields.
Remote sensing has been widely applied for monitoring crop nitrogen status over extensive areas, relying on the correlation between the nitrogen content in plants and canopy spectral responses. Nitrogen affects the composition and content of chlorophyll, which subsequently alters the leaf spectrum. In nitrogen-deficient conditions, plants exhibit reduced height and yellowing leaves. Conversely, in nitrogen-sufficient conditions, crops grow taller and display greener leaves, resulting in spectral responses in the near-infrared and red bands [6]. Numerous studies have utilized non-imaging hyperspectral data to estimate nitrogen status in various crops, including wheat [7], maize [8], and paddy rice [9], yielding promising results. Handheld sensors, such as Greenseeker and CropCircle, based on crop spectral response principles, can rapidly assess crop nitrogen status [10,11]. However, both near-ground non-imaging hyperspectral and handheld sensors only provide point information. Although these methods can effectively indicate nitrogen status in some plants, the spatial distribution of the nitrogen status of all plants cannot be obtained, thus affecting the effect of precise nitrogen fertilizer application.
In recent years, the application of UAV imaging technology in crop monitoring has increased significantly. Drones can be equipped with various sensors, including digital, multispectral, thermal infrared, hyperspectral, and LiDAR systems. These UAV imaging technologies are now extensively employed to monitor various aspects of crop growth, including the seedling emergence rate [12], growth trends [13], nutritional status [14], disease detection [15,16], and yield estimation [17]. Digital imaging has inherent limitations, lacking the red-edge and near-infrared bands that are more sensitive to crop nutrient status. Thermal infrared imaging, while effective for monitoring surface temperatures and estimating crop or soil moisture, does not provide detailed spectral information. In contrast, the data acquired through hyperspectral and LiDAR sensing can deliver high-precision estimations of crop physiological parameters, although these instruments are costly and require complex processing. UAV multispectral imaging combines high spatial resolution with a relatively rich array of spectral bands, rendering it the most cost-effective sensor for diagnosing crop nutrition.
To date, several studies have applied UAV multispectral imaging to assess crop nitrogen status, such as leaf nitrogen content, plant nitrogen content, leaf nitrogen density, plant nitrogen density, and nitrogen nutrient index. Previous research on crop nitrogen estimation via UAV imaging has mainly focused on the spectrum, texture, and vegetation indices derived from the spectrum. The plant nitrogen content (PNC) of crops is an important factor affecting the canopy spectrum. Texture describes the spatial distribution of brightness among adjacent pixels [18,19]. Similarly, differences in PNC affect texture parameters. The estimation of the nitrogen status of crops by integrating the spectrum, vegetation indices, and texture has been widely reported [20,21]. Crop canopy structure is highly correlated with PNC, including canopy coverage and plant height [22,23]. The higher the PNC, the greater the canopy cover and plant height, especially in the early and middle stages of growth. Therefore, we believe that canopy structure information can be used as one of the features to estimate PNC. It is relatively easy to extract plant height and canopy coverage from UAV images [24]. There have been few relevant reports where structure information was employed in PNC estimation. Therefore, we intend to introduce canopy structure information in combination with the spectrum and texture to estimate PNC.
Due to differences among varieties, the nitrogen content of crop plants will show different time-series changes with the progress of the growth stage. The nitrogen content of crop plants in the same growth period is also affected by water and fertilizer treatment. Previous studies on crop plant nitrogen estimation by UAV technology have mainly focused on the same variety or a multi-variety combination [25,26]. There are few reports on the effects of the growth stage and variety on the nitrogen content estimation of winter wheat plants by UAV technology.
According to the previous research on crop trait estimation by UAV imaging, the features that can be extracted from images mainly include spectral reflectance [27], vegetation indices [28], and texture [29]. There is a certain degree of collinearity among these features. Therefore, selecting an appropriate algorithm is the basis for accurately estimating crop PNC. According to previous studies, five representative machine learning algorithms were selected to explore the optimal model for estimating PNC. Partial least squares regression (PLSR) is the most commonly used linear algorithm, which is suitable for multicollinearity between independent variables [30]. Random forest regression (RFR) can integrate multiple decision tree models to reduce the overfitting of any single model [31]. Support vector regression (SVR) can effectively handle high-dimensional data and model nonlinear relationships [32]. Gaussian process regression (GPR) can alleviate the “black box” problem, which often occurs in machine learning regression methods [33]. It has achieved considerable success in vegetation feature detection. Oliveira [34] compared the outcomes of multiple linear regression with the estimation of the tillering number, plant height, and stem diameter of wheat, finding that models based on random forest algorithms exhibited superior accuracy and precision compared to multiple linear regression models. Liu et al. [35] utilized support vector machine, random forest, random tree, and linear regression models to estimate the physiological parameters of rice varieties based on multispectral remote sensing data, concluding that support vector machine demonstrated better adaptability and higher precision in predicting SPAD values than the other models. In Ding et al.’s [32] study, three common machine learning algorithms—RFR, SVR, and PLSR—were employed to construct nitrogen content estimation models for winter wheat, revealing that random forest outperformed the other methods. Accordingly, the selection of an appropriate modeling approach is necessary for enhancing the accuracy of crop parameter estimation. In this study, we selected five common algorithms, including random forest regression, support vector machine regression, partial least squares regression, Gaussian process regression, and neural network regression, to estimate the PNC of winter wheat, aiming to find the optimal method.
The objective of this study was to analyze the effects of the variety and growth stage on the UAV multispectral estimation of the PNC of winter wheat. The experimental dataset we used in this study included three varieties and five nitrogen fertilizer levels. The specific objectives included (1) analyzing the correlations between spectral, texture, and structural information and wheat plant nitrogen; (2) comparing the accuracy of nitrogen content estimation in wheat plants during single and multiple growth stages; (3) assessing the consistency of UAV multispectral image in estimating plant nitrogen content across different wheat varieties; (4) evaluating the performance of five machine learning methods for estimating the PNC of winter wheat to find the optimal estimation model.

2. Materials and Methods

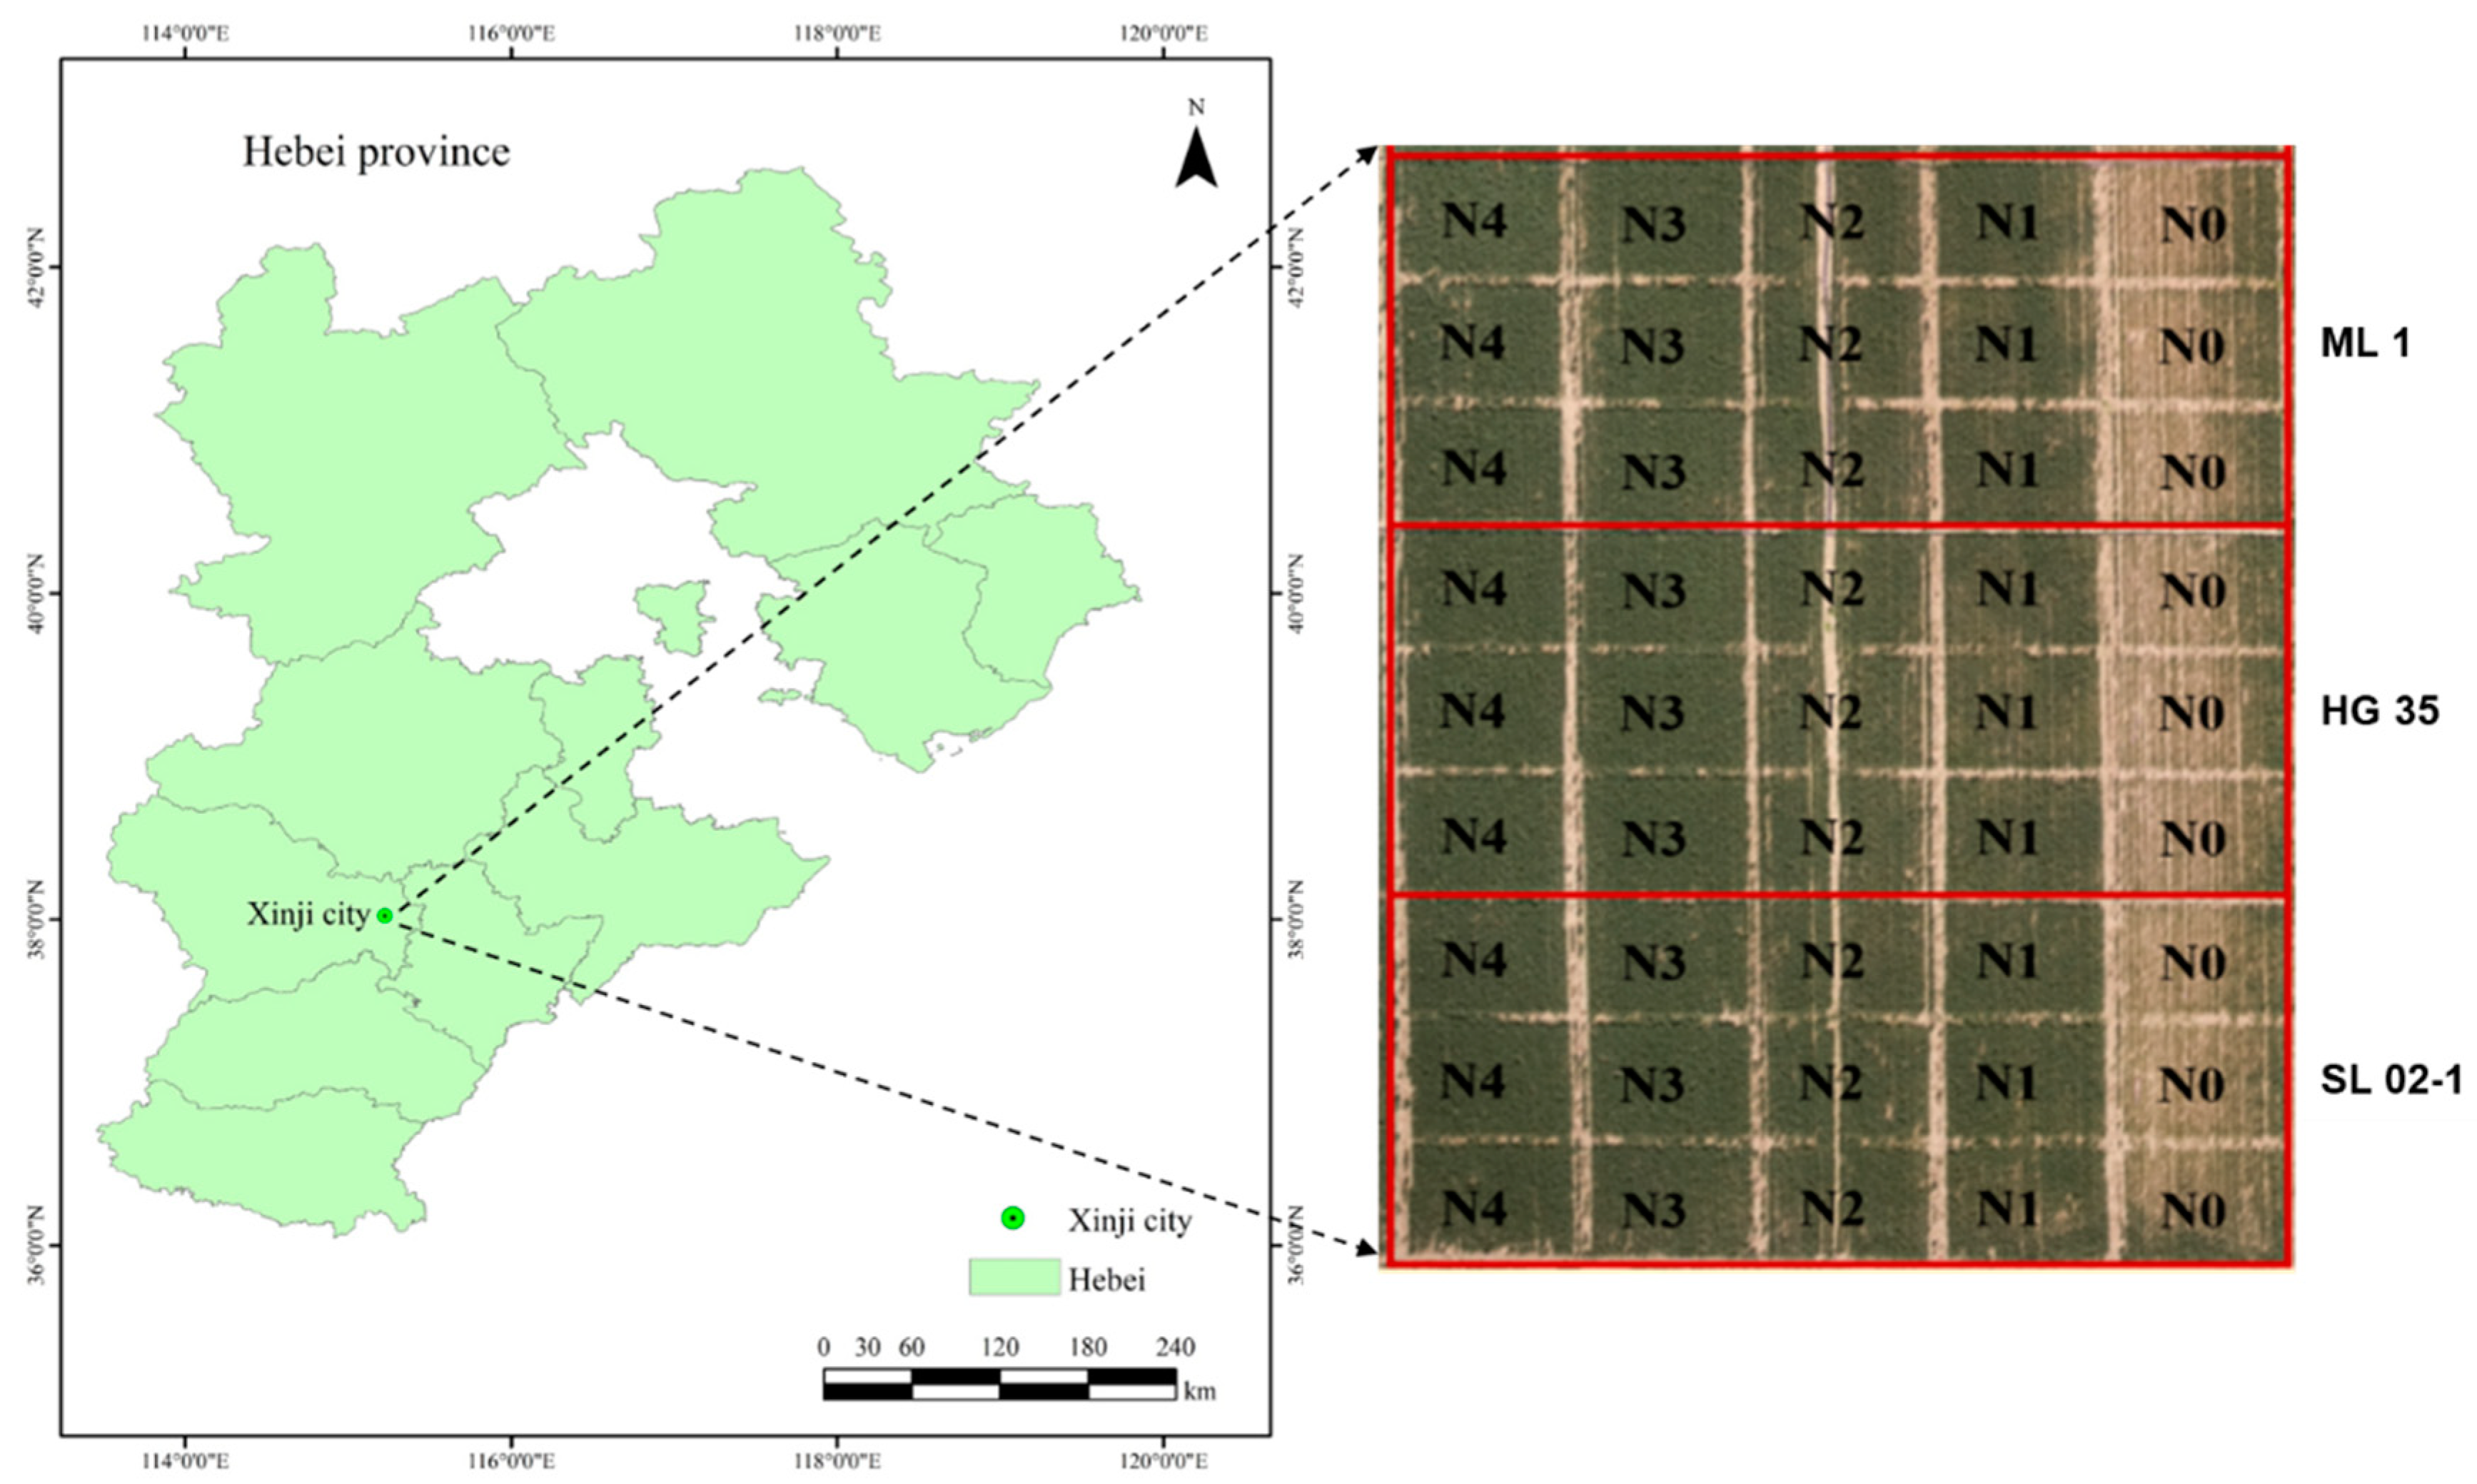
2.1. Study Area and Experimental Design

Field experiments were conducted during the 2022–2023 growing season of winter wheat in Xinji City, Hebei Province, China (33°24’ N, 114°44’ E). The experimental site has a warm temperate semi-humid monsoon continental climate characterized by four distinct seasons. The predominant soil type is tidal soil. The annual average temperature is 12.5 °C, while the annual average rainfall is 488.2 mm, with the majority occurring during summer months, specifically from June to August, which accounts for over 67.9% of the total annual precipitation. The primary crops cultivated in this area are wheat and corn.
The experimental design comprised three wheat varieties and five levels of nitrogen fertilizer application. The selected wheat varieties were Malan No. 1 (ML 1), Hengguan 35 (HG 35), and Shiluan 02-1 (SL 02-1). The nitrogen application levels were 0, 180, 240, 300, and 360 kg N hm−2, designated as N0, N1, N2, N3, and N4, respectively. Each treatment was replicated three times, resulting in a total of 45 experimental units. Nitrogen fertilizer was applied in equal quantities at multiple intervals. In addition, nitrogen, phosphorus, and potassium fertilizers were applied prior to sowing at a rate of 120 kg·ha−1. The seedling density for the field trial was 3.75 million plants per hectare. The geographical location and layout of the experimental units in the study area are illustrated in Figure 1.

2.2. Data Acquisition

We collected the field data at the jointing stage, booting stage, anthesis stage, and filling stage. The acquired data included the plant height, plant nitrogen content, and UAV multispectral imaging. A tape measure was employed to assess the heights of five uniformly growing wheat plants that represented the growth level of each plot. Subsequently, destructive sampling was conducted, and the samples were transported to the laboratory for drying, where the nitrogen content of the plants was analyzed. The dried wheat plants were crushed, and nitrogen content was determined using the Kjeldahl method. A total of 180 nitrogen samples were collected from wheat plants throughout the entire growth period.
Multispectral data from the UAV in the study area were acquired synchronously on the day of field sampling, utilizing a DJI Phantom 4 (SZ DJI Technology Co. Ltd., Shenzhen, China) multispectral drone. The drone was equipped with six 1/2.9-inch CMOS sensors with an effective pixel number of 2.08 million, including one visible-light sensor (RGB) for visible-light imaging and five single-band sensors (MS) for multispectral imaging, with multispectral bands of red, green, blue, near-red, and red edge, respectively. The central wavelengths were 450 nm, 560 nm, 650 nm, 730 nm, and 840 nm, respectively. The UAV multispectral data collection was conducted between 10:00 a.m. and 14:00, and the day was cloudless, and the wind was less than level 3. We set the course overlap of the drone flight to 80%, the side overlap to 80%, and the flight height to 30 m (1.6 cm/pix). Eight ground control points were set up using black and white tiles in field trials. Before UAV imaging, the ground control points (GCPs) were evenly arranged in the field using black and white tiles with a size of 30 cm in length and width. Intelligent RTK (CHCNAV-T8, Shanghai, China) was used to obtain the accurate geographical positions of each control point. Before the imaging process, a whiteboard was used for the radiometric calibration of the multispectral sensor. The UAV multispectral imaging system is equipped with a sunshine sensor, which can automatically calibrate the image according to the light condition. The duration of flight was about 10 min, and the sunlight was almost constant during the imaging process.

2.3. Feature Extraction of UAV Multispectral Images

The stitching of UAV multispectral images was conducted using Pix4Dmapper software v4.4.12 (Pix4D, Lausanne, Switzerland). The primary steps involved include the creation of a dense point cloud, the addition of control points, the establishment of mesh and texture, and the generation of both the digital elevation model (DEM) and the digital surface model (DSM). During the image-stitching process, a calibration plate was utilized to facilitate the radiometric calibration of the multispectral images. The features extracted from the UAV multispectral images comprised spectral reflectance, vegetation indices, texture, canopy coverage, and plant height. The principal technical workflow of this study is illustrated in Figure 2.

2.3.1. Spectral Bands and Vegetation Indices

In the ENVI 5.3 (ExelisVisual Information Solutions, Inc., Boulder, CO, USA) software, the random forest algorithm was employed to classify the UAV multispectral images, resulting in images that exclusively contained pixels corresponding to wheat plants. Subsequently, the reflectance data from five bands of the wheat plants were extracted, and a range of vegetation indices were calculated. Drawing on prior research, 13 vegetation indices were selected for estimating the nitrogen content of the wheat plants. The specific bands and vegetation index details are listed in Table 1.

2.3.2. Texture Information

In addition to spectral reflectance and vegetation indices, texture information from the images was selected as an independent variable for estimating the nitrogen content of wheat plants. First, the multispectral image was converted into an image. Subsequently, the texture information in each cell was calculated and extracted, which included the mean value (Mea), variance (Var), homogeneity (Hom), contrast (Con), dissimilarity (Dis), information entropy (Ent), second moment (Sec), and correlation (Cor). The size of the sliding window was set to 5 × 5 pixels.

2.3.3. Canopy Structure Parameters

The terrain of the study area is characterized by a flat topography, and the DSM obtained via UAV is effective in reflecting the variations in wheat plant height. The DSM for the experimental area encompasses not only the vegetation but also the underlying soil, with each pixel value representing the elevation of the corresponding point. The pixel percentiles of the DSM images indicate varying positions within the canopy, where lower percentiles correspond to ground level and higher percentiles denote the upper boundary of the plant canopy. Percentile refers to the value associated with the cumulative distribution of the data. In this context, the 99th percentile of DSM pixel values is designated as the upper boundary of the wheat plants, while the 2nd percentile is regarded as ground level. Consequently, the height of wheat plants can be calculated using the DSM values acquired during the study period [46].
Canopy coverage refers to the percentage of the total area represented by the vertical projection of vegetation onto the ground [47]. Wheat plant pixels were extracted from UAV multispectral images by a classification method, and the proportion of wheat plant pixels in each plot to the whole plot was calculated.

2.4. Modeling Method

The spectral reflectance, vegetation indices, texture, plant height, and canopy coverage extracted from UAV images were utilized as independent variables for estimating the nitrogen content of wheat plants throughout the growth period. The ratio of training to test set samples was established at 2:1. Four evaluation metrics—coefficient of determination (R2), root mean square error (RMSE), mean absolute error (MAE), and mean absolute percentage error (MAPE)—were employed to assess the performance of the various models.
Five widely used algorithms were selected for estimating the nitrogen content in wheat plants: partial least squares (PLS), support vector machine (SVM), random forest (RF), neural network regression (NNet), and Gaussian process regression (GPR).
Partial least squares regression (PLSR) is a statistical technique adept at addressing multiple regression challenges, particularly when the number of independent variables exceeds the number of samples or when multicollinearity is present among the independent variables [48]. PLSR integrates the strengths of principal component analysis (PCA) and least squares regression to effectively distill the essential information from the dataset.
Random forest regression (RFR) is a method based on the random forest algorithm, which is an ensemble learning technique. This approach constructs multiple decision tree models and integrates them to mitigate the overfitting risk associated with any single model while enhancing predictive performance [49]. Each decision tree is trained on a random subset of the original data, known as a bootstrap sample, and is split using a random subset of features.
Support vector machine regression (SVR) is another regression approach grounded in support vector machines [50]. Compared to traditional linear regression and other regression techniques, SVR exhibits superior flexibility and robustness, enabling it to handle high-dimensional data and model nonlinear relationships effectively. By selecting different kernel functions, SVR can adapt to various data distributions and demonstrates a degree of resilience to outliers.
Gaussian process regression (GPR) employs a non-parametric methodology that utilizes Gaussian processes for data modeling and prediction. In GPR, it is assumed that the distribution of the target variable adheres to a multivariate Gaussian distribution. The probability distribution of the target variable can be inferred by modeling the training data and facilitating predictions for new data points [51]. Consequently, GPR partly alleviates the “black box” issue frequently encountered in machine learning regression methods. In recent years, GPR has seen considerable success in vegetation feature retrieval.
The neural network regression model (NNet) adeptly addresses complex nonlinear relationships, resulting in improved data fitting [52]. This methodology also boasts high computational efficiency, enabling the completion of training and prediction processes in a relatively short time frame. However, neural network regression is not devoid of limitations; it is sensitive to noisy data and involves intricate parameter tuning. In this study, a neural network regression model was developed using the multinom function from the NNet package, which automatically fine-tunes parameters based on the training data to optimize model performance.

3. Results

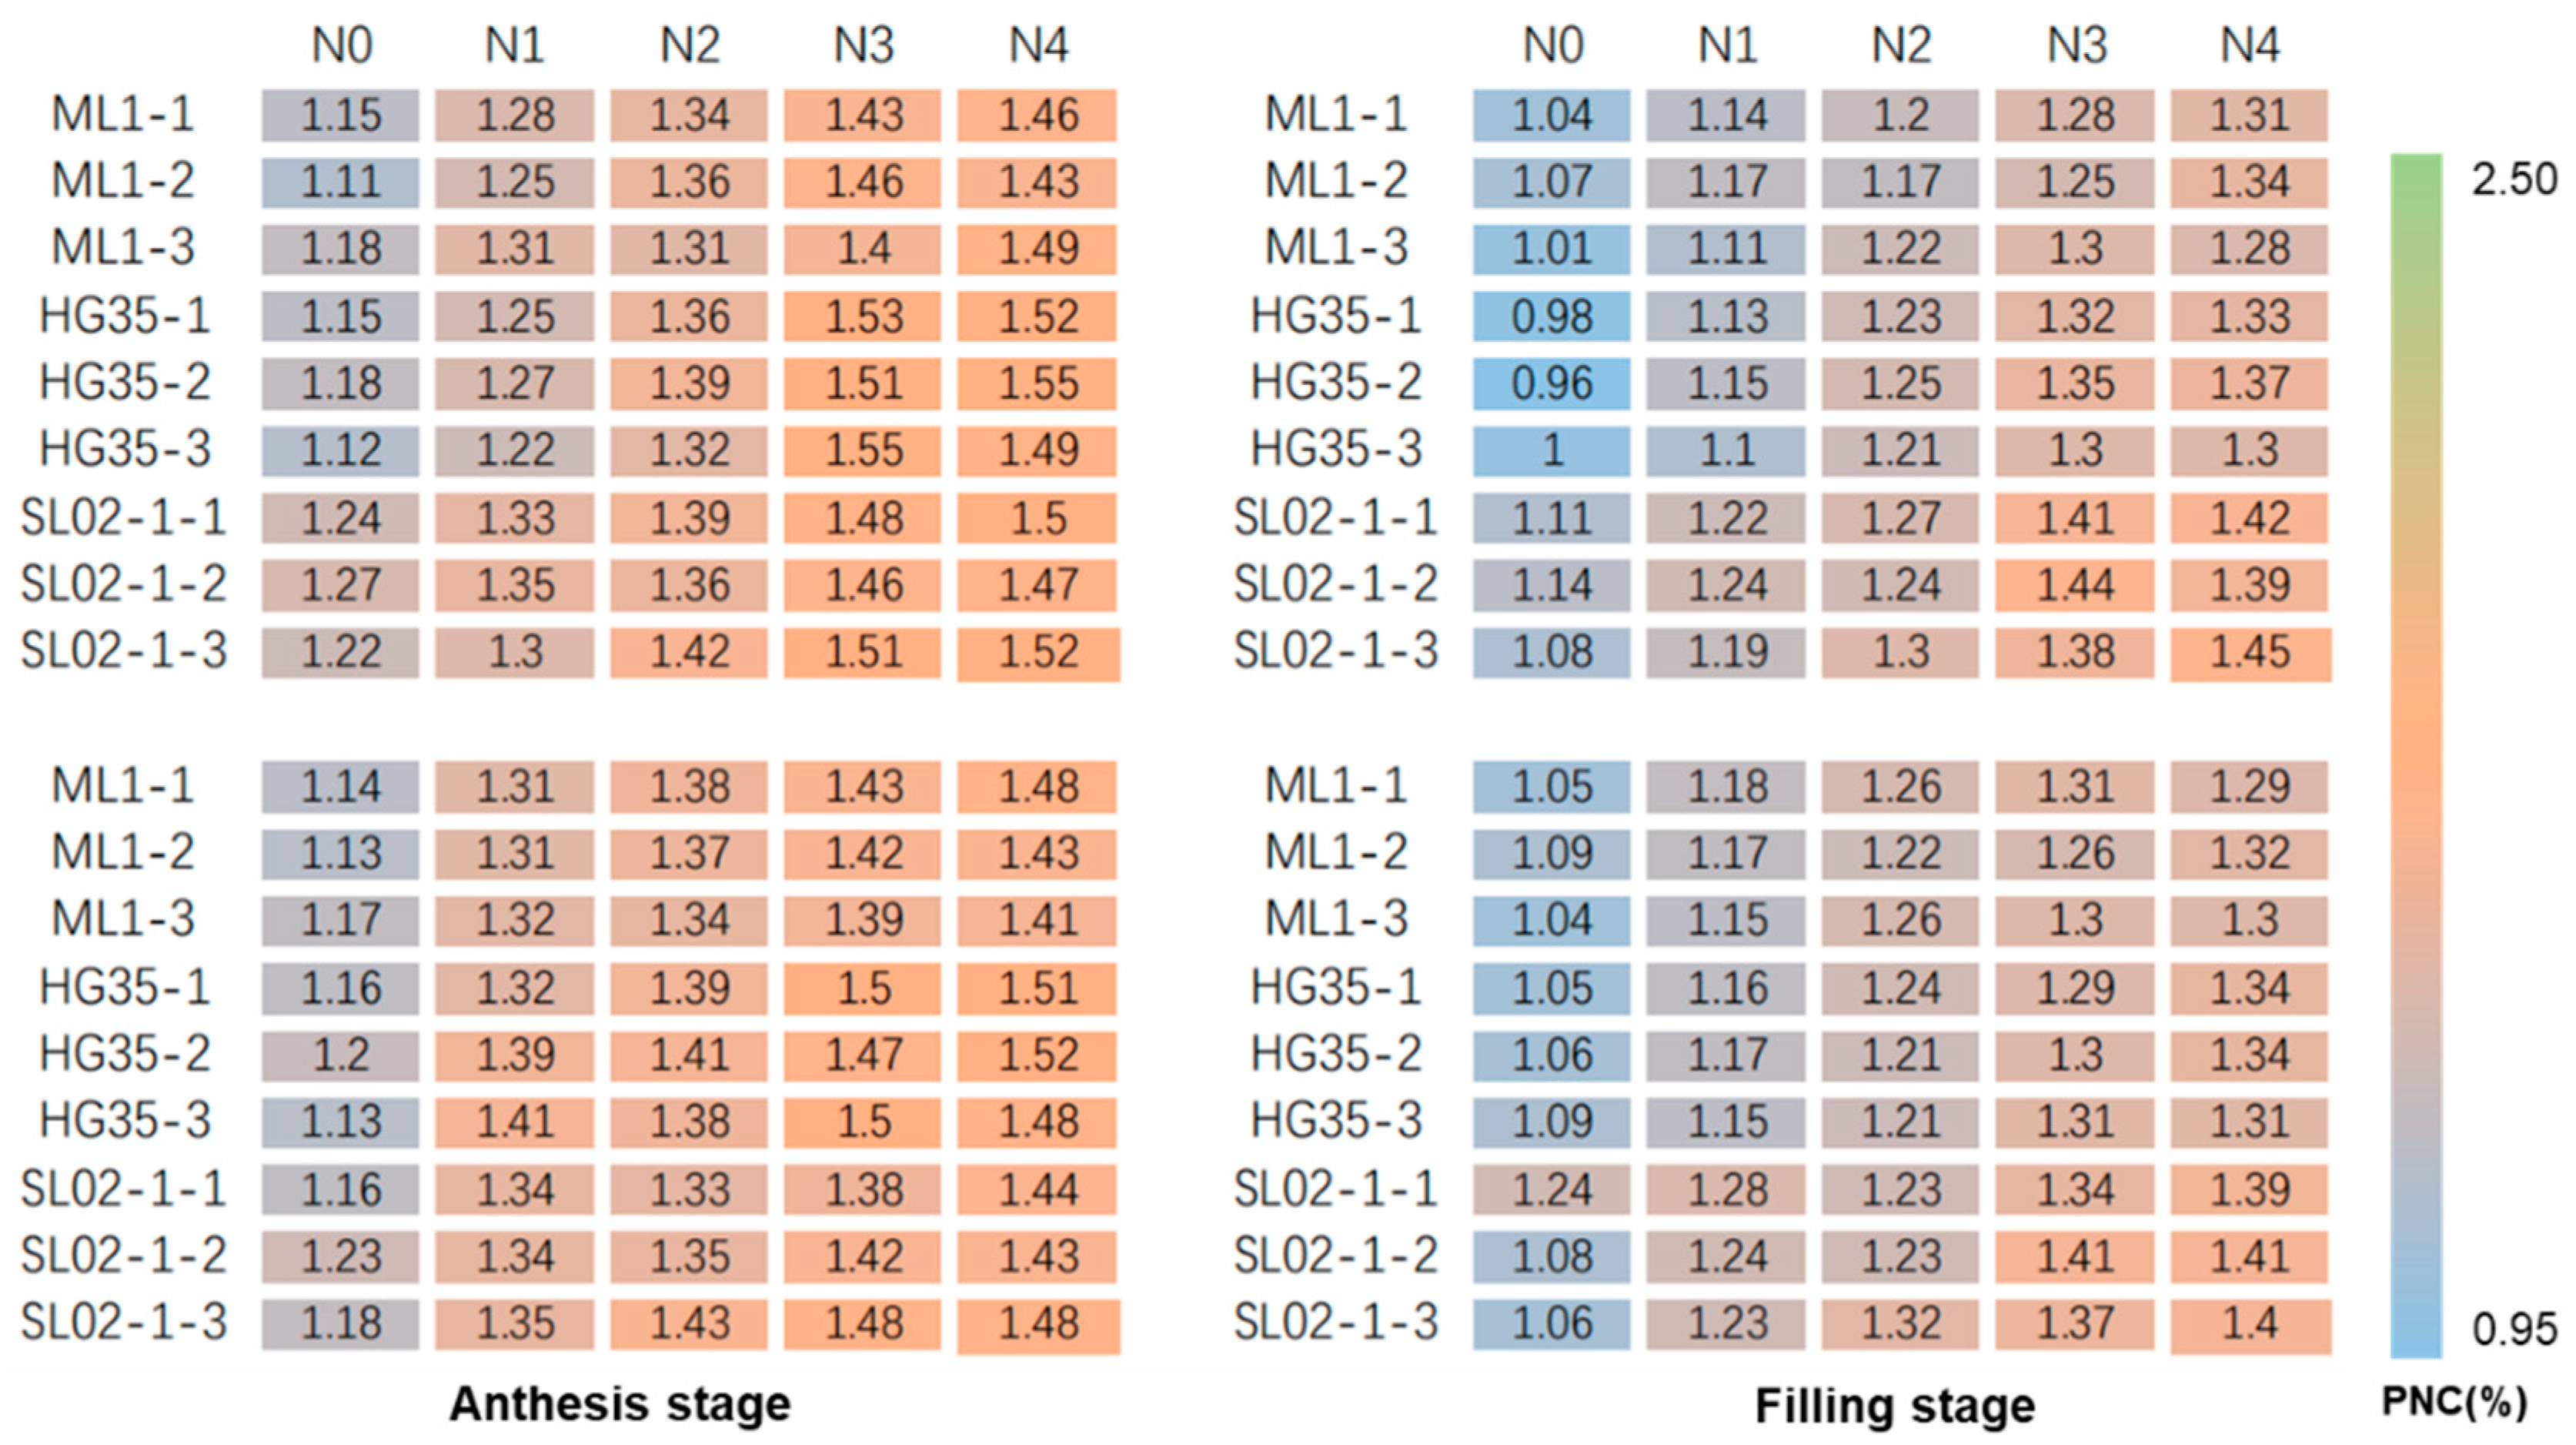
3.1. PNC under Different Growth Stages, Nitrogen Fertilizers, and Varieties

Figure 3 illustrates the nitrogen content of wheat plants across various nitrogen application levels and growth stages. It is evident that an increase in nitrogen application corresponds with a rise in the nitrogen content of the wheat plants, which is unaffected by the growth stage or wheat variety. With the development of the growth stage, the PNC of HG35 and ML1 first increases and then decreases, reaching the maximum at the booting stage. The PNC of SL02-1 shows a continuous decline. With the increase in nitrogen supply, the PNC of all varieties shows an increasing trend, but the amplitudes of the increases are different. During both the early and later stages of growth, specifically at the jointing and filling stages, the nitrogen content of SL02-1 wheat was the highest across the different nitrogen application levels. At the booting stage, the nitrogen content of HG 35 wheat surpassed that of the ML 1 and SL02-1 varieties. Furthermore, at the flowering stage, as nitrogen application rates increased, the growth rate of nitrogen content in HG 35 wheat outpaced those of ML 1 and SL02-1.
The nitrogen content data from 180 wheat plants were subjected to statistical analysis, revealing a range of values from 0.96% to 2.266%, with an average of 1.46% and a coefficient of variation of 490.57. According to the maximum, minimum, and coefficient of variation values of the samples, significant differences in the PNC of winter wheat were observed. Similarly, statistical analyses were performed on samples from the three wheat varieties throughout the entire growth period, as well as on all samples within individual growth periods, indicating that the nitrogen content varied significantly across each sample set. Table 2 presents a summary of the statistical information concerning the nitrogen content of different wheat plant samples.

3.2. Correlation Analysis between Features and PNC

We analyzed the Pearson correlation coefficients between spectral reflectance, vegetation indices, texture, canopy structure parameters, and the nitrogen content of wheat plants (Table 3). Overall, irrespective of whether the entire growth period or specific growth stages were considered, the correlation between spectral and vegetation indices and the nitrogen content of wheat plants was robust and unaffected by wheat varieties. In comparison to individual growth stages, the overall single-band spectral reflectance (such as red, green, blue, and red edge) exhibited a stronger correlation with the nitrogen content of wheat plants across multiple growth stages. Notably, among the selected vegetation indices, NDVI, GNDVI, RVI, GBNDVI, and EXG demonstrated a greater correlation with nitrogen content in wheat plants. Within the dataset for individual growth stages, most vegetation indices were found to have a strong correlation with nitrogen content in wheat, except for EXG, which showed no correlation with nitrogen content during the booting and filling periods.

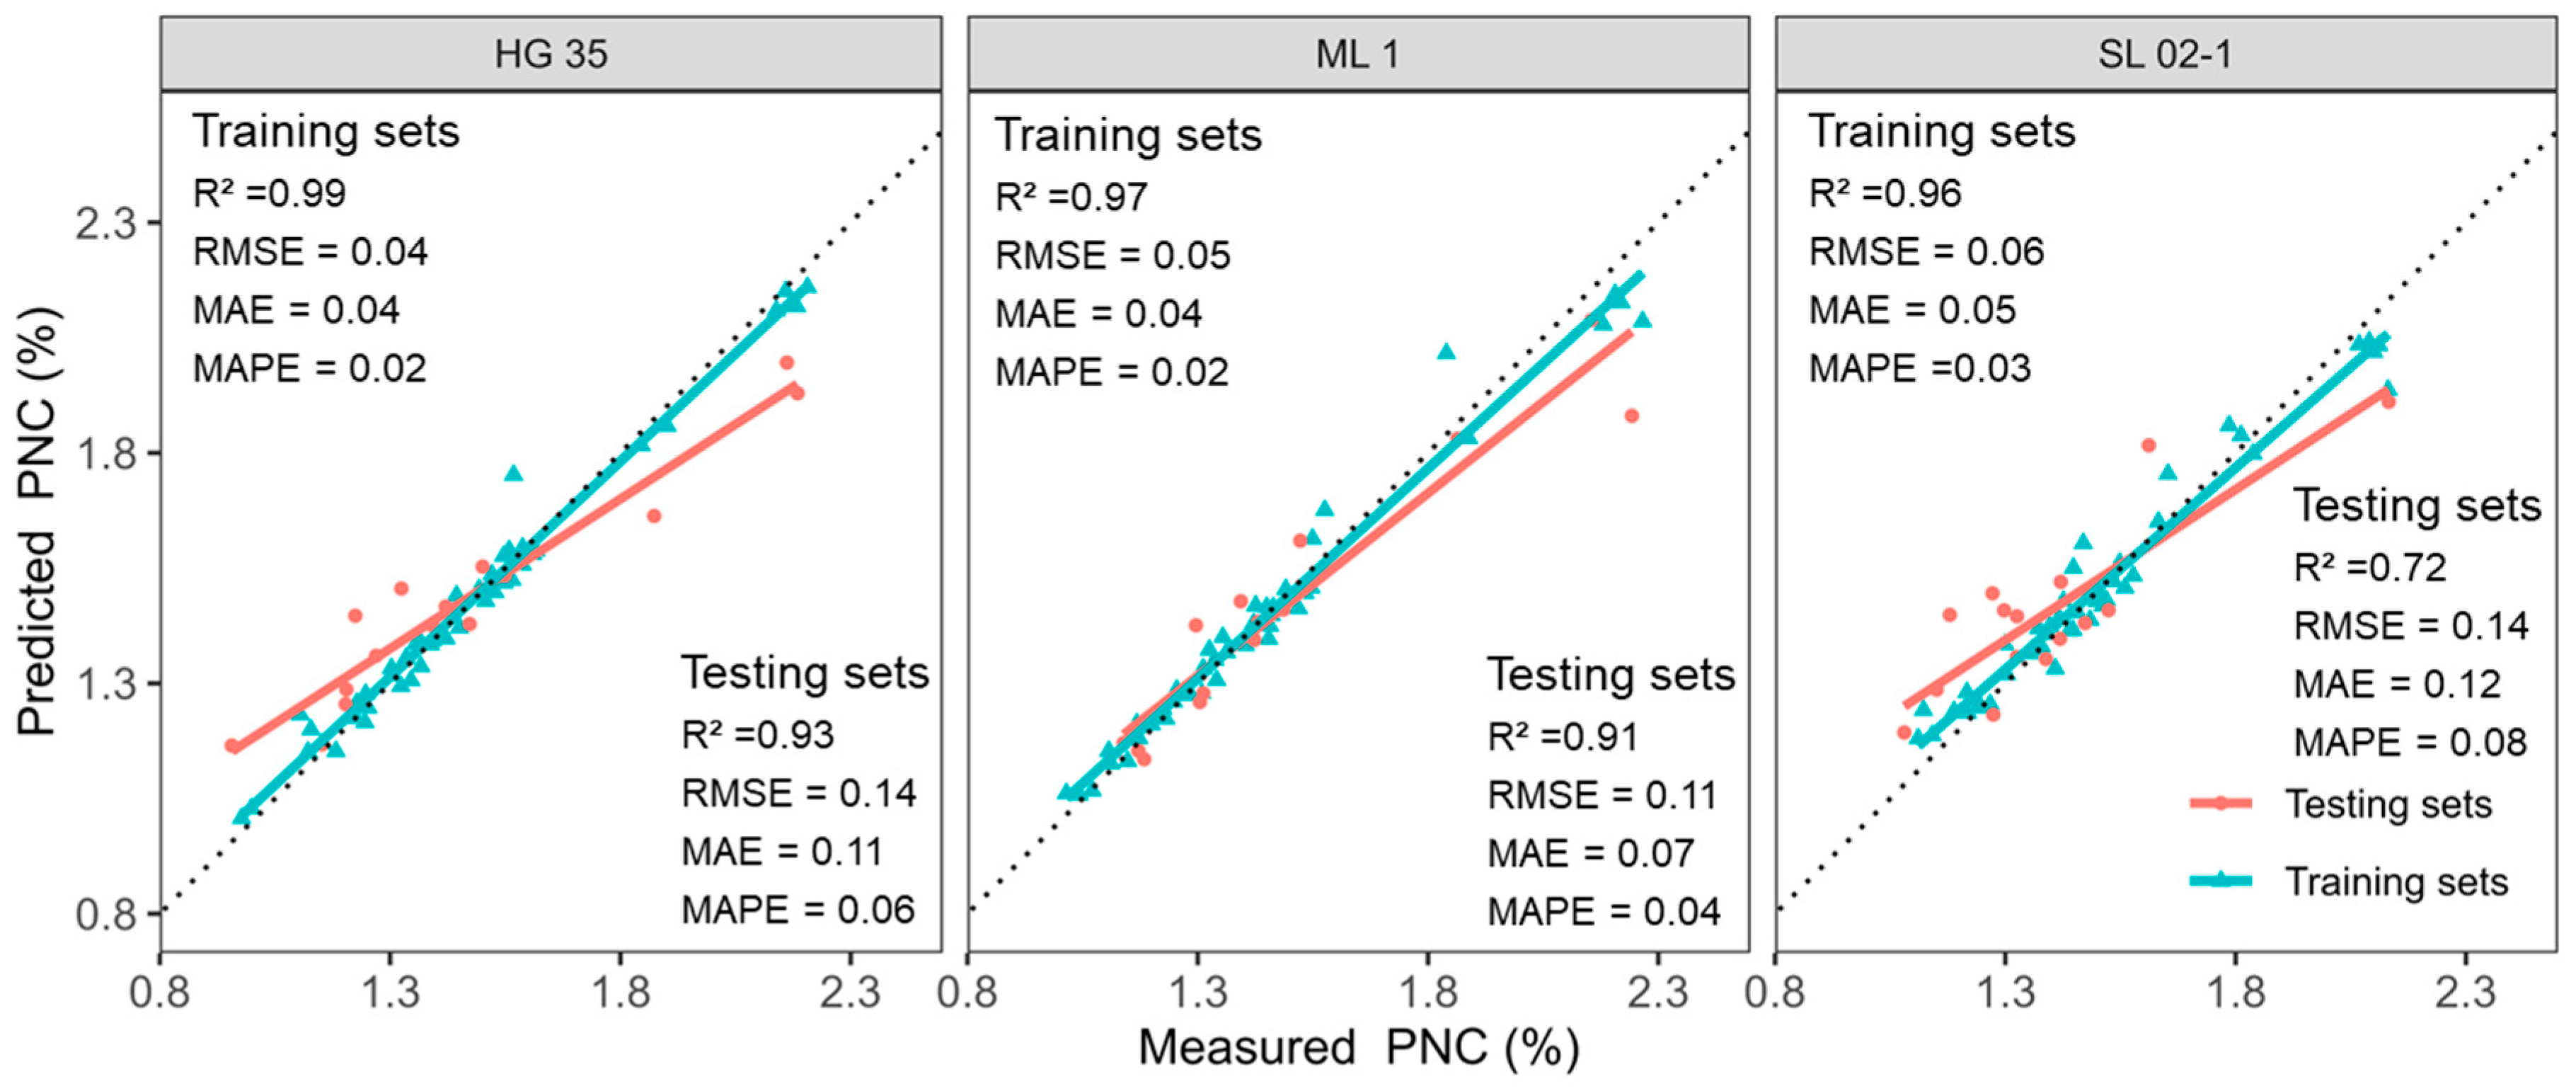
3.3. Estimation of PNC of Multiple Varieties in Single Stage

Table 4 presents the estimation results of five regression models for the nitrogen content of wheat plants at a single growth stage. According to the results from the training set, the NNet regression model yielded the most accurate estimates across all periods. However, its performance on the test set was the least effective among the five models evaluated. Overall, the NNet regression model demonstrated significant overfitting, showing better results on the training set and poorer performance on the test set. The results from the PLSR model exhibited relatively stable performance on both the training and test sets; nevertheless, the overall accuracy remained low. Among the remaining three methods—GPR, SVR, and RFR—performance on the test set ranked as follows: GPR exhibited the highest efficacy, followed by SVR and RFR in descending order. During the jointing and anthesis periods, the estimated R2 of the GPR regression model reached 0.8 on the test set. Conversely, during the booting and filling periods, the estimated R2 for the test set of the model was 0.66 and 0.67. Among the five algorithms, GPR performed the best when modeling PNC at a single growth stage. GPR requires that the target variables adhere to the multivariate Gaussian distribution. Different wheat varieties have different nitrogen absorption abilities, resulting in a higher CV of PNC at a single growth stage than across multiple growth stages (Table 2). The PNC at a single stage is more in line with the multivariate Gaussian distribution, resulting in the best effect of GPR for PNC estimation being obtained at a single growth stage. There were some differences in nitrogen estimation for wheat plants at different growth stages. The accuracy of plant nitrogen estimation, from high to low, for different growth stages was jointing, anthesis, filling, and booting. Figure 4 shows the optimal estimation of the PNC of winter wheat with multiple varieties in a single growth stage.

3.4. Nitrogen Estimation of Single Wheat Variety in Multiple Growth Periods

Table 5 presents the estimated nitrogen content of three wheat varieties across multiple growth periods. A significant discrepancy exists between the accuracy of the training set and the test set derived from the NNet regression model. Among the various models utilized, PLSR exhibited the lowest accuracy for the training set constructed from the three wheat varieties. In contrast, the performance of the other three methods—GPR, SVR, and RFR—ranked as follows based on the test set results: RFR, GPR, and SVR, in descending order of effectiveness. Specifically, for the nitrogen content of wheat plants in ML 1, the test set metrics for RFR yielded an R2 of 0.91, RMSE of 0.11%, MAE of 0.07, and a MAPE of 0.04%. For HG-35 wheat plants, the test set results were R2 = 0.93, RMSE = 0.14%, MAE = 0.11, and MAPE = 0.06%. In the case of SL02-1 wheat plants, the R2, RMSE, MAE, and MAPE were 0.72, 0.14%, 0.12, and 0.08%, respectively. Overall, different wheat varieties achieved high precision in estimating nitrogen content. However, the estimation accuracy for the SL02-1 variety was notably poor, which may be attributed to its relatively low sensitivity to nitrogen. Figure 5 illustrates these findings.

3.5. PNC Estimation of Multiple Varieties during the Entire Growth Period

Firstly, the effect of estimating nitrogen content in wheat plants with all samples from four growth periods put together was analyzed (Table 6). Table 6 shows the estimation results of the five regression methods for nitrogen content in wheat plants constructed using all the extracted features. Regardless of whether the training set or the test set was used, the performance of the constructed model was RFR, NNETR, SVR, GPR, and PLSR, in order from high to low, with RFR performing best and PLSR performing worst. All four machine learning methods achieve better estimation results than PLSR. With the test set, R2 obtained by GPR and RFR is 23.44% and 40.63% higher than that obtained by PLSR, respectively. The optimal estimation results of nitrogen content in wheat plants across multiple growth periods and varieties showed training set R2, RMSE, MAE, and MAPE values of 0.97, 0.05%, 0.04, and 0.02%, respectively, and test set R2, RMSE, MAE, and MAPE values of 0.90, 0.10%, 0.08, and 0.06%. For the modeling of multiple growth stages, RFR performed best. RFR has a strong fitting ability when the data size is large. As can be seen from Table 2, the sample size of multiple growth stages is large, and the CV is much lower than that of a single growth stage. Therefore, compared with the other four algorithms, RFR is more suitable for constructing a model to estimate PNC across multiple growth stages. Figure 6 shows the estimated nitrogen content and measured values of wheat plants at each growth stage based on RFR.

4. Discussion

4.1. Correlation of Features Extracted from UAV Images for Estimating Wheat PNC

In previous studies, the main features used to estimate PNC were the spectrum, vegetation indices, and texture. Considering that canopy structure parameters are also closely related to PNC, we introduced two canopy structure parameters, plant height and canopy coverage, to form new feature sets. Our findings showed that spectral information had the best correlation with wheat PNC, while texture and structure information had weak correlations with wheat PNC. Previous studies have shown that the color and brightness information obtained from UAV digital images can be used to estimate crop nitrogen content [33,53]. We found that the absolute value of the correlation coefficient between the three RGB bands and nitrogen content in wheat plants was 0.56 to 0.83. Nitrogen content is a key component of crop chlorophyll, and chlorophyll absorption and reflection are clearly characterized at specific bands, such as 650 nm for red light and 450 nm for blue–violet light [54,55]. Therefore, the spectral information of these bands can directly reflect the nitrogen status of plants.
Vegetation indices performed well in monitoring crop growth and nutritional status. These indices are usually closely related to the above-ground biomass, leaf area index, and chlorophyll content of crops. Determining the relationship between crop nitrogen content and a vegetation index is the basis for the accurate estimation of crop nitrogen status. In this study, 13 vegetation indices were calculated based on multispectral bands to estimate the PNC of winter wheat. Our findings showed that most of the selected vegetation indices were significantly correlated with the nitrogen content of wheat plants. Previous studies have also shown that a vegetation index constructed based on red-edge parameters can accurately estimate crop chlorophyll and nitrogen content [35,56]. Basso et al. [57] found that the red-edge region was closely related to the nitrogen and chlorophyll contents of crops, and the red-edge parameter had a relatively stable mathematical relationship with agronomic components. Our study found that the red-edge band does not perform well compared to the red, green, and blue bands, especially in the booting and filling stages. The correlation between the CARI calculated using the red-edge band and PNC in all samples of multiple varieties or a single variety is worse than that with other indices, such as NDVI, GNDVI, RVI, GBNDVI, and EXG. But, the CARI performed well at the single growth stage. There was a good correlation between plant nitrogen and the CARI in a single growth stage, indicating that fertilizer application had a significant effect on plant nitrogen. The poor correlation between PNC and the CARI in integrated multi-growth stages indicates that PNC is confused in different growth stages. In addition, different varieties had different nitrogen absorption efficiencies, which also reduced the correlation between the CARI and PNC. It is worth noting that, in this study, the vegetation indices calculated from the spectral data of the blue and green regions also had high correlations with the nitrogen content of wheat plants.
At present, most studies estimate crop nitrogen content based on the spectrum and vegetation indices [58,59]. In this study, in addition to the spectrum and vegetation indices, the correlations between texture and canopy structure information (canopy coverage and plant height) and wheat PNC were also analyzed. Our findings showed that most texture information is less correlated with wheat PNC, while some texture parameters, such as mean and entropy, are significantly correlated with the nitrogen content of wheat plants. Canopy coverage and plant height were also significantly correlated with wheat PNC, and the estimated correlation between plant height and PNC in the first two growth stages was especially high because the growth of wheat was more prosperous when the nitrogen status was better, which directly reflected the plant height and plant coverage. In this study, canopy structure and texture information were used to supplement the spectrum and vegetation indices, which effectively realized the high-precision estimation of wheat PNC.

4.2. Effects of the Variety and Growth Stage on Estimating Wheat PNC

The samples in this study cover different nitrogen fertilizer treatments and wheat varieties. The dataset of four growth stages of wheat was obtained to estimate wheat PNC at each growth stage. For wheat samples of the single growth stage, from the five regression methods, it can be seen that the jointing and anthesis stages performed better, and the test set R2 is around 0.8. The test set R2 for the optimal estimation of nitrogen content in wheat plants in the booting and filling stages was 0.66. This could be due to the jointing stage being on the 4th day after the first nitrogen application and the anthesis stage being on the 5th day after the second nitrogen application. Different nitrogen fertilizer supplies directly reflect the wheat PNC. The results of this study showed that no matter which modeling method was used, the estimation effect of wheat PNC in multiple growth stages was better than that in a single growth stage.
For wheat varieties, the estimation accuracy of the wheat PNC of ML1 and HG35 is similar, and the test set R2 reached more than 0.9. The accuracy of the test set was 0.72 when estimating the PNC of SL02-1. On the whole, there was a significant positive correlation between the PNC and nitrogen application rate of each wheat variety. The correlation between the PNC and nitrogen application rate of HG 35 was the best, indicating that the nitrogen absorption capacity of this wheat variety was better than that of the other two varieties.

4.3. Comparison of Modeling Algorithms

In recent years, machine learning algorithms have shown great practicability in integrating multi-source information to diagnose crop growth and nitrogen status [28,60]. Considering the advantages of the large number of available machine learning algorithms, we tested five algorithms (NNETR, PLSR, GPR, RFR, and SVR) to explore their performance in the estimation of the PNC of winter wheat. Our findings showed that GPR was the best among the five models for estimating wheat PNC at a single growth stage. This indicated that the GPR method had a better application effect on small sample datasets. This was because Gaussian process regression can be used to fit nonlinear data and is a powerful regression method, which has corresponding advantages in dealing with complex data and small sample datasets [33]. We found that the NNETR model was one of the worst-performing algorithms for estimating wheat PNC at a single growth stage. This may be because the sample size of a single growth stage is only 45, which is relatively small, resulting in the poor stability of the model. Neural network regression usually requires a large amount of training data to obtain good performance [52]. If the dataset is insufficient or the training data are not representative, the accuracy of the model will be restrained. The performance of PLSR is weak compared to the RFR, SVR, and GPR models. On the whole, the RFR, SVR, and GPR models outperformed the other two models on the dataset in this study.
For the dataset of multiple growth periods, RFR and SVR performed better than the others. Most of the test set accuracy R2 values of the SVR and RFR construction models were 0.85 or above. The test set R2 of the single-growth-stage dataset was also as high as 0.79. In many studies, RFR has yielded high precision in the growth monitoring and N status diagnosis of various crops (including maize, wheat, and sugarcane) [28,34,61].

4.4. Limitations and Future Research

There are some limitations in the study. Firstly, we compared the accuracy of five machine learning algorithms in PNC estimation. But, deep learning has shown a better effect in the estimation of crop traits in recent years. It is necessary to try using deep learning algorithms to estimate the PNC of crops in the subsequent research. Secondly, only three varieties of winter wheat were used in the study. We will increase the number of wheat varieties in future experiments to verify the robustness of the proposed method of estimating PNC. Finally, we only used a dataset from one experimental site. It is necessary to conduct experiments at multiple sites in the future to improve the universality of the proposed method.
The practical application of UAV technology for estimating the nitrogen content of winter wheat plants includes the following steps. Firstly, UAV multispectral images are obtained at each growth stage. Secondly, vegetation indices and texture and canopy structure parameters are calculated. Thirdly, the feature images are input into the optimal model selected in this study for estimating PNC. Fourthly, the spatial distribution of winter wheat PNC is mapped according to the estimation results. In future studies, we will continue to conduct variable irrigation and fertilizer experiments with more varieties to obtain more growth stage data. We will further reveal the effects of the variety and growth stage on the estimation of winter wheat PNC using UAV-based multispectral images.

5. Conclusions

The main contribution of this work is that we employed UAV multispectral images to estimate the nitrogen content of various wheat cultivars at different growth stages using spectral reflectance, vegetation indices, and texture and canopy structure parameters with five regression methods. The following conclusions were drawn: (1) The correlation between spectral and vegetation indices and wheat PNC was robust. The correlations between texture and structural information and the nitrogen content of wheat plants were weak, and only some texture and structural parameters were significantly correlated with wheat PNC. (2) The accuracy of nitrogen content estimation for wheat plants across the multiple growth stages exceeded that in a single growth stage. (3) The wheat variety had an influence on PNC estimation. Compared with HG 35 and ML 1, the estimation accuracy for the SL02-1 variety was notably poor. (4) Among the models, RFR and SVR exhibited the highest overall accuracy on multiple-growth-period datasets, while GPR yielded the best results for a single growth stage.
According to our findings, the following three aspects can be improved in the practical application and future directions of UAV-based PNC estimation. Firstly, it is necessary to add canopy structure information to the feature set, such as the spectrum, vegetation indices, and texture. Secondly, facing the PNC estimation of multiple varieties, it is necessary to construct a model with a single variety. Thirdly, collaborative modeling of data from multiple growth stages helps to improve accuracy. We can obtain UAV multispectral images before topdressing fertilizer, quickly estimate PNC, and then calculate the nitrogen application rate for each management unit. Therefore, it is feasible to use UAV multispectral imaging technology to manage nitrogen fertilizer in real time.

Author Contributions

Conceptualization, M.S., H.Q. and L.W.; methodology, M.S. and W.G.; software, M.S. and H.Q.; validation, M.S. and Z.W.; formal analysis, M.S.; investigation, M.S., Z.W. and Y.F.; resources, Y.G. and L.W.; data curation, M.S. and Z.W.; writing—original draft preparation, M.S.; writing—review and editing, M.S.; visualization, Z.W.; supervision, X.G., Y.M. and L.W.; project administration, M.S.; funding acquisition, M.S. and Y.G. All authors have read and agreed to the published version of the manuscript.

Funding

This research was funded by the open subject of the Key Laboratory of Smart Agricultural Technology of HuangHuaihai, Ministry of Agriculture and Rural Affairs, in 2024 (No. 202409); the Henan Province Science and Technology Research Project (242102110357); the Henan Province Key R&D and Promotion Projects (No. 232102111030); the Science and Technology Innovation Leading Talent Cultivation Program of the Institute of Agricultural Information Technology, Henan Academy of Agricultural Sciences (No. 2022KJCX01); and the National Funded Postdoctoral Researcher Program Class C (No. GZC202307).

Institutional Review Board Statement

Not applicable.

Data Availability Statement

The data presented in this study are available on request from the corresponding author due to the need for follow-up studies.

Conflicts of Interest

The authors declare no conflicts of interest.

References

  1. Karabak, S.; Kan, M. Wheat Landraces; Springer International Publishing: Cham, Switzerland, 2021; pp. 121–146. [Google Scholar]
  2. Tian, Z.; Zhang, Y.; Zhang, H.; Li, Z.; Li, M.; Wu, J.; Liu, K. Winter wheat and soil total nitrogen integrated monitoring based on canopy hyperspectral feature selection and fusion. Comput. Electron. Agric. 2021, 201, 107285. [Google Scholar] [CrossRef]
  3. Liu, Z.; Gao, J.; Zhao, S.; Sha, Y.; Huang, Y.; Hao, Z.; Ke, L.; Chen, F.; Yuan, L.; Mi, G. Nitrogen responsiveness of leaf growth, radiation use efficiency and grain yield of maize (Zea mays L.) in Northeast China. Field Crops Res. 2023, 291, 108806. [Google Scholar] [CrossRef]
  4. Kong, L.; Xie, Y.; Hu, L.; Feng, B.; Li, S. Remobilization of vegetative nitrogen to developing grain in wheat (Triticum aestivum L.). Field Crop. Res. 2016, 196, 134–144. [Google Scholar] [CrossRef]
  5. Calderon, R.; Rajendiran, K.; Kim, U.J.; Palma, P.; Arancibia-Miranda, N.; Silva-Moreno, E.; Corradini, F. Sources and fates of perchlorate in soils in Chile: A case study of perchlorate dynamics in soil-crop systems using lettuce (Lactuca sativa) fields. Environ. Pollut. 2020, 264, 7. [Google Scholar] [CrossRef] [PubMed]
  6. Shu, M.; Zhu, J.; Yang, X.; Gu, X.; Li, B.; Ma, Y. A spectral decomposition method for estimating the leaf nitrogen status of maize by UAV-based hyperspectral imaging. Comput. Electron. Agric. 2023, 212, 108100. [Google Scholar]
  7. Feng, W.; Guo, B.; Wang, Z.; He, L.; Song, X.; Wang, Y.; Guo, T. Measuring leaf nitrogen concentration in winter wheat using double-peak spectral reflection remote sensing data. Field Crops Res. 2014, 159, 43–52. [Google Scholar] [CrossRef]
  8. Wen, P.; Shi, Z.; Li, A.; Ning, F.; Zhang, Y.; Wang, R.; Li, J. Estimation of the vertically integrated leaf nitrogen content in maize using canopy hyperspectral red edge parameters. Precis. Agric. 2021, 22, 984–1005. [Google Scholar] [CrossRef]
  9. Lee, Y.; Yang, C.; Chang, K.; Shen, Y. A simple spectral index using reflectance of 735 nm to assess nitrogen status of rice canopy. Agron. J. 2008, 100, 205–212. [Google Scholar] [CrossRef]
  10. Cao, Q.; Miao, Y.; Wang, H.; Huang, S.; Cheng, S.; Khosla, R.; Jiang, R. Non-destructive estimation of rice plant nitrogen status with Crop Circle multispectral active canopy sensor. Field Crops Res. 2013, 154, 133–144. [Google Scholar] [CrossRef]
  11. Zhang, N.; Qi, B.; Zhao, J.; Zhang, X.; Wang, S.; Zhao, T.; Gai, J. Prediction for Soybean Grain Yield Using Active Sensor GreenSeeker. Acta Agron. Sin. 2014, 40, 657–666. [Google Scholar] [CrossRef]
  12. Yuan, J.; Li, X.; Zhou, M.; Zheng, H.; Liu, Z.; Liu, Y.; Yao, X. Rapidly count crop seedling emergence based on waveform Method (WM) using drone imagery at the early stage. Comput. Electron. Agric. 2024, 220, 108867. [Google Scholar] [CrossRef]
  13. Yue, J.; Tian, J.; Philpot, W.; Tian, Q.; Feng, H.; Fu, Y. VNAI-NDVI-Space and Polar Coordinate Method for Assessing Crop Leaf Chlorophyll Content and Fractional Cover. Comput. Electron. Agric. 2023, 207, 107758. [Google Scholar] [CrossRef]
  14. Yue, J.; Feng, H.; Tian, Q.; Zhou, C. A Robust Spectral Angle Index for Remotely Assessing Soybean Canopy Chlorophyll Content in Different Growing Stages. Plant Methods 2020, 16, 104. [Google Scholar] [CrossRef] [PubMed]
  15. Vélez, S.; Ariza-Sentís, M.; Valente, J. Mapping the spatial variability of Botrytis bunch rot risk in vineyards using UAV multispectral imagery. Eur. J. Agron. 2022, 142, 126691. [Google Scholar] [CrossRef]
  16. Fajardo, J.U.; Maridueña-Zavala, M.; Cevallos-Cevallos, J.; Donoso, D.O. Early Detection of Plant Viral Disease Using Hyperspectral Imaging and Deep Learning. Plants-Basel 2022, 11, 2581. [Google Scholar]
  17. Walsh, O.; Marshall, J.; Nambi, E.; Jackson, C.; Ansah, E.; Lamichhane, R. Wheat Yield and Protein Estimation with Handheld and Unmanned Aerial Vehicle-Mounted Sensors. Agronomy 2023, 13, 207. [Google Scholar] [CrossRef]
  18. Zhang, J.; Cheng, T.; Shi, L.; Wang, W.; Niu, Z.; Guo, W.; Ma, X. Combining spectral and texture features of UAV hyperspectral images for leaf nitrogen content monitoring in winter wheat. Int. J. Remote Sens. 2022, 43, 2335–2356. [Google Scholar] [CrossRef]
  19. Fan, Y.; Feng, H.; Yue, J.; Jin, X.; Liu, Y.; Chen, R. Using an optimized texture index to monitor the nitrogen content of potato plants over multiple growth stages. Comput. Electron. Agric. 2023, 212, 108147. [Google Scholar] [CrossRef]
  20. Fu, Y.; Yang, G.; Pu, R.; Li, Z.; Li, H.; Xu, X.; Song, X.; Yang, X.; Zhao, C. An overview of crop nitrogen status assessment using hyperspectral remote sensing: Current status and perspectives. Eur. J. Agron. 2021, 124, 126241. [Google Scholar] [CrossRef]
  21. Zhang, S.; Duan, J.; Qi, X.; Gao, Y.; He, L.; Liu, L. Combining spectrum, thermal, and texture features using machine learning algorithms for wheat nitrogen nutrient index estimation and model transferability analysis. Comput. Electron. Agric. 2024, 222, 109022. [Google Scholar] [CrossRef]
  22. Bronson, K.; French, A.; Conley, M.; Barnes, E. Use of an ultrasonic sensor for plant height estimation in irrigated cotton. Agronomy 2021, 113, 2175–2183. [Google Scholar] [CrossRef]
  23. Li, H.; Li, D.; Xu, K.; Cao, W.; Jiang, X.; Ni, J. Monitoring of Nitrogen Indices in Wheat Leaves Based on the Integration of Spectral and Canopy Structure Information. Agronomy 2022, 12, 833. [Google Scholar] [CrossRef]
  24. Xie, J.; Zhou, Z.; Zhang, H.; Zhang, L.; Li, M. Combining Canopy Coverage and Plant Height from UAV-Based RGB Images to Estimate Spraying Volume on Potato. Sustainability 2022, 14, 6473. [Google Scholar] [CrossRef]
  25. Flynn, K.; Baath, G.; Lee, T.; Gowda, P.; Northup, B. Hyperspectral reflectance and machine learning to monitor legume biomass and nitrogen accumulation. Comput. Electron. Agric. 2023, 211, 107991. [Google Scholar] [CrossRef]
  26. Guo, Y.; He, J.; Huang, J.; Jing, Y.; Xu, S.; Wang, L.; Li, S.; Zheng, G. Effects of the Spatial Resolution of UAV Images on the Prediction and Transferability of Nitrogen Content Model for Winter Wheat. Drones 2022, 6, 299. [Google Scholar] [CrossRef]
  27. Blekanov, I.; Molin, A.; Zhang, D.; Mitrofanov, E.; Mitrofanova, O.; Li, Y. Monitoring of grain crops nitrogen status from uav multispectral images coupled with deep learning approaches. Comput. Electron. Agric. 2023, 212, 108047. [Google Scholar] [CrossRef]
  28. Jiang, J.; Atkinson, P.; Zhang, J.; Lu, R.; Zhou, Y.; Cao, Q.; Tian, Y.; Zhu, Y.; Cao, W.; Liu, X. Combining fixed-wing UAV multispectral imagery and machine learning to diagnose winter wheat nitrogen status at the farm scale. Eur. J. Agron. 2022, 138, 126537. [Google Scholar] [CrossRef]
  29. Yang, F.; Liu, Y.; Yan, J.; Guo, L.; Tan, J.; Meng, X.; Xiao, Y.; Feng, H. Winter Wheat Yield Estimation with Color Index Fusion Texture Feature. Agriculture 2024, 14, 581. [Google Scholar] [CrossRef]
  30. Cao, Q.; Yang, G.; Duan, D.; Chen, L.; Wang, F.; Xu, B.; Zhao, C.; Niu, F. Combining multispectral and hyperspectral data to estimate nitrogen status of tea plants (Camellia sinensis (L.) O. Kuntze) under field conditions. Comput. Electr. Agricult. 2022, 198, 107084. [Google Scholar] [CrossRef]
  31. Li, Z.; Zhou, X.; Cheng, Q.; Fei, S.; Chen, Z. A Machine-Learning Model Based on the Fusion of Spectral and Textural Features from UAV Multi-Sensors to Analyse the Total Nitrogen Content in Winter Wheat. Remote Sens. 2023, 15, 2152. [Google Scholar] [CrossRef]
  32. Ding, F.; Li, C.; Zhai, W.; Fei, S.; Cheng, Q.; Chen, Z. Estimation of Nitrogen Content in Winter Wheat Based on Multi-Source Data Fusion and Machine Learning. Agriculture 2022, 12, 1752. [Google Scholar] [CrossRef]
  33. Fu, Y.; Yang, G.; Li, Z.; Song, X.; Li, Z.; Xu, X.; Wang, P.; Zhao, C. 2020. Winter Wheat Nitrogen Status Estimation Using UAV-Based RGB Imagery and Gaussian Processes Regression. Remote Sens. 2020, 12, 3778. [Google Scholar] [CrossRef]
  34. Oliveira, R.; Barbosa, M.; Pinto, A.; Oliveira, J.; Zerbato, C.; Furlani, C. Predicting Sugarcane Biometric Parameters by UAV Multispectral Images and Machine Learning. Agronomy 2022, 12, 1992. [Google Scholar] [CrossRef]
  35. Liu, S.; Zhang, B.; Yang, W.; Chen, T.; Zhang, H.; Lin, Y.; Tan, J.; Li, X.; Gao, Y.; Yao, S.; et al. Quantification of Physiological Parameters of Rice Varieties Based on Multi-Spectral Remote Sensing and Machine Learning Models. Remote Sens. 2023, 15, 453. [Google Scholar] [CrossRef]
  36. Gitelson, A.; Kaufman, Y.; Merziyak, M. Use of a green channel in remote sensing of global vegetation from EOS-MODIS. Remote Sen. Environ. 1996, 58, 289–298. [Google Scholar] [CrossRef]
  37. Rouse, J. Monitoring the Vernal Advancement of Retrogradation (Green Wave Effect) of Natural Vegetation; NASA/GSFC Type III. Final Report; NASA/GSFC: Greenbelt, MD, USA, 1974; p. 371. [Google Scholar]
  38. Rondeaux, G.; Baret, F.; Steven, M. Optimization of soil-adjusted vegetation indices. Remote Sens. Environ. 1996, 55, 95–107. [Google Scholar] [CrossRef]
  39. Gitelson, A.; Vina, A.; Caganda, V.; Rundquist, D.; Arkebauer, T. Remote estimation of canopy content in crops. Geophys. Res. Lett. 2005, 32, 1–4. [Google Scholar] [CrossRef]
  40. Huete, A.; Justice, C.; Leeuwen, W. MODIS vegetation index (MOD13). Algorithm Theor. Basis Doc. 1999, 3, 295–309. [Google Scholar]
  41. Deering, D.; Rouse, J.; Hass, R.; Schell, J. Measuring “Forage Production” of grazing units from Landsat MSS data. In Proceedings of the 10th International Symposium on Remote Sensing of Environment, Ann Arbor, MI, USA, 6 October 1975; pp. 169–1178. [Google Scholar]
  42. Erunova, M.; Pisman, T.; Shevyrnogov, A. The technology for detecting weeds in agricultural crops based on vegetation index VARI (PlanetScope). Journal of Siberian Federal University. Eng. Technol. 2021, 14, 347–353. [Google Scholar]
  43. Lamm, R.; Slaughter, D.; Giles, D. Precision weed control system for cotton. Trans. Am. Soc. Agric. Biol. Eng. 2002, 45, 231–238. [Google Scholar]
  44. Huete, A.; Hua, G.; Qi, J.; Chehbouni, A.; Leeuwen, W. Normalization of multidirectional red and NIR reflectances with the SAVI. Remote Sen. Environ. 1992, 41, 143–154. [Google Scholar] [CrossRef]
  45. Jordan, C.F. Derivation of leaf-area index from quality of light on the forest floor. Ecology 1969, 50, 663–666. [Google Scholar] [CrossRef]
  46. Hu, P.; Chapman, S.; Wang, X.; Potgieter, A.; Duan, T.; Jordan, D.; Guo, Y.; Zheng, B. Estimation of plant height using a high throughput phenotyping platform based on unmanned aerial vehicle and self-calibration: Example for sorghum breeding. Eur. J. Agron. 2018, 95, 24–32. [Google Scholar] [CrossRef]
  47. Sun, B.; Wang, C.; Yang, C.; Xu, B.; Zhou, G.; Li, X. Retrieval of rapeseed leaf area index using the PROSAIL model with canopy coverage derived from UAV images as a correction parameter. Int. J. Appl. Earth Obs. Geoinf. 2021, 102, 102373. [Google Scholar] [CrossRef]
  48. Berger, K.; Verrelst, J.; F’eret, J.-B.; Wang, Z.; Wocher, M.; Strathmann, M.; Danner, M.; Mauser, W.; Hank, T. Crop nitrogen monitoring: Recent progress and principal developments in the context of imaging spectroscopy missions. Remote Sens. Environ. 2020, 242, 111758. [Google Scholar] [CrossRef]
  49. Breiman, L. Random forests, Machine Learning. J. Clin. Microbiol. 2001, 45, 199–228. [Google Scholar]
  50. Vapnik, V. Statistical Learning Theory; Chapters 10–11; Wiley: New York, NY, USA, 1998; pp. 401–492. [Google Scholar]
  51. Camps-Valls, G.; Verrelst, J.; Munoz-Mari, J.; Laparra, V.; Mateo-Jimenez, F.; Gomez-Dans, J. A survey on Gaussian processes for earth-observation data analysis: A comprehensive investigation. IEEE Geosci. Remote Sens. Mag. 2016, 4, 58–78. [Google Scholar] [CrossRef]
  52. Soric, J.; Stanic, M.; Lesicar, T. On Neural Network Application in Solid Mechanics. Trans. Famena 2023, 47, 45–66. [Google Scholar] [CrossRef]
  53. Maimaitijiang, M.; Ghulam, P.; Sidike, S.; Hartling, M.; Maimaitiyiming, K.; Peterson, E.; Shavers, E.; Fishman, J.; Peterson, J.; Kadam, S.; et al. Unmanned Aerial System (uas)-based Phenotyping of Soybean Using Multi-sensor Data Fusion and Extreme Learning Machine. ISPRS J. Photogramm. Remote Sens. 2017, 134, 43–58. [Google Scholar] [CrossRef]
  54. Zhang, L.; Song, X.; Niu, Y.; Zhang, H.; Wang, A.; Zhu, Y.; Zhu, X.; Chen, L.; Zhu, Q. Estimating Winter Wheat Plant Nitrogen Content by Combining Spectral and Texture Features Based on a Low-Cost UAV RGB System throughout the Growing Season. Agriculture 2024, 14, 456. [Google Scholar] [CrossRef]
  55. Yang, X.; Yang, R.; Ye, Y.; Yuan, Z.; Wang, D.; Hua, K. Winter wheat SPAD estimation from UAV hyperspectral data using cluster-regression methods. Int. J. Appl. Earth Obs. Geoinf. 2021, 105, 102618. [Google Scholar] [CrossRef]
  56. Su, X.; Nian, Y.; Yue, H.; Zhu, Y.; Li, J.; Wang, W.; Sheng, Y.; Ma, Q.; Liu, J.; Wang, W.; et al. Improving Wheat Leaf Nitrogen Concentration (LNC) Estimation across Multiple Growth Stages Using Feature Combination Indices (FCIs) from UAV Multispectral Imagery. Agronomy 2024, 14, 1052. [Google Scholar] [CrossRef]
  57. Basso, B.; Cammarano, D.; De, V.P. Remotely sensed vegetation indices: Theory and applications for crop management. Riv. Ital. Agrometeorol. 2004, 1, 36–53. [Google Scholar]
  58. Liao, Z.; Dai, Y.; Wang, H.; Quirine, M.; Lu, J.; Zhang, F.; Liu, Z.; Fan, J. A double-layer model for improving the estimation of wheat canopy nitrogen content from unmanned aerial vehicle multispectral imagery. J. Integr. Agric. 2023, 22, 2248–2270. [Google Scholar] [CrossRef]
  59. Fan, Y.; Feng, H.; Yue, J.; Liu, Y.; Jin, X.; Xu, X.; Song, X.; Ma, Y.; Yang, G. Comparison of Different Dimensional Spectral Indices for Estimating Nitrogen Content of Potato Plants over Multiple Growth Periods. Remote Sens. 2023, 15, 602. [Google Scholar] [CrossRef]
  60. Grinberg, N.; Orhobor, O.; King, R. An evaluation of machine-learning for predicting phenotype: Studies in yeast, rice, and wheat. Mach. Learn. 2020, 109, 251–277. [Google Scholar] [CrossRef]
  61. Fan, C.; Zhang, D.; Yang, L.; Cui, T.; He, X.; Qiao, M. Improving Nitrogen Status Diagnosis and Recommendation of Maize Using UAV Remote Sensing Data. Biosyst. Eng. 2023, 236, 212–223. [Google Scholar] [CrossRef]
Figure 1. The geographical location of the study area and the distribution of experimental plots.
Agriculture 14 01775 g001
Figure 2. The main technical flowchart of this study. Note: PNC, plant nitrogen content; UAV, unmanned aerial vehicle; GNDVI, green-band normalized vegetation index; NDVI, normalized difference vegetation index; CARI, chlorophyll absorption ratio index; OSAVI, optimized soil-adjusted vegetation index; EVI, enhanced vegetation index; TVI, triangle vegetation index; SD, standard deviation; CV, variable coefficient; PLSR, partial least squares regression; RFR, random forest regression; SVR, support vector machine regression; GPR, Gaussian process regression; NNETR, neural network regression model; R2, coefficient of determination; RMSE, root mean square error; MAE, mean absolute error; MAPE, mean absolute percentage error. *, **, and *** indicate significant differences at p < 0.05, p < 0.01, and p < 0.001.
Agriculture 14 01775 g002
Figure 3. Plant nitrogen content of wheat at different nitrogen levels and growth stages. Note: PNC, plant nitrogen content; three wheat varieties: HG 35, Hengguan 35; ML 1, Malan No. 1; SL 02-1, Shiluan 02-1.
Agriculture 14 01775 g003
Figure 4. Estimation results of the PNC of multiple varieties in a single growth stage based on GPR. Note: PNC, plant nitrogen content; GPR, Gaussian process regression.
Agriculture 14 01775 g004
Figure 5. Optimal nitrogen estimation results of wheat plants of a single variety in multiple growth periods. Note: PNC, plant nitrogen content; three wheat varieties: HG 35, Hengguan 35; ML 1, Malan No. 1; SL 02-1, Shiluan 02-1.
Agriculture 14 01775 g005
Figure 6. Nitrogen content and measured values of wheat plants at different growth stages estimated based on RFR. Note: PNC, plant nitrogen content; RFR, random forest regression.
Agriculture 14 01775 g006aAgriculture 14 01775 g006b
Table 1. The calculation formulas of vegetation indices.
Vegetation IndexFormulasReferences
Green-band normalized vegetation index (GNDVI)(Rnir − Rgreen)/(Rnir + Rgreen)[36]
Normalized difference vegetation index (NDVI)(Rnir − Rred)/(Rnir + Rred)[37]
Chlorophyll absorption ratio index (CARI)(Rred edge − Rred) − 0.2 ×(Rred edge + Rred)[38]
Optimized soil-adjusted vegetation index (OSAVI)(Rnir − Rred)/(Rnir + Rred + 0.16)[38]
Normalized blue–green difference index (NGBDI)(Rgreen − Rblue)/(Rgreen+ Rblue)[39]
Enhanced vegetation index (EVI)2.5 × (Rnir − Rred)/(Rnir + 6 × Rred − 7.5 × Rblue +1)[40]
Triangle vegetation index (TVI)0.5 × (120 × (Rnir − Rgreen) − 200 × (Rred − Rgreen))[41]
Atmospherically resistant vegetation index (VARI)(Rgreen − Rred)/(Rred + Rgreen − Rblue)[42]
Excessive green index (EXG)2 × Rgreen − Rred − Rblue[43]
Ratio vegetation index (RVI)Rnir/Rred[42]
Soil-adjusted vegetation index (SAVI)1.5 × (Rnir − Rred)/(Rnir + Rred +0.5)[44]
Normalized blue–green band difference vegetation index (GBNDVI)(Rnir − (Rgreen+ Rblue))/(Rnir + Rgreen+ Rblue)[43]
Difference vegetation index (DVI)Rnir − Rred[45]
Table 2. Partitioning of wheat plant nitrogen datasets (%).
DatasetsSample NumbersMaxMinMeanSDCV
Jointing all samples452.271.391.840.30605.06
Booting all samples451.621.121.410.14996.32
Anthesis all samples451.551.111.360.131076.44
Filling all samples451.450.961.230.13962.49
All ML 1 samples602.271.0251.440.31458.15
All HG 35 samples602.210.961.460.31472.02
All SL 02-1 samples602.131.081.470.27545.77
All samples1802.270.961.460.30490.57
Note: Three wheat varieties: HG 35, Hengguan 35; ML 1, Malan No. 1; SL 02-1, Shiluan 02-1; Max, maximum; Min, minimum; SD, standard deviation; CV, variable coefficient.
Table 3. Correlation between three types of features extracted from UAV images and PNC.
TypesVariablesAll SamplesAll ML 1All HG35 35All SL 02-1JointingBootingAnthesisFilling
TextureMean0.41 ***0.410.310.50 *−0.56 *−0.52 *−0.56 *−0.54 *
Variance0.240.430.090.430.170.400.54 *0.36
Homogeneity−0.33 ***−0.54 **−0.40−0.23−0.18−0.42−0.44−0.44
Contrast0.28 *0.47 *0.150.430.130.460.52 *0.36
Dissimilarity0.32 **0.50 *0.240.360.150.450.500.39
Entropy0.240.45 *0.440.020.300.460.390.50
Second moment−0.20−0.43−0.440.05−0.29−0.44−0.36−0.50
Correlation0.180.35−0.240.40−0.37−0.55 *0.35−0.13
Canopy structure parametersCC0.54 ***0.54 **0.60 ***0.47 *0.150.18−0.74 ***0.09
Plant height−0.43 ***−0.46 *−0.36 ***−0.48 *0.55 *0.73 ***0.200.13
Reflectance spectra and vegetation indicesR450−0.75 ***−0.74 ***−0.79 ***−0.72 ***−0.57 ***−0.78 ***−0.65 **−0.70 ***
R550−0.77 ***−0.79 ***−0.82 ***−0.71 ***−0.62 ***−0.73 ***−0.73 ***−0.73 ***
R660−0.77 ***−0.77 ***−0.83 ***−0.70 ***−0.59 **−0.75 ***−0.72 ***−0.81 ***
R735−0.70 ***−0.72 ***−0.72 ***−0.66 ***−0.63 *−0.39−0.69 ***−0.44
R790−0.52 ***−0.52 ***−0.49 ***−0.56 ***0.67 **0.79 ***0.300.20
GNDVI0.64 ***0.69 ***0.85 ***0.310.64 ***0.81 ***0.73 ***0.79 ***
NDVI0.58 ***0.65 ***0.81 ***0.190.61 **0.79 ***0.71 ***0.77 ***
CARI−0.20−0.25−0.02−0.320.54 *0.76 ***0.55 *0.61 **
OSAVI0.080.110.37−0.250.63 ***0.81 ***0.70 ***0.73 ***
NGBDI−0.62 ***−0.66 ***−0.67 ***−0.56 **−0.67 ***0.42−0.55*0.44
EVI−0.12−0.120.08−0.320.65 ***0.80 ***0.66 ***0.66 ***
TVI−0.27 *−0.27−0.12−0.400.64 ***0.81 ***0.61 **0.59 **
VARI0.34 ***0.390.70 ***−0.160.51 *0.60 **0.56 *0.57 *
EXG−0.64 ***−0.74 ***−0.70 ***−0.57 ***−0.53 *0.35−0.63 ***0.11
RVI0.63 ***0.71 ***0.86 ***0.150.63 ***0.75 ***0.65 ***0.70 ***
SAVI−0.16−0.150.05−0.370.64 ***0.81 ***0.67 ***0.68 ***
GBNDVI0.55 ***0.63 ***0.81 ***0.120.63 ***0.81 ***0.72 ***0.78 ***
DVI−0.30***−0.30−0.18−0.420.65 ***0.81 ***0.60 **0.58 **
Note: *, **, and *** indicate significant differences at p < 0.05, p < 0.01, and p < 0.001. R450, R550, R660, R735, and R790, the spectral reflectance of 450, 550, 660, and 735 bands; CC, canopy coverage.
Table 4. Estimation results of nitrogen in wheat plants of multiple varieties in single stage.
Growth
Stages
DatasetsEvaluation IndicesSVRRFRGPRPLSRNNETR
JointingTraining setR20.880.950.840.540.99
RMSE (%)0.100.080.120.200.01
MAE0.060.060.090.150.01
MAPE (%)0.030.030.050.080.00
Testing setR20.760.790.810.450.24
RMSE (%)0.230.180.160.280.34
MAE0.190.150.140.240.23
MAPE (%)0.090.080.070.120.12
BootingTraining setR20.880.930.880.681.00
RMSE (%)0.050.040.050.080.01
MAE0.040.030.040.060.01
MAPE (%)0.030.020.030.040.00
Testing setR20.630.600.660.480.05
RMSE (%)0.080.080.080.090.25
MAE0.070.070.060.070.19
MAPE (%)0.040.050.040.060.12
AnthesisTraining setR20.920.950.880.541.00
RMSE (%)0.040.030.040.090.01
MAE0.030.030.040.090.01
MAPE (%)0.020.020.030.060.00
Testing setR20.770.640.800.430.32
RMSE (%)0.070.090.070.090.19
MAE0.060.070.060.080.15
MAPE (%)0.040.050.040.070.11
Filling Training setR20.890.940.890.610.99
RMSE (%)0.040.030.040.070.01
MAE0.030.030.030.060.01
MAPE (%)0.030.020.030.050.00
Testing setR20.590.560.670.480.55
RMSE (%)0.100.110.090.120.16
MAE0.090.100.080.110.14
MAPE (%)0.070.080.060.090.11
Note: PLSR, partial least squares regression; RFR, random forest regression; SVR, support vector machine regression; GPR, Gaussian process regression; NNETR, neural network regression model; R2, coefficient of determination; RMSE, root mean square error; MAE, mean absolute error; MAPE, mean absolute percentage error.
Table 5. Estimation results of nitrogen in wheat plants of single wheat variety across multiple growth stages.
VarietiesDatasetIndicesSVRRFRGPRPLSRNNETR
ML 1Training setR20.88 0.97 0.91 0.810.99
RMSE (%)0.12 0.050.090.13 0.01
MAE0.070.040.060.090.01
MAPE (%)0.040.020.040.060.00
Testing setR20.86 0.910.890.770.77
RMSE (%)0.140.11 0.120.160.61
MAE0.090.070.09 0.11 0.36
MAPE (%)0.060.040.060.080.21
HG 35Training setR20.980.990.960.920.99
RMSE (%)0.050.040.060.090.01
MAE0.030.040.050.070.01
MAPE (%)0.020.020.040.050.00
Testing setR20.870.930.880.780.58
RMSE (%)0.160.140.140.190.24
MAE0.120.110.100.150.18
MAPE (%)0.080.060.080.100.12
SL 02-1Training setR20.810.960.830.490.99
RMSE (%)0.130.060.110.190.03
MAE0.090.050.080.150.02
MAPE (%)0.050.030.050.100.01
Testing setR20.460.720.520.260.36
RMSE (%)0.180.140.180.220.30
MAE0.140.120.150.190.205
MAPE (%)0.090.080.100.140.15
Note: Three wheat varieties: HG 35, Hengguan 35; ML 1, Malan No. 1; SL 02-1, Shiluan 02-1. PLSR, partial least squares regression; RFR, random forest regression; SVR, support vector machine regression; GPR, Gaussian process regression; NNETR, neural network regression model; R2, coefficient of determination; RMSE, root mean square error; MAE, mean absolute error; MAPE, mean absolute percentage error.
Table 6. Estimation results of nitrogen in wheat plants of multiple varieties across multiple growth stages.
DatasetsIndicesSVRRFRGPRPLSRNNETR
Training setR20.910.970.86 0.750.93
RMSE (%)0.090.050.11 0.150.08
MAE0.060.040.08 0.110.06
MAPE (%)0.040.020.050.070.04
Testing setR20.850.900.790.640.85
RMSE (%)0.130.100.140.180.12
MAE0.090.080.100.140.90
MAPE (%)0.060.060.070.100.06
Note: PLSR, partial least squares regression; RFR, random forest regression; SVR, support vector machine regression; GPR, Gaussian process regression; NNETR, neural network regression model; R2, coefficient of determination; RMSE, root mean square error; MAE, mean absolute error; MAPE, mean absolute percentage error.
Disclaimer/Publisher’s Note: The statements, opinions and data contained in all publications are solely those of the individual author(s) and contributor(s) and not of MDPI and/or the editor(s). MDPI and/or the editor(s) disclaim responsibility for any injury to people or property resulting from any ideas, methods, instructions or products referred to in the content.

