Article

Research on Meteorological Drought Risk Prediction in the Daqing River Basin Based on HADGEM3-RA

1
Yellow River Institute of Hydraulic Research, Yellow River Conservancy Commission (YRCC), Zhengzhou 450003, China
2
Key Laboratory of Lower Yellow River Channel and Estuary Regulation, Ministry of Water Resources (MWR), Zhengzhou 450003, China
*
Author to whom correspondence should be addressed.
Agriculture 2024, 14(10), 1781; https://doi.org/10.3390/agriculture14101781 (registering DOI)
Submission received: 27 August 2024 / Revised: 19 September 2024 / Accepted: 1 October 2024 / Published: 10 October 2024
(This article belongs to the Section Ecosystem, Environment and Climate Change in Agriculture)

Abstract

:
Climate change is altering the water cycle and increasing drought risks in river basins. However, few studies account for minor droughts, despite their limited environmental impact. This study uses a pooling and exclusion method to remove the effects of minor droughts on the identification of drought events and analyze drought characteristics in the Daqing River Basin (DRB) using the HADGEM3-RA model within an Exposure–Resilience–Vulnerability (ERV) framework. It finds that the drought duration and the number of events are sensitive to pooling and exclusion rates. Drought severity is also sensitive to exclusion rates. Pooling and exclusion lead to fewer but longer and more severe droughts. Future droughts in the DRB are projected to become more severe, with durations averaging up to 7 months and severity increasing from 0.2 to 4.3. Drought peak severity is expected to exceed 1.28, with development and relief periods extending to 0.68 and 0.69 months, respectively. Risk levels in the basin are projected to rise from I to II–IV, with RCP4.5 scenarios showing higher risks than RCP8.5. Mountainous areas will face higher risks compared to plains. Initially, risk factors will increase then decline over time. These findings clarify drought dynamics and risk changes in the DRB under climate change. They can help in developing climate-resilient strategies for disaster reduction in similar basins.

1. Introduction

Drought is one of the most common and destructive natural disasters worldwide, posing significant challenges to food security [1,2], the ecological environment [3,4], and human health [5,6]. Climate change has altered the global water cycle, leading to an imbalance in river basins’ spatial and temporal distribution of water resources, thereby exacerbating drought risks. The sixth assessment report of the Intergovernmental Panel on Climate Change highlights that increased atmospheric water demand due to evapotranspiration under anthropogenic warming has increased droughts across all continents [7]. China, a country frequently affected by droughts, has experienced more frequent and severe droughts in many regions due to global warming, further increasing drought risk [8,9,10].
Drought can be categorized into meteorological drought, hydrological drought, soil drought, socio-economic drought, and environmental drought [11,12]. Among these, meteorological drought, characterized by the prolonged deficiency of atmospheric water [13], plays a leading role in the propagation of the drought chain from meteorology to hydrology, soil, vegetation, and the environment. For example, meteorological drought can precede and sustain low river runoff, increasing the risk of hydrological drought [14,15]. In Chinese river basins, meteorological droughts generally lead to hydrological droughts [16]. Especially in North China, over 91.89% of meteorological droughts evolve into hydrological droughts. Furthermore, the meteorological drought and its cascading effects on other forms of drought are projected to intensify under climate change, which highlights the vital need for predicting meteorological droughts [17,18].
Under climate change, the drought risk assessment is crucial for developing adaptive drought management strategies. To quantify drought risk, the copula functions [19], which are mathematical tools that link the marginal distributions of multiple random variables to form a joint distribution, have been widely applied [16,20,21,22]. For instance, Bera and Dutta use copula to establish a joint distribution of drought intensity and duration, indicating that the seasonal drought risk in the upper and middle reaches of the Ganges River plain is more severe [21]. However, these methods often focus on hazard factors to characterize drought risk, describing the probabilistic behavior of drought characteristics without considering the temporal process of drought and the flexibility of the watershed. Short-duration droughts exhibit truncation characteristics, complicating the establishment of copula functions. Another method for quantifying drought risk is the risk factor method. Previous studies [23] reveal that the Exposure–Vulnerability–Resilience (EVR) framework exhibits a stronger correlation with grain yield loss due to drought than copula-based approaches, which necessitate complex fitting and time stationarity, thus offering a more precise depiction of drought-related agricultural risk. It has been noted that EVR is climate sensitive, reinforcing its advantage in the context of climate change [24]. Sadeghi and Hazfavi [25] evaluated the impact of drought on watershed health trends using EVR in the Shazand region of Iran. Zeng et al. [26] used the same method to calculate the drought risk factors of 10 major watersheds in China and predicted future drought risks in different watersheds. Combined with sliding windows, EVR can also reflect the dynamic changes in drought risk. For example, Dai et al. [23] analyzed drought risk changes in the Pearl River basin.
Drought events are commonly identified and analyzed using run theory, which truncates below-threshold values of drought indicators [21,27]. However, minor drought events can fragment long-term droughts into several independent events or have a minimal impact on the external environment; thus, ignoring them may distort drought risk assessments. In other words, in the context of run theory for identifying drought events, it is crucial to pool and exclude minor drought events to preserve the overall characteristics of drought [28,29]. For example, Guo et al. used the pooling and exclusion method to remove the effects of minor hydrological drought events in the Pearl River basin to reflect the changing environment [29]. However, this is often overlooked in meteorological drought risk analysis.
China is a country that experiences frequent droughts worldwide, and North China, influenced by the East Asian monsoon, faces more severe drought problems compared to other regions in the country [30]. The Daqing River Basin (DRB), located in Northern China’s drought-prone belt, is densely populated and serves as a key granary and industrial base for the country [31]. Due to the combined effects of tropical and mid-latitude climate systems, the region experiences significant climatic fluctuations. Since the 1960s, and particularly since the 1980s, North China has entered a period of frequent droughts [32]. Compared to other regions in China, droughts in North China are characterized by their wide range, high severity, and long duration, causing tremendous losses to the area [32,33]. Therefore, it is necessary to conduct an in-depth analysis of future drought risk to provide a reference for developing climate-adaptive basin management measures.
In summary, the objectives of this paper are as follows: (1) to extract drought events in the DRB using the run theory combined with the merging and elimination of minor drought events; (2) to analyze changes in drought characteristics in the DRB under warming scenarios; and (3) to assess future meteorological drought risk in the DRB using the EVR framework. The structure of this paper is as follows: Section 2 describes the materials and methods used in the study, with results and discussion presented in Section 3 and Section 4, respectively, and conclusions in Section 5.

2. Materials and Methods
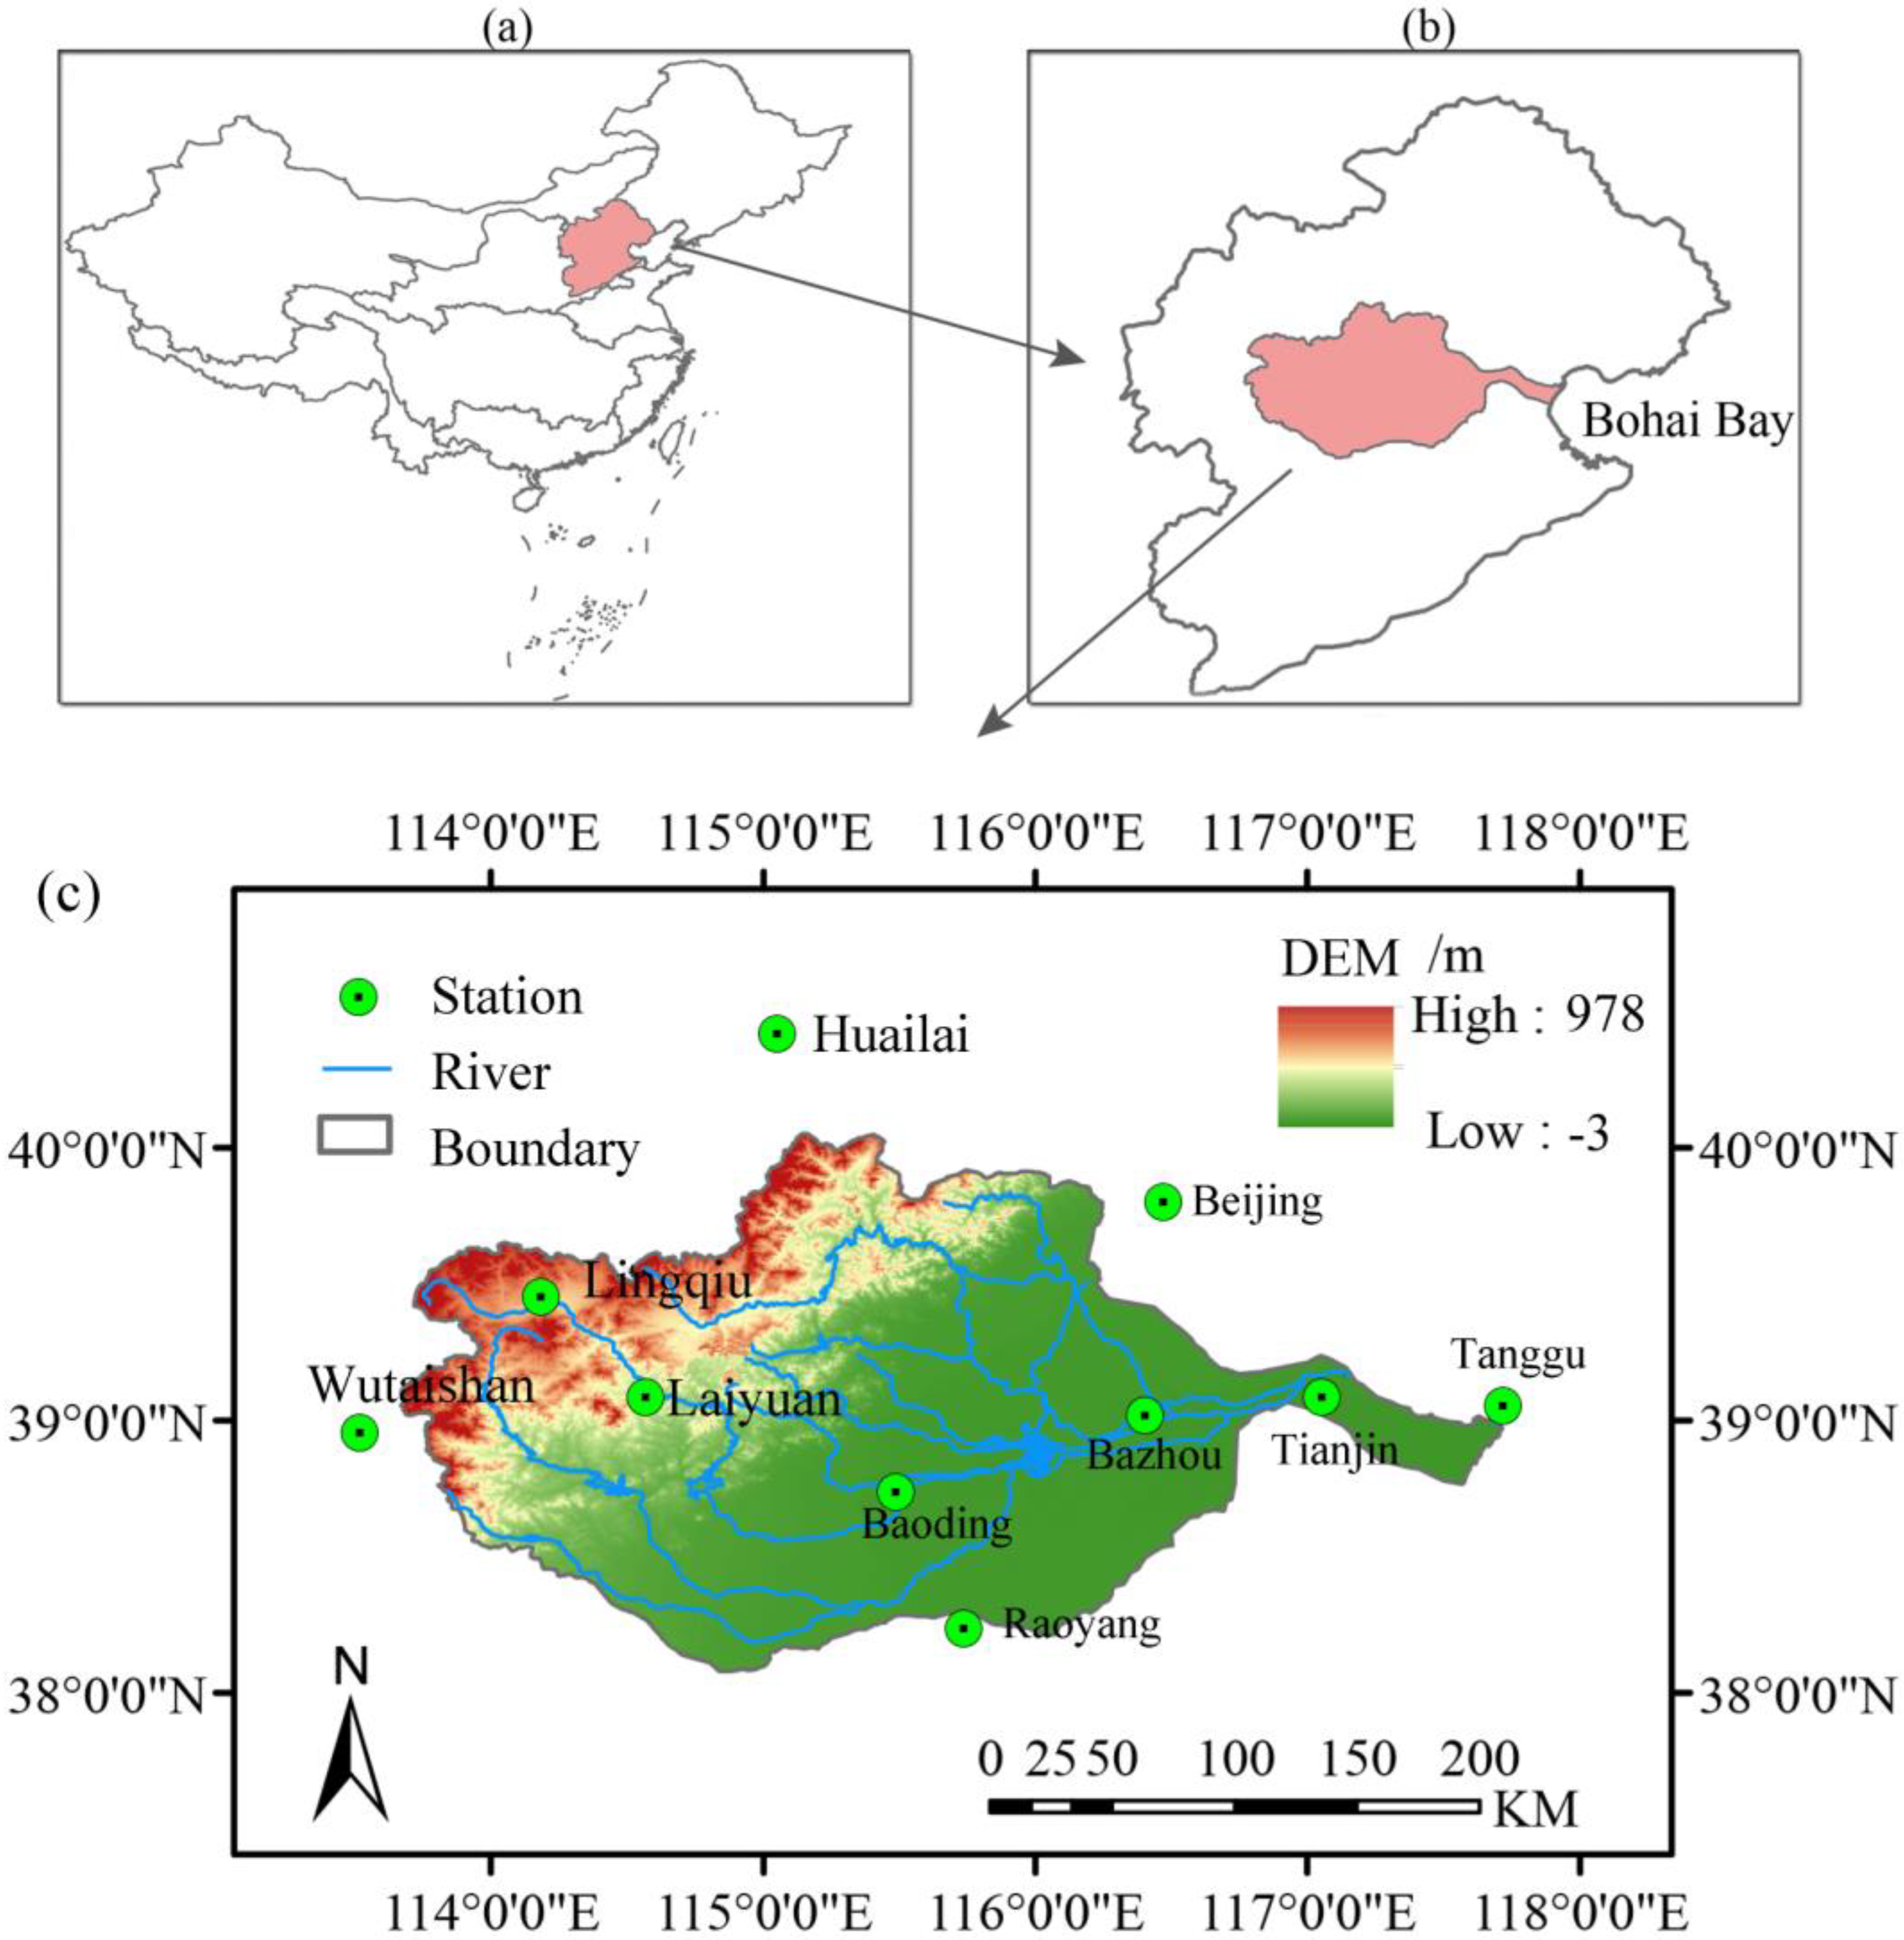
2.1. Study Area

The DRB is one of the major sub-basins of the Hai River Basin, located between 113.66° E to 117.72° E and 38.09° N to 40.08° N, with a total area of approximately 43,060 km2 (Figure 1). The DRB features a terrain that slopes from high elevations in the west to lower elevations in the east. The western region is dominated by the Taihang Mountains, with elevations ranging from 200 to 978 m. The central area is hilly, with elevations between 100 and 500 m, while the eastern region lies on the Huang-Hai Plain, with elevations below 100 m. The DRB experiences a typical temperate monsoon climate, with an annual average temperature of 8–12 °C and precipitation ranging from approximately 500 to 700 mm, with higher precipitation in the east and drier conditions in the west [31]. The precipitation pattern within the basin is highly variable, making it one of the most unevenly distributed regions for precipitation on the Chinese mainland [34,35]. Due to the influence of the strength of the East Asian monsoon system, about 80% of precipitation occurs between June and September, coupled with high temperatures, which often leads to regional drought.

2.2. Data Sources

This study utilizes daily minimum and maximum temperature and precipitation data from meteorological stations, provided by the China Meteorological Data Sharing Network (http://data.cma.cn (accessed on 27 August 2024)), for the period from 1982 to 2015. This dataset has undergone strict quality control through the review of the accuracy, completeness, and consistency caused by site migration, instrument damage, etc., following Chinese industry standards (quality control of meteorological observation data-Surface (QX/T 118-2020)) [36] and represents the most comprehensive, longest-running, and highest-quality observation dataset currently available in China. Five stations within the DRB were selected, along with an additional five stations surrounding the basin to supplement the data. The locations of these stations are depicted in Figure 1, and they are categorized as either mountainous or plain stations, with specific descriptions provided in Table S1.
To accurately project future drought changes, the HadGEM3-RA model, which has demonstrated strong performance in the East Asian region, was used as the source of warming scenarios for the DRB [37,38]. HadGEM3-RA, developed by the Korea Meteorological Institute, encompasses East Asia, India, and parts of the western Pacific with a grid resolution of 0.44°. It employs a non-hydrostatic dynamical framework, a modified mass flux convection scheme, and uses the UK Met Office’s MOSES-II and non-local MOSES-II for land surface and planetary boundary layer processes. More detailed information about HadGEM3-RA can be found in [37,38]. Compared to global climate models, HadGEM3-RA is a regional climate model that reflects more climate details in the region and its high resolution can also reduce spatial mismatches with station data.
Due to systematic biases inherent in climate models [39], a three-dimensional bias correction method [40] was applied. This method, based on the empirical copula approach, corrects not only the marginal distributions of meteorological variables but also their spatiotemporal evolution, aligning with the characteristics of future non-stationary climate changes [41]. For specific details, refer to our previous studies [31,35]. According to earlier research, the observation period was set from 1981 to 2015, and the projection period was divided into near-term (2031–2065, referred to as “a”) and far-term (2066–2100, referred to as “b”) to consider the paradigm requirements for bias correction method and the intensity of future climate change. Following the representative concentration pathways (RCP4.5 and RCP8.5) and the projection periods (near-term and far-term), the four warming scenarios were labeled as RCP4.5a, RCP4.5b, RCP8.5a, and RCP8.5b, respectively.

2.3. Methods

2.3.1. Drought Index Calculation

The 1-month Standardized Precipitation Evapotranspiration Index (SPEI1) is used to characterize meteorological drought, as it considers the comprehensive atmospheric water balance influenced by both precipitation and evapotranspiration, making it superior to drought indices based solely on precipitation, say, the Standardized Precipitation Index [42,43]. SPEI calculates cumulative water deficits during the analysis period and employs a three-parameter log-logistic curve for estimation, allowing for comparisons across diverse spatial and temporal scales [43,44]. The projected SPEI in this study is derived from the monthly log-logistic parameters based on observational data.
The Hargreaves method, which is based on temperature and radiation, is used to calculate potential evapotranspiration. This method only considers the minimum and maximum temperatures and incoming radiation, thus avoiding the overestimation of dry periods common in average temperature-based methods like Thornthwaite and reducing the uncertainty caused by various meteorological variables required by the Penman Monteith method [45]. Meanwhile, this method also limits interference from regional atmospheric transmittance [46,47]. The calculation formula is as follows:
P E T = C 1 × R a × ( T m a x + T m i n 2 + C 2 ) × ( T m a x T m i n ) C 3
where R a represents extraterrestrial radiation (MJ/(m2·day−1)), which depends on the latitude of the station. The calculation method for R a is detailed in the relevant literature [46]. T m a x and T m i n are the daily maximum and minimum temperatures (°C), respectively. The coefficients C 1 , C 2 , and C 3 are set to 0.0023, 17.8, and 0.5, respectively. Following Yang et al. [48], the coefficient C 3 is adjusted to 0.00334.

2.3.2. Drought Events Pooling and Excluding

Based on run theory, this study further employs the method of drought event pooling and excluding [49] to identify and refine drought events. This method has been effectively applied in both humid [28] and arid regions [29] of China. The main steps are as follows:
(1)
Initial Drought Event Identification: Using the drought classification threshold (Table S2), the initial definition of a drought event is established based on run theory. Continuous SPEI time “fragments” below the drought threshold are considered drought events. The left and right endpoints of each “fragment” represent the start ( M s ) and end ( M e ) times of the drought event, respectively. In Figure 2, a total of nine drought events are confirmed (the red-shaded area), and their durations are recorded as D i , D i + 1 , , D i + 8 ; their severity as S i , S i + 1 , , S i + 8 ; and their peak intensities as P i , P i + 1 , , P i + 8 .
(2)
Pooling Drought Events: Define two adjacent drought event attributes as ( D i , S i , M i s , M i e ) and ( D i + 1 , S i + 1 , M i + 1 s , M i + 1 e ) . If they meet both of the following conditions, perform the pooling operation:
The interval t i between adjacent drought events is less than a specific critical value t a , i.e., t i = M i + 1 s M i e t a .
The ratio of the internal excess v i corresponding to the interval t i between adjacent drought events to the previous drought event severity S i is less than a specific critical value ρ a , i.e., v i / S i ρ a . Here, the internal excess v i refers to the accumulated part (green-filled area) where the internal SPEI value is greater than the drought threshold, v i = t i [ S P E I ( 0.5 ) ] .
After pooling, the attributes of the new drought event are updated as follows:
D p o o l = D i + D i + 1 + t i S p o o l = S i + S i + 1 v i M p o o l s = M i s M p o o l e = M i e
The pooled peak of drought severity is P p o o l = max ( P i , P i + 1 ) . Repeat the pooling steps until all eligible drought events are merged, effectively combining drought events with strong correlations.
(3)
Excluding Minor Drought Events: Let D ¯ and S ¯ represent the average duration and severity of all droughts. For each drought event, if either D i / D ¯ < r d or S i / S ¯ < r s falls below a certain threshold, the event is excluded, i.e., D i = 0 or S i = 0 . For example, in Figure 2, the drought events i + 7 and i + 8 have their exclusion rates for duration and severity denoted as r d and r s , respectively. Duration ( D ) and severity ( S ) are the most critical characteristics of drought events and have the greatest impact on the environment, so they are considered to have equal weights, i.e., r d = r s = r d s [28,29].
Figure 2. Schematic diagram of drought event identification.
Agriculture 14 01781 g002
The parameters t a , ρ a , and r d s directly impact the final confirmation of drought events. For t a , if t a = 1 month, many low-severity drought events lasting longer than one month cannot be pooled. Conversely, if t a = 3 months, drought events within a quarter may be pooled, leading to excessive pooling, especially for SPEI1. Based on previous research [29], this study sets t a = 2 months. The values for ρ a and r d s are determined through sensitivity analysis, varying from 0 to 1 in increments of 0.01. By calculating the ratios of drought event attributes before and after pooling and excluding, ρ a and r d s are visually determined [28]. Additionally, drought duration, severity, and event numbers are considered to balance the weights.

2.3.3. Drought Dynamic Risk Index

In this study, the Exposure–Vulnerability–Resilience (EVR) framework is employed to evaluate the dynamic drought risk within the DRB, following the methodology outlined in [7]. The EVR framework incorporates various dimensional subsystems within a system, providing a straightforward and adaptable method for risk analysis. It has been widely applied across multiple domains, including water resources [50], ecology [51], and water environments [52]. The dynamic risks are assessed using an 11-year sliding window approach [53]. The calculations for EVR are as follows:
(1)
Exposure (Ex)
Exposure is commonly used to characterize the frequency or proportion of a system being in a fault state. Here, it refers to the sum of all drought durations divided by the research period L , expressed as a proportion.
E x = i = 1 N D i L
(2)
Vulnerability (Vu)
Vulnerability refers to the extent or severity of damage when a system fails. Here, it is defined as the average severity of all N drought events.
V u = S P E I < 0.5 S P E I N
(3)
Resilience (Re)
Resilience generally refers to the ability of a system to recover from an unsatisfactory state to a satisfactory one. Here, it refers to the ratio of the number of dry events within the study period to the total duration of all dry events.
R e = 1 N j = 1 N D i 1
For the risk factors calculated above, the higher the V u and E x , the greater the risk of drought. Conversely, the higher the R e , the lower the risk of drought. To standardize these risk factors, the range normalization method is used:
x i , n = ( x max x i ) / ( x max x min )   for   R e ( x i x min ) / ( x max x min )   for   V u , E x  
where x i , x min , and x max represent the value, minimum, and maximum of the i -th variable, respectively. The subscript n denotes the normalized result.
To provide a more intuitive representation of the comprehensive drought risk, the geometric mean method [25,54] is employed. The comprehensive drought risk index is defined as follows:
R i s k = ( R e n × V u n × E x n ) 1 / 3
The comprehensive drought risk index represents the tendency of drought risk under different projected scenarios compared to the observed scenario. In this paper, the drought risk levels of the river basin are categorized into five levels (I to V) in order of increasing R i s k , using equal interval division [24,25]. The detailed classification is listed in Table 1.

3. Results

3.1. Drought Event Identification

Figure 3 presents the sensitivity analysis results for pooling ratios ρ a (Section 2.3.2) during the observed period (1981–2015). As ρ a increases, the average duration of drought events increases compared to before pooling, while the number of drought events decreases. However, the average severity of drought events does not show a consistent trend; it initially increases and then decreases with ρ a . This pattern can be explained by the proportional relationship used for filtering drought events. As ρ a increases, more internal excess v i is combined with the previous drought event, thereby reducing the severity of the pooled event (Figure 2). Although considering the ratio of internal excess v i to the subsequent drought event could be an option, this approach would complicate the identification of drought events, and even small drought events following severe ones could still have a significant negative impact. Therefore, we adhere to the method described in the relevant literature [28,29]. Figure 3 also shows that the shape of the average duration curve is step-like, indicating multiple threshold values, from which robust values are selected.
Figure 4 shows the sensitivity analysis results of exclusion ratios r d s (Section 2.3.2) at each station during the observed period. The results indicate that as r d s increases, both the duration and severity of drought events increase, while the number of drought events decreases. The curve shape reveals an evident inflection point between 0.5 and 0.75 at all stations except Wutaishan, which might be caused by the local climate induced by the high altitude of Wutaishan.
Based on the sensitivity analysis results, the determined values of ρ a and r d s are listed in Table 2. It should be noted that to avoid excessive information loss, ρ a and r d s are set to less than 0.4 and 0.3, respectively.
According to Table 2, the duration, severity, and number of drought events at each station before and after pooling and excluding operations during the observed period are listed in Table 3. The before-, after-pooling, and after-excluding average durations (severities) across all stations were 1.58 (0.82), 1.65 (0.83), and 1.73 months (0.93), respectively, showing an increasing trend. Conversely, the average number of drought events was 95.6, 93.4, and 83, respectively, showing a decrease. The final number of confirmed drought events was approximately 13.2% lower than before pooling. These observed trends in pooling and excluding drought events are consistent with previous research [29]. While the results lack detailed descriptions of minor events, the sensitivity analysis provides constraints on the characteristics of drought sequences to some extent, offering robust drought event data for subsequent analyses.

3.2. Characteristics of Drought Events under Different Predictive Scenarios

Utilizing robust drought events obtained through the pooling and exclusion method can help to analyze the characteristics of drought events in different scenarios. To compare the observation scenario with the projected scenarios, the values of pooling ratio ρ a and exclusion ratio r d s from Table 2 were applied to the projections (for applicability analysis of bias correction in SPEI calculation, see Supplementary Materials, Figures S1–S3). Figure 5 shows the severity and duration of drought events under different scenarios for all stations. It reveals that, on average, future drought durations and severities at all stations are expected to increase compared to the observed period, except for a slight decrease at the Bazhou station under RCP8.5b. The 10th percentile of drought event duration and severity during the projected period differs little from the observed period, while the 90th percentile shows a significant rise. The duration of drought events in the projected period fluctuates between 1 and 7 months (10th to 90th percentile), surpassing the 1- to 4-month range in the observed period. The severity of drought events in the projected period fluctuates between 0.2 and 4.3, higher than the 0.2 to 1.2 range in the observed period. The study also observed that the prolonged duration of future drought events leads to a decrease in the number of drought events (Figure S4). The findings also revealed that RCP8.5b did not exhibit the highest drought intensity in the future, potentially due to the increased concentration of precipitation during the wet season [35], counterbalancing evapotranspiration under the RCP8.5 scenarios.
Figure 6 illustrates the spatial distribution of peak drought severity across different scenarios for each station. It reveals that the average peak severity at all stations during the observed period is 1.17, which is lower than the future RCP4.5a (RCP8.5a) and RCP4.5b (RCP8.5b) values of 1.29 (1.30) and 1.28 (1.23), respectively. This indicates that droughts in the DRB are expected to become more severe in the future. The 10th and 90th percentiles also support this conclusion, with observed droughts classified as severe and mild, respectively, while extreme drought events are projected to occur in Laiyuan in the future. Generally, a positive correlation is observed between the absolute value of peak drought severity and overall severity, implying an increasing instantaneous water supplement required for drought alleviation.
The development and relief durations of drought events at each station under different scenarios are shown in Table 4. During the observed period, the average drought event duration (0.39 months) was slightly longer than the relief period (0.34 months), with a difference of less than 0.2 months among the stations. In the projected scenarios, both the development and relief durations of drought events are longer than during the observed period; however, the relative lengths of drought development and relief time remain similar. Autumn becomes the peak period for drought occurrences (Figure S5), possibly related to the prolonged summer season. The increase in development and relief durations for RCP4.5a and RCP4.5b is greater than that for RCP8.5a and RCP8.5b, with RCP4.5b showing the longest durations, averaging 0.96 and 0.83 months for development and relief, respectively. The Huailai and Lingqiu stations on the western side of the basin exhibit the longest durations.

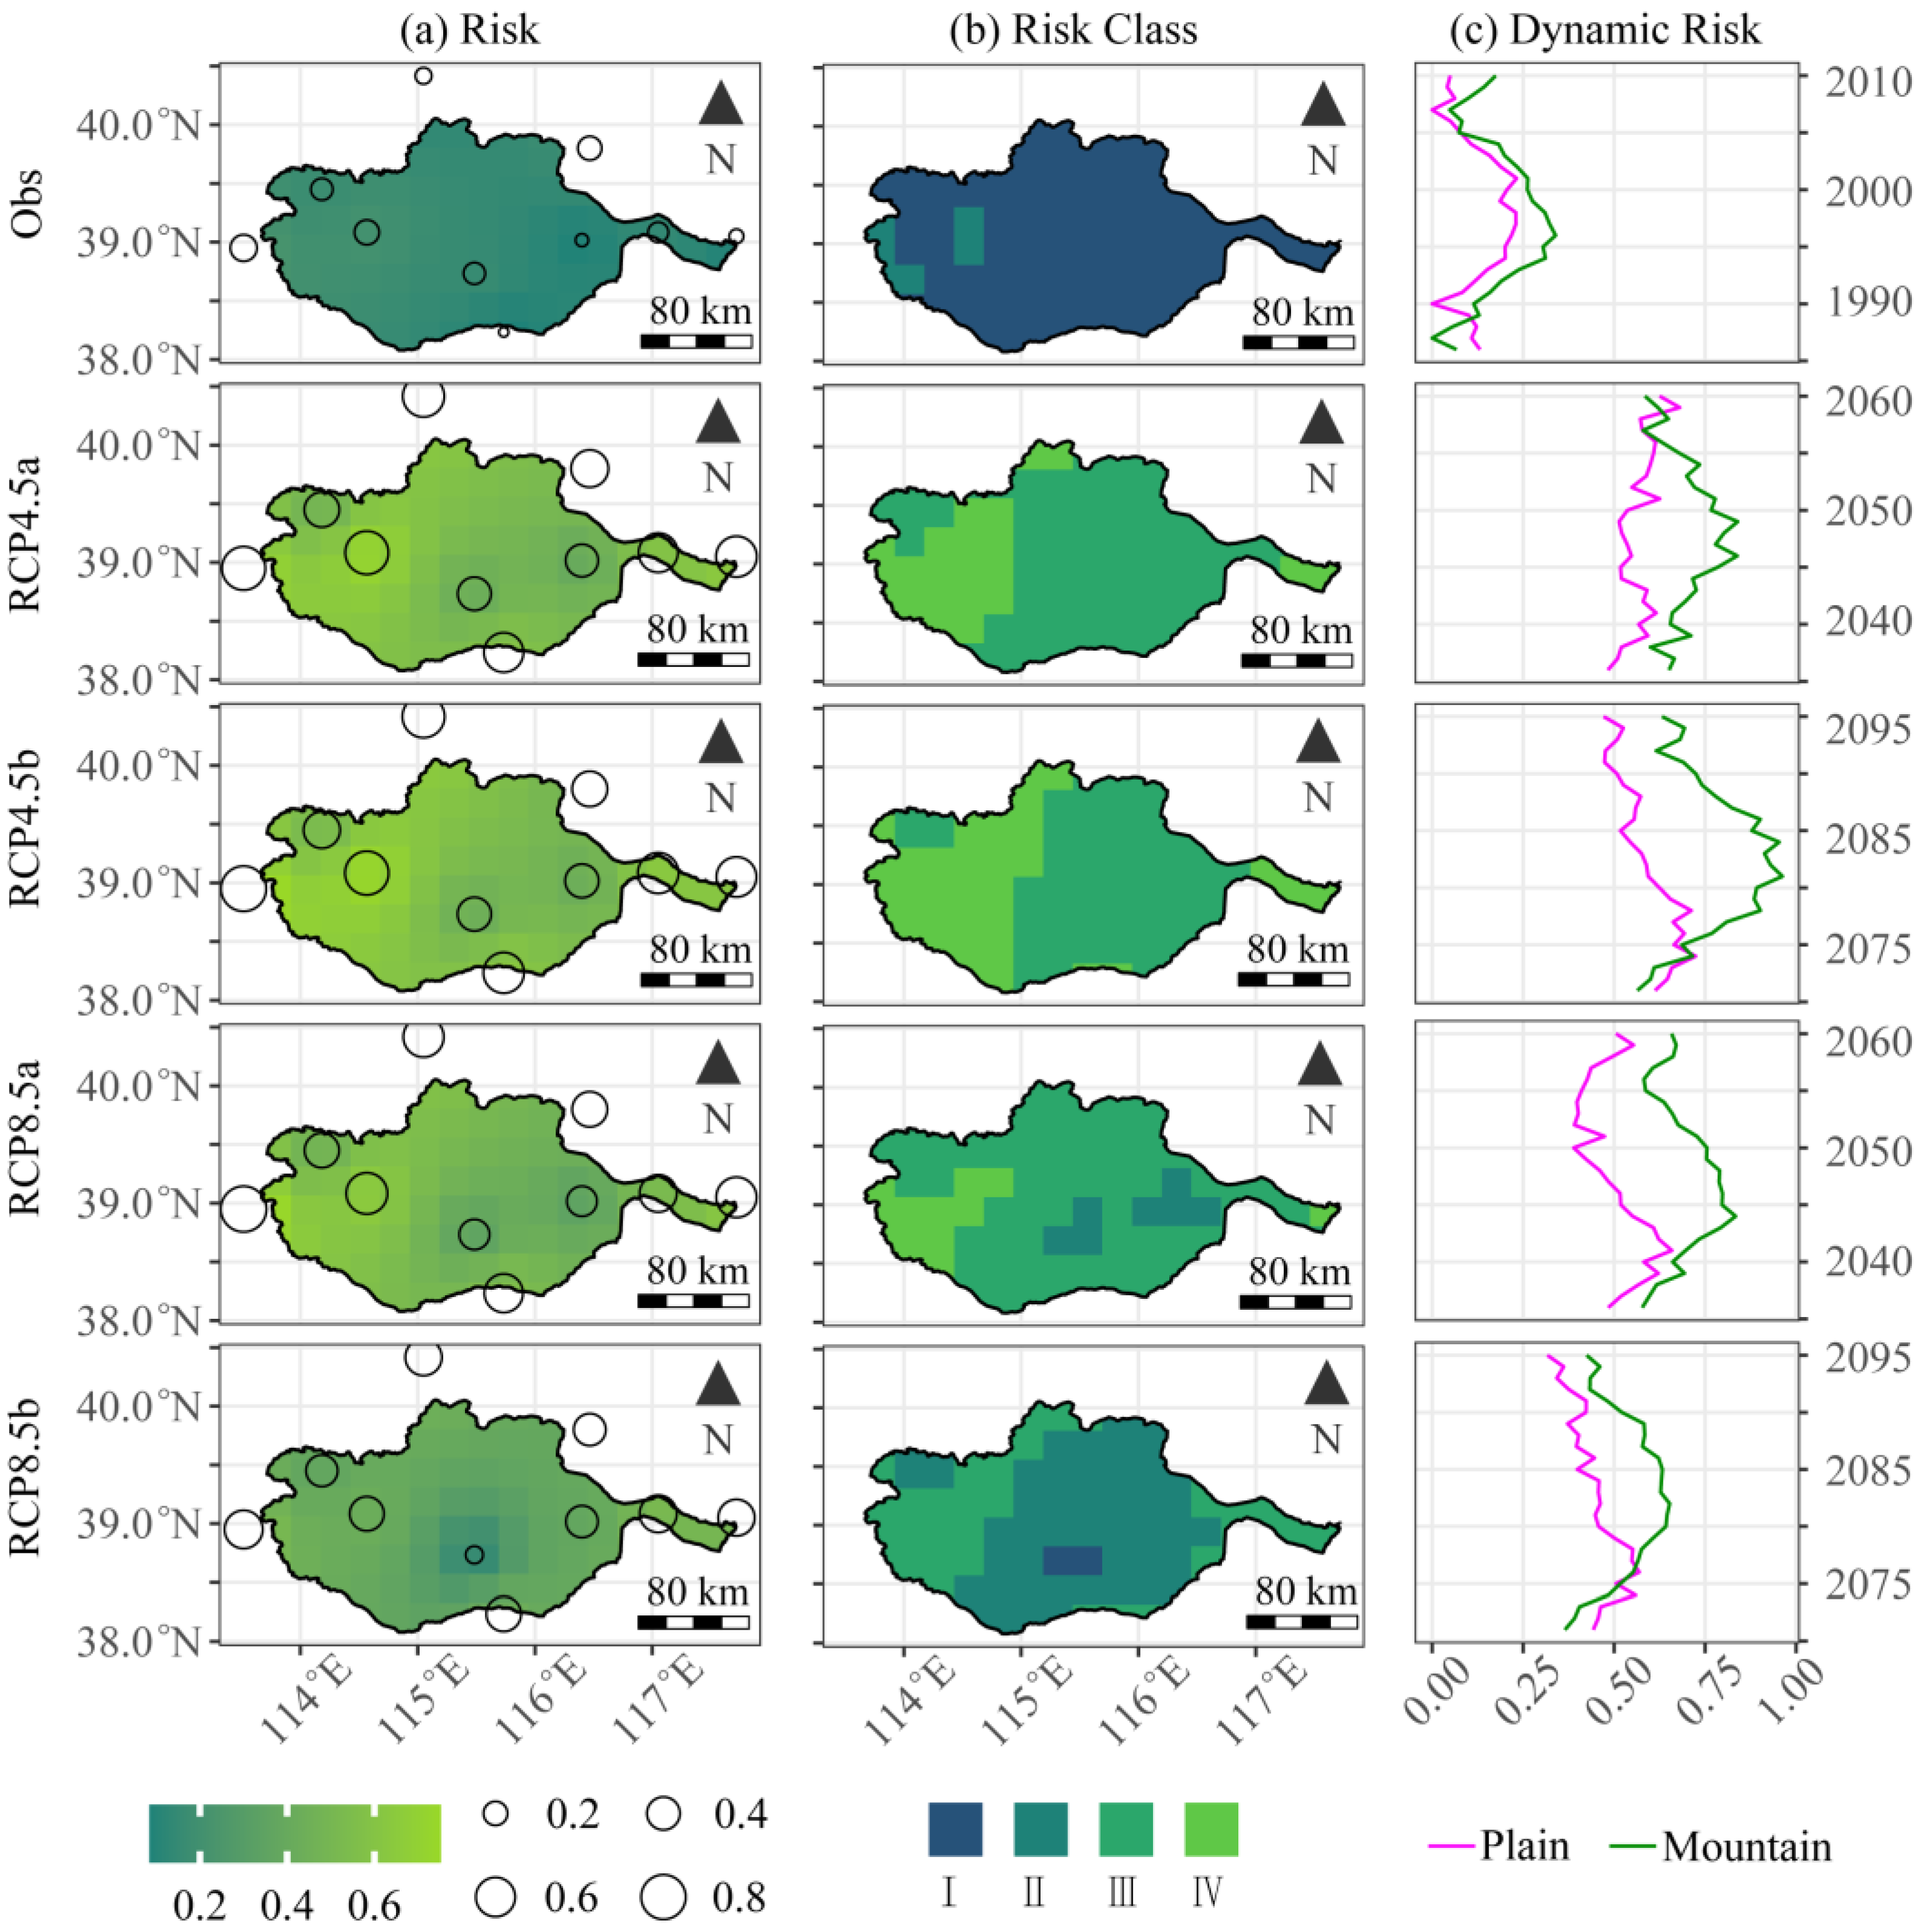
3.3. Dynamic Changes in Drought Risk under Different Scenarios

Figure 7 shows the exposure, resilience, vulnerability, and risk of drought events at each station under different scenarios. Compared to the observed period, all scenarios in the DRB indicate a decline in overall resilience due to increased drought duration and a decreased number of events. As drought severity increases and the number of events decreases in the future, vulnerability is projected to rise, with the highest values occurring under RCP4.5a and RCP4.5b, at 1.50 and 1.52, respectively. Future exposure is also expected to increase, with the smallest growth rate under RCP8.5, which aligns with the overall increase in drought duration. Overall, the risk of future drought in the basin is increasing.
Figure 8 illustrates the dynamic evolution of drought resilience, vulnerability, and exposure under different scenarios. The trends for all scenarios align with those shown in Figure 7, but the dynamic risk factors provide more detailed insights. Resilience is generally higher in plains than in mountainous regions, while vulnerability and exposure are lower in the mountains, indicating a higher overall risk in the mountainous areas compared to the plains. Regarding resilience, all scenarios show an increasing trend, except for a slight decline in the RCP4.5a scenario for the plains, with a steeper trend slope in the plains than in the mountainous regions. For vulnerability, the observed period shows little change, but the projected scenarios generally indicate a decreasing trend (except for the RCP4.5a scenario in the plains). As for exposure, the plains mainly exhibit an increasing trend, while the mountainous regions primarily show a decreasing trend. Overall, all risk factors exhibit dynamic changes over time.
Figure 9 displays the spatiotemporal changes in drought risk values and levels across different scenarios. During the observed period, the basin’s overall risk was below 0.2 (Level I), except for Laiyuan and Wutaishan, where values of 0.21 and 0.25 placed parts of the mountainous areas at Level II. Future scenarios show increased risk levels at most stations, with Wutaishan reaching the highest risk level (Level V). RCP4.5a and RCP4.5b exhibit similar risk patterns, with mountainous areas at Level IV (values above 0.6) and plains at Level III (0.4–0.6). RCP4.5b covers a slightly larger area at Level IV than RCP4.5a, indicating higher risk. RCP8.5 scenarios present lower risks than RCP4.5, with RCP8.5a showing values above 0.2 (Level II) and the highest risk in the southwest mountains at Level IV. RCP8.5b follows a similar pattern but with one level lower drought risk. The analysis reveals significant temporal variability in drought risk across the basin, with some areas experiencing a rise and then a fall in risk, except for RCP4.5a, suggesting that the basin is highly responsive to drought changes. The comprehensive drought risk analysis indicates a future increase in drought severity, especially in the central mountainous regions, which are at risk of water scarcity.

4. Discussion

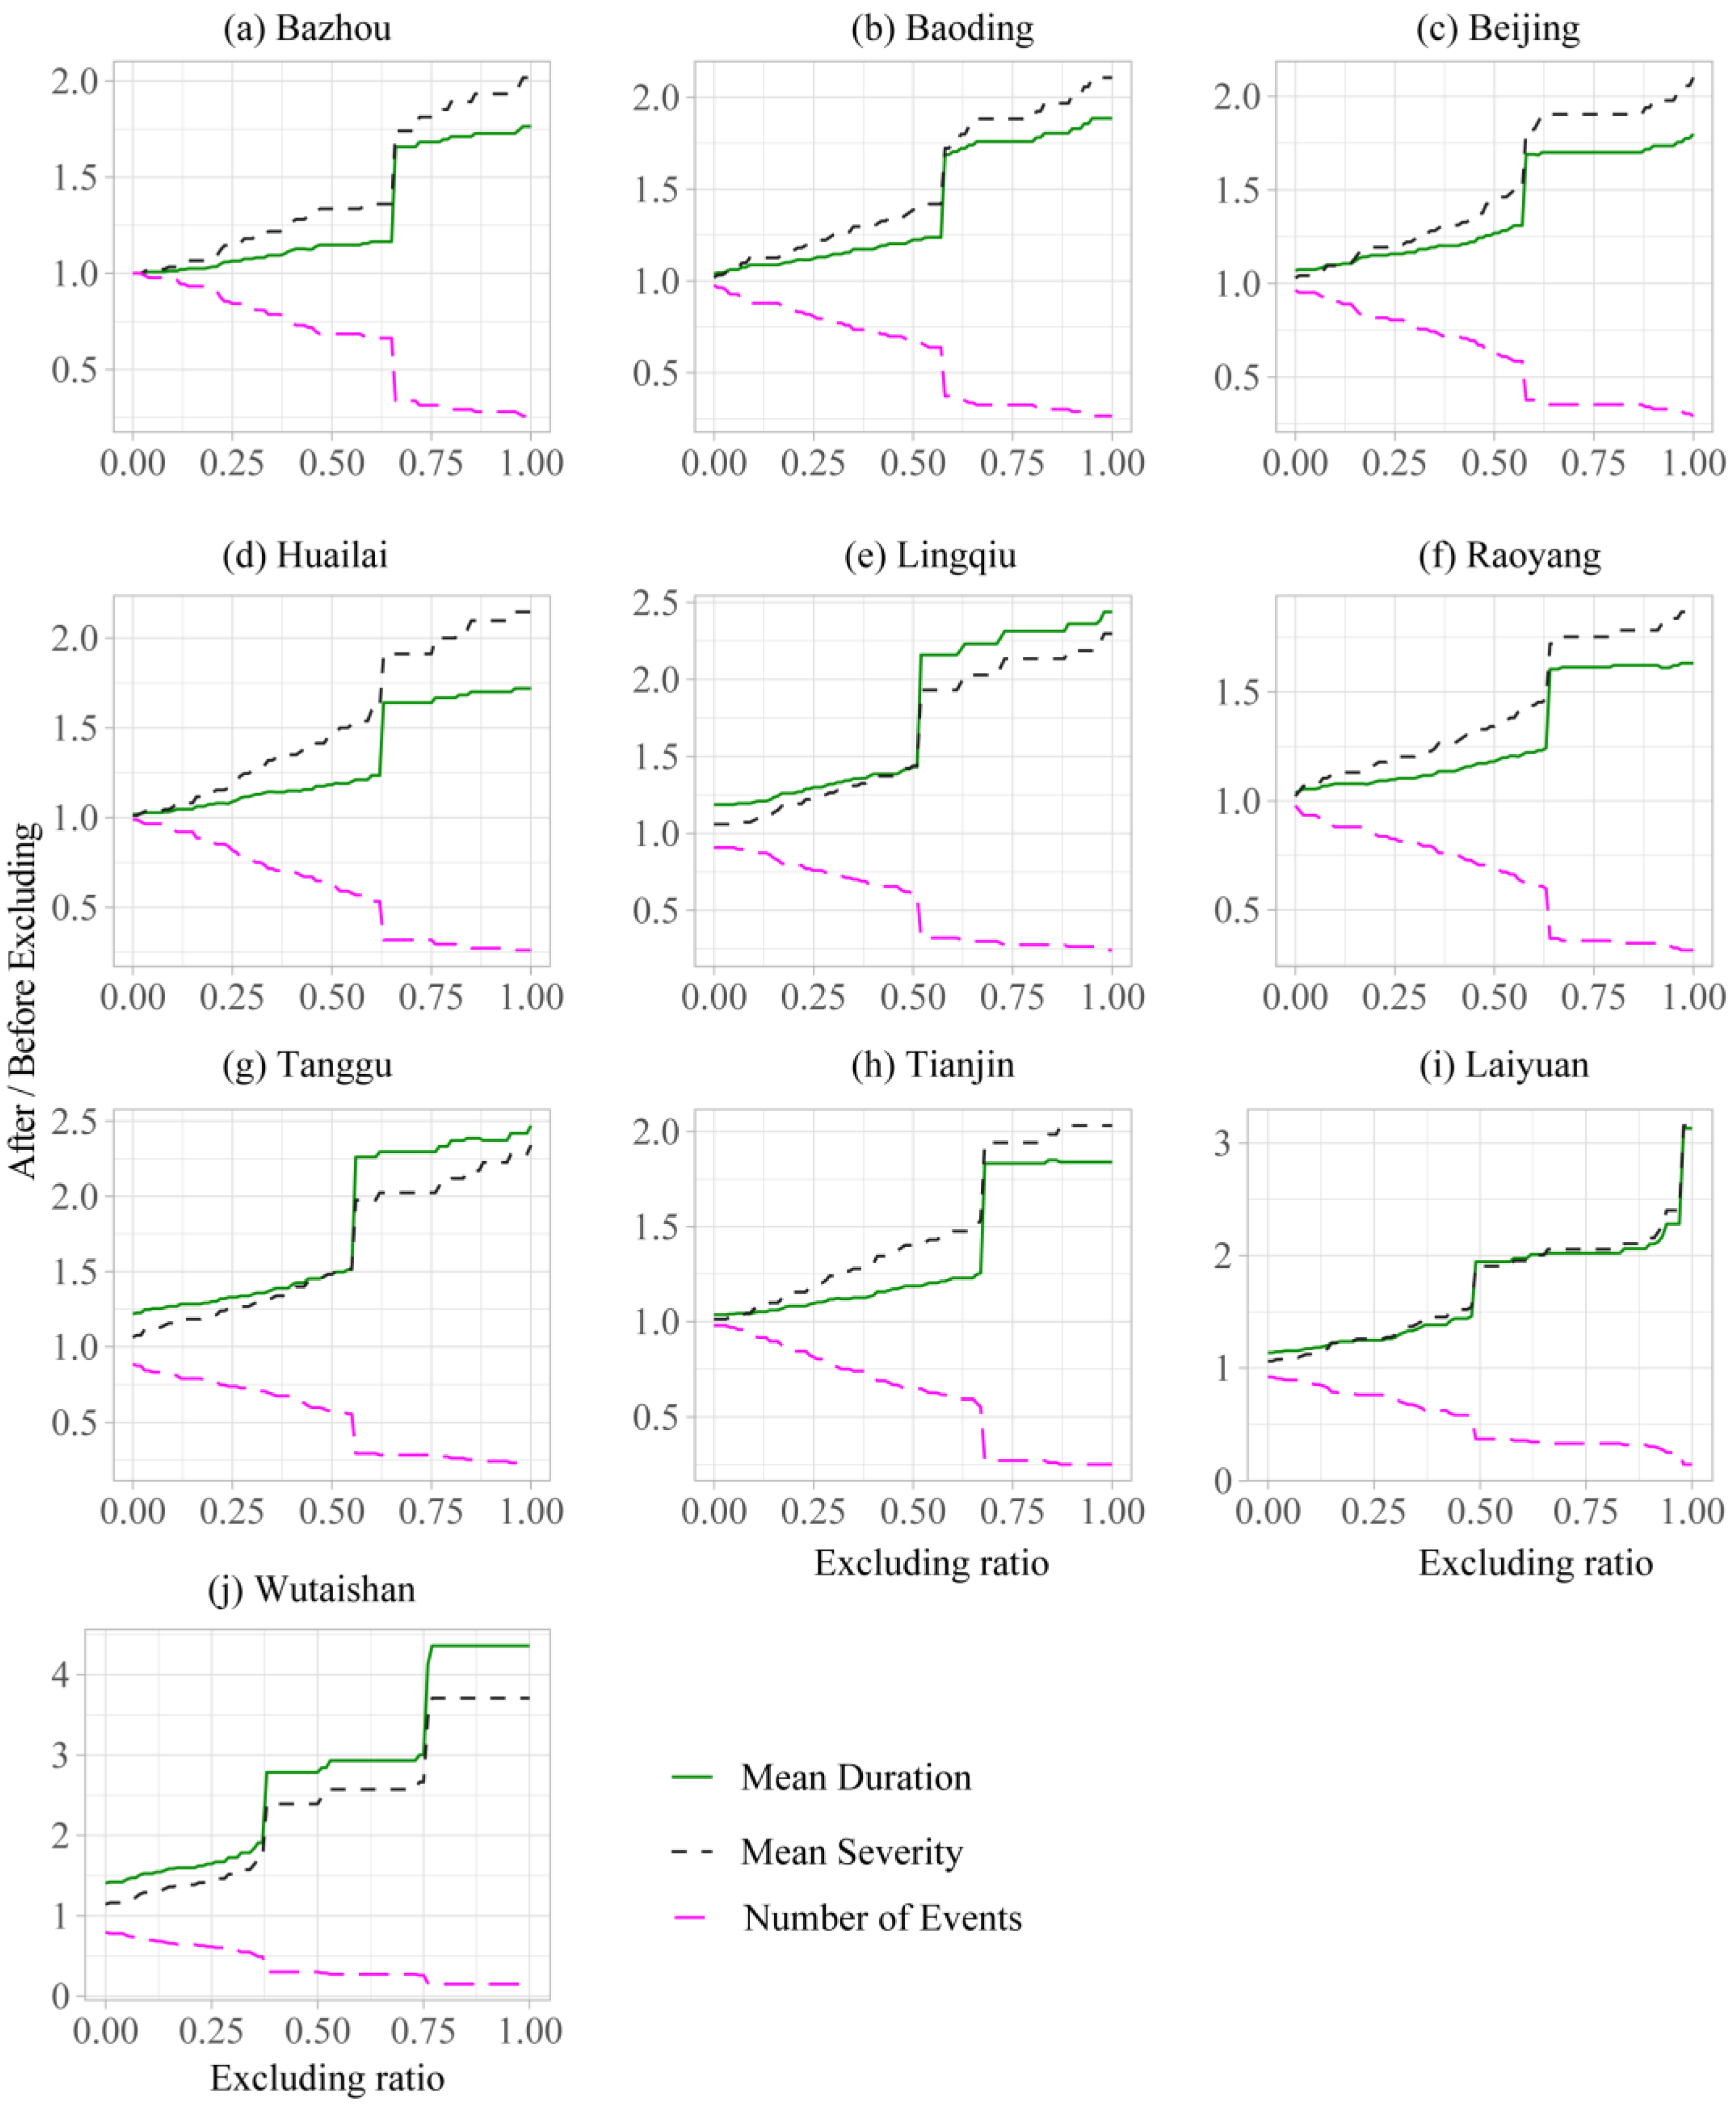
4.1. Impact of Pooling and Exclusion on Drought Event Identification

The application of pooling and excluding methods resulted in extended and intensified periods of drought, with a reduced number of events during the observed period. Our findings (Table 3) are consistent with previous studies in the Loess Plateau [29] and the Pearl River basin [28]. This is not surprising as the excluding method is used to combine drought events interrupted by minor droughts, which undoubtedly leads to an extended duration. Meanwhile, the average intensity of drought events changes little with the pooling ratio, due to the limited impact of the minor droughts (Figure 3). The exclusion removed minor drought events, and thus reduced the number of drought events and increased the average drought duration and intensity (Figure 4). Unlike Tu et al. [28], this research supplements the number of drought events as a response indicator in the sensitivity analysis to balance the weight of only considering duration and severity, both of which increase with the rise of ρ a and r d s . This study also suggests that the average duration and number of drought events are more suitable as indicator factors for determining ρ a . Unlike ρ a , average severity can also serve as an indicator for the sensitivity analysis of r d s .

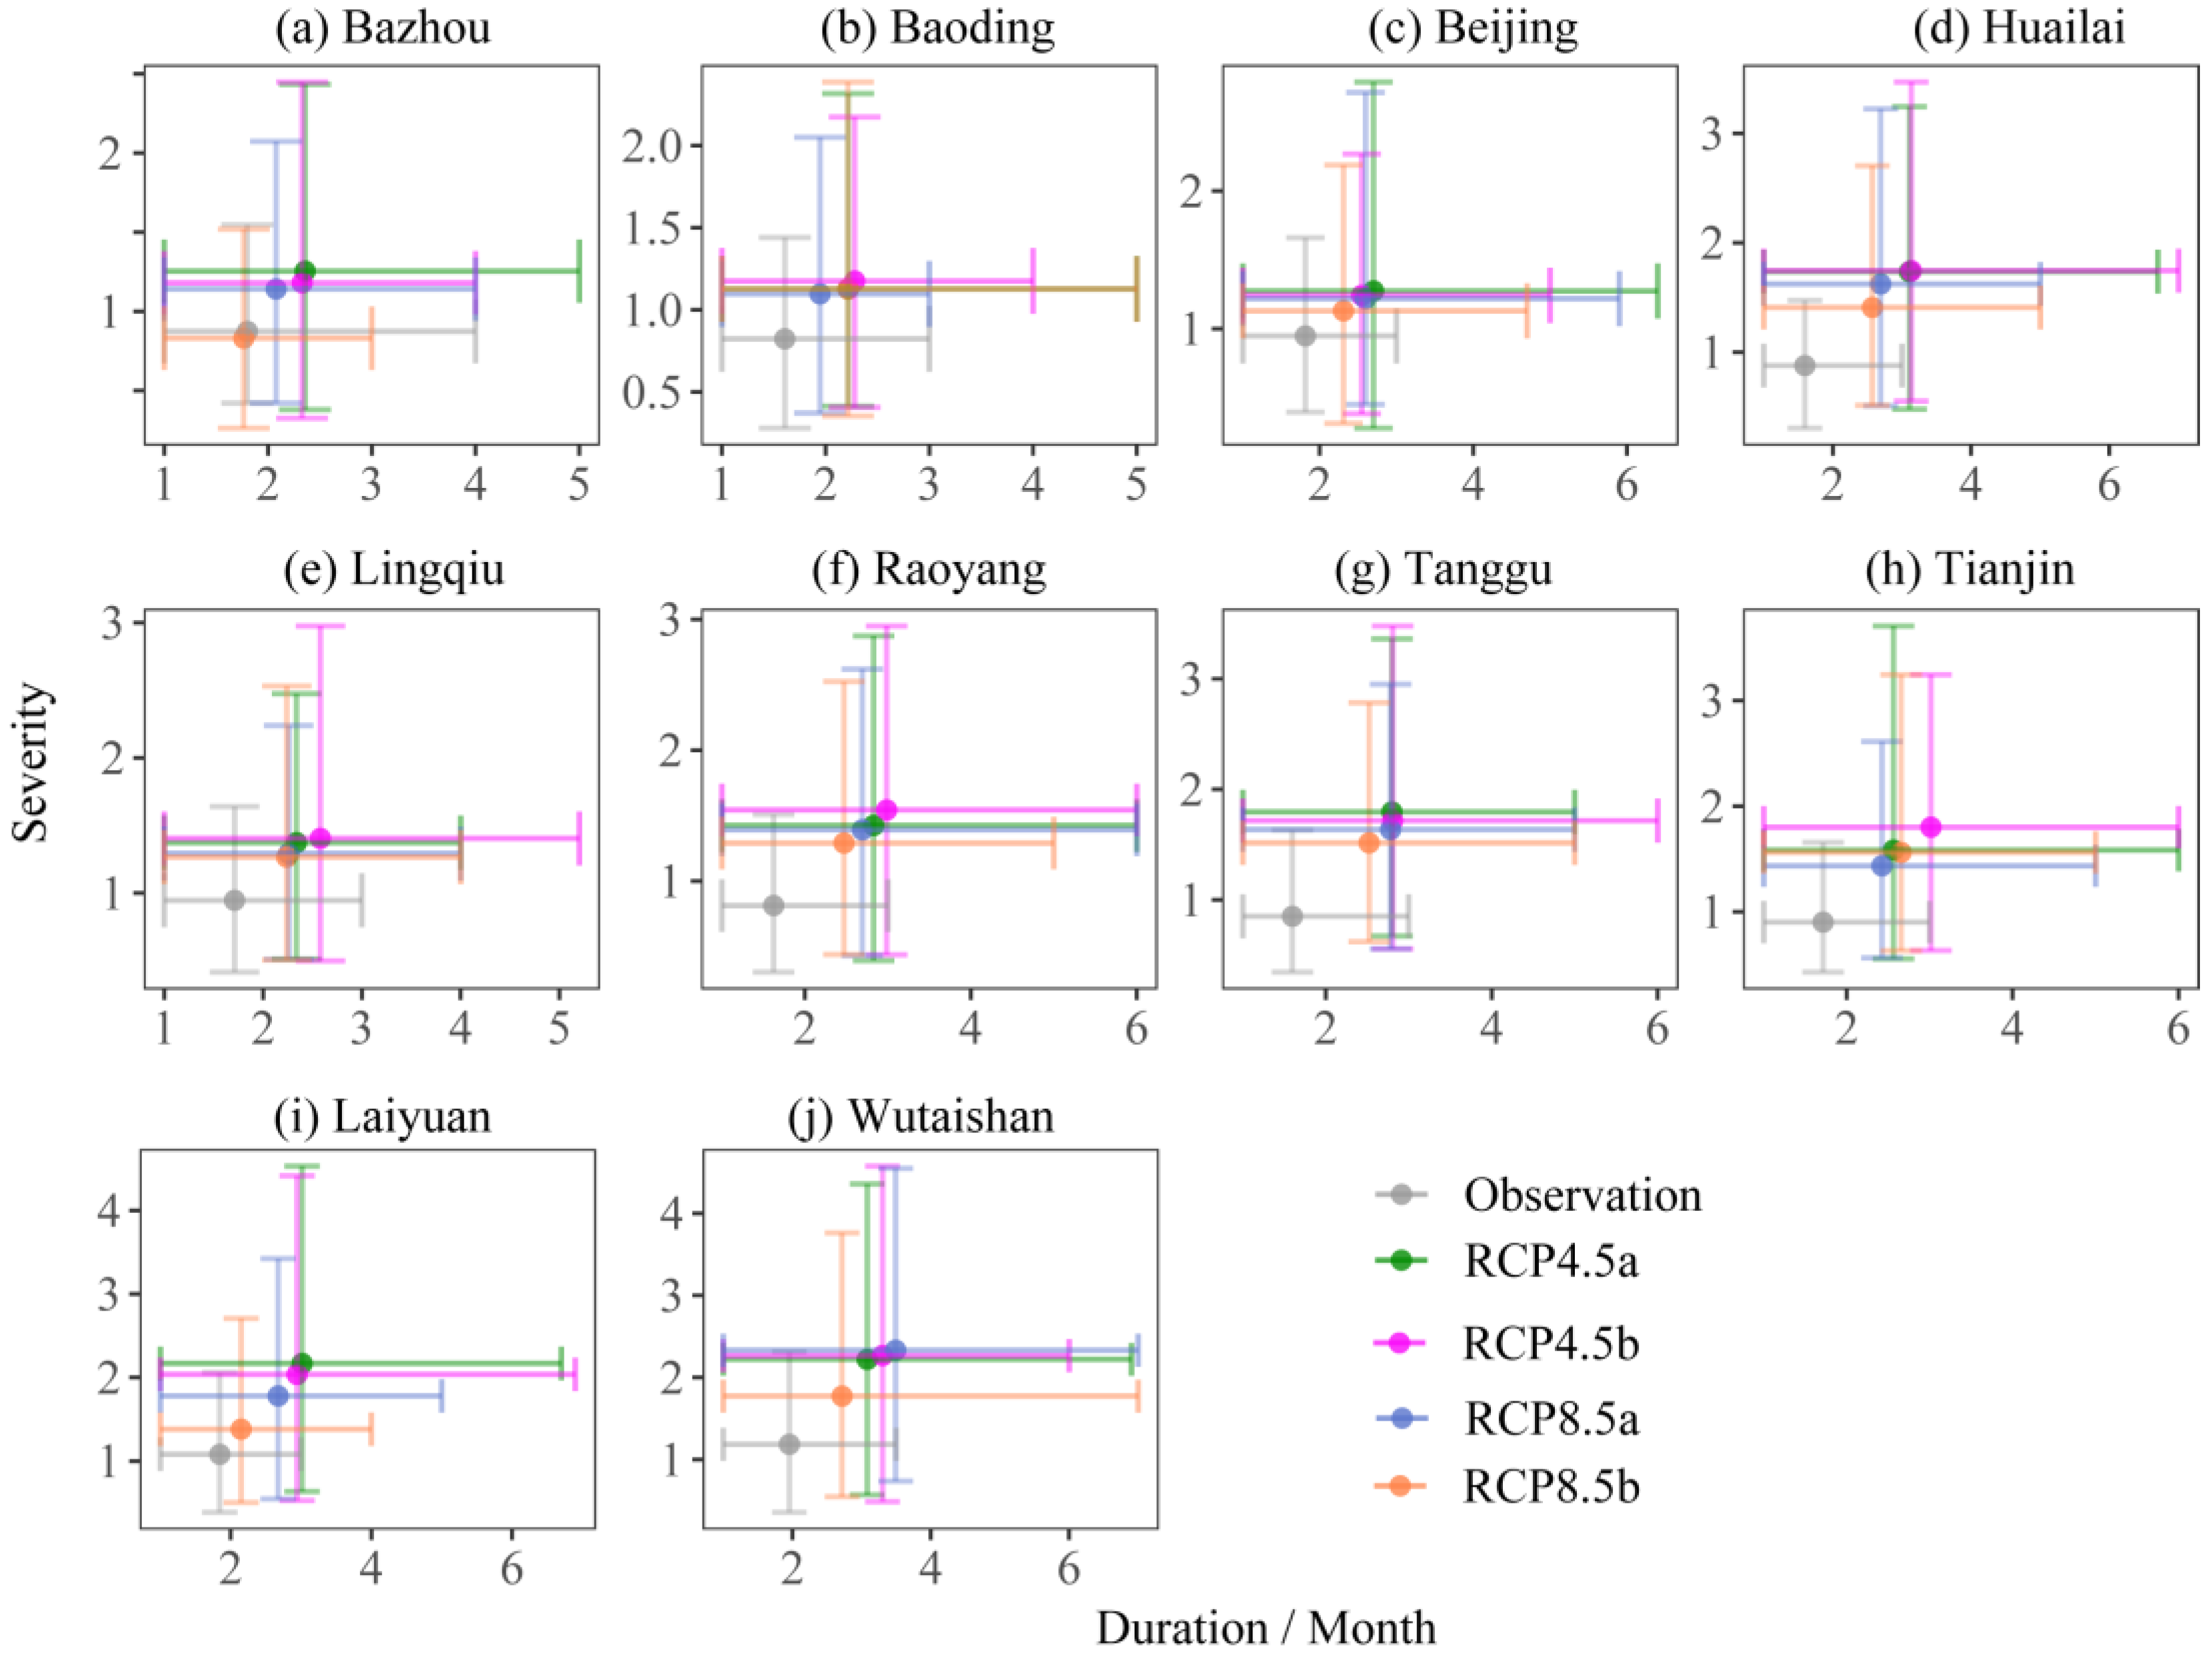
4.2. Future Intensification of Drought Characteristics in the DRB

Our analysis suggests a future intensification of meteorological drought in the DRB, characterized by prolonged durations and an increased severity of drought events. Using the Standardized Precipitation Index (SPI) and SPEI, Spinoni et al. [10] also observed an increase in the intensity of drought events in North China during this century. Similarly, Su et al. [55] found the same conclusion using SPEI and the Palmer Drought Severity Index (PDSI), although the latter, which considers the current water amount in the basin, did not correlate as strongly with drought-induced losses as SPEI did. Regarding drought duration, Zeng et al. [26] revealed that seasonal-scale drought durations in the Hai River Basin will lengthen in the future. This can be attributed to future temperature increases and the enhanced seasonality of precipitation in the DRB, leading to more distinct wet and dry seasons, which create favorable conditions for the occurrence and persistence of drought. Existing research [26] has indicated that under RCP8.5 scenarios, the number of future drought events in northern China will decrease, while under RCP4.5, it will increase, which slightly differs from our findings (Figure S4). This difference may be due to the uncertainty introduced by the diversity of climate models and drought event identification methods. In agreement with Schwalm et al. [56], the time required for drought relief in the basin will increase as climate change accelerates. This implies that future droughts are likely to trigger irreversible damage to ecological and environmental structures and functions, as well as a permanent decline in terrestrial carbon sinks [57,58]. The aforementioned analyses emphasize that meteorological drought in the DRB will become more severe in the future.

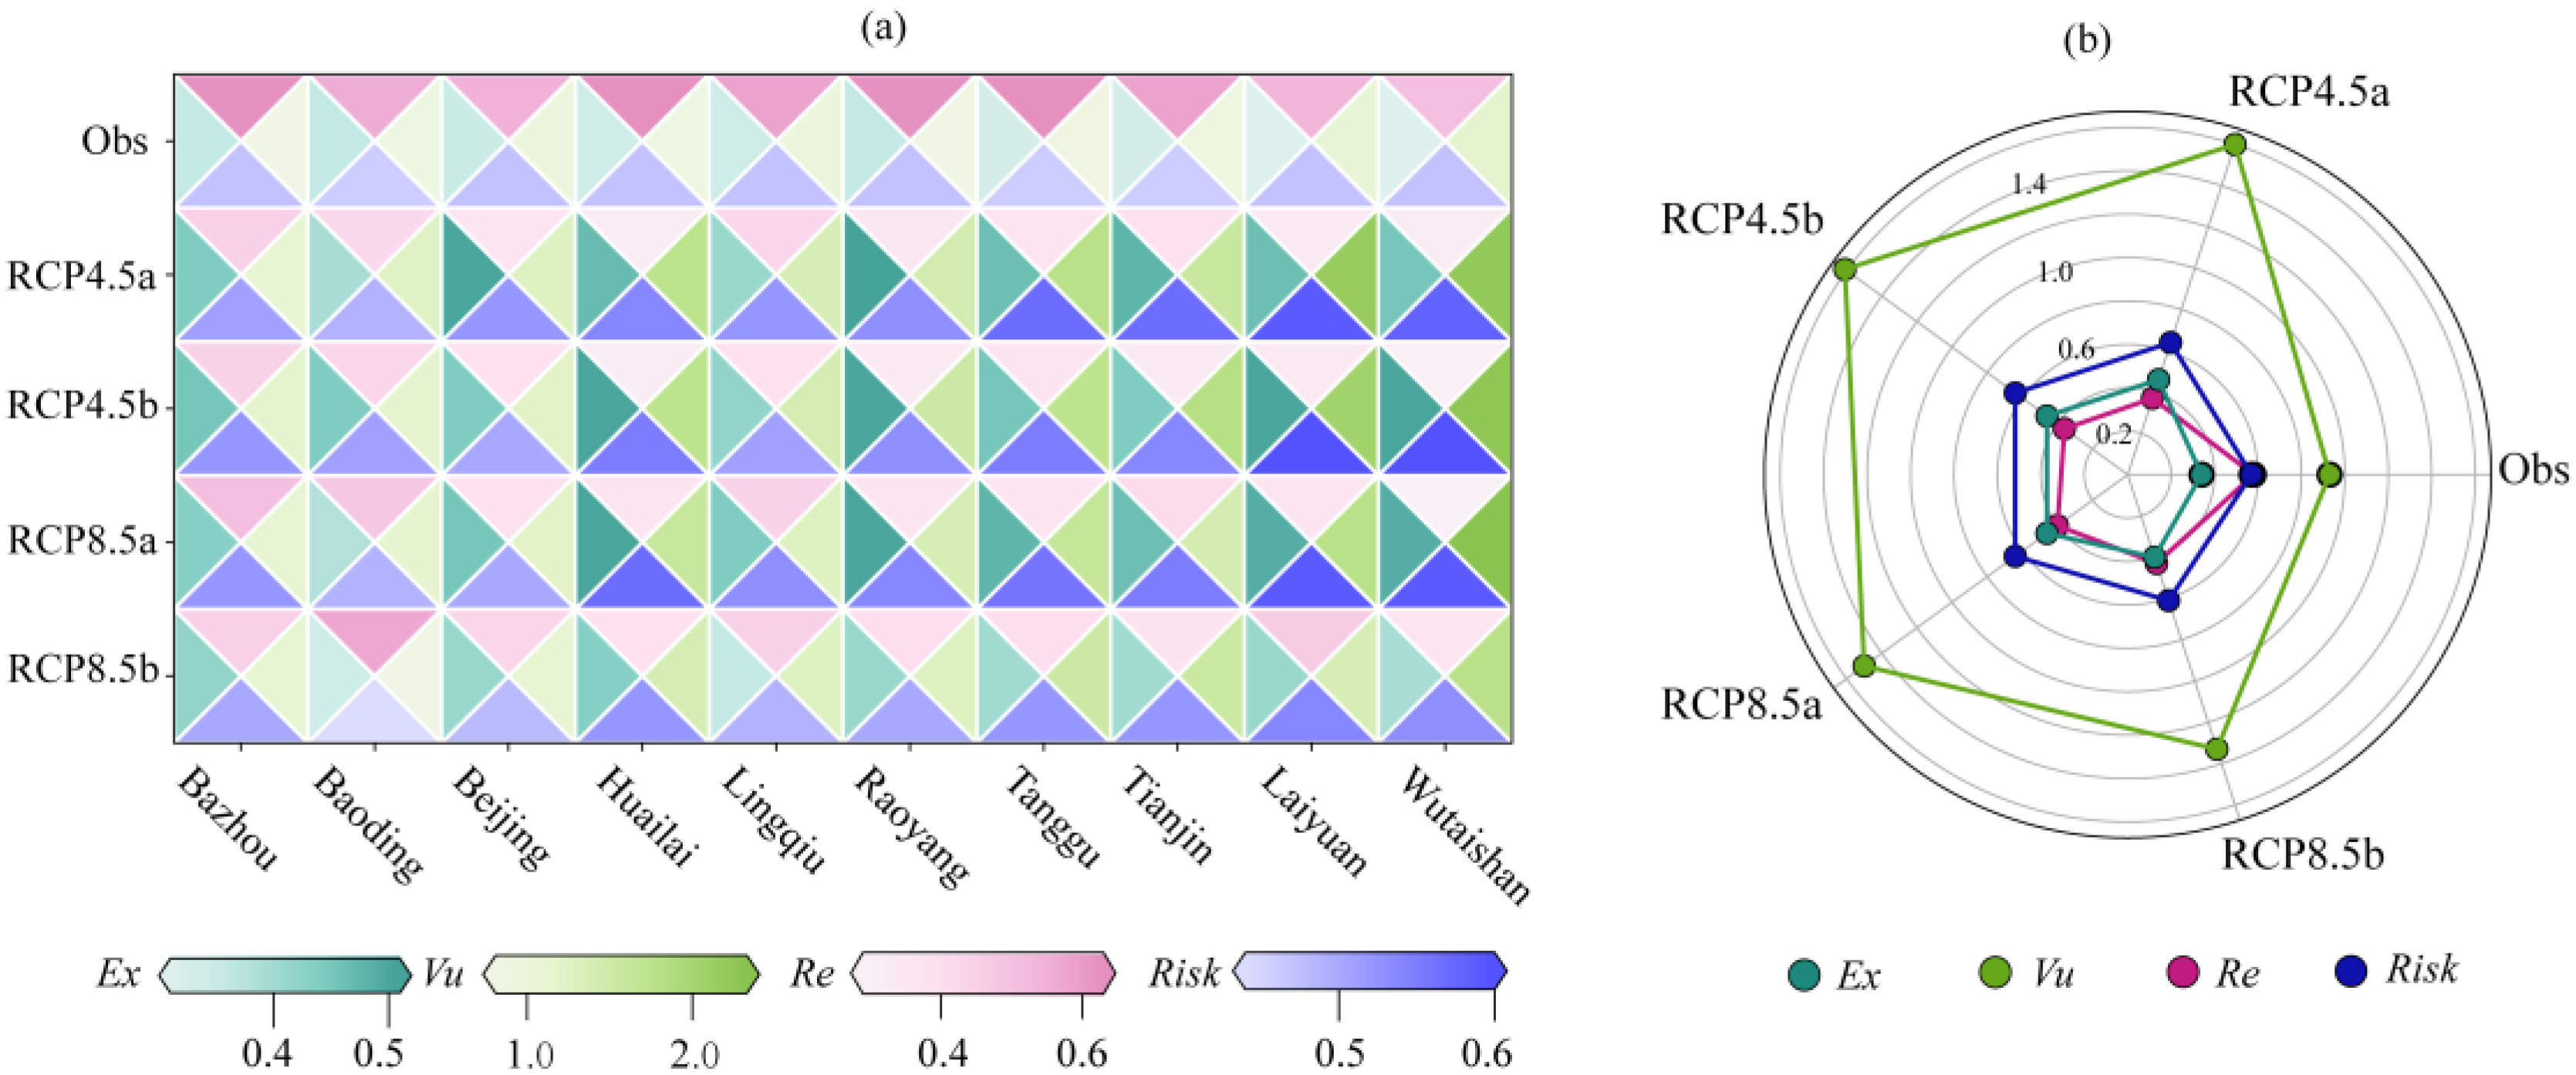
4.3. Future Increased Drought Risk in the DRB Based on EVR

The DRB is projected to face reduced resilience, higher vulnerability, and increased drought exposure, all of which contribute to amplified drought risk. Notably, the risk of meteorological drought under RCP8.5, particularly RCP8.5b, is slightly lower compared to RCP4.5. This is consistent with research findings that found that increased drought exposure [59,60] and vulnerability [61,62,63] lead to amplified drought risk. Unlike current research indicating enhanced resilience [59,60,64], this study and Zeng et al. [26] suggest that future declines in resilience will exacerbate drought risk, which may be related to the threshold of drought resistance. Generally, internal atmospheric variability and global warming-induced changes in weather extremes may amplify regional droughts [60]. Using SPI as a drought indicator, Mu et al. [64] also found a higher drought risk under RCP4.5 compared to RCP8.5 in the DRB. However, Zeng et al. [26] identified an increased risk of future drought under RCP8.5 versus RCP4.5 in North China based on global climate models. The analysis here suggests that RCP8.5 exhibits reduced vulnerability compared to RCP4.5, thereby lowering drought risk. According to the predicted temperature and precipitation changes in DRB (Table S3), the decrease in atmospheric water caused by higher temperatures in RCP8.5 will be offset by more precipitation compared to RCP4.5, which may be the reason for the reduced risk of drought. Nevertheless, the above analysis does not imply that RCP8.5 is superior to RCP4.5, as the climate change hazards are multifaceted. For instance, Kang and Eltahir [65] predict that extreme heatwaves will limit livability in the North China Plain by the end of the century under both RCP4.5 and RCP8.5. The findings further indicated that future drought risk in mountainous regions is projected to be lower compared to the plains. This discrepancy may be attributed to the phenomenon where increased precipitation in the plains surpasses that in the mountainous areas, thereby mitigating the drought conditions (Table S3). Considering that the plain is the densely populated area, it is necessary to further optimize the allocation of water resources within the basin in the future, and even prepare contingency plans for water diversion outside the DRB (through the South to North Water Diversion Project) to eliminate the drought risk caused by climate change.

4.4. Limitations

This study has the following limitations: (1) To validate the applicability of bias correction methods in drought index calculation, only high-resolution climate models with good performance during the observed period were used. Future research could incorporate other model ensembles and conduct drought attribution analysis. (2) The study relies on offline climate model output, neglecting the vegetation’s leaf resistance response to CO2, which may lead to an overestimation of drought risk. Future work could explore the regulatory mechanisms of vegetation in drought [66,67]. (3) Meteorological drought can easily trigger secondary disasters, forming complex disaster chains with nonlinear characteristics and multi-level interactions. Accurately and comprehensively assessing drought risk remains an urgent scientific challenge [68]. Future studies could integrate dimensions such as disaster-prone environments and the socio-economic attributes of affected entities to fully reflect drought risk [20].

5. Conclusions

This study employs the SPEI1 index to represent meteorological drought and uses the corrected output of the HADGEM3-RA model to extract drought events through a combination of pooling and exclusion based on run theory. It analyzes drought characteristics in the DRB under warming scenarios and uses the EVR to assess future meteorological drought risk. The main conclusions are as follows:
(1)
The duration and number of drought events are sensitive indicators for ρ a , while the duration, severity, and number of events are sensitive to r d s . After pooling and exclusion, the average station duration increased from 1.58 to 1.73 months, severity rose from 0.82 to 0.93, and the number of drought events decreased from 96 to 83.
(2)
Future droughts in the DRB are expected to intensify, characterized by longer durations and greater intensities. Compared to the observed period, the projected duration of drought events will increase from 1–4 to 1–7 months, and severity will rise from 0.2–1.2 to 0.2–4.3. The average peak severity during the observed period, at 1.17, is lower than the future projections under RCP4.5a (RCP8.5a) and RCP4.5b (RCP8.5b) at 1.29 (1.30) and 1.28 (1.23), respectively. The duration of drought development and relief will increase from 0.39 and 0.34 months to over 0.68 and 0.69 months.
(3)
The future DRB is expected to experience reduced resilience, increased vulnerability, and greater exposure, collectively exacerbating the risk of drought events. The risk level is projected to rise from the observed Level I to Levels II-IV in the future, with RCP4.5 surpassing RCP8.5, mountainous regions exceeding plains, and risk factors overall increasing initially before declining over time.
These findings highlight the characteristics of meteorological drought in the DRB under climate change, explain the dynamic risk of drought, and highlight the fact that more targeted emission reduction measures need to be implemented to reduce drought risk, even for RCP 4.5 scenarios.

Supplementary Materials

The following supporting information can be downloaded at https://www.mdpi.com/article/10.3390/agriculture14101781/s1. Figure S1: Comparison of the observed SPEI1 values with the results of different bias correction methods (QM, 3DBC) and RCM for each station. The pink solid line represents a 1:1 line, and the ellipse represents a 95% confidence ellipse; Figure S2: Comparison of (a) SPEI1; (b) SPEI3; (c) SPEI12 Lag1 calculated based on observations from different stations during the 1981–2015 with corresponding RCM, QM, and 3DBC calculation results. Each point represents a station, and the dashed line represents the 1:1 line; Figure S3: Comparison of (a) SPEI1; (b) SPEI3; (c) SPEI12 correlation coefficients of different pairs of stations calculated based on observations during the 1981–2015 with corresponding RCM, QM, and 3DBC calculation results. Each point represents a pair of stations, and the dashed line represents the 1:1 line; Figure S4: Changes in the number of projected drought events in the DRB compared to the observed period; Figure S5: The distribution proportion of the starting seasons for drought events at each station under different scenarios; Table S1: Overview of meteorological stations in the Daqing River Basin (DRB); Table S2: Classification of drought grades according to SPEI; Table S3: Relative change with respect to the base period (1981–2015) in annual average precipitation, and absolute change in annual average Tmax, Tmin at all stations under different scenarios [69,70,71,72,73,74,75,76].

Author Contributions

Conceptualization, methodology, software, validation, formal analysis, investigation, and writing—original draft preparation, M.L.; visualization, supervision, project administration, and funding acquisition, Z.W. All authors have read and agreed to the published version of the manuscript.

Funding

This research was funded by the Basic Scientific Research Special Fund of Central Nonprofit Research Institutes, grant number HKY-JBYW-2023-06, and the Yellow River Institute of Hydraulic Research, grant number HKYSD 202313.

Institutional Review Board Statement

Not applicable.

Data Availability Statement

The climatological data that support the findings of this study during manuscript preparation are available from the first author on reasonable request. The observed daily precipitation, maximum and minimum temperatures were from the China Meteorological Data Network (https://data.cma.cn/, accessed on 27 August 2024). The HADGEM3-RA data were obtained from CORDEX-East Asia (http://cordex-ea.climate.go.kr/, accessed on 27 August 2024).

Acknowledgments

The authors would like to thank the three anonymous reviewers for their valuable feedback on improving this manuscript.

Conflicts of Interest

The authors declare no conflicts of interest.

References

  1. Lee, C.; Zeng, M.; Luo, K. How does climate change affect food security? Evidence from China. Environ. Impact Assess. Rev. 2024, 104, 107324. [Google Scholar] [CrossRef]
  2. Wang, B.; Li, L.C.; Feng, P.Y.; Chen, C.; Luo, J.J.; Harrison, M.T.; Liu, K.; Liu, D.L.; Yu, Q.W.; Guo, X.W.; et al. Probabilistic analysis of drought impact on wheat yield and climate change implications. Weather Clim. Extrem. 2024, 45, 100708. [Google Scholar] [CrossRef]
  3. Li, Z.W.; Sun, F.B.; Wang, H.; Wang, T.T.; Feng, Y. Detecting the interactions between vegetation greenness and drought globally. Atmos. Res. 2024, 304, 107409. [Google Scholar] [CrossRef]
  4. Denissen, J.M.C.; Teuling, A.J.; Pitman, A.J.; Koirala, S.; Migliavacca, M.; Li, W.T.; Reichstein, M.; Winkler, A.J.; Zhan, C.H.; Orth, R. Widespread shift from ecosystem energy to water limitation with climate change. Nat. Clim. Chang. 2022, 12, 677–684. [Google Scholar] [CrossRef]
  5. Douris, J. WMO Atlas of Mortality and Economic Losses from Weather, Climate and Water Extremes (1970–2019); World Meteorological Organization: Geneva, Switzerland, 2021. [Google Scholar]
  6. Salvador, C.; Nieto, R.; Kapwata, T.; Wright, C.Y.; Reason, C.; Gimeno, L.; Vicedo-Cabrera, A.M. Analyzing the effects of drought at different time scales on cause-specific mortality in South Africa. Environ. Res. Lett. 2024, 19, 054022. [Google Scholar] [CrossRef]
  7. IPCC. Climate Change 2021: The Physical Science Basis. Contribution of Working Group I to the Sixth Assessment Report of the Intergovernmental Panel on Climate Change; IPCC: Cambridge, UK, 2021. [Google Scholar]
  8. Wan, L.L.; Bento, V.A.; Qu, Y.P.; Qiu, J.X.; Song, H.Q.; Zhang, R.R.; Wu, X.P.; Xu, F.; Lu, J.K.; Wang, Q.F. Drought characteristics and dominant factors across China: Insights from high-resolution daily SPEI dataset between 1979 and 2018. Sci. Total Environ. 2023, 901, 166362. [Google Scholar] [CrossRef]
  9. Cook, B.I.; Mankin, J.S.; Marvel, K.; Williams, A.P.; Smerdon, J.E.; Anchukaitis, K.J. Twenty-First Century Drought Projections in the CMIP6 Forcing Scenarios. Earth’s Futur. 2020, 8, e2019EF001461. [Google Scholar] [CrossRef]
  10. Spinoni, J.; Barbosa, P.; Bucchignani, E.; Cassano, J.; Cavazos, T.; Christensen, J.H.; Christensen, O.B.; Coppola, E.; Evans, J.; Geyer, B.; et al. Future Global Meteorological Drought Hot Spots: A Study Based on CORDEX Data. J. Clim. 2020, 33, 3635–3661. [Google Scholar] [CrossRef]
  11. Vicente-Serrano, S.M.; Quiring, S.M.; Peña-Gallardo, M.; Yuan, S.S.; Domínguez-Castro, F. A review of environmental droughts; increased risk under global warming? Earth Sci. Rev. 2020, 201, 102953. [Google Scholar] [CrossRef]
  12. Chen, N.C.; Li, R.H.; Zhang, X.; Yang, C.; Wang, X.P.; Zeng, L.L.; Tang, S.J.; Wang, W.; Li, D.R.; Niyogi, D. Drought propagation in Northern China Plain: A comparative analysis of GLDAS and MERRA-2 datasets. J. Hydrol. 2020, 588, 125026. [Google Scholar] [CrossRef]
  13. Loon, V.; Anne, F. Hydrological drought explained. Wiley Interdiscip. Rev. Water 2015, 2, 359–392. [Google Scholar] [CrossRef]
  14. Wu, J.F.; Chen, X.H.; Yao, H.X.; Zhang, D.J. Multi-timescale assessment of propagation thresholds from meteorological to hydrological drought. Sci. Total Environ. 2021, 765, 144232. [Google Scholar] [CrossRef] [PubMed]
  15. Liu, Y.; Shan, F.Z.; Yue, H.; Wang, X.; Fan, Y.H. Global analysis of the correlation and propagation among meteorological, agricultural, surface water, and groundwater droughts. J. Environ. Manag. 2023, 333, 117460. [Google Scholar] [CrossRef] [PubMed]
  16. Guo, Y.; Huang, S.Z.; Huang, Q.; Wang, H.; Wang, L.; Fang, W. Copulas-based bivariate socioeconomic drought dynamic risk assessment in a changing environment. J. Hydrol. 2019, 575, 1052–1064. [Google Scholar] [CrossRef]
  17. Dai, R.; Huang, J.L.; Chen, Z.Y.; Zhou, J.; Havea, P.H. Impacts of anthropogenic climate change on meteorological drought in China. Front. Earth Sci. 2024, 12, 1369523. [Google Scholar] [CrossRef]
  18. Ukkola, A.M.; De Kauwe, M.G.; Roderick, M.L.; Abramowitz, G.; Pitman, A.J. Robust future changes in meteorological drought in CMIP6 projections despite uncertainty in precipitation. Geophys. Res. Lett. 2020, 47, e2020GL087820. [Google Scholar] [CrossRef]
  19. Tootoonchi, F.; Sadegh, M.; Haerter, J.O.; Räty, O.; Grabs, T.; Teutschbein, C. Copulas for hydroclimatic analysis: A practice-oriented overview. Wiley Interdiscip. Rev. Water 2022, 9, e1579. [Google Scholar] [CrossRef]
  20. Xu, W.T.; Tang, M.; Jin, J.L.; Xie, Q.C.; Hu, Y.S. Concept and method of drought disaster risk measurement based on drought propagation level--a case study of AnHui Province. Ecol. Indic. 2024, 166, 112286. [Google Scholar] [CrossRef]
  21. Bera, D.; Dutta, D. Analysing spatio-temporal drought characteristics and copula-based return period in Indian Gangetic Basin (1901–2021). Environ. Sci. Pollut. Res. 2024, 31, 22471–22493. [Google Scholar] [CrossRef]
  22. Simsek, O.; Bazrafshan, O.; Azhdari, Z. A 3-D copula for risk analysis of meteorological drought in the Black Sea Region. Theor. Appl. Climatol. 2024, 155, 1185–1200. [Google Scholar] [CrossRef]
  23. Dai, M.; Huang, S.Z.; Huang, Q.; Leng, G.Y.; Guo, Y.; Wang, L.; Fang, W.; Li, P.; Zheng, X.D. Assessing agricultural drought risk and its dynamic evolution characteristics. Agric. Water Manag. 2020, 231, 106003. [Google Scholar] [CrossRef]
  24. Hazbavi, Z.; Baartman, J.E.M.; Nunes, J.P.; Keesstra, S.D.; Sadeghi, S.H. Changeability of reliability, resilience and vulnerability indicators with respect to drought patterns. Ecol. Indic. 2018, 87, 196–208. [Google Scholar] [CrossRef]
  25. Sadeghi, S.H.; Chamani, R.; Kalehhouei, M.; Haji, K. Health variability based on SPI and estimating median and mean health indices in watersheds and townships of Kermanshah Province, Iran. Environ. Dev. Sustain. 2024, 1–21. [Google Scholar] [CrossRef]
  26. Zeng, P.; Sun, F.Y.; Liu, Y.Y.; Che, Y. Future river basin health assessment through reliability-resilience-vulnerability: Thresholds of multiple dryness conditions. Sci. Total Environ. 2020, 741, 140395. [Google Scholar] [CrossRef] [PubMed]
  27. Raposo, V.D.M.B.; Costa, V.A.F.; Rodrigues, A.F. A review of recent developments on drought characterization, propagation, and influential factors. Sci. Total Environ. 2023, 898, 165550. [Google Scholar] [CrossRef] [PubMed]
  28. Tu, X.J.; Du, Y.L.; Singh, V.P.; Chen, X.H.; Zhao, Y.; Ma, M.W.; Li, K.; Wu, H.O. Bivariate design of hydrological droughts and their alterations under a changing environment. J. Hydrol. Eng. 2019, 24, 04019015. [Google Scholar] [CrossRef]
  29. Guo, Y.; Huang, S.Z.; Huang, Q.; Leng, G.Y.; Fang, W.; Wang, L.; Wang, H. Propagation thresholds of meteorological drought for triggering hydrological drought at various levels. Sci. Total Environ. 2020, 712, 136502. [Google Scholar] [CrossRef]
  30. Zhang, L.; Zhou, T. Drought over East Asia: A review. J. Clim. 2015, 28, 3375–3399. [Google Scholar] [CrossRef]
  31. Lv, M.C.; Gao, X.P.; Liu, Y.Z.; Ju, W.H.; Sun, B.W.; Li, W.J.; Zhou, X.S. The impact of using different probability representations in application of equidistant quantile matching for bias adjustment of daily precipitation over the Daqing River Basin, North China. Int. J. Climatol. 2022, 42, 777–796. [Google Scholar] [CrossRef]
  32. Zhang, L.X.; Zhou, T.J.; Wu, P.L.; Chen, X.L. Potential predictability of North China summer drought. J. Clim. 2019, 32, 7247–7264. [Google Scholar] [CrossRef]
  33. Xing, Y.C.; Li, Y.Z.; Bai, P.; Zhuang, J.C.; Feng, A.Q.; Huang, M.J.; Yan, H.W. Spatiotemporal variations of meteorological drought and its dominant factors in different climate regions for the first two decades of the twenty-first century. Theor. Appl. Climatol. 2024, 155, 3631–3645. [Google Scholar] [CrossRef]
  34. Guo, E.L.; Wang, Y.F.; Jirigala, B.; Jin, E. Spatiotemporal variations of precipitation concentration and their potential links to drought in mainland China. J. Clean. Prod. 2020, 267, 122004. [Google Scholar] [CrossRef]
  35. Gao, X.P.; Lv, M.C.; Liu, Y.Z.; Sun, B.W. Precipitation projection over Daqing River Basin (North China) considering the evolution of dependence structures. Environ. Sci. Pollut. Res. 2022, 29, 5415–5430. [Google Scholar] [CrossRef] [PubMed]
  36. QX/T 118-2020; Meteorological Observation Data Quality Control. China Meteorological Administration: Bejing, China, 2020.
  37. Davies, T.; Cullen, M.J.P.; Malcolm, A.J.; Mawson, M.H.; Staniforth, A.; White, A.A.; Wood, N. A new dynamical core for the Met Office’s global and regional modelling of the atmosphere. Q. J. R. Meteorol. Soc. 2005, 131, 1759–1782. [Google Scholar] [CrossRef]
  38. Park, C.; Min, S. Multi-RCM near-term projections of summer climate extremes over East Asia. Clim. Dyn. 2019, 52, 4937–4952. [Google Scholar] [CrossRef]
  39. Xu, Y.F.; Li, T.; Xu, M.; Tan, L.; Shen, S.H. Assessing Climate Change Effects on Winter Wheat Production in the 3H Plain: Insights from Bias-Corrected CMIP6 Projections. Agriculture 2024, 14, 469. [Google Scholar] [CrossRef]
  40. Mehrotra, R.; Sharma, A. A resampling approach for correcting systematic spatiotemporal biases for multiple variables in a changing climate. Water Resour. Res. 2019, 55, 754–770. [Google Scholar] [CrossRef]
  41. Spuler, F.R.; Wessel, J.B.; Comyn-Platt, E.; Varndell, J.; Cagnazzo, C. ibicus: A new open-source Python package and comprehensive interface for statistical bias adjustment and evaluation in climate modelling (v1.0.1). Geosci. Model Dev. 2024, 17, 1249–1269. [Google Scholar] [CrossRef]
  42. Zhang, W.J.; Guo, H.Z.; Wu, Y.J.; Zhang, Z.Z.; Yin, H.; Feng, K.; Liu, J.; Fu, B. Temporal and Spatial Evolution of Meteorological Drought in Inner Mongolia Inland River Basin and Its Driving Factors. Sustainability 2024, 16, 2212. [Google Scholar] [CrossRef]
  43. Beguería, S.; Vicente-Serrano, S.M.; Reig, F.; Latorre, B. Standardized precipitation evapotranspiration index (SPEI) revisited: Parameter fitting, evapotranspiration models, tools, datasets and drought monitoring. Int. J. Climatol. 2014, 34, 3001–3023. [Google Scholar] [CrossRef]
  44. Li, Y.S.; Chen, Y.N.; Chen, Y.P.; Duan, W.L.; Wang, J.Y.; Wang, X. Characteristics of Dry and Wet Changes and Future Trends in the Tarim Evapotranspiration Index. Water 2024, 16, 880. [Google Scholar] [CrossRef]
  45. Ault, T.R. On the essentials of drought in a changing climate. Science 2020, 368, 256–260. [Google Scholar] [CrossRef] [PubMed]
  46. Allen, R.G.; Pereira, L.S.; Raes, D.; Smith, M. Crop Evapotranspiration-Guidelines for Computing Crop Water Requirements-FAO Irrigation and Drainage Paper 56; Food and Agriculture Organization of the United Nations: Rome, Italy, 1998. [Google Scholar]
  47. Hargreaves, G.H. Defining and using reference evapotranspiration. J. Irrig. Drain. Eng. 1994, 120, 1132–1139. [Google Scholar] [CrossRef]
  48. Yang, Y.; Chen, R.S.; Han, C.T.; Liu, Z.W. Evaluation of 18 models for calculating potential evapotranspiration in different climatic zones of China. Agric. Water Manag. 2021, 244, 106545. [Google Scholar] [CrossRef]
  49. Madsen, H.; Rosbjerg, D. On the modelling of extreme droughts. In IAHS Publications: Series of Proceedings and Reports; Intern Association Hydrological Sciences: Wallingford, UK, 1995; Volume 231, pp. 377–386. [Google Scholar]
  50. Nguyen, H.; Mehrotra, R.; Sharma, A. Assessment of climate change impacts on reservoir storage reliability, resilience, and vulnerability using a multivariate frequency bias correction approach. Water Resour. Res. 2020, 56, e2019WR026022. [Google Scholar] [CrossRef]
  51. Machiwal, D.; Jha, M.K.; Gupta, A. Development of a rainfall Stability Index using probabilistic indicators. Ecol. Indic. 2020, 115, 106406. [Google Scholar] [CrossRef]
  52. Guo, Y.; Wang, X.; Zhou, L.; Zheng, W. Configuration and efficiency evaluation of the best management practices to control nitrogen loss in the watershed. Zhongguo Huanjing Kexue 2021, 41, 860. (In Chinese) [Google Scholar]
  53. Su, X.; Liang, X.; Wu, H.; Jiang, T.; Liu, Y.; Liu, X. Construction of comprehensive drought index representing ecological condition and drought risk analysis. Water Resour. Prot. 2023, 39, 50–58+100. (In Chinese) [Google Scholar]
  54. Wiegand, A.N.; Christopher, W.; Neil, T. A systematic approach for modelling quantitative lake ecosystem data to facilitate proactive urban lake management. Environ. Syst. Res. 2013, 2, 3. [Google Scholar] [CrossRef]
  55. Su, B.D.; Huang, J.L.; Fischer, T.; Wang, Y.J.; Kundzewicz, Z.W.; Zhai, J.Q.; Sun, H.M.; Wang, A.Q.; Zeng, X.F.; Wang, G.J.; et al. Drought losses in China might double between the 1.5 °C and 2.0 °C warming. Proc. Natl. Acad. Sci. USA 2018, 115, 10600–10605. [Google Scholar] [CrossRef]
  56. Schwalm, C.R.; Anderegg, W.R.L.; Michalak, A.M.; Fisher, J.B.; Biondi, F.; Koch, G.; Litvak, M.; Ogle, K.; Shaw, J.D.; Wolf, A.; et al. Global patterns of drought recovery. Nature 2017, 548, 202–205. [Google Scholar] [CrossRef] [PubMed]
  57. Moss, W.E.; Crausbay, S.D.; Rangwala, I.; Wason, J.W.; Trauernicht, C.; Stevens-Rumann, C.S.; Sala, A.; Rottler, C.M.; Pederson, G.T.; Miller, B.W.; et al. Drought as an emergent driver of ecological transformation in the twenty-first century. BioScience 2024, 74, 524–538. [Google Scholar] [CrossRef]
  58. Liu, M.; Trugman, A.T.; Peñuelas, J.; Anderegg, W.R.L. Climate-driven disturbances amplify forest drought sensitivity. Nat. Clim. Chang. 2024, 14, 746–752. [Google Scholar] [CrossRef]
  59. Polat, C.C.; Can, G.M. Meteorological and Agricultural Drought Risk Assessment via Kaplan–Meier Survivability Estimator. Agriculture 2024, 14, 503. [Google Scholar] [CrossRef]
  60. Chen, H.; Sun, J. Increased population exposure to extreme droughts in China due to 0.5 °C of additional warming. Environ. Res. Lett. 2019, 14, 064011. [Google Scholar] [CrossRef]
  61. UNISDR. Global Assessment Report on Disaster Risk Reduction 2019; UN Office for Disaster Risk Reduction: Geneva, Switzerland, 2019. [Google Scholar]
  62. Felipe, A.J.B.; Alejo, L.A.; Balderama, O.F.; Rosete, E.A. Climate change intensifies the drought vulnerability of river basins: A case of the Magat River Basin. J. Water Clim. Chang. 2023, 14, 1012–1038. [Google Scholar] [CrossRef]
  63. Li, J.N.; Chou, J.M.; Zhao, W.X.; Xu, Y.; Hao, Y.D.; Li, Y.M. Future drought and flood vulnerability and risk prediction of China’s agroecosystem under climate change. Sustainability 2022, 14, 10069. [Google Scholar] [CrossRef]
  64. Mu, W.B.; Yu, F.L.; Han, Y.P.; Ma, W.X.; Zhao, Y. Meteorological drought risk in the Daqing River Basin, North China: Current observations and future projections. Stoch. Environ. Res. Risk Assess. 2020, 34, 1795–1811. [Google Scholar] [CrossRef]
  65. Kang, S.; Eltahir, E.A. North China Plain threatened by deadly heatwaves due to climate change and irrigation. Nat. Commun. 2018, 9, 2894. [Google Scholar] [CrossRef]
  66. Song, Y.; Guo, Y.H.; Li, S.J.; Li, W.Y.P.; Jin, X.L. Elevated CO2 concentrations contribute to a closer relationship between vegetation growth and water availability in the Northern Hemisphere mid-latitudes. Environ. Res. Lett. 2024, 19, 084013. [Google Scholar] [CrossRef]
  67. Yang, Y.T.; Roderick, M.L.; Zhang, S.L.; McVicar, T.R.; Donohue, R.J. Hydrologic implications of vegetation response to elevated CO2 in climate projections. Nat. Clim. Chang. 2019, 9, 44–48. [Google Scholar] [CrossRef]
  68. Vicente-Serrano, S.M. Foreword: Drought complexity and assessment under climate change conditions. Cuad. Investig. Geográfica 2016, 42, 7–11. [Google Scholar] [CrossRef]
  69. Cannon, A.J.; Sobie, S.R.; Murdock, T.Q. Bias correction of GCM precipitation by quantile mapping: How well do methods preserve changes in quantiles and extremes? J. Clim. 2015, 28, 6938–6959. [Google Scholar] [CrossRef]
  70. Duan, R.; Huang, G.; Li, Y.; Zhou, X.; Ren, J.; Tian, C. Stepwise clustering future meteorological drought projection and multi-level factorial analysis under climate change: A case study of the Pearl River Basin, China. Environ. Res. 2021, 196, 110368. [Google Scholar] [CrossRef]
  71. Lanzante, J.R.; Dixon, K.W.; Nath, M.J.; Whitlock, C.E.; Adams-Smith, D. Some pitfalls in statistical downscaling of future climate. Bull. Am. Meteorol. Soc. 2018, 99, 791–803. [Google Scholar] [CrossRef]
  72. Maraun, D. Bias correction, quantile mapping, and downscaling: Revisiting the inflation issue. J. Clim. 2013, 26, 2137–2143. [Google Scholar] [CrossRef]
  73. Chen, J.; Brissette, F.P.; Caya, D. Remaining error sources in bias-corrected climate model outputs. Clim. Chang. 2020, 162, 563–582. [Google Scholar] [CrossRef]
  74. Maraun, D.; Widmann, M. Cross-validation of bias-corrected climate simulations is misleading. Hydrol. Earth Syst. Sci. 2018, 22, 4867–4873. [Google Scholar] [CrossRef]
  75. Hao, Z.; Singh, V.P.; Xia, Y. Seasonal drought prediction: Advances, challenges, and future prospects. Rev. Geophys. 2018, 56, 108–141. [Google Scholar] [CrossRef]
  76. Bárdossy, A.; Pegram, G. Multiscale spatial recorrelation of RCM precipitation to produce unbiased climate change scenarios over large areas and small. Water Resour. Res. 2012, 48, 9. [Google Scholar] [CrossRef]
Figure 1. Location of the (a) Hai River Basin; (b) DRB; and (c) the distribution of meteorological stations in the DRB. DEM source: http://www.gscloud.cn/ (accessed on 27 August 2024).
Agriculture 14 01781 g001
Figure 3. Sensitivity analysis of ρ a at different stations during the observed period.
Agriculture 14 01781 g003
Figure 4. Sensitivity analysis of r d s at different stations during the observed period.
Agriculture 14 01781 g004
Figure 5. Comparison of the severity and duration of all drought events at different stations during the observed period and projected scenarios. The dots represent the mean, and the left (bottom) and right (top) error bars represent the 10% and 90% quantiles, respectively.
Agriculture 14 01781 g005
Figure 6. Spatial distribution of peak drought severity at different stations under different scenarios.
Agriculture 14 01781 g006
Figure 7. Resilience, vulnerability, exposure, and static risk of (a) different stations; (b) station average drought events under different scenarios.
Agriculture 14 01781 g007
Figure 8. (a) Resilience; (b) Vulnerability; and (c) Exposure changes under different scenarios.
Agriculture 14 01781 g008
Figure 9. Comprehensive risk (a) value; (b) level; and (c) dynamic changes under different scenarios. The circle represents the comprehensive risk value at each station. The grid data (0.25° × 0.25°) are interpolated using the ‘meteorand’ package in R.
Agriculture 14 01781 g009
Table 1. Classification of comprehensive drought risk levels.
LevelIIIIIIIVV
Interval[0.0, 0.2](0.2, 0.4](0.4, 0.6](0.6, 0.8](0.8, 1.0]
Table 2. Parameters determined for drought event identification at each station.
Station ρ a r d s Station ρ a r d s
Bazhou0.000.14Raoyang0.110.10
Baoding0.130.09Tanggu0.340.12
Beijing0.180.19Tianjin0.140.19
Huailai0.010.11Laiyuan0.200.17
Lingqiu0.210.17Wutaishan0.230.17
Table 3. Comparison of average duration, severity, and number of drought events before and after pooling and excluding at each station during the observed period.
StationBefore PoolingAfter PoolingAfter Excluding
D ¯ S ¯ Num D ¯ S ¯ Num D ¯ S ¯ Num
Bazhou1.580.79991.580.79991.610.8294
Baoding1.760.83901.760.83901.800.8785
Beijing1.620.85911.770.89861.810.9581
Huailai1.470.791001.550.81971.600.8889
Lingqiu1.620.87921.650.87911.710.9583
Raoyang1.410.751041.590.78981.620.8193
Tanggu1.510.751011.510.751011.600.8587
Tianjin1.610.77991.610.77991.720.9081
Laiyuan1.560.84941.680.87901.851.0871
Wutaishan1.670.93861.770.96831.951.1966
Average1.580.82961.650.83931.730.9383
Note: the unit of D ¯ is in months; Num = average number of drought events.
Table 4. Comparison of the development and relief lengths of drought events at different stations under various scenarios (unit: months).
StationObsRCP4.5aRCP4.5bRCP8.5aRCP8.5b
DeReDeReDeReDeReDeRe
Bazhou0.270.340.640.580.680.600.450.500.730.48
Baoding0.360.440.690.670.870.460.430.650.310.46
Beijing0.510.310.970.730.820.730.690.900.470.84
Huailai0.380.211.140.971.121.010.960.730.890.69
Lingqiu0.350.360.410.930.650.930.350.910.520.72
Raoyang0.350.271.140.680.871.110.830.860.830.64
Tanggu0.300.300.940.861.180.630.900.880.840.69
Tianjin0.380.331.050.511.480.540.830.601.090.56
Laiyuan0.490.350.911.110.681.260.561.120.380.77
Wutaishan0.500.451.160.921.251.051.441.050.701.02
Average0.390.340.900.800.960.830.740.820.680.69
Note: De = Development; Re = Relief.
Disclaimer/Publisher’s Note: The statements, opinions and data contained in all publications are solely those of the individual author(s) and contributor(s) and not of MDPI and/or the editor(s). MDPI and/or the editor(s) disclaim responsibility for any injury to people or property resulting from any ideas, methods, instructions or products referred to in the content.

