Abstract
Lawns play a vital role in urban development, but the impact of sod production on soil properties has always been controversial. In this study, we examined the physical, chemical, and biological properties of sod production bases across different regions and years [including northern China (2.5, 3, 5, 6, 8, 10, 12 years), referred to as N-2.5, N-3, etc., and southern China (3, 10, 11, 14, 17 years), referred to as S-3, S-10, etc.], with tall fescue and Kentucky bluegrass planted in the north and bermudagrass or creeping bentgrass planted in the south. Sod production was found to increase soil bulk density while reducing porosity and field capacity, but these effects did not consistently intensify with longer production periods. Except for available phosphorus and available potassium, other soil nutrients (total carbon, total nitrogen, organic matter, alkali-hydrolyzable nitrogen, etc.) were either unaffected or increased at certain time points (S-11, S-14). Prolonged sod production (S-10, S-17) also boosted microbial content. In northern regions, organic matter and total nitrogen were the key factors influencing microbial community structure, whereas in southern regions, alkali-hydrolyzable nitrogen, electrical conductivity, available potassium, and organic matter were most influential. We also found that crop rotation, sand mulching, and deep plowing could enhance soil nutrient content and microbial activity in sod production.
1. Introduction
As people’s living standards continue to improve, the demand for urban greenery is increasing. Lawns offer ecological, aesthetic, and recreational benefits, drawing more and more attention. They are extensively used in environmental protection, urban beautification, and sports fields. Globally, lawns are considered an important indicator of urban environmental quality and societal progress. In recent decades, China’s lawn industry had seen rapid growth in both scale and quality [1]. By 2020, the industry’s annual output reached CNY 200 billion [2], with over 5000 companies involved, more than 50 of which had annual sales exceeding CNY 5 million.
Establishing lawns from grass seeds requires time, but for sports fields needing instant high-quality turf (e.g., football fields), sod installation is optimal. Sod is composed of grass roots, stems, leaves, and attached soil, which can be harvested and transplanted. Commercial sod production, which began in the UK, expanded significantly in the US, where production covers over 162,000 ha with an annual value exceeding USD 3.1 billion [3].
Sod is typically produced in high-quality farmland with turf harvesting, removing 1.5–2.5 cm of nutrient-rich topsoil [4]. As the covering layer of the Earth’s surface, soil is the basic condition for human survival, the cornerstone of the healthy development of national economy, and the foundation of agricultural production and natural ecosystem. Soil contains essential nutrients for plant growth and serving as a source of nutrients. The maintenance and management methods of sod production differs from other crop management systems. Current research focuses on sod maintenance and management [5,6,7], technology improvements [8], and quality enhancement [9,10]. However, the impact of sod production on soil properties has received limited attention. Existing studies suggest sod production increases soil bulk density (BD), reduces soil porosity, and leads to soil compaction [11]. Analysis of soil from continuous sod production for 7–8 years revealed increases in soil microaggregates of 0.001–0.005 mm and <0.001 mm sizes, and a rise in soil surface area, indicating reduced permeability [12]. Nutrient loss also occurs due to soil removal during sod harvesting. For instance, 297 kg ha−1 of nitrogen and 170 kg ha−1 of phosphorus are lost during sod harvesting [13]. A similar study from six sod farms in Türkiye found that soil organic matter was also lost during harvesting [14]. However, Cui et al. reported no significant differences in organic matter, alkali-hydrolyzable nitrogen (AN), and total nitrogen (TN) between sod soils after 7 and 8 years of production and cultivated soil [11]. The effects of sod production on soil chemical properties remain inconsistent across studies.
There have been few related studies about sod production, especially over periods exceeding ten years. Soil microorganisms, vital for nutrient cycling, plant growth, and greenhouse gas regulation, play a key role in agricultural ecosystems [15,16]. In these systems, soil microbes are critical for maintaining productivity, nutrient release, and pathogen suppression. However, no studies have examined the effects of sod production on soil microbial communities.
Due to the different climatic conditions in the south and north of China, the management practices vary between northern and southern China due to climatic differences. Cities like Beijing and Shanghai, early adopters of large-scale lawn construction, have well-established sod production bases. This study measured and analyzed the physical [BD, porosity, field capacity (FC)], chemical [pH, electrical conductivity (EC), total carbon (TC), TN, available phosphorus (AP), available potassium (AK), AN, soil organic matter (SOM), cation exchange capacity (CEC)], and biological [total phospholipid fatty acids (total PLFA), bacteria (B), Gram-positive bacteria (G+), Gram-negative bacteria (G−), fungi (F), arbuscular mycorrhizal fungi (AMF), and actinomycetes)] properties of sod soils in various different regions of the south and north, including the northern (Langfang, Hebei, Xingtai, Beijing) and southern (Shanghai, Jiaxing, Zhejiang) regions over different production periods (2.5th, 3th, 5th, 6th, 8th, 10th, 11th, 12th, 14th, 17th years), in order to comprehensively explain the effect of sod production on soil properties. The research results provide technical and theoretical support for sustainable and healthy sod production and conservation management in the future, and also provide reference for related research and soil protection.
2. Materials and Methods
2.1. Overview of the Sampling Sites
Representative sod production areas were selected in Langfang and Xingtai (Hebei), Beijing, Shanghai, and Jiaxing (Zhejiang). Soil samples were collected from these sod production sites, while nearby agricultural or forest land served as controls. The sampling periods included northern sites (2.5, 3, 5, 6, 8, 10, and 12 years of production), referred to as N-2.5, N-3, etc., and the southern sites (3, 10, 11, 14, and 17 years), referred to as S-3, S-10, etc. The locations, climatic conditions, and planting specifics of the sampling sites are detailed in Table 1 and Table 2.

Table 1.
Locations and climatic conditions of sampling sites.
Table 2.
Planting conditions of sampling sites.
2.2. Soil Sampling and Analysis
The specific sampling bases, production years, and turfgrass types are shown in Table 2. Controls were taken adjacent to each sod production plot. Where plots were in close proximity, such as N-12 and N-6, N-2.5, N-5, and N-10, and S-14 and S-11, a single control was selected per base. Soil samples were collected and analyzed in 2021, covering a total of 20 plots (including controls). In each set of 20 plots, three sample points were randomly selected, and soil was sampled using a ring knife (50.46 mm × 50 mm, 100 cm3) to determine physical properties. Additionally, three 20 m × 20 m quadrats were established in each plot. Soil samples were taken from each plot using an “S” type 5-point method at two depths (0–10 cm and 10–20 cm). The 5 samples from each layer were combined into one composite sample. Samples were sieved through a 1 mm mesh to remove impurities, roots, and stones. Each sample was then split into two portions: one air-dried for chemical analysis, the other stored at −20 °C for PLFA analysis.
Soil BD was measured using the ring knife drying method, and soil porosity was assessed by the ring knife method [17]. FC was determined via the Wilcox method. Soil chemical properties were analyzed following procedures described in “Soil Agricultural and Chemical Analysis” [18]. Soil was diluted with distilled water at a ratio of 1:2.5 or 1:5 for pH and EC measurements. CEC was determined using the ammonium acetate exchange method. TN and TC were analyzed using an elemental analyzer (Elementary Vario EL C/N analyzer, Langenselbold, Germany). SOM was measured with a total organic carbon analyzer (Multi N/C 3100) after sample fumigation. AN was quantified via the alkaline hydrolysis diffusion method. AP was measured using the molybdenum antimony colorimetric method after extraction with 0.5 M NaHCO3. AK was measured by flame photometry.
PLFA were analyzed using a modified method from Bossio and Scow [19]. Total lipids were extracted with chloroform-methanol-citric acid, and PLFAs were obtained through lipid separation and purification using a special SPE column. Lipids were then methylated, dissolved in n-hexane, and transferred to gas chromatography (GC) vials for analysis using Agilent 6890GC/5973MS (SpectraLab Scientifc Inc., Ontario, CA, USA). Quantification was done using PLFA19:0 as the internal standard.
2.3. Statistical Analysis
Due to the wide geographic distribution of the sampling in this experiment, it is impossible to make a direct comparison between years. Therefore, the method of calculating the effect value in meta-analysis, borrowed from van Groenigen et al. [20], was employed. Sod production sites were compared with control plots, and soil properties were analyzed as ratios.
Data were compiled using Excel 2019. Differences in soil indices between production years and controls were evaluated using a t-test (p < 0.05). One-way ANOVA with Duncan’s method (SPSS 15) was used to assess significance in soil index ratios between sod production years and controls (p < 0.05). Redundancy analysis (RDA) of soil physicochemical properties and microbial community structure was performed using Canoco5 software. All results are presented as mean ± standard error.
3. Results
3.1. Effects of Sod Production on Soil Physical Properties
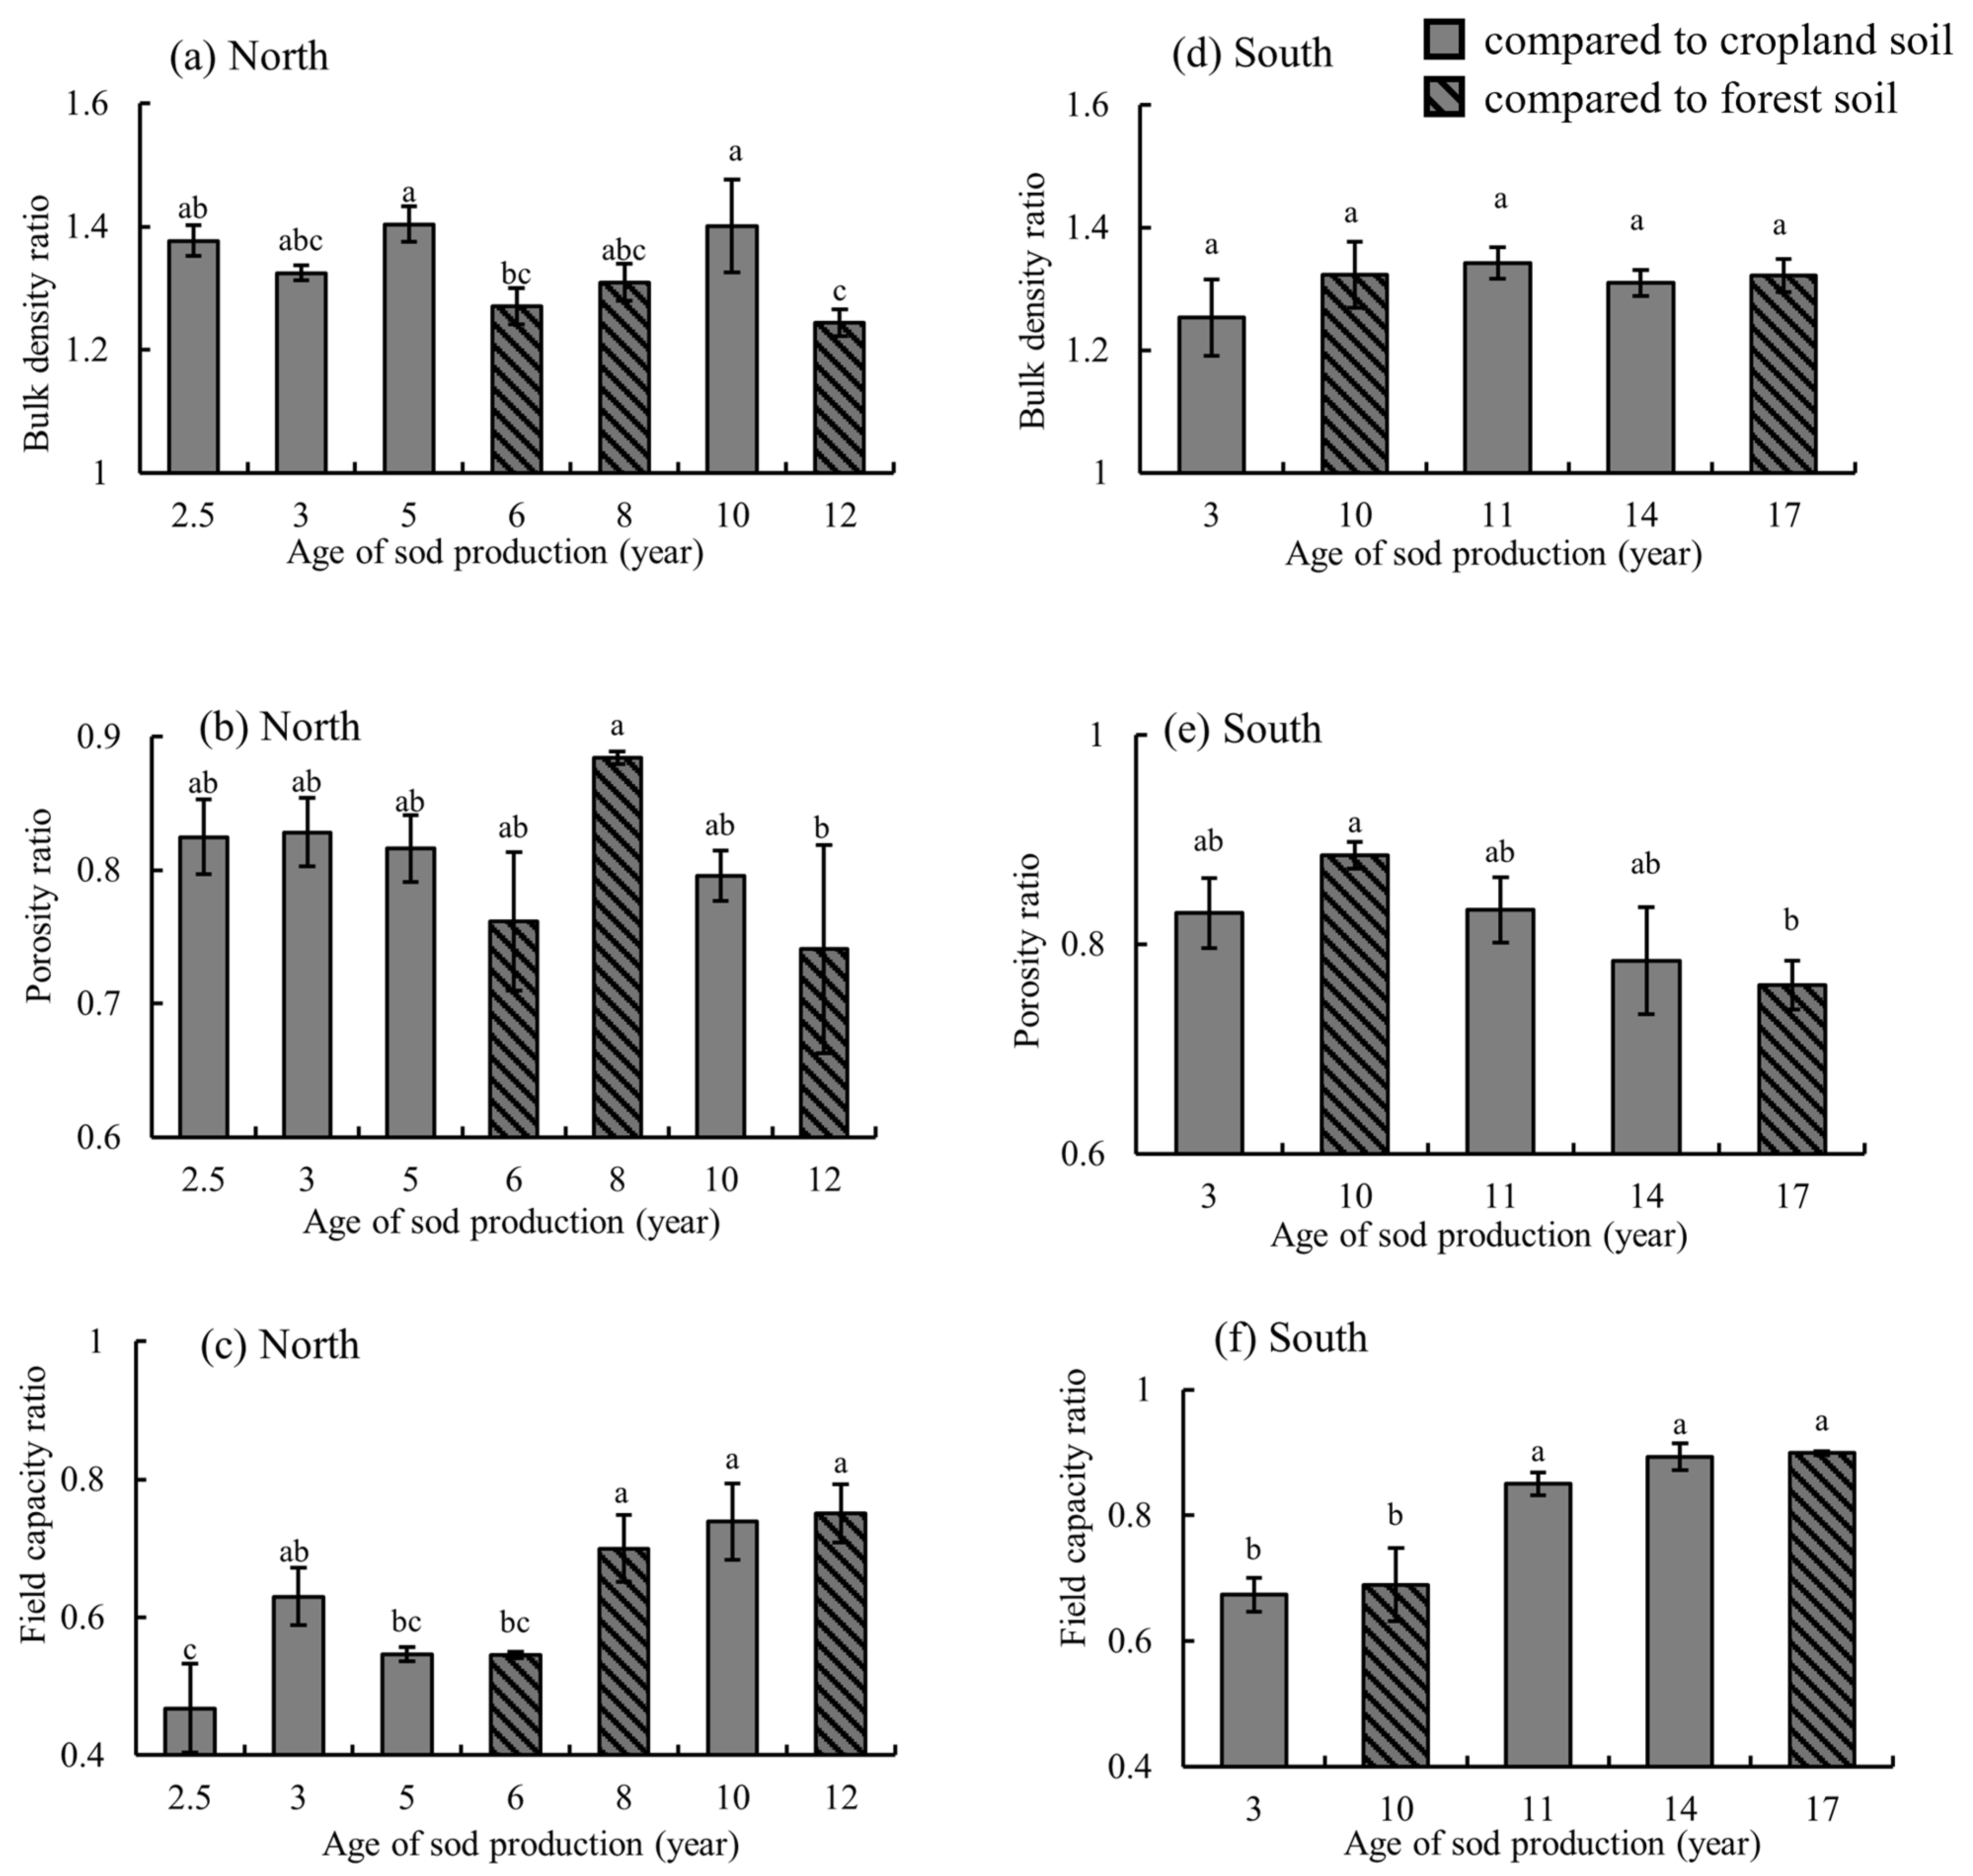
To assess the impact of various sod production durations on soil physical properties, both the absolute values (Table A1 and Table A2) and the ratios of sod production years to the control plots were calculated (Figure 1). In both northern and southern regions, the BD of sod production plots was significantly higher than that of the controls. In the north, BD ranged from 1.59 g/cm3 to 1.77 g/cm3, with N-6 having the highest BD, and the increasing by 1.24 to 1.40 times compared to the control. The increase in BD for N-12 was notably lower compared to N-5 and N-10 (Figure 1a). In the south, BD ranged from 1.52 g/cm3 to 1.62 g/cm3, with S-10 showing the highest BD (Table A2). The BD increase ranged from 1.25 to 1.34 times, with no significant difference in BD changes across sod production years (Figure 1d).

Figure 1.
Variation in soil bulk density (a,d), porosity (b,e), and field capacity (c,f) across different production years in the north and south. For ratios of each sod production plot, N-2.5, N-3, N-5, and N-10 were compared with corn/wheat cropping, S-3, S-11, and S-14 were compared with rice cropping, and N-6, N-8, N-12, S-10, and S-17 were compared with forest soil. Different letters represent significant differences according to Duncan’s test (p < 0.05).
Soil porosity in sod production plots was significantly lower than in the controls. In the north, porosity ranged from 33.64% to 39.77% (Table A1), with ratios between 0.74 and 0.88 (Figure 1b). N-12 showed a significantly greater reduction in porosity compared to N-8. In the south, soil porosity ranged from 32.7% to 38.63%, with S-17 being the lowest and S-10 the highest. The soil porosity ratios ranged from 0.76 to 0.88 (Figure 1e), with S-17 showing a more significant decrease than S-10.
FC in sod production plots was generally lower than in the controls, except for S-11, S-14, and S-17, where no significant differences were observed. In the north, FC ranged from 15.97% to 28.94%, with N-6 having the lowest FC (Table A1). The ratio ranged from 0.47 to 0.75, and the decline lessened with increased production years (Figure 1c). In the south, FC ranged from 21.63% to 29.55%, with S-11 having the lowest FC (Table A2). The FC ratio ranged from 0.67 to 0.90, with S-3 and S-10 showing lower values, while S-11, S-14, and S-17 had higher values.
3.2. Effects of Sod Production on Soil Chemical Properties
Soil chemical properties were analyzed by comparing absolute values (Table A3 and Table A4) and calculating the ratios of sod production years to control plots (Figure 2, Figure 3 and Figure 4). In the north, soil pH in sod production plots ranged from 7.62 to 8.43 (Table A3), with all values being higher than the control (Figure 2a). In the south, pH ranged from 6.81 to 7.63 (Table A4). In S-11 and S-14, pH was lower than the control, while it was higher in S-3, S-10, and S-17 (Figure 2d). In the north, the EC in N-3 was significantly lower than the control, while EC in N-8 (10–20 cm) was higher. Significant differences in EC ratios were observed between N-2.5, N-3, and other years (Figure 2b). In the south, EC was generally higher in sod production plots than the control, with ratios ranging from 1.31 to 1.65, but EC ratio no significant differences were found among the sod production years (Figure 2e). CEC in N-8 (10–20 cm) was lower than the control, while no significant differences were found in other years (Table A3). In the south, CEC was lower in S-14 compared to the control (Table A4), but CEC ratio no significant differences were found among sod production years (Figure 2f).
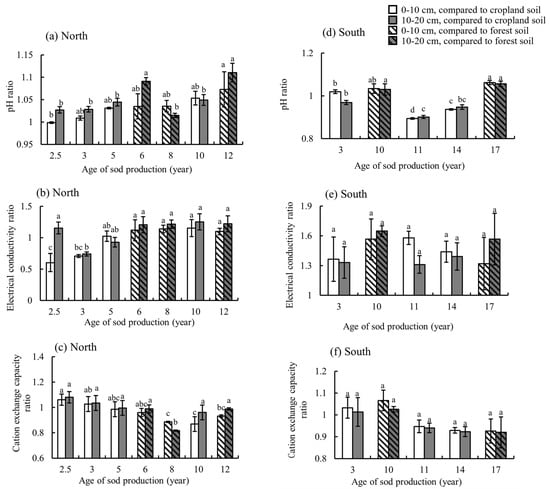
Figure 2.
Variation in soil pH (a,d), electrical conductivity (b,e), and cation exchange capacity (c,f) across different production years in the north and south. For ratios of each sod production plot, N-2.5, N-3, N-5, and N-10 were compared with corn/wheat cropping, S-3, S-11, and S-14 were compared with rice cropping, and N-6, N-8, N-12, S-10, and S-17 were compared with forest soil. Different letters represent significant differences according to Duncan’s test (p < 0.05).

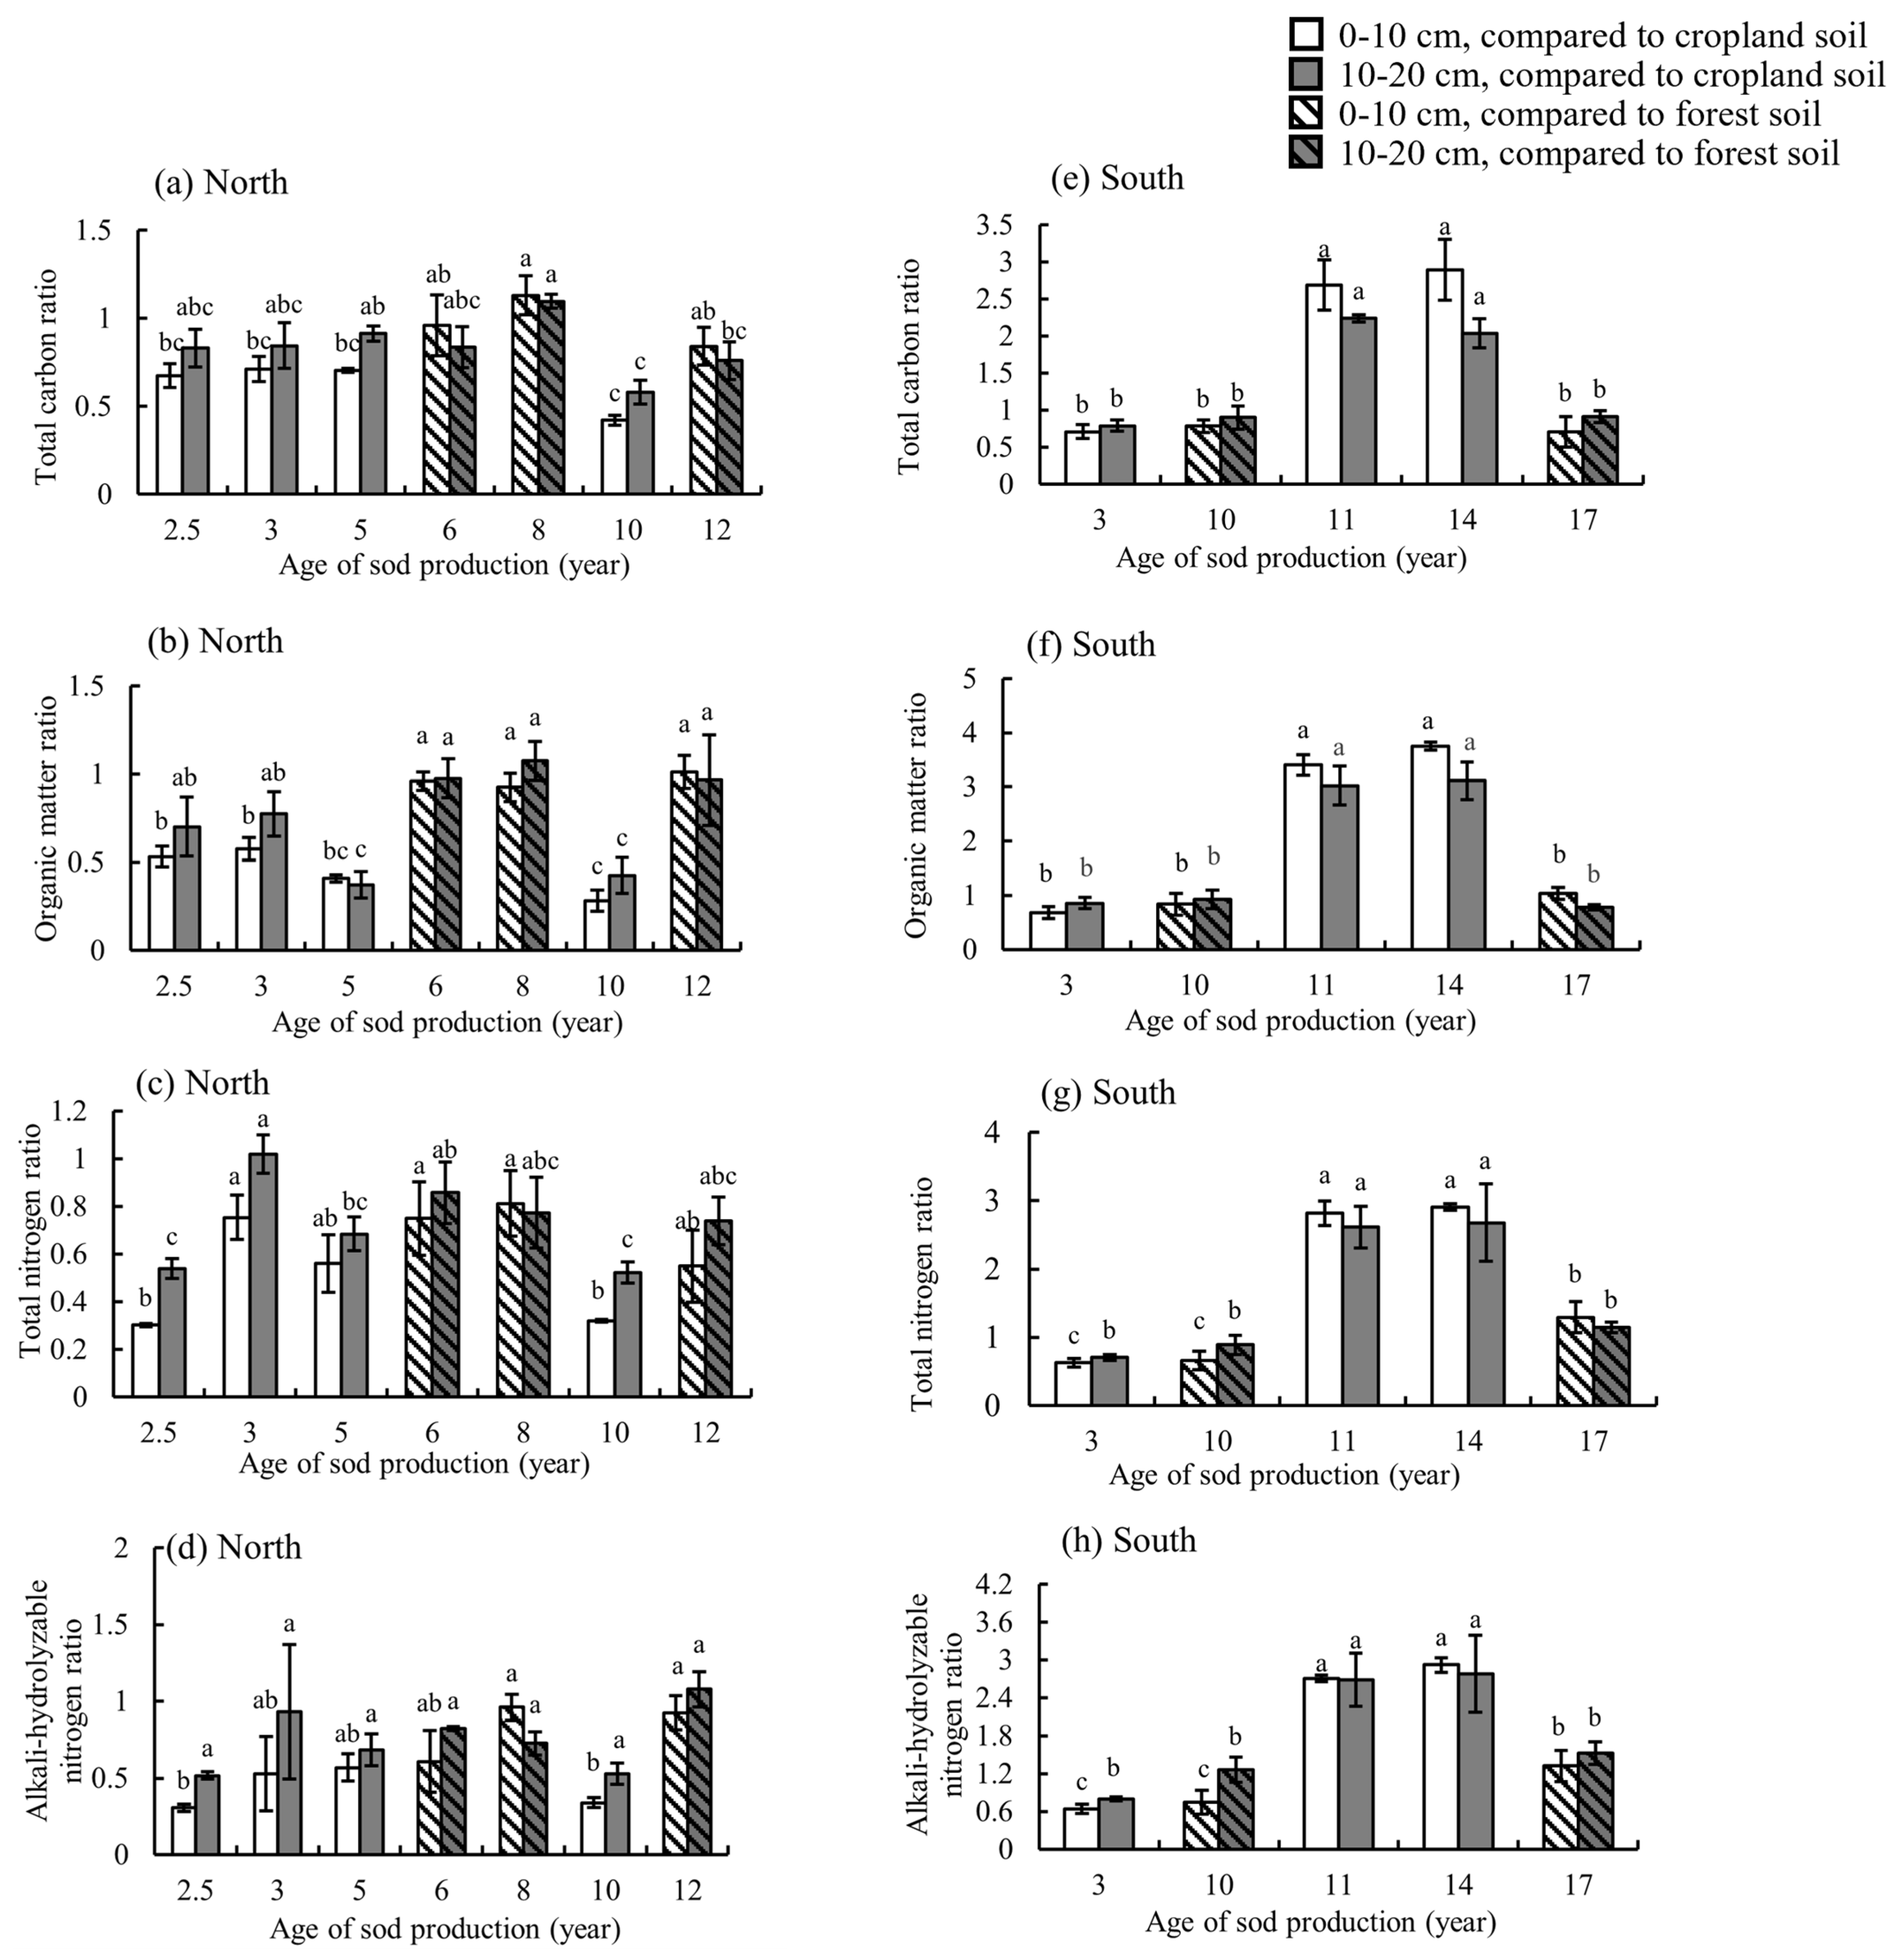
Figure 3.
Variation in soil total carbon (a,e), organic matter (b,f), total nitrogen (c,g), and alkali-hydrolyzable nitrogen (d,h) across different production years in the north and south. For ratios of each sod production plot, N-2.5, N-3, N-5, and N-10 were compared with corn/wheat cropping, S-3, S-11, and S-14 were compared with rice cropping, and N-6, N-8, N-12, S-10, and S-17 were compared with forest soil. Different letters represent significant differences according to Duncan’s test (p < 0.05).
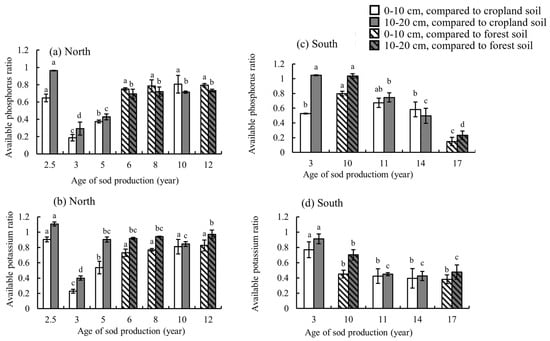
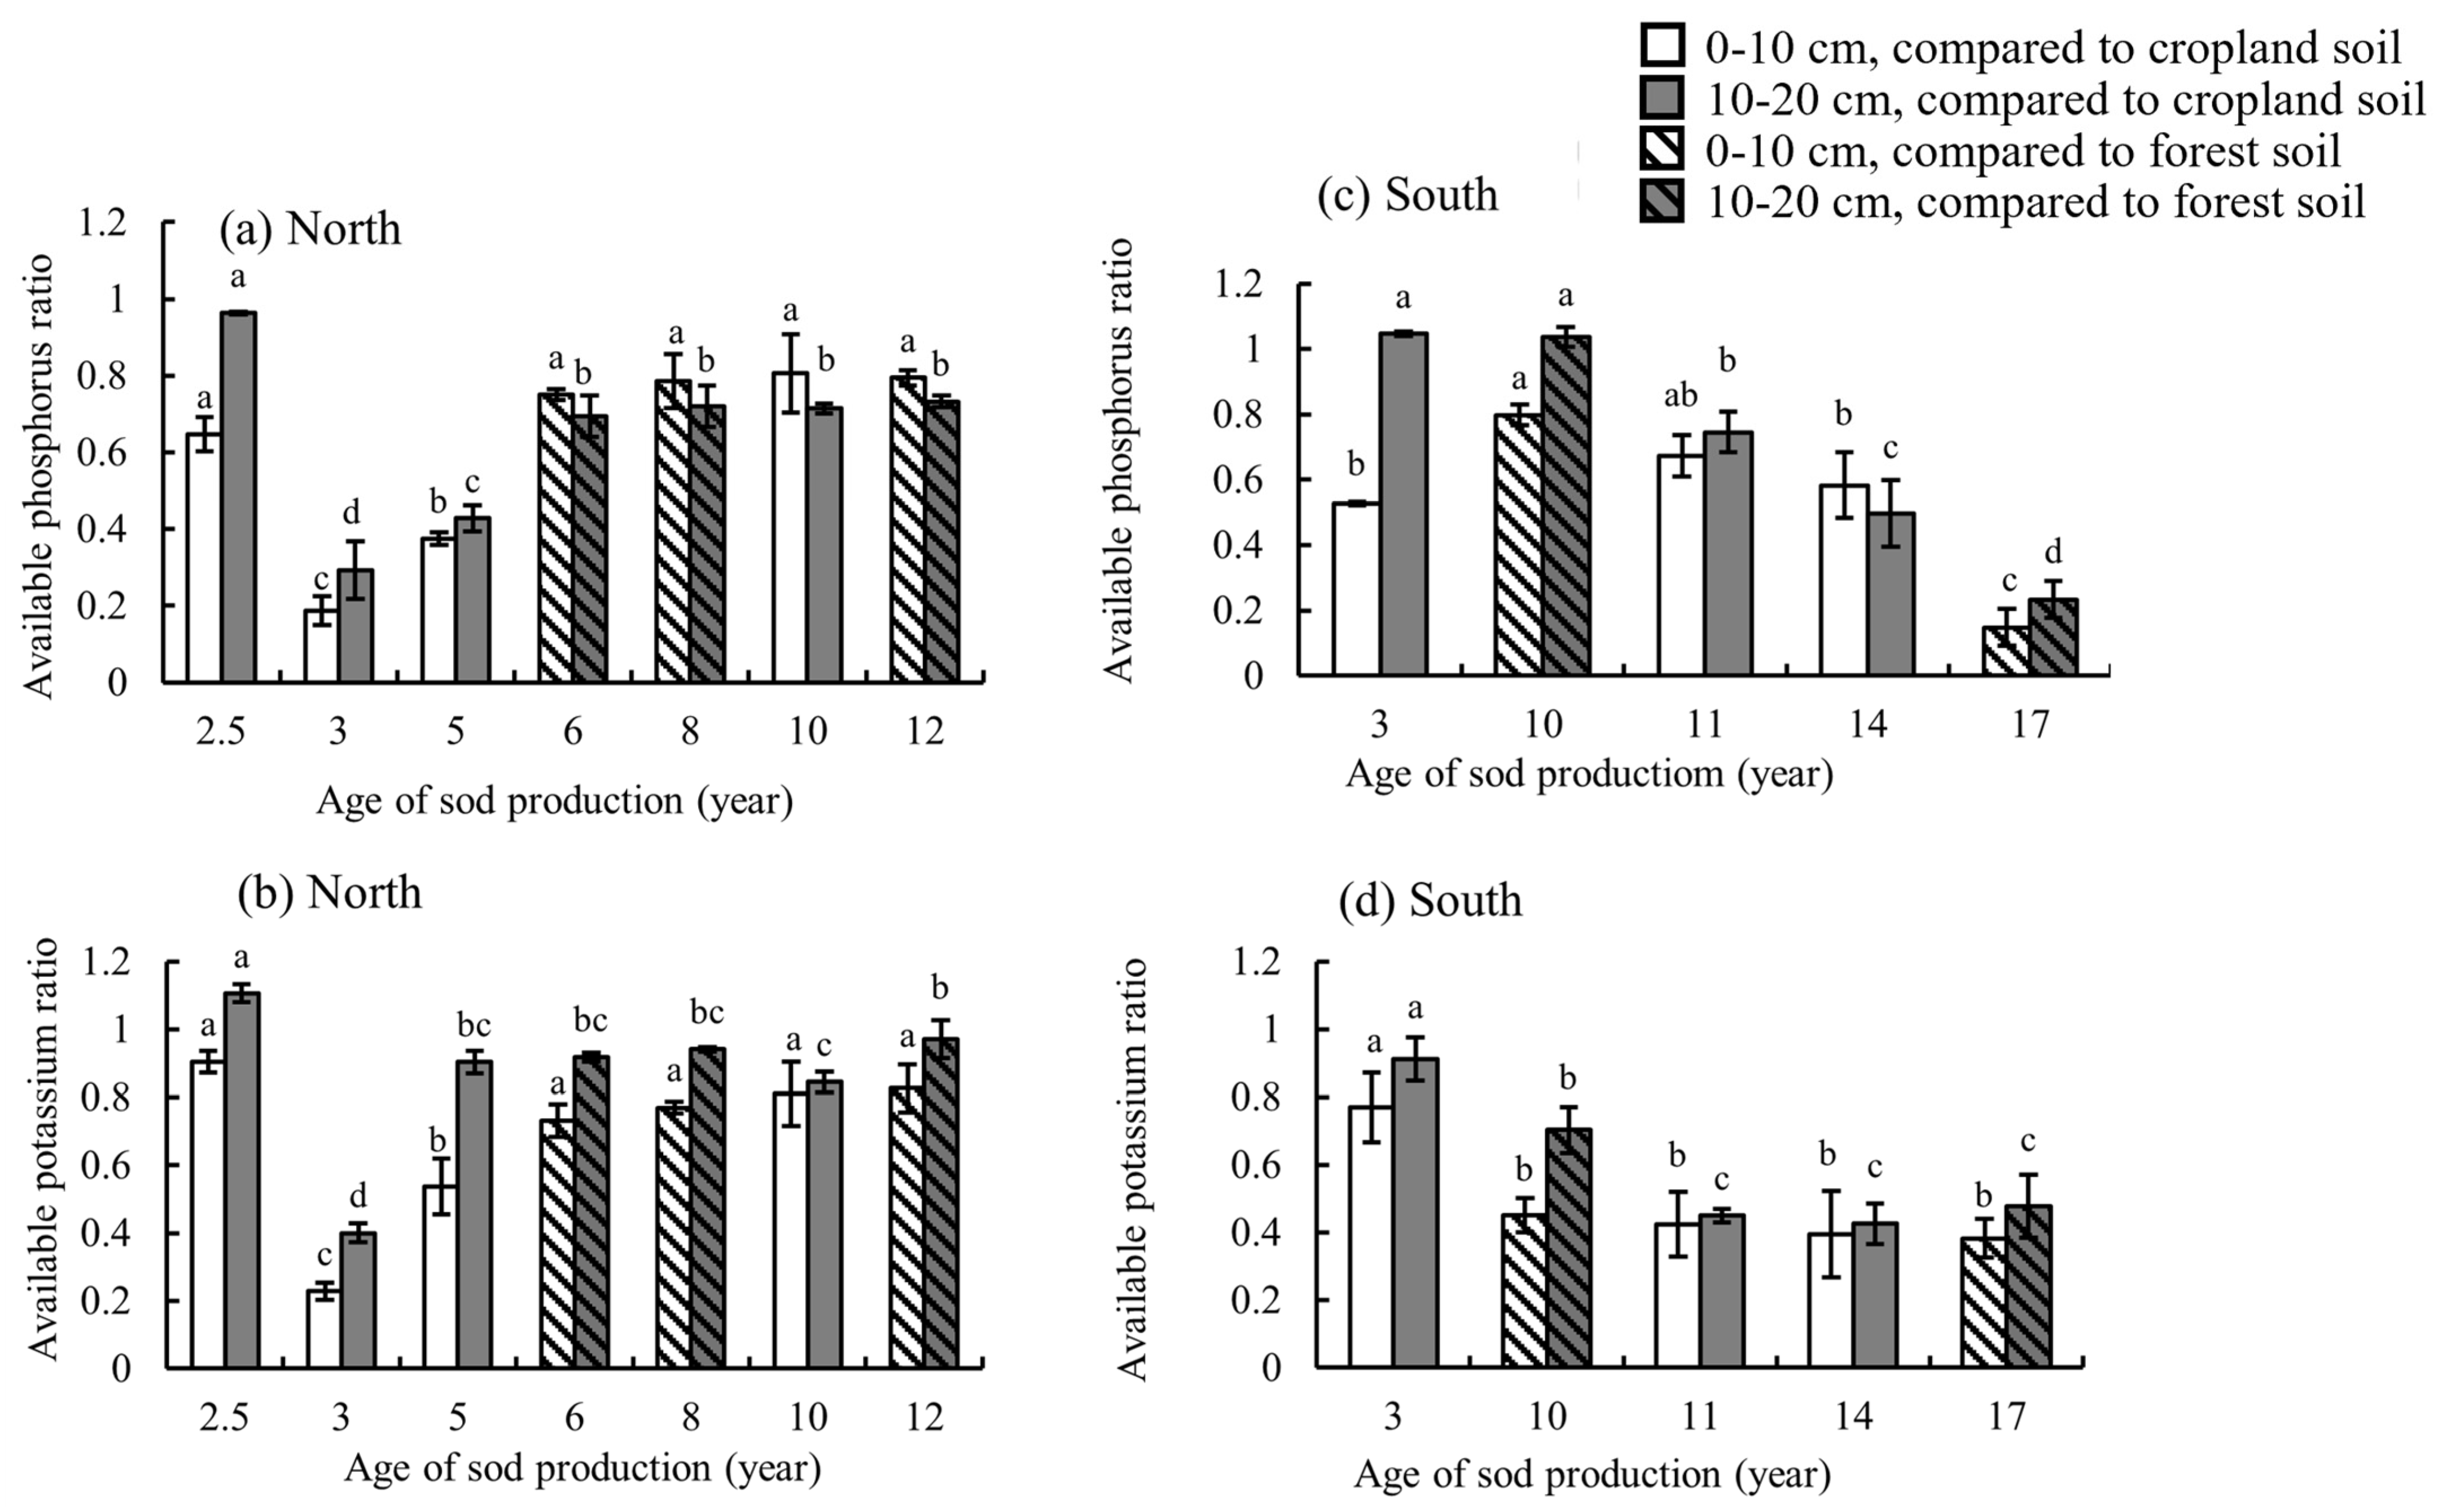
Figure 4.
Variation in soil available phosphorus (a,c) and available potassium (b,d) with different production years in the north and south. For ratios of each sod production plot, N-2.5, N-3, N-5, and N-10 were compared with corn/wheat cropping, S-3, S-11, and S-14 were compared with rice cropping, and N-6, N-8, N-12, S-10, and S-17 were compared with forest soil. Different letters represent significant differences according to Duncan’s test (p < 0.05).
In the north, the ratios of TC, SOM, TN, and AN were similarly affected across sod production years (Figure 3a–d). Compared to the control, sod production significantly decreased TC, SOM, TN, and AN in N-2.5, N-5, and N-10 (Table A3). The content decrease extents of these properties fluctuated, with a decreasing–increasing–decreasing trend. Significant differences in TC, SOM, and TN content changes were observed across years in both soil layers (Figure 3a–c). In the south, TC, SOM, TN, and AN ratios followed similar trends (Figure 3e–h). Compared to the control, these contents were lower in S-3 and S-10 but higher in S-11 and S-14 (Table A4). In S-14, TC, SOM, TN, and AN contents in the 0–10 cm layer were 189%, 275%, 123%, and 192% higher than the control, and 103%, 211%, 168%, and 178% higher in the 10–20 cm layer, respectively. However, the increases in S-17 were less pronounced, and TC and SOM contents were slightly lower than the control in the 10–20 cm layer.
In the north, AP and AK contents showed significant decreases compared to control plots, particularly in N-3, N-5, N-6, N-8, and N-12 for AP, and N-3, N-5 (0–10 cm), N-6 (0–10 cm), and N-8 (0–10 cm) for AK (Table A3). As sod production years increased, the decrease extents of AP and AK contents continued to decrease, and significant differences were observed across the years (Figure 4a,b). In the 10–20 cm soil layer in the southern region, AP content increased in S-3 and S-10 (non-significant), while a decreasing trend was observed in other years (Table A4). The decrease extents of AK content increased in both soil layers as sod production years increased (Figure 4d).
3.3. Effects of Sod Production on Soil Biological Properties
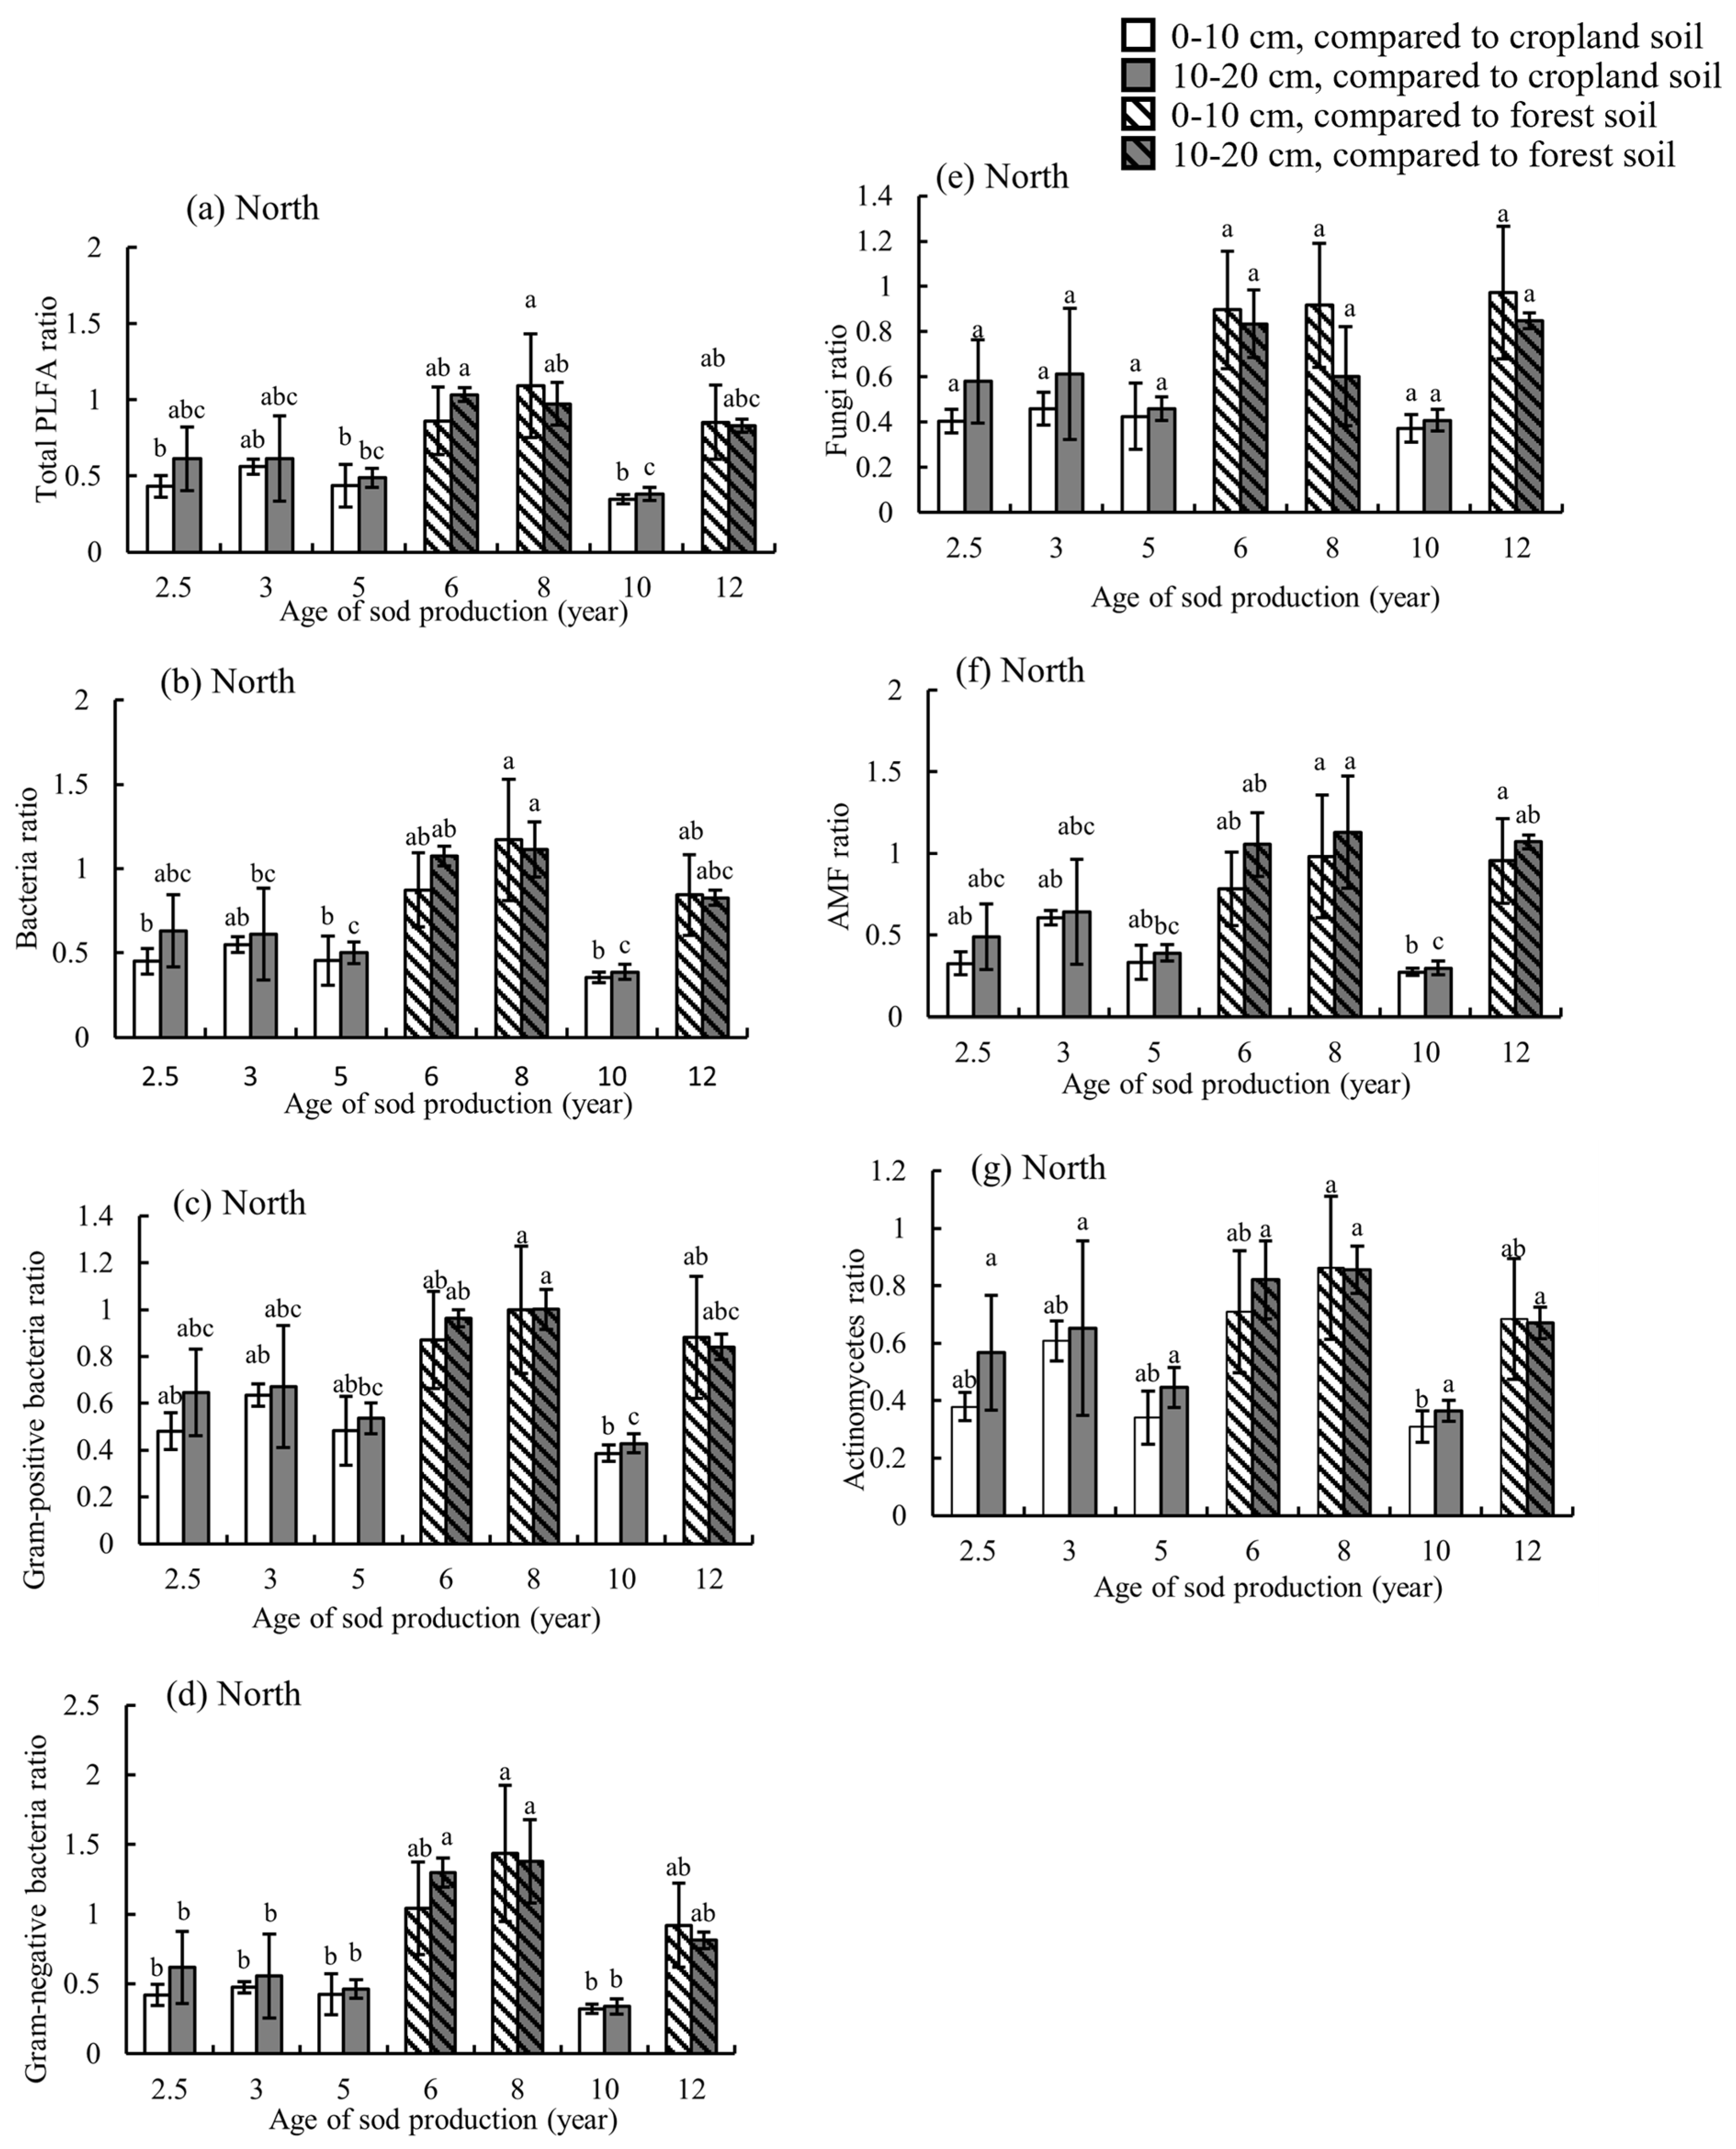
Soil biological properties, including total PLFA, B, G+, G−, F, AMF, and actinomycetes were analyzed (Table A5 and Table A6) The ratios of these properties for each sod production year to control plots were calculated (Figure 5 and Figure 6). The contents of total PLFA, B, G+, G−, and F in N-2.5 (0–10 cm), N-5, N-10, and N-12 were significantly lower than those in the control (Table A5). AMF and actinomycetes in N-2.5 (0–10 cm), N-5, and N-10 were significantly lower than those in the control (Table A5). The changing trend in the content ratios of total PLFA, B, G+, G−, F, AMF, and actinomycetes were similar across sod production years (Figure 5a–g). The changing trends of PLFA, B, G+, G−, F, AMF, and actinomycetes contents showed similar patterns of first increased, then decreased, and eventually increased, with an overall increase across sod production years (Figure 5a–g). Significant variations in biological properties were observed across sod production years.
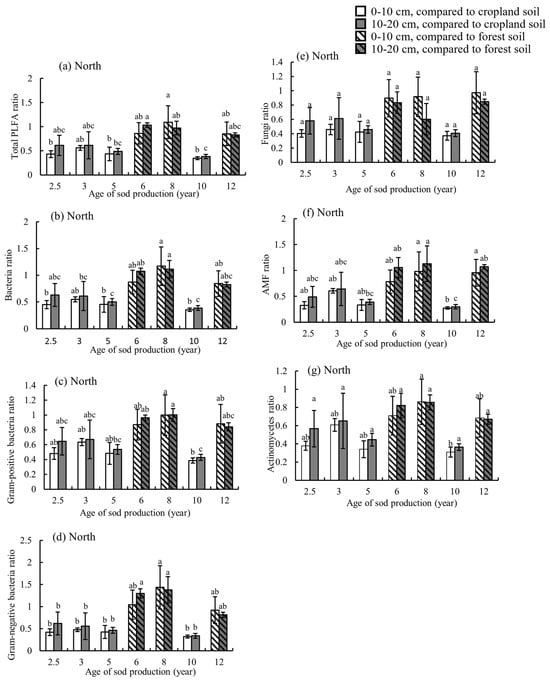
Figure 5.
Variation in soil biological properties including (a) total phospholipid fatty acids, (b) bacteria, (c) Gram-positive bacteria, (d) Gram-negative bacteria, (e) fungi, (f) Arbuscular mycorrhizal fungi, and (g) actinomycetes with different production years in the north. For ratios of each sod production plot, N-2.5, N-3, N-5, and N-10 were compared with corn/wheat cropping, S-3, S-11, and S-14 were compared with rice cropping, and N-6, N-8, N-12, S-10, and S-17 were compared with forest soil. Different letters represent significant differences according to Duncan’s test (p < 0.05).

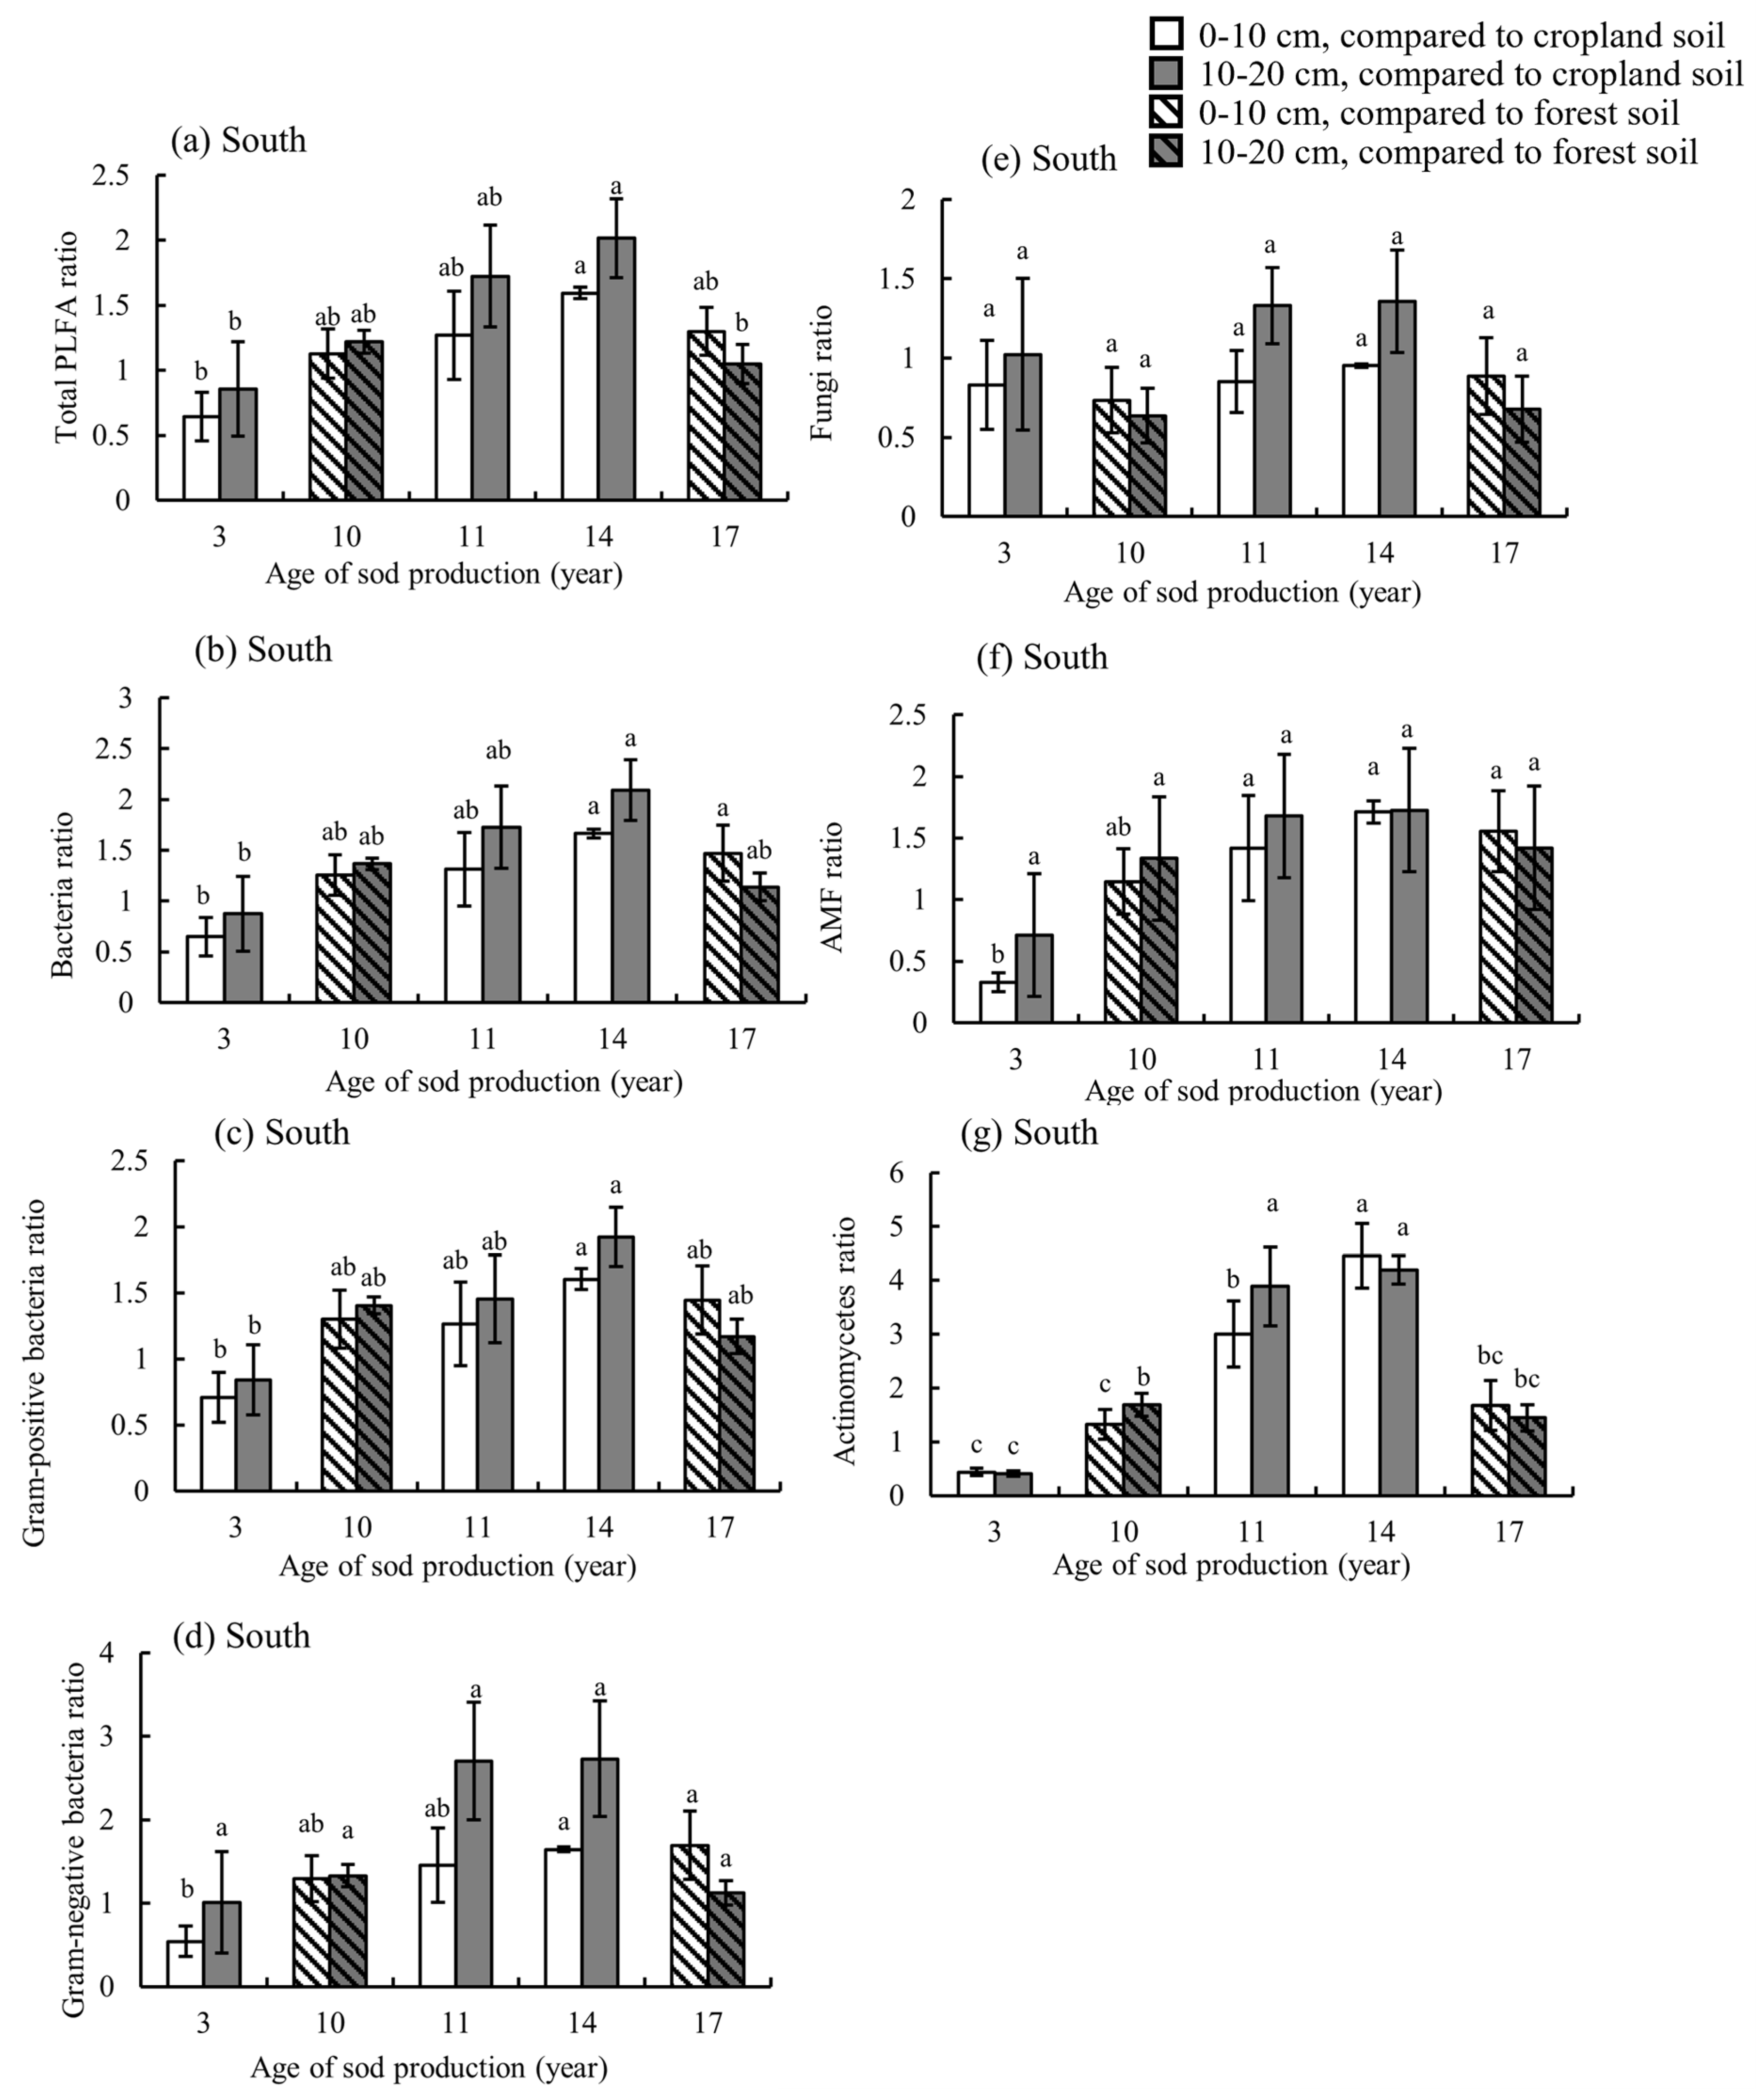
Figure 6.
Variation in soil biological properties including (a) total phospholipid fatty acids, (b) bacteria, (c) Gram-positive bacteria, (d) Gram-negative bacteria, (e) fungi, (f) Arbuscular mycorrhizal fungi, and (g) actinomycetes with different production years in the south. For ratios of each sod production plot, N-2.5, N-3, N-5, and N-10 were compared with corn/wheat cropping, S-3, S-11, and S-14 were compared with rice cropping, and N-6, N-8, N-12, S-10, and S-17 were compared with forest soil. Different letters represent significant differences according to Duncan’s test (p < 0.05).
In the southern plots, total PLFA, B, G+, AMF, and actinomycetes in S-10, S-11, S-14, and S-17 were higher than control plots, showing a similar trend across years (Table A6). Moreover, the changing trend of total PLFA, B, G+, AMF, and actinomycetes content ratios were similar across sod production years (Figure 6a–c,f–g). In S-14, total PLFA, B, G+, AMF, and actinomycetes increased by 59%, 67%, 60%, 345%, and 71%, respectively, in the 0–10 cm layer, and by 102%, 109%, 92%, 319%, and 72%, respectively, in the 10–20 cm layer. The increase in G− content was higher than the control, especially in S-14 (173% in the 10–20 cm layer) (Figure 6d). F content increased only in S-3, S-11, and S-14 in the 10–20 cm layer. There was no significant difference in the variation of F content between sod production years (Figure 6e).
3.4. Correlation and Redundancy Analysis
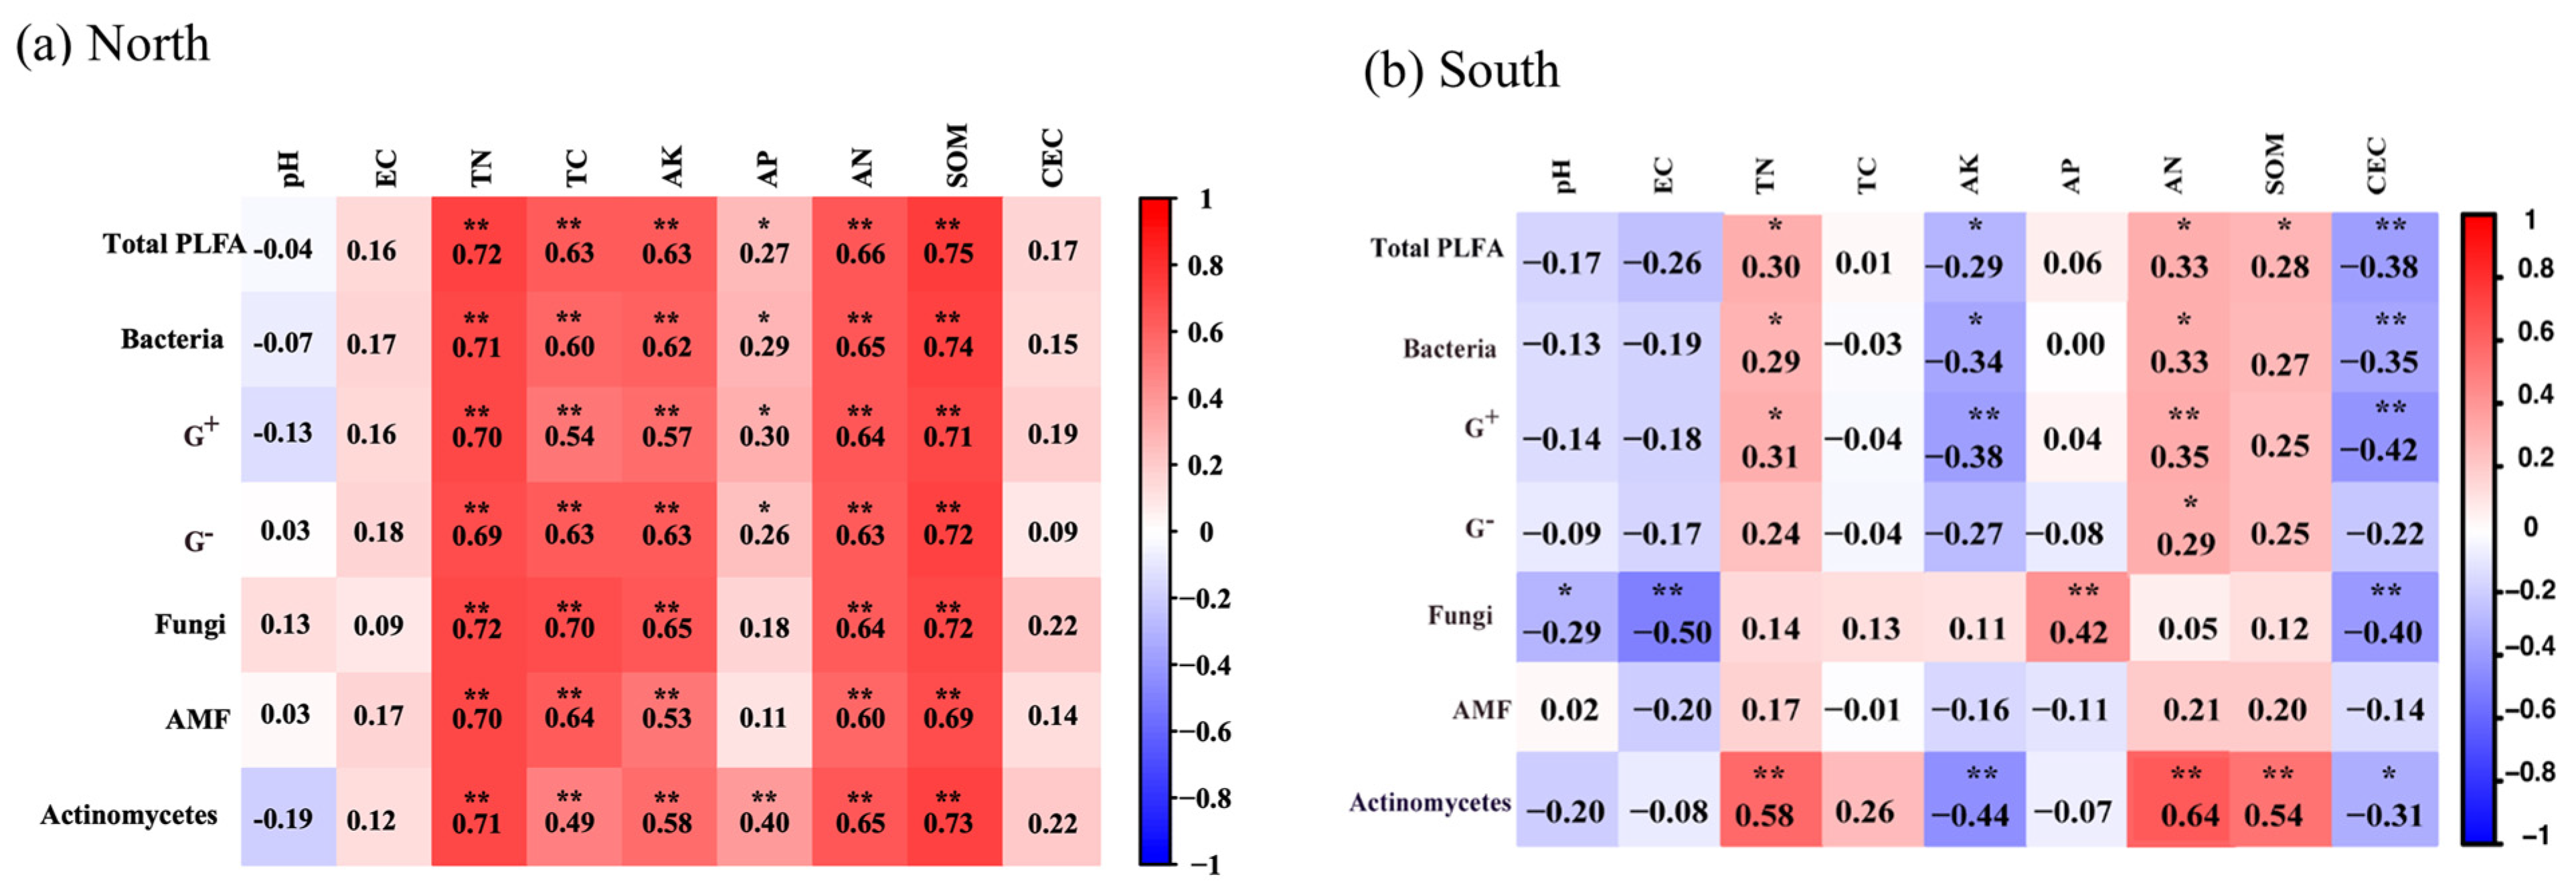
Correlation analysis between soil microbial communities and soil chemical indicators was conducted (Figure 7). In the north, significant positive correlations (p < 0.01) were found between total PLFA, B, G+, G−, F, AMF, and actinomycetes with TN, TC, AK, AN, and SOM. Additionally, actinomycetes was positively correlated with AP (p < 0.01), while total PLFA, B, G+, and G− were positively correlated with AP (p < 0.05).
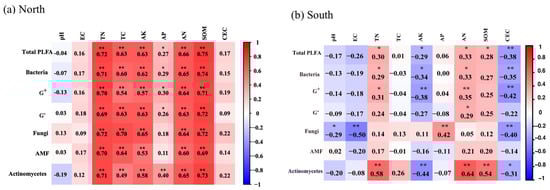
Figure 7.
Correlation analysis between soil microbial community and chemical indexes in the north (a) and south (b). * and ** indicate p < 0.05 and p < 0.01, respectively.
In the south, total PLFA was positively correlated with TN, AN, and SOM (p < 0.05), but negatively correlated with AK and CEC. Similarly, B, and G+ were positively correlated with TN and AN, and negatively correlated with AK and CEC. G− was positively correlated with AN (p < 0.05). Fungi were positively correlated with AP (p < 0.01) but negatively correlated with pH, EC, and CEC (Figure 7b). Actinomycetes also showed positive correlations with TN, AN, and SOM (p < 0.01), and negative correlations with AK and CEC.
Redundancy analysis (RDA) of microbial PLFA contents and soil physicochemical indexes showed that RDA1 accounted for 58.99% of the variation and RDA2 accounted for 1.52% in the north (Figure 8a). SOM and TN were the main factors influencing microbial community structure, with contribution rates of 85.5% and 7.4%, respectively. In the south, RDA1 explained 36.24% of the variation, and RDA2 explained 5.12% (Figure 8b). The key influencing factors were AN, EC, AK, and SOM, with contribution rates of 28.7%, 20.3%, 16.3%, and 12.9%, respectively.
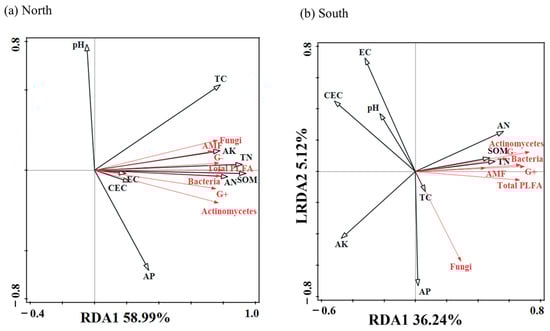
Figure 8.
Redundancy analysis of soil microbial community structure and soil chemical properties of sod production in the north (a) and south (b).
4. Discussion
4.1. Soil Physical Properties
Sod production in the north and south regions increased BD, likely due to turf management practices like rolling, which impacted soil permeability [21]. The increase in BD was more moderate in the south, potentially due to management techniques like sand mulching, which limited the rise in BD [22]. Sod production reduced soil porosity and FC in both regions, aligning with findings from Cui et al. [11]. However, the decrease extent of FC declined with the increasing years of sod production (Figure 1), likely because of the lawn grass roots remaining in the soil, increasing soil porosity and loosening the soil [23].
4.2. Soil Chemical Properties
In the north, pH ratio initially showed a fluctuating trend (increased–decreased–increased) from N-3 to N-12. In the south, pH levels (6.5–7.5) were maintained at an optimal range for turfgrass growth (Table A4). Variations in pH across production years might be linked to changes in soil aggregation due to land use [24]. Soil conductivity was higher than the control in N-5 to N-12 and throughout southern production years (Table A3 and Table A4), likely due to increased fertilizer application frequency during sod production [25]. However, there were no significant differences in the ratio of soil conductivity between years, as turfgrasses are adaptive and bioremediative to saline environments [26]. The CEC decreased in N-5 to N-12 and S-11 to S-17 (Table A3 and Table A4), indicating a reduced ability to retain and supply nutrients over time.
Soil carbon and nitrogen are important components of soil nutrients. As an important indicator of soil quality assessment as well as sustainable land organization and utilization management, SOM is considered a key indicator of soil fertility due to its impact on soil chemical, physical, and biological properties [27]. Studying the impact of sod production on these soil indicators is important for subsequent land utilization. The changing trends of TC, SOM, TN, and AN contents were similar in the north and south. Sod production significantly reduced TC, SOM, TN, and AN in N-2.5, N-5, and N-10 (Table A3), possibly due to the higher number of harvests and rollings per year in this site than in other sites, accelerating the depletion of nutrients in the soil. The TC and SOM levels in N-8 were higher than in the control, likely benefitting from the fact that N-8 was in a turfgrass–maize rotation, and crop rotations significantly impact soil health. Studies have proven that soil productivity can be further improved by increasing TC concentration and improving SOM levels [28]. In the south, TC, SOM, TN, and AN initially decreased due to the initial turfgrass growth and the rapid formation of the soil microbial environment, which consumed soil nutrients during the early stages of turf establishment, and the decomposition rate of soil organic carbon exceeded the sequestration rate of litter and rhizome deposits [29]. However, TC, SOM, TN, and AN contents notable increased in S-11 and S-14 (Figure 3e–h). Although the turf was harvested continuously, some roots remained in the soil, and the amount of roots gradually increased with the number of years. Surviving roots can release organic secretions, and the decomposition of dead root systems releases a large amount of organic matter, leading to an increase in the content of SOM, TN, and AN in the dense layer of the root system [30]. Additionally, sand mulching in southern fields mitigated soil loss during sod harvesting, preserving nutrient content. Bermudagrass, commonly planted in the south, has a high nitrogen demand and low nitrogen-use efficiency [31], leading to excess nitrogen accumulation. However, since bermudagrass only needs complementary seeding rather than reseeding every year, the excessively long production periods may have potentially led to soil degradation, which resulted in the decrease of the increase extent of TC, SOM, TN, and AN in S-17 (Figure 3e–h). Similar trends have been observed in studies involving rice cultivation in saline-alkali soils, which improve soil properties over time; the authors of [32,33] have shown that rice planted in soda saline-alkali soil can improve physiochemical soil conditions.
Available phosphorus and potassium are vital for plant growth, indicated by soil nutrient supply capacity. The decrease extent of AP and AK contents (0–10 cm, 10–20 cm) decreased over the years from N-3 to N-12 (Figure 4a,b). Initial turf growth depleted soil nutrients, but fertilization replenished available nutrient levels. In the north, deep plowing was performed annually before sod planting, which increased the active soil layer and facilitated root expansion, thereby increasing available nutrients in the soil [34,35]. In contrast, the south saw a greater decline in AP and AK over time (Figure 4c,d), likely due to the absence of deep plowing, and the difference in tillage practices affects the recovery of available nutrients. Bermudagrass, a phosphorus-enriching plant type [36], contributed significant phosphorus uptake, further reducing soil phosphorus content.
4.3. Soil Biological Properties
Soil microorganisms are crucial for sustaining terrestrial ecosystems by promoting plant growth and maintaining soil health, which supports nutrient cycling [37]. In this study, total PLFA, B, G+, G−, F, AMF, and actinomycetes ratios in northern sod production soils followed a decrease–increase–decrease pattern, reflecting trends in TC, SOM, TN, and AN (Figure 5a–g). Studies by Nan et al. [38] found that with increasing years of alfalfa planting, the microbial biomass carbon, nitrogen, bacterial, and actinomycetes quantities showed a pattern of increase–decrease–increase, which is similar to the trend in the north. The lower levels of total PLFA, B, G+, G−, and F contents in N-2.5 (0–10 cm soil layer), N-5, and N-10 were likely due to reduced soil nutrient levels (TC, SOM, TN, etc.) (Table A5). A strong positive correlation between TC, SOM, TN, and AN with microbial groups explains these lower values (Figure 7a). Crop rotation can change the diversity of soil structure and the structural composition of bacteria, affecting the content and structure of microorganisms. Because the contents of carbon and nitrogen in the soil were restored, and the N-8 plot was rotated with turfgrass and corn, so the content of SOM in N-8 was higher than that of the control (Table A5). In the rotation of sweet potatoes and peanuts planting, a significant increasing in B, actinomycetes, G+, and G− biomass was similar to the results in the north of this study [39]. In the south, total PLFA, B, G⁺, G−, AMF, and actinomycetes ratios followed similar trends, with significant increases in S-11 and S-14 (Figure 6a–d,f–g), likely due to grass clippings produced after turf mowing returned to the soil after decomposition, which provided energy for microbial activity. Moreover, sand mulching was carried out in all sod production based in the south to reduce the soil loss when the sod is harvested. With increasing years, the amount of turf roots left in the soil increases, and the root secretions also increase. These root secretions participate in the formation of humus, providing abundant carbon and nitrogen sources for the microbial reproduction and growth [40], leading to an increase in the biomass of various microorganisms in the soil [41]. Microorganisms are vital in humus transformation and soil fertility maintenance [42], and their higher content compared to the control indicated improved soil structure and nutrient availability.
The study also found that whether in the north or the south, the bacteria content was the highest among microflora (Table A5 and Table A6), aligning with Gu’s research [43], which showed that bacteria drive nutrient cycling and transformation. Bacteria tend to utilize easily decomposable organic matter, which is beneficial for nutrient supply, while fungi preferred to utilize more complex organic matter, leading to slow conversion rate and is beneficial to nutrient sequestration [44]. A higher bacteria-to-fungi ratio, indicates more decomposable organic matter, and better soil quality. Du et al. [45] found that fertilizers in sod production raised bacterial and actinomycete levels but kept fungi low, a pattern observed here as well. In the south, lower fungal content was consistently seen in the 0–10 cm soil layer (Table A6), possibly due to the significant correlation between fungal content and AP content. Galicia and Garcia-Oliva [46] found that added available nutrients to soil can promote carbon mineralization, increase microbial biomass, and enhance the diversity of microbial species and communities.
4.4. Correlation and Redundancy Analysis
Changes in soil physicochemical properties drive shifts in microbial metabolic characteristics [47]. Different plants and utilization management practices can significantly affect soil nutrient content [48], which in turn significantly affects the soil microbial community structure and function [49]. Redundancy analysis showed regional differences in the interaction between microbial communities and soil properties. In the north, SOM and TN were the primary chemical indicators affecting microbial community structure, with contribution rates of 85.5% and 7.4%, respectively (Figure 8a). The total PLFA, B, G+, G−, F, AMF, and actinomycetes correlated positively with AK, TC, AN, TN, and SOM (Figure 7a), which is similar to the findings of a study on the soil nutrients, enzyme activity, and microbial characteristics in three forest types in mountainous region of eastern Liaoning Province [50]. In the south, AN, EC, AK, and SOM were the main chemical indicators that influenced the microbial community structure, with contribution rates of 28.7%, 20.3%, 16.3% and 12.9%, respectively (Figure 8b). Different regions, cultivation practices, and climatic factors (temperature, precipitation) directly or indirectly influence the relationships between microbial communities and chemical indicators. Therefore, in this study, the relationship between soil microbial community structure and soil physicochemical characteristics during sod production differed between in the north and south. But SOM remained the key indicator affecting microbial community structure in both regions.
5. Conclusions
Sod production significantly impacted soil physical properties in both the north and south, although the effects did not consistently increase with production years. Differences in planting and management methods (sand mulching in the south; deep plowing in the north) led to varying effects on soil chemical and biological properties. In the north, soil nutrients initially declined, but recovered with longer production periods (N-10 to N-12). In the south, long-term sod production (S-11 to S-14) increased AN, SOM, TN, and TC content, maintaining a stable pH (6.81–7.63). However, sod production reduced available nutrients in both regions. Future sod production should prioritize monitoring soil and rapidly available nutrients, possibly improving them through crop rotation. Long-term production (S-10 to S-17) increased soil microbial content, influenced by management practices like sand mulching and deep plowing. Across regions, changes in soil nutrients affected microbial content and community structure, with SOM being a key indicator. Monitoring organic matter could help manage microbial communities. Enhancing production technology and the interaction between turfgrass, soil, and microorganisms will be critical for future sod production.
Author Contributions
Conceptualization, Y.S. and Q.H.; methodology, X.Q., C.W., J.Q. and K.Z.; software, Y.L.; formal analysis, X.Q.; investigation, X.Q. and C.W.; resources, Y.S.; data curation, X.Q.; writing—original draft preparation, X.Q.; writing—review and editing, Q.H. and Y.S.; supervision, Y.S.; project administration, Y.S.; funding acquisition, Y.S. All authors have read and agreed to the published version of the manuscript.
Funding
This research was funded by the Turf Producers China of Chinese Turfgrass Society.
Institutional Review Board Statement
Not applicable.
Data Availability Statement
The authors confirm that the data supporting the findings of this study are available within the article and Appendix A.
Conflicts of Interest
The authors declare no conflicts of interest.
Appendix A
Table A1.
Soil physical indexes in different years of sod production in the north.
Table A1.
Soil physical indexes in different years of sod production in the north.
| Measurement Indexes | Cropland (10, 5, 2.5 Years Ground Comparison) | Kentucky Bluegrass (2.5 Years) | Kentucky Bluegrass (5 Years) | Tall Fescue (10 Years) | Cropland (3 Years Ground Comparison) | Tall Fescue: Kentucky Bluegrass (9:1) (3 Years) | Woodland (6, 12 Years Ground Comparison) | Tall Fescue (6 Years) | Tall Fescue: Kentucky Bluegrass (15:8) (12 Years) | Woodland (8 Years Ground Comparison) | Tall Fescue (8 Years) |
|---|---|---|---|---|---|---|---|---|---|---|---|
| Bulk density (g/cm3) | 1.16 ± 0.05 | 1.6 ± 0.02 ** | 1.63 ± 0.05 ** | 1.62 ± 0.09 ** | 1.28 ± 0.03 | 1.69 ± 0.07 ** | 1.39 ± 0.07 | 1.77 ± 0.04 ** | 1.73 ± 0.10 ** | 1.21 ± 0.02 | 1.59 ± 0.05 ** |
| Porosity (%) | 47.17 ± 1.69 | 38.84 ± 0.87 ** | 38.45 ± 1.29 ** | 37.55 ± 2.55 ** | 45.61 ± 1.13 | 37.80 ± 2.93 * | 45.42 ± 0.25 | 34.58 ± 3.91 ** | 33.64 ± 5.96 * | 44.98 ± 0.39 | 39.77 ± 0.60 ** |
| Field water holding capacity (%) | 39.22 ± 0.48 | 18.38 ± 4.54 ** | 21.45 ± 0.96 ** | 28.94 ± 3.45 ** | 33.77 ± 1.23 | 21.29 ± 2.64 ** | 29.26 ± 0.99 | 15.97 ± 0.67 ** | 21.93 ± 1.66 ** | 33.75 ± 3.18 | 23.44 ± 0.49 ** |
Note: ** indicates a highly significant difference from the control based on the t-test (p < 0.01). * indicates a significant difference (p < 0.05).
Table A2.
Soil physical indexes in different years of sod production in the south.
Table A2.
Soil physical indexes in different years of sod production in the south.
| Measurement Indexes | Rice (3 Years Ground Comparison) | Bermudagrass (3 Years) | Woodland (10 Years Ground Comparison) | Bermudagrass (10 Years) | Rice (11, 14 Years Ground Comparison) | Creeping Bentgrass (11 Years) | Bermudagrass (14 Years) | Woodland (17 Years Ground Comparison) | Bermudagrass (17 Years) |
| Bulk density (g/cm3) | 1.25 ± 0.04 | 1.56 ± 0.09 ** | 1.23 ± 0.07 | 1.62 ± 0.06 ** | 1.16 ± 0.02 | 1.56 ± 0.03 ** | 1.52 ± 0.01 ** | 1.16 ± 0.05 | 1.54 ± 0.01 ** |
| Porosity (%) | 46.17 ± 0.62 | 38.31 ± 2.60 ** | 43.65 ± 0.66 | 38.63 ± 1.55 ** | 41.79 ± 0.94 | 34.77 ± 1.55 ** | 32.74 ± 3.39 ** | 42.98 ± 0.09 | 32.70 ± 1.73 ** |
| Field water holding capacity (%) | 33.67 ± 2.68 | 22.75 ± 3.24 * | 32.19 ± 2.19 | 22.05 ± 1.89 ** | 25.42 ± 1.81 | 21.63 ± 2.13 | 22.75 ± 2.56 | 32.86 ± 2.23 | 29.55 ± 2.12 |
Note: ** indicates a highly significant difference from the control based on the t-test (p < 0.01). * indicates a significant difference (p < 0.05).
Table A3.
Soil chemical indexes in different years of sod production in the north.
Table A3.
Soil chemical indexes in different years of sod production in the north.
| Measurement Indexes | Soil Depth (cm) | Cropland (10, 5, 2.5 Years Ground Comparison) | Kentucky Bluegrass (2.5 Years) | Kentucky Bluegrass (5 Years) | Tall Fescue (10 Years) | Cropland (3 Years Ground Comparison) | Tall Fescue: Kentucky Bluegrass (9:1) (3 Years) | Woodland (6, 12 Years Ground Comparison) | Tall Fescue (6 Years) | Tall Fescue: Kentucky Bluegrass (15:8) (12 Years) | Woodland (8 Years Ground Comparison) | Tall Fescue (8 Years) |
|---|---|---|---|---|---|---|---|---|---|---|---|---|
| pH | 0–10 cm | 7.63 ± 0.05 | 7.62 ± 0.07 | 7.86 ± 0.06 ** | 8.03 ± 0.18 * | 8.03 ± 0.05 | 8.10 ± 0.03 | 7.51 ± 0.39 | 7.76 ± 0.07 | 8.04 ± 0.08 | 8.14 ± 0.13 | 8.43 ± 0.06 * |
| 10–20 cm | 7.76 ± 0.07 | 7.97 ± 0.06 * | 8.10 ± 0.05 ** | 8.14 ± 0.10 ** | 7.97 ± 0.02 | 8.19 ± 0.08 * | 7.03 ± 0.10 | 7.67 ± 0.01 ** | 7.81 ± 0.16 ** | 8.30 ± 0.05 | 8.42 ± 0.05 * | |
| Electrical conductivity (μs/cm) | 0–10 cm | 232.67 ± 23.71 | 143.67 ± 72.53 | 240.03 ± 52.66 | 264.67 ± 29.57 | 231.33 ± 18.58 | 163.63 ± 3.99 ** | 89.43 ± 23.41 | 95.63 ± 4.81 | 98.30 ± 27.63 | 149.40 ± 12.89 | 169.33 ± 1.15 |
| 10–20 cm | 232.67 ± 29.94 | 265.67 ± 16.50 | 214.00 ± 19.29 | 287.67 ± 28.29 | 211.40 ± 25.34 | 155.83 ± 7.14 * | 97.73 ± 23.35 | 115.07 ± 16.75 | 116.00 ± 9.04 | 151.70 ± 3.75 | 184.33 ± 17.24 * | |
| Cation exchange capacity (cmol/kg) | 0–10 cm | 17.88 ± 0.31 | 18.98 ± 0.88 | 17.63 ± 0.31 | 15.54 ± 1.53 | 16.94 ± 0.63 | 17.37 ± 0.77 | 17.54 ± 0.73 | 16.84 ± 1.00 | 16.31 ± 0.47 | 17.90 ± 0.79 | 15.85 ± 1.26 |
| 10–20 cm | 16.59 ± 0.82 | 17.89 ± 0.53 | 16.47 ± 0.90 | 15.90 ± 1.30 | 18.09 ± 0.79 | 18.68 ± 1.05 | 16.58 ± 0.24 | 16.38 ± 0.74 | 16.38 ± 0.08 | 19.38 ± 0.46 | 15.83 ± 0.47 ** | |
| Total carbon (g/kg) | 0–10 cm | 22.10 ± 0.46 | 14.89 ± 2.43 ** | 15.57 ± 0.34 ** | 9.30 ± 1.04 ** | 30.69 ± 5.64 | 21.40 ± 0.72 * | 7.50 ± 1.55 | 6.93 ± 1.33 | 6.12 ± 0.07 | 20.56 ± 1.82 | 23.08 ± 2.87 |
| 10–20 cm | 15.84 ± 1.93 | 12.91 ± 1.64 | 14.38 ± 0.55 | 9.05 ± 1.03 ** | 21.16 ± 1.16 | 17.71 ± 3.84 | 7.83 ± 2.26 | 6.24 ± 0.60 | 5.67 ± 0.51 | 19.59 ± 1.24 | 21.44 ± 0.82 | |
| Organic matter (g/kg) | 0–10 cm | 23.23 ± 2.02 | 12.25 ± 1.75 ** | 9.45 ± 0.04 ** | 6.46 ± 2.13 ** | 25.27 ± 3.17 | 14.30 ± 1.22 ** | 9.74 ± 2.01 | 9.46 ± 2.66 | 9.80 ± 2.37 | 13.18 ± 1.57 | 12.08 ± 1.13 |
| 10–20 cm | 12.63 ± 2.96 | 8.29 ± 1.21 | 4.98 ± 2.56 * | 5.09 ± 1.32 * | 14.74 ± 4.20 | 10.88 ± 1.31 | 9.85 ± 3.24 | 9.20 ± 0.92 | 8.57 ± 2.09 | 11.73 ± 2.02 | 12.35 ± 0.81 | |
| Total nitrogen (g/kg) | 0–10 cm | 1.59 ± 0.01 | 0.48 ± 0.03 ** | 0.87 ± 0.24 * | 0.51 ± 0.05 ** | 1.62 ± 0.32 | 1.18 ± 0.06 * | 0.69 ± 0.19 | 0.48 ± 0.03 | 0.36 ± 0.14 | 0.90 ± 0.20 | 0.73 ± 0.29 |
| 10–20 cm | 0.87 ± 0.08 | 0.46 ± 0.03 ** | 0.59 ± 0.05 ** | 0.45 ± 0.04 ** | 1.03 ± 0.13 | 1.04 ± 0.12 | 0.62 ± 0.19 | 0.51 ± 0.02 | 0.44 ± 0.04 | 0.85 ± 0.24 | 0.62 ± 0.03 | |
| Alkali-hydrolyzable nitrogen (mg/kg) | 0–10 cm | 122.73 ± 18.05 | 37.07 ± 3.3 ** | 70.03 ± 20.94 * | 41.17 ± 5.62 ** | 137.99 ± 18.41 | 69.32 ± 47.65 | 41.21 ± 5.88 | 24.29 ± 11.67 | 37.29 ± 2.90 | 62.53 ± 4.12 | 60.33 ± 12.20 |
| 10–20 cm | 64.69 ± 3.73 | 33.43 ± 3.61 ** | 43.97 ± 9.86 * | 33.94 ± 6.45 ** | 81.02 ± 20.43 | 70.46 ± 51.68 | 39.53 ± 7.98 | 32.49 ± 6.38 | 41.69 ± 3.72 | 68.59 ± 19.9 | 48.34 ± 9.4 | |
| Available phosphorus (mg/kg) | 0–10 cm | 25.45 ± 3.75 | 16.28 ± 0.57 * | 9.47 ± 0.66 ** | 20.07 ± 1.57 | 64.00 ± 7.21 | 11.60 ± 3.12 ** | 53.87 ± 3.22 | 40.41 ± 2.27 ** | 42.69 ± 0.88 ** | 3.52 ± 0.24 | 2.75 ± 0.24 * |
| 10–20 cm | 11.76 ± 0.24 | 11.33 ± 0.27 | 5.03 ± 0.66 ** | 8.39 ± 0.13 * | 19.07 ± 3.95 | 5.41 ± 2.37 ** | 36.31 ± 1.71 | 25.14 ± 2.30 ** | 26.57 ± 0.35 ** | 2.63 ± 0.18 | 1.89 ± 0.29 * | |
| Available potassium (mg/kg) | 0–10 cm | 176.69 ± 38.41 | 158.47 ± 24.42 | 94.44 ± 26.85 * | 139.06 ± 3.94 | 777.44 ± 162.28 | 172.82 ± 4.55 ** | 72.51 ± 3.85 | 52.95 ± 3.91 ** | 60.17 ± 11.5 | 182.05 ± 15.79 | 140.31 ± 16.32 * |
| 10–20 cm | 115.55 ± 14.10 | 127.32 ± 10.29 | 103.84 ± 6.7 | 97.28 ± 8.21 | 378.57 ± 70.31 | 149.37 ± 9.84 ** | 77.72 ± 8.09 | 71.22 ± 6.03 | 75.18 ± 8.15 | 155.85 ± 14.79 | 146.63 ± 13.53 |
Note: ** indicates a highly significant difference from the control based on the t-test (p < 0.01). * indicates a significant difference (p < 0.05).
Table A4.
Soil chemical indexes in different years of sod production in the south.
Table A4.
Soil chemical indexes in different years of sod production in the south.
| Measurement Indexes | Soil Depth (cm) | Rice (3 Years Ground Comparison) | Bermudagrass (3 Years) | Woodland (10 Years Ground Comparison) | Bermudagrass (10 Years) | Rice (11, 14 Years Ground Comparison) | Creeping Bentgrass (11 Years) | Bermudagrass (14 Years) | Woodland (17 Years Ground Comparison) | Bermudagrass (17 Years) |
|---|---|---|---|---|---|---|---|---|---|---|
| pH | 0–10 cm | 6.93 ± 0.21 | 7.07 ± 0.18 | 6.59 ± 0.31 | 6.81 ± 0.19 | 7.80 ± 0.16 | 6.97 ± 0.15 ** | 7.30 ± 0.11 * | 7.17 ± 0.08 | 7.62 ± 0.05 ** |
| 10–20 cm | 7.03 ± 0.23 | 6.82 ± 0.34 | 6.64 ± 0.13 | 6.84 ± 0.23 | 7.82 ± 0.14 | 7.05 ± 0.17 * | 7.41 ± 0.02 ** | 7.22 ± 0.08 | 7.63 ± 0.08 ** | |
| Electrical conductivity (μs/cm) | 0–10 cm | 140.87 ± 18.18 | 187.67 ± 34.61 | 174.11 ± 21.16 | 268.00 ± 33.85 * | 193 ± 2.43 | 304.87 ± 22.20 * | 278.23 ± 39.25 | 166.77 ± 23.23 | 216.53 ± 71.04 |
| 10–20 cm | 149.73 ± 9.07 | 199.20 ± 42.78 | 167.51 ± 19.64 | 275.23 ± 24.49 ** | 184.30 ± 5.27 | 241.21 ± 12.60 | 257.43 ± 8.96 | 137.51 ± 16.39 | 218.57 ± 80.08 | |
| Cation exchange capacity (cmol/kg) | 0–10 cm | 15.25 ± 0.59 | 15.77 ± 1.56 | 15.58 ± 1.34 | 16.54 ± 1.67 | 19.97 ± 0.24 | 18.91 ± 0.96 | 18.56 ± 0.28 ** | 16.32 ± 1.00 | 15.07 ± 1.19 |
| 10–20 cm | 15.45 ± 0.57 | 15.65 ± 1.64 | 15.73 ± 0.58 | 16.14 ± 0.94 | 19.45 ± 0.25 | 18.28 ± 0.49 * | 17.95 ± 0.53 * | 16.45 ± 0.76 | 15.07 ± 1.35 | |
| Total carbon (g/kg) | 0–10 cm | 12.00 ± 2.25 | 8.27 ± 0.81 | 15.40 ± 2.27 | 12.20 ± 3.70 | 6.27 ± 1.01 | 17.43 ± 0.31 ** | 17.67 ± 0.31 ** | 16.40 ± 3.34 | 11.00 ± 0.42 |
| 10–20 cm | 11.70 ± 2.98 | 9.10 ± 2.25 | 13.87 ± 1.55 | 12.40 ± 3.64 | 7.57 ± 1.05 | 15.80 ± 0.96 ** | 15.30 ± 2.69 ** | 15.53 ± 2.10 | 14.00 ± 1.06 | |
| Organic matter (g/kg) | 0–10 cm | 19.42 ± 3.27 | 12.91 ± 2.32 * | 18.09 ± 2.07 | 15.43 ± 7.12 | 7.06 ± 0.58 | 23.93 ± 0.36 ** | 26.47 ± 1.59 ** | 18.76 ± 1.40 | 19.23 ± 2.14 |
| 10–20 cm | 18.8 ± 4.73 | 15.80 ± 3.69 | 19.85 ± 1.88 | 18.05 ± 4.60 | 7.18 ± 1.81 | 21.04 ± 2.30 ** | 21.65 ± 2.04 ** | 19.18 ± 0.72 | 15.00 ± 1.87 * | |
| Total nitrogen (g/kg) | 0–10 cm | 1.57 ± 0.21 | 0.97 ± 0.06 ** | 1.93 ± 0.38 | 1.33 ± 0.67 | 0.70 ± 0.00 | 1.87 ± 0.06 ** | 2.03 ± 0.06 ** | 1.60 ± 0.20 | 2.03 ± 0.47 |
| 10–20 cm | 1.80 ± 0.20 | 1.27 ± 0.21 * | 1.73 ± 0.15 | 1.53 ± 0.38 | 0.73 ± 0.23 | 1.77 ± 0.06 ** | 1.83 ± 0.32 ** | 1.63 ± 0.12 | 1.87 ± 0.15 | |
| Alkali-hydrolyzable nitrogen (mg/kg) | 0–10 cm | 120.91 ± 20.95 | 75.55 ± 4.55 * | 131.28 ± 12.43 | 100.49 ± 50.75 | 52.66 ± 1.64 | 142.37 ± 7.46 ** | 153.78 ± 10.97 ** | 125.65 ± 15.22 | 162.45 ± 37.26 |
| 10–20 cm | 122.50 ± 24.08 | 97.51 ± 18.74 | 89.68 ± 17.78 | 112.72 ± 32.91 | 54.65 ± 16.33 | 139.16 ± 6.11 * | 142.06 ± 30.45 * | 96.35 ± 13.32 | 145.03 ± 14.27 * | |
| Available phosphorus (mg/kg) | 0–10 cm | 25.19 ± 0.52 | 13.22 ± 2.89 ** | 30.03 ± 2.27 | 23.97 ± 2.07 * | 11.45 ± 2.74 | 7.67 ± 1.89 | 6.72 ± 3.22 | 33.36 ± 6.84 | 4.80 ± 0.10 ** |
| 10–20 cm | 13.61 ± 1.62 | 14.25 ± 1.73 | 31.30 ± 3.52 | 32.37 ± 3.03 | 10.16 ± 2.67 | 7.76 ± 3.18 | 5.15 ± 2.39 | 29.50 ± 3.85 | 6.65 ± 2.20 ** | |
| Available potassium (mg/kg) | 0–10 cm | 168.51 ± 35.09 | 127.33 ± 8.37 | 225.54 ± 23.45 | 101.23 ± 10.15 ** | 312.29 ± 97.07 | 126.72 ± 15.31 * | 115.09 ± 0.26 * | 235.54 ± 13.23 | 90.36 ± 15.53 ** |
| 10–20 cm | 152.40 ± 12.56 | 138.85 ± 12.97 | 174.22 ± 18.10 | 122.20 ± 14.25 * | 279.53 ± 24.52 | 126.04 ± 16.25 ** | 119.47 ± 22.34 ** | 194.22 ± 25.44 | 91.38 ± 9.11 ** |
Note: ** indicates a highly significant difference from the control based on the t-test (p < 0.01). * indicates a significant difference (p < 0.05).
Table A5.
Soil biological indexes in different years of sod production in the north.
Table A5.
Soil biological indexes in different years of sod production in the north.
| Measurement Indexes | Soil Depth (cm) | Cropland (10, 5, 2.5 Years Ground Comparison) | Kentucky Bluegrass (2.5 Years) | Kentucky Bluegrass (5 Years) | Tall Fescue (10 Years) | Cropland (3 Years Ground Comparison) | Tall Fescue: Kentucky Bluegrass (9:1) (3 Years) | Woodland (6, 12 Years Ground Comparison) | Tall Fescue (6 Years) | Tall Fescue: Kentucky Bluegrass (15:8) (12 Years) | Woodland (8 Years Ground Comparison) | Tall fescue (8 Years) |
|---|---|---|---|---|---|---|---|---|---|---|---|---|
| Total phospholipid fatty acids (nmol/g) | 0–10 cm | 21.66 ± 4.18 | 9.11 ± 1.44 ** | 8.78 ± 3.30* | 7.48 ± 1.71 ** | 23.80 ± 6.23 | 13.23 ± 3.43 | 11.36 ± 4.16 | 8.80 ± 2.51 | 8.61 ± 1.07 ** | 12.81 ± 2.32 | 13.10 ± 4.90 |
| 10–20 cm | 14.40 ± 3.23 | 8.30 ± 3.63 | 6.79 ± 0.25 * | 5.34 ± 0.29 ** | 15.85 ± 7.62 | 7.45 ± 1.63 | 7.13 ± 0.50 | 7.36 ± 0.74 | 5.90 ± 0.12 * | 9.17 ± 0.28 | 8.96 ± 2.48 | |
| Bacteria (nmol/g) | 0–10 cm | 16.79 ± 3.54 | 7.32 ± 1.19 * | 7.02 ± 2.56 * | 5.16 ± 1.23 ** | 18.00 ± 4.49 | 9.82 ± 2.41 * | 8.88 ± 3.10 | 7.02 ± 2.00 * | 6.70 ± 0.90 ** | 8.85 ± 1.64 | 9.68 ± 3.66 |
| 10–20 cm | 11.28 ± 2.58 | 6.69 ± 2.92 | 5.47 ± 0.24 * | 4.23 ± 0.24 ** | 12.31 ± 5.94 | 5.77 ± 1.18 | 5.63 ± 0.37 | 6.05 ± 0.67 | 4.63 ± 0.15 * | 6.51 ± 0.30 | 7.22 ± 1.75 | |
| Gram-positive bacteria (nmol/g) | 0–10 cm | 8.59 ± 1.98 | 3.98 ± 0.59 * | 3.81 ± 1.21 * | 2.91 ± 0.54 * | 8.29 ± 1.83 | 5.24 ± 1.13 | 4.79 ± 1.43 | 3.84 ± 0.77 | 3.80 ± 0.61 * | 4.35 ± 1.18 | 4.12 ± 1.63 |
| 10–20 cm | 5.99 ± 1.14 | 3.73 ± 1.50 | 3.12 ± 0.18 * | 2.51 ± 0.09 ** | 6.28 ± 2.54 | 3.49 ± 0.70 | 3.30 ± 0.23 | 3.17 ± 0.19 | 2.76 ± 0.14 * | 3.63 ± 0.32 | 3.64 ± 0.66 | |
| Gram-negative bacteria (nmol/g) | 0–10 cm | 7.10 ± 1.37 | 2.87 ± 0.52 ** | 2.76 ± 1.17 * | 1.87 ± 0.59 ** | 8.32 ± 2.32 | 3.91 ± 1.10 * | 3.21 ± 1.70 | 2.75 ± 1.16 | 2.42 ± 0.27 * | 3.74 ± 0.80 | 5.00 ± 2.30 |
| 10–20 cm | 4.57 ± 1.29 | 2.54 ± 1.26 | 2.02 ± 0.12 * | 1.47 ± 0.15 * | 5.05 ± 2.97 | 1.20 ± 0.49 | 1.92 ± 0.09 | 2.50 ± 0.41 | 1.56 ± 0.17 * | 2.33 ± 0.23 | 3.13 ± 0.83 | |
| Fungi (nmol/g) | 0–10 cm | 2.45 ± 0.32 | 0.97 ± 0.10 ** | 0.99 ± 0.46 * | 0.79 ± 0.30 ** | 3.41 ± 1.06 | 1.98 ± 0.64 | 1.38 ± 0.66 | 1.05 ± 0.35 | 1.14 ± 0.12 | 2.38 ± 0.52 | 2.08 ± 0.77 |
| 10–20 cm | 1.62 ± 0.35 | 0.88 ± 0.33 | 0.72 ± 0.03 * | 0.64 ± 0.03 ** | 1.97 ± 0.90 | 0.93 ± 0.26 | 0.85 ± 0.08 | 0.72 ± 0.28 | 0.72 ± 0.03 | 1.91 ± 0.24 | 1.12 ± 0.64 | |
| arbuscular mycorrhizal fungi (nmol/g) | 0–10 cm | 1.41 ± 0.28 | 0.44 ± 0.11 ** | 0.44 ± 0.16 ** | 0.36 ± 0.10 ** | 1.37 ± 0.40 | 0.82 ± 0.22 | 0.49 ± 0.26 | 0.31 ± 0.02 | 0.43 ± 0.05 | 1.15 ± 0.49 | 1.00 ± 0.58 |
| 10–20 cm | 0.86 ± 0.23 | 0.38 ± 0.19 * | 0.32 ± 0.02 * | 0.25 ± 0.03 ** | 0.87 ± 0.50 | 0.39 ± 0.08 | 0.28 ± 0.01 | 0.29 ± 0.09 | 0.30 ± 0.01 | 0.38 ± 0.34 | 0.30 ± 0.08 | |
| Actinomycetes (nmol/g) | 0–10 cm | 1.00 ± 0.13 | 0.37 ± 0.05 ** | 0.33 ± 0.13 ** | 0.22 ± 0.09 ** | 1.01 ± 0.30 | 0.61 ± 0.18 | 0.62 ± 0.17 | 0.40 ± 0.16 | 0.38 ± 0.09 | 0.43 ± 0.15 | 0.35 ± 0.16 |
| 10–20 cm | 0.64 ± 0.10 | 0.35 ± 0.19 | 0.28 ± 0.03 ** | 0.23 ± 0.01 ** | 0.70 ± 0.29 | 0.36 ± 0.12 | 0.37 ± 0.04 | 0.30 ± 0.05 | 0.25 ± 0.03 * | 0.37 ± 0.04 | 0.32 ± 0.08 |
Note: ** indicates a highly significant difference from the control based on the t-test (p < 0.01). * indicates a significant difference (p < 0.05).
Table A6.
Soil biological indexes in different years of sod production in the south.
Table A6.
Soil biological indexes in different years of sod production in the south.
| Measurement Indexes | Soil Depth (cm) | Rice (3 Years Ground Comparison) | Bermudagrass (3 Years) | Woodland (10 Years Ground Comparison) | Bermudagrass (10 Years) | Rice (11, 14 Years Ground Comparison) | Creeping Bentgrass (11 Years) | Bermudagrass (14 Years) | Woodland (17 Years Ground Comparison) | Bermudagrass (17 Years) |
|---|---|---|---|---|---|---|---|---|---|---|
| Total phospholipid fatty acids (nmol/g) | 0–10 cm | 14.63 ± 3.70 | 8.63 ± 1.98 | 8.26 ± 1.17 | 9.06 ± 1.23 | 6.02 ± 1.44 | 7.10 ± 2.20 | 9.66 ± 2.73 | 8.40 ± 0.92 | 10.72 ± 1.63 |
| 10–20 cm | 14.00 ± 6.70 | 9.57 ± 2.55 | 7.29 ± 1.52 | 8.76 ± 1.03 | 4.35 ± 1.06 | 7.13 ± 1.56 | 8.47 ± 1.12 ** | 7.25 ± 1.72 | 7.33 ± 0.46 | |
| Bacteria (nmol/g) | 0–10 cm | 11.83 ± 3.15 | 7.01 ± 1.51 | 6.05 ± 1.11 | 7.35 ± 0.91 | 4.63 ± 1.13 | 5.63 ± 1.79 | 7.76 ± 2.22 | 6.10 ± 1.21 | 8.59 ± 1.48 |
| 10–20 cm | 11.02 ± 5.39 | 7.67 ± 1.78 | 5.40 ± 0.93 | 7.32 ± 0.86 | 3.50 ± 0.84 | 5.77 ± 1.42 | 7.11 ± 1.00 ** | 5.34 ± 0.90 | 5.95 ± 0.37 | |
| Gram-positive bacteria (nmol/g) | 0–10 cm | 6.66 ± 1.52 | 4.41 ± 0.91 | 3.80 ± 0.78 | 4.75 ± 0.66 | 2.76 ± 0.63 | 3.27 ± 0.92 | 4.48 ± 1.35 | 3.80 ± 0.85 | 5.24 ± 0.71 |
| 10–20 cm | 6.42 ± 2.56 | 4.71 ± 0.87 | 3.46 ± 0.61 | 4.81 ± 0.48 * | 2.39 ± 0.35 | 3.37 ± 0.93 | 4.55 ± 0.82 * | 3.52 ± 0.56 | 4.04 ± 0.27 | |
| Gram-negative bacteria (nmol/g) | 0–10 cm | 4.22 ± 1.43 | 2.00 ± 0.45 | 1.64 ± 0.39 | 2.01 ± 0.23 | 1.54 ± 0.42 | 2.02 ± 0.76 | 2.51 ± 0.65 | 1.68 ± 0.39 | 2.66 ± 0.70 |
| 10–20 cm | 3.77 ± 2.43 | 2.40 ± 0.95 | 1.43 ± 0.21 | 1.89 ± 0.36 | 0.83 ± 0.38 | 2.37 ± 0.38 * | 1.98 ± 0.21 ** | 1.32 ± 0.24 | 1.44 ± 0.12 | |
| Fungi (nmol/g) | 0–10 cm | 1.43 ± 0.26 | 1.13 ± 0.50 | 1.93 ± 0.38 | 1.64 ± 0.75 | 1.04 ± 0.23 | 0.83 ± 0.24 | 0.99 ± 0.23 | 1.71 ± 0.97 | 1.26 ± 0.02 |
| 10–20 cm | 1.61 ± 0.74 | 1.34 ± 0.63 | 1.51 ± 0.63 | 0.85 ± 0.12 | 0.58 ± 0.17 | 0.91 ± 0.04 | 0.73 ± 0.07 | 1.51 ± 0.87 | 0.82 ± 0.17 | |
| arbuscular mycorrhizal fungi (nmol/g) | 0–10 cm | 0.78 ± 0.33 | 0.23 ± 0.06 * | 0.24 ± 0.10 | 0.25 ± 0.01 | 0.24 ± 0.06 | 0.32 ± 0.11 | 0.42 ± 0.14 | 0.25 ± 0.11 | 0.35 ± 0.10 |
| 10–20 cm | 0.70 ± 0.46 | 0.29 ± 0.17 | 0.17 ± 0.02 | 0.23 ± 0.06 | 0.17 ± 0.08 | 0.36 ± 0.06 | 0.27 ± 0.04 | 0.18 ± 0.00 | 0.25 ± 0.04 * | |
| Actinomycetes (nmol/g) | 0–10 cm | 0.59 ± 0.04 | 0.26 ± 0.06 ** | 0.32 ± 0.04 | 0.42 ± 0.11 | 0.11 ± 0.03 | 0.32 ± 0.07 ** | 0.50 ± 0.15 * | 0.34 ± 0.08 | 0.53 ± 0.17 |
| 10–20 cm | 0.68 ± 0.16 | 0.27 ± 0.04 * | 0.21 ± 0.03 | 0.36 ± 0.11 | 0.09 ± 0.01 | 0.37 ± 0.14 * | 0.36 ± 0.01 ** | 0.22 ± 0.06 | 0.31 ± 0.04 |
Note: ** indicates a highly significant difference from the control based on the t-test (p < 0.01). * indicates a significant difference (p < 0.05).
References
- Shan, H.J.; Li, M.L.; Sun, Y.; Zhou, H. Recent Development of Turf Grass Industry China. Acta Agrestia Sin. 2013, 21, 222–229. [Google Scholar]
- Zhao, J.L.; Tang, F.L.; Liu, Y.J. Thoughts on development of China’s turf industry in the context of ecological civilization construction. Pratacultural Sci. 2021, 38, 2077–2086. [Google Scholar]
- Haydu, J.J.; Hodges, A.W.; Hall, C.R. Economic Impacts of the Turfgrass and Lawncare Industry in the United States. Edis 2006, 2006. [Google Scholar] [CrossRef]
- Hu, L.; Bian, X.J.; Yang, X.L. Turf Science and Management; China Agricultural University Press: Beijing, China, 2001. [Google Scholar]
- Griffith, S.; Bero, N.; Stier, J.; Obear, G.; Ruis, S.; Soldat, D. Biosolids as an Alternative Fertilizer for Kentucky Bluegrass Sod Production in Wisconsin. Crop Sci. 2017, 57, S227–S237. [Google Scholar] [CrossRef]
- Zhang, J.; Maleski, J.; Jespersen, D.; Waltz, F.C.; Rains, G.; Schwartz, B. Unmanned Aerial System-Based Weed Mapping in Sod Production Using a Convolutional Neural Network. Front. Plant Sci. 2021, 12, 702626. [Google Scholar] [CrossRef] [PubMed]
- Braun, R.C.; Watkins, E.; Hollman, A.B.; Mihelich, N.T.; Patton, A.J. Investigation of cool-season species, seeding rate, and nitrogen fertilization in sod production: II. Management and shelf-life. Agron. J. 2021, 113, 3460–3474. [Google Scholar] [CrossRef]
- Griffith, S.; Bero, N.; Stier, J.; Obear, G.; Ruis, S.J.; Soldat, D. Use of biosolids for sod production: Impact on the import/export of nutrients, heavy metals, and soil mineral matter. Agron. J. 2020, 112, 3371–3382. [Google Scholar] [CrossRef]
- Braun, R.C.; Watkins, E.; Hollman, A.B.; Mihelich, N.T.; Patton, A.J. Investigation of cool-season species, seeding rate, and nitrogen fertilization in sod production: I. Establishment and sod tensile strength. Agron. J. 2021, 113, 4176–4189. [Google Scholar] [CrossRef]
- Li, D.Y.; Fang, W.J.; Han, L.B. Nitrogen Fertilization Influences Shear Strength and Quality of Kentucky Bluegrass Sod Grown on Clay. Agron. J. 2011, 103, 751–755. [Google Scholar] [CrossRef]
- Cui, J.Y.; Mu, K.G.; Hu, L.; Zhang, F.S.; Xu, S.H. Studies on the effects of sod-production on soil quality in Beijing area. Pratacultural Sci. 2003, 20, 68–72. [Google Scholar]
- Lin, H.S.; Yu, Y.M.; Xie, X.H. Effect of Continuous Annual Carpet Sod Production on Soil Properties. North. Hortic. 2009, 6, 172–174. [Google Scholar]
- Tesfamariam, E.H.; Annandale, J.G.; Steyn, J.M.; Stirzaker, R.J. Exporting Large Volumes of Municipal Sewage Sludge through Turfgrass Sod Production. J. Environ. Qual. 2009, 38, 1320–1328. [Google Scholar] [CrossRef] [PubMed]
- Parlak, M.; Everest, T.; Ruis, S.J.; Blanco, H. Impact of urbanization on soil loss: A case study from sod production. Environ. Monit. Assess. 2020, 192, 588. [Google Scholar] [CrossRef]
- Chapin, F.S., III; McFarland, J.; McGuire, A.D.; Euskirchen, E.S.; Ruess, R.W.; Kielland, K. The changing global carbon cycle: Linking plant-soil carbon dynamics to global consequences. J. Ecol. 2009, 97, 840–850. [Google Scholar]
- Griffiths, B.S.; Philippot, L. Insights into the resistance and resilience of the soil microbial community. Fems Microbiol. Rev. 2013, 37, 112–129. [Google Scholar] [CrossRef] [PubMed]
- Zhu, J.B.; He, H.D.; Li, H.Q.; Yang, Y.S.; Wei, Y.X.; Luo, J.; Li, Y.N. Characteristics of Soil Bulk Density and Soil Water-Holding Capacity in Alpine Meadow Under Grazing Gradients. Res. Water Conserv. 2018, 25, 66–71. [Google Scholar] [CrossRef]
- Bao, S.D. Soil Analysis in Agricultural Chemistry; China Agriculture Press: Beijing, China, 2000. [Google Scholar]
- Bossio, D.A.; Scow, K.M.; Gunapala, N.; Graham, K.J. Determinants of soil microbial communities: Effects of agricultural management, season, and soil type on phospholipid fatty acid profiles. Microb. Ecol. 1998, 36, 1–12. [Google Scholar] [CrossRef]
- van Groenigen, K.J.; Osenberg, C.W.; Hungate, B.A. Increased soil emissions of potent greenhouse gases under increased atmospheric CO2. Nature 2011, 475, 214–216. [Google Scholar] [CrossRef]
- Liu, Q.F.; Li, M.D.; Duan, J.N.; Wu, H.Y. The Spatio-temporal Variation of Benefit of Cultivated Land Use Based on GIS Technology in Hunan Province. Econ. Geogr. 2013, 33, 142–147. [Google Scholar]
- Wang, Q.L.; Cao, Y.; Wang, B. Effects of sand covering on phycochemical properties of saline alkali soil and ryegrass growth. Land Dev. Eng. Res. 2018, 3, 53–57. [Google Scholar]
- Tao, J. Time-Scale Effect of Different Herb Plant Roots Distribution on Soil Physical and Chemical Properties in The Three Gorges Reservoir Area. Master’s Thesis, Southwest University, Chongqing, China, 2013. [Google Scholar]
- Zhang, H.H.; Wang, S.B.; Wang, J.R.; Wu, X.Y.; Ma, S.L.; Wu, Y.N.; Li, J.B.; Xu, N. Effects of different land use types on soil physicochemical properties and aggregate composition in Sanjiang Plain wetland. Chin. J. Ecol. 2019, 38, 1679–1687. [Google Scholar]
- Montemurro, F.; Maiorana, M.; Lacertosa, G. Plant and soil nitrogen indicators and performance of tomato grown at different nitrogen fertilization levels. J. Food Agric. Environ. 2007, 5, 143–148. [Google Scholar]
- Cheng, W.J.; Cui, J.Y.; Min, F.H.; Hu, L. Root distribution characteristics of three turfgrasses and their impact on soil nutrient content. Acta Prataculturae Sin. 2009, 18, 179–183. [Google Scholar]
- Robertson, G.P.; Gross, K.L.; Hamilton, S.K.; Landis, D.A.; Schmidt, T.M.; Snapp, S.S.; Swinton, S.M. Farming for Ecosystem Services: An Ecological Approach to Production Agriculture. Bioscience 2014, 64, 404–415. [Google Scholar] [CrossRef]
- Liu, X.; Herbert, S.J.; Hashemi, A.M.; Zhang, X.; Ding, G. Effects of agricultural management on soil organic matter and carbon transformation—A review. Plant Soil Environ. 2006, 52, 531–543. [Google Scholar] [CrossRef]
- Vesterdal, L.; Ritter, E.; Gundersen, P. Change in soil organic carbon following afforestation of former arable land. For. Ecol. Manag. 2002, 169, 137–147. [Google Scholar] [CrossRef]
- Zheng, L.W. Effect of Root System on Soil Properties. Master’s Thesis, Beijing Forestry University, Beijing, China, 2015. [Google Scholar]
- Qian, J. Study on Association Nitrogen Fixation with Azotobacter Chroococcum and Bermudagrass. Master’s Thesis, Yangzhou University, Yangzhou, China, 2020. [Google Scholar]
- Lu, S.F.; Wang, C.Y.; Du, Y.; Wu, Y.S.; Gao, Y.H.; Liu, S.X. Effects of rice planting years on physicochemical property and fungi community in soda saline-alkali soil. South China Agric. Univ. 2019, 40, 15–22. [Google Scholar]
- Wang, N.; Zang, J.; Guo, X.; Wang, H.; Huang, N.; Zhao, C.; Zhao, X.; Liu, J. Role of rice cultivation on fluorine distribution behavior in soda saline-alkali land. Sci. Total Environ. 2022, 835, 155543. [Google Scholar] [CrossRef] [PubMed]
- Tian, X.P.; Tao, Y.X.; Wang, L.J.; Ji, J.H. The Effect of Different Cultivating on Nutrient and Crop Yield in Albic Soils. Heilongjiang August First Land Reclam. Univ. 2002, 9–11. [Google Scholar]
- Martin-Rueda, I.; Munoz-Guerra, L.M.; Yunta, F.; Esteban, E.; Tenorio, J.L.; Lucena, J.J. Tillage and crop rotation effects on barley yield and soil nutrients on a Calciortidic Haploxeralf. Soil Tillage Res. 2007, 92, 1–9. [Google Scholar] [CrossRef]
- Wang, Z.; Xiao, L.W.; Tan, Q.X.; Tian, L.L.; Zhu, B. Nitrogen and Phosphorus Absorption from Soil by the Dominant Herbaceous Species in the Water-Level-Fluctuation Zone of the Three Gorges Reservoir. Mt. Res. 2019, 37, 151–160. [Google Scholar]
- Garg, D.; Patel, N.; Rawat, A.; Rosado, A.S. Cutting edge tools in the field of soil microbiology. Curr. Res. Microb. Sci. 2024, 6, 100226. [Google Scholar] [CrossRef] [PubMed]
- Nan, L.L.; Shi, S.L.; Yu, J.h. Soil Microbial Properties in Alfalfa Field with Different Growing Years in Arid Desert Oasis. Acta Agrestia Sin. 2016, 24, 975–980. [Google Scholar]
- Liu, Y.J.; Wang, W.J.; Wang, H.G.; Wang, Q.; Hu, Q.G.; Chu, F.L. Effects of Crop Rotation on Soil Microbial Community in Sweet Potato Field. Crops 2021, 122–128. [Google Scholar]
- Li, R.; Liu, Y.; Chu, G.X. Effects of different cropping patterns on soil enzyme activities and soil microbial community diversity in oasis farmland. Chin. J. Appl. Ecol. 2015, 26, 490–496. [Google Scholar]
- Zhou, J.H.; Gao, R.R.; Wei, Q.; Yuan, Y.H.; Pu, H.Y. Effects of Different Land Use Patterns on Enzyme Activities and Microbial Diversity in Upland Red Soil. Soil Water Conserv. 2020, 34, 327–332. [Google Scholar]
- Wang, X.Y.; Zeng, M.; Wu, H.H. Analysis on the effect of microorganisms on soil rot transformation. South China Agric. 2018, 12, 190–193. [Google Scholar]
- Gu, H.F. Differences and Influencing Factors of PLFA Fingerprints under Different Land Use Patterns in Red Soil. Master’s Thesis, Chinese Academy of Agricultural Sciences, Beijing, China, 2021. [Google Scholar]
- Cao, Z.P.; Li, D.P.; Han, X.M. The fungal to bacterial ratio in soil food webs, and its measurement. Acta Ecol. Sin. 2011, 31, 4741–4748. [Google Scholar]
- Du, Z.; Xie, Y.; Hu, L.; Hu, L.; Xu, S.; Li, D.; Wang, G.; Fu, J. Effects of Fertilization and Clipping on Carbon, Nitrogen Storage, and Soil Microbial Activity in a Natural Grassland in Southern China. PLoS ONE 2014, 9, e99385. [Google Scholar] [CrossRef]
- Galicia, L.; García-Oliva, F. The effects of C, N and P additions on soil microbial activity under two remnant tree species in a tropical seasonal pasture. Appl. Soil Ecol. 2004, 26, 31–39. [Google Scholar] [CrossRef]
- Zhu, K.; Wang, R.; Li, G.; Xiu, W.M.; Wang, J.; Li, B.; Wang, L.L.; Liu, H.F.; Zhao, J.N.; Yang, D.L. The response of microbial biomass carbon and metabolic characteristics of albic soil to land use change. Agro-Environ. Sci. 2018, 37, 2194–2201. [Google Scholar]
- Wang, Z.F. Characteristics of Soil Nutrients and Enzyme Activity Under Different Types of Land Use in Wetland of Sanjiang Plain. Res. Soil Water Conserv. 2019, 26, 43–48. [Google Scholar]
- Du, N.N.; Qiu, L.P.; Zhang, X.C.; Cheng, J.M. Effect of land use on mineralization of soil carbon and nitrogen in semi-arid grasslands. Agric. Res. Arid Areas 2017, 35, 73–78. [Google Scholar]
- Yan, P.C. Study on the nutrient and enzyme activity and microorganism property for the soil of three forests types in mountainous region from eastern Liaoning Province. Master’s Thesis, Shenyang Agricultural University, Shenyang, China, 2018. [Google Scholar]


Disclaimer/Publisher’s Note: The statements, opinions and data contained in all publications are solely those of the individual author(s) and contributor(s) and not of MDPI and/or the editor(s). MDPI and/or the editor(s) disclaim responsibility for any injury to people or property resulting from any ideas, methods, instructions or products referred to in the content. |
© 2024 by the authors. Licensee MDPI, Basel, Switzerland. This article is an open access article distributed under the terms and conditions of the Creative Commons Attribution (CC BY) license (https://creativecommons.org/licenses/by/4.0/).