Abstract
Topography is an important factor that impacts the hydrological processes on sloping farmlands. Yet, few studies have reported the combined influences of slope gradient and slope position on infiltration characteristics and hydrodynamic parameters on sloping croplands in purple soil regions, an important area for agricultural productivity in Southwest China. Here, laboratory-simulated rainfall experiments were conducted in a steel trough (5 m long, 2 m wide, and 0.45 m deep), and rainfall lasted for 1 h at a rate of 90 mm h−1 to examine the variations in the infiltration rates and hydrodynamic parameters under varying slope gradients (i.e., 3°, 6°, 10°, 15°, 21°, and 27°) and slope positions (i.e., upper, middle, and lower), and explore the relationships between the infiltration rate and the soil detachment rate. The results showed that the infiltration rate decreased gradually with duration rainfall and ultimately approached a steady state in the six slope treatments. Cumulative infiltration ranged from 15.54 to 39.32 mm during rainfall, and gradually reduced with the increase of slope gradient. The Horton’s model outperforms other models for predicting the infiltration rate with an R2 value of 0.86. Factors such as Darcy–Weisbach friction, flow shear force, Manning friction coefficient, unit energy, and runoff depth varied in the following order: upper slope > middle slope > lower slope, whilst the Reynolds number and Froude number gradually increased along the slope transect from the upper to lower slope positions. A significant linear function was fitted between the soil detachment rate and the infiltration rate at the gentle slopes (3°, 6°, 10°), whereas an exponential relationship was observed at the steep slopes (15°, 21°, and 27°). Observation also suggested that 15° was the critical slope gradient of sediment detachment, infiltration characteristics, and hydrodynamic parameters. Our results provide theoretical insight for developing models that predict the impacts of topographic factors on hydrological characteristic and soil erosion in hilly agricultural landscapes of purple soil fields.
1. Introduction
Soil water content is the crucial limiting factor for developing sustainable agricultural practices and maintaining an ecological balance. Precipitation infiltration plays a vital role in supplying soil water, which is important for the crop growth and groundwater recharge in agricultural landscapes [1,2,3]. Soil infiltration refers to the process in which precipitation penetrates into soil from the surface to increase the soil water content. The amount of water infiltrating the soil surface has a direct effect on the quantity of surface runoff and the soil detachment rate, and the recharging of both soil and groundwater [4]. As an important part of the hydrological cycle, infiltration is the only way for surface water, such as falling water, to be transformed into soil water. Thus, the quantifying of infiltration capacity is an essential issue for grain production, farmland management, and soil-loss prevention.
Previous studies have indicated that soil infiltration is commonly influenced by various factors, including soil properties, rainfall intensity, and topographic characteristics [5,6,7]. Topographic factors, such as slope gradient and slope position, play a pivotal role in determining the temporal and spatial patterns of water infiltration and surface runoff. Some authors have reported that infiltration decreases with increasing slope gradient [8,9]. However, others have claimed that steeper gradients have a positive impact on the infiltration rate [10,11]. Interestingly, some other scholars have reported that there is no obvious correlation between gradient and soil infiltration rate [12,13]. Currently, there is no strong consensus in the literature regarding the effects of the slope gradient on soil infiltration and sediment detachment [14,15], although many field and simulated experiments have been performed.
Hydrodynamic processes play an important role in soil water and soil erosion on slopes [16,17,18]. Recent literatures have shown that various topographic factors, including slope gradient, aspect, slope position, and slope length, have an enormous impact on the hydraulic parameters of overland flow, thereby affecting the soil erosion process on slopes [19,20]. Certain single hydraulic parameters, such as the Reynolds number, Froude number, Darcy–Weisbach friction, Manning friction coefficient, shear stress, stream power, and unit energy, which are composed of single hydraulic parameters, are superior to other single hydraulic parameters in characterizing soil erosion on the hillslopes [20]. Therefore, these hydrodynamic parameters have been extensively used to describe the mechanisms by which soil erosion impacts on soil hydrological properties [21,22,23]. Previous reference studies have shown that stream power (effective stream power, stream power, and unit stream power) is more effective than shear stress in characterizing soil erosion rates [24,25,26]. Gimenez and Govers (2022) [27] suggested that the processes of soil erosion and sediment transport are controlled by different hydraulic variables, whereas a single hydraulic parameter is not feasible for examining complex soil water distributions and sediment transport capacity. Therefore, as many hydrological parameters as possible should be used to fully reflect the process of soil erosion in hilly agricultural landscapes.
Purple soil is the primary agricultural soil widely distributed in the Sichuan Basin of Southwest China, which makes up approximately 70% of the agricultural land and has profound agricultural value [28]. Moreover, purple soil is distributed mainly in sloping land or steep land areas, and broken terrain and steeper slopes result in severe soil erosion in the field [29]. Owing to the complexity of the relationship between topographic factors and hydrologic processes, there is still some gap regarding the influence of slope gradient and slope position in purple soil areas. This complexity and uncertainty also limit the effective implementation of soil and water conservation measures. Therefore, this study employs simulated rainfall experiments to explore the impact of slope gradient and slope position on soil infiltration and hydrodynamic parameters in purple soil areas.
2. Materials and Methods
2.1. Experimental Materials
The experiments were completed at the Laboratory of Soil and Water Conservation, Sichuan Agricultural University, Ya’an city, China. Simulated rainfall experiments were conducted in a rectangular steel trough (5 m long, 2 m wide, and 0.45 m deep) with an adjustable slope range of 0–30°. Holes with a 2-cm diameter were set at the bottom of the steel trough to facilitate drainage. According to the distribution characteristics of sloping cropland in the experimental area, the slope gradients of the steel troughs were 3°, 6°, 10°, 15°, 20°, and 27°, with two replicates for each slope gradient. To examine the changes in hydrological characteristics at different slope positions, the steel trough was evenly divided into three segments, which, from the top to the bottom, were defined as the upper slope (0–2 m), middle slope (2–3 m), and lower slope (3–5 m). We utilized a down sprinkler rainfall simulator system to simulate rainfall. The rainfall equipment used was a well-structured artificial rainfall system (NLJY-10-03, Nanli Electronics Technology Co., Nanjing city, China), with a uniformity coefficient greater than 86% and a continuous rainfall intensity range of 30–150 mm h−1. The effective rainfall area of the experiment was 10 m × 6 m.
The experimental soil was collected from Qianjin Township, Ya’an city, Sichuan Province, in March 2023 (103°2′40″–103°24′01″ E, 29°57′36″–30°16′15″ N). The area is located at the southern edge of the Chengdu Plain and has a humid monsoon humid climate, with an average annual temperature of 15.4 °C, a maximum temperature of 35.2 °C, an average annual rainfall of 1500 mm, and an average frost-free period of 298 days. The study area is a major distribution area of purple soil with widespread slope farmland, abundant rainfall, and significant topographical variation, making the selected soil highly representative. The soil in the experimental area was derived from purple sandstone and mudstone of the Jurassic age and was classified as either Entisols according to the USDA soil taxonomy or Regosols according to the WRB, with an average of 42.62% clay (<0.002 mm), 28.33% silt (0.002–0.02 mm), and 29.05% sand (0.02–2 mm). The results of soil basic properties are presented in Table 1. The measured data showed small spatial heterogeneity of the tested soil properties. The soil pH is neutral to slightly alkaline, with a poor structure, weak erosion resistance, and susceptibility to erosion due to rainfall events.

Table 1.
Physical-chemical properties of the experimental soil.
The tested soil samples were collected from approximately the top 0.30 m, spread and dried in the laboratory after field collection, with the roots, stones, and other debris removed, and then the soil blocks were crushed through a 10-mm sieve. About 5800 kg of the treated soil was homogenously packed into a steel trough layer-by-layer. The soil amount of each layer (10-cm depth) was maintained as constant as possible to ensure identical spatial distribution of soil particles and similar soil compaction. The total soil thickness in the steel trough was 0.40 m in this experiment. A smooth board was used to level the soil surface and compacted with hand the steel trough boundary to minimize edge effects. The soil surface was kept bare throughout the experiment.
2.2. Experimental Procedure
According to the statistical analyses of local rainstorm data in the studied area, the maximum rainfall intensity in an hour ranged from approximately 60–120 mm, of which the majority was less than 100 mm. The minimum monthly precipitation over the course of the year mainly distributes in February, and the maximum occurs in August. Therefore, the rainfall intensity in this experiment was set at 90 mm h−1 with a duration of 60 min. Before running the experiments, a pre-soaking rain was simulated in the steel trough with 30 mm h−1 rainfall intensity lasting approximately 30 min to ensure uniform soil moisture for each experimental treatment. A portable soil moisture meter (Takeme-10EC, Sichuan Weinasa Technology Co., Mianyang, China) was used to measure soil water content in the steel trough to ensure that it was approximately 25%. The initial time to generate runoff was recorded with stopwatches when simulated rainfall was started. As runoff occurred from the bottom of the steel trough, sediment-laden runoff was collected with an 8.5-L plastic bucket at 2-min intervals for the entire rainfall duration, and the mass of the runoff-sediment mixture samples was recorded via an electronic scale. After the sediment suspended in the runoff was deposited, the supernatant was poured out. The lower sediment was transferred to an aluminium tray and then oven-dried at 105 °C to calculate the sediment-detachment rates.
The surface runoff velocity was measured via the KMnO4 dye tracer technique every 10 min at the upper, middle, and lower slope segments along a hillslope. A stopwatch was used to record the tracer moving time from each slope segment through the marked distance in the steel trough. For each experimental treatment, the surface runoff velocity was measured three times at each slope segment, and the mean flow velocity at different slope segments under each of the three-time measurements was calculated. To obtain the average velocity, the dye-technique velocity requires multiplication by a correction coefficient (α). A series of factors may impact the α value, including vegetation cover, slope gradient, slope position, and flow depth, with a range of 0.2 to 0.8. According to the previous studies [30], we utilized 0.67 as the correction coefficient for the surface flow.
2.3. Parameter Calculation
Reynolds number (Re) and Froude number (Fr) were determined by comparing the relative magnitude of inertial force to viscous force, and inertial force to gravitational force of the water flow. Dimensionless indicators were employed to ascertain whether the water flow was in a turbulent or laminar state. The calculation formulas are as below [19,30]:
where Vm is the average velocity of flow after correction, m s−1, Vm = 0.67V0 (where V0 is the surface flow velocity, m s−1); h represents the runoff depth, m; μ stands for the viscosity coefficient of flow movement, m2 s−1; g denotes the acceleration of gravity, with the value of 9.81 m s−2; d represents the temperature of the water flow, °C; Q is the flow rate during rainfall event, m3 s−1; B represents the width of water-crossing section, m.
Darcy–Weisbach friction and Manning friction coefficient were used to characterize retardation of flow and can be calculated by Equations (6) and (7), respectively:
where f means Darcy–Weisbach friction; n means Manning friction coefficient; and J means the hydraulic gradient, J = sin θ (where θ is the slope gradient).
Flow shear stress played a crucial role in characterizing soil erosion. The formula for calculating shear stress is as follows:
where τ represents the flow shear stress, Pa; ρ represents the density of water, kg m−3; and R stands for the hydraulic radius, m.
Stream power and Unit energy were commonly regarded as reliable parameters used to predict and sediment transport capacity soil erosion. The calculations were based on the following equations:
where w means stream power, W·m−2; E represents the unit energy, m; and a represents the kinetic energy correction coefficient (a = 1).
Soil detachment rate was calculated using the following equation:
where Dr is the soil detachment rate, g min−1 m−2; T is the sampling time of the surface runoff sediment samples, min; and L is the slope length, m.
Soil infiltration rate was estimated by the following equation [31]:
where i means infiltration rate; I means rainfall intensity, mm min−2; S means the area of experimental steel trough, mm2; and Ru means runoff amount, mL.
In this study, three infiltration models considered by considering test infiltration data for estimating the most reliable model for the study are given below [32]:
Kostiakov’s equation
where I(t) represents the infiltration rate at time t (mm min−1); and a and b denote the parameter of the model.
Horton’s equation
where I(t) means the infiltration rate at time t (mm min−1); If represents steady-state infiltration rate (mm min−1); Ii denotes initial infiltration rate (mm min−1); and c represents exponent governing the rate of decline of infiltration rates (1/min).
Philip’s equation
where I(t) represents the infiltration rate at time t (mm min−1); A represents the Darcy’s hydraulic conductivity (mm min−1); and B denotes the parameter of the model.
2.4. Statistical Analysis
Two-way analysis of variance (ANOVA) followed by Tukey’s post-hoc tests were conducted to assess the impacts of slope gradient, slope position, and their interaction on hydrodynamic parameters. Pearson correlation was employed to measure the associations between the soil detachment rate and the infiltration rate. Principal component analysis was used to determine the relationships between hydrodynamic parameters across various slope gradients and slope positions. Statistical analyses were conducted using Origin 2021 and R version 4.3.3.
3. Results
3.1. Infiltration Characteristics under Different Slope Gradients
The infiltration rate and cumulative infiltration amount showed rapid and obvious responses to rainfall duration and slope gradient, as we had expected (Figure 1). Overall, the infiltration rate during the initial stage of the experiment was the highest. Figure 1a shows that the infiltration rate decreases with increasing rainfall time from the start of infiltration until a constant infiltration rate is attained. The infiltration rate on the gentle slopes (3°, 6°, and 10°) slowly declined during the rainfall process, whereas that on the steep slopes (15°, 21°, and 27°) could remarkably be divided into two stages: the rapidly decreasing stage and the relatively stable stage. The cumulative infiltration amounts on slope gradients of 3°, 6°, 10°, 15°, 21°, and 27° were 39.32 mm, 37.88 mm, 36.55 mm, 27.12 mm, 21.57 mm, and 15.55 mm, respectively. The larger the slope gradient is, the smaller the average infiltration and cumulative infiltration amount. The results indicate that the rates of increase in both soil infiltration and cumulative infiltration amount increase with the slope gradient and duration of rainfall, showing that steep slopes are more likely to cause surface runoff than gentle slopes are and that 15° may be the critical slope for the infiltration rate and cumulative infiltration in the hilly area of purple soil.
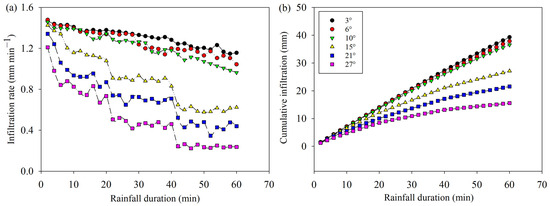
Figure 1.
Variation of infiltration rate (a) and cumulative infiltration (b) with duration rainfall under different slope gradients.
The values of different parameters of different infiltration models were estimated via simulated rainfall data and are presented in Table 2. The mean values of the a and b parameters of the Kostiakov model were found to be 1.779 and 0.207, respectively, on the basis of the simulated rainfall data, and the b value increased with the increase of the slope gradient. The mean values of parameters Ii, If, and c in the Horton model were 1.354, 0.759, and 0.035, respectively, and the If value decreased with the increase of the slope gradient. The values of the A and B parameters of the Philip model were 0.704 and 1.262, respectively, and the A value decreased as the slope gradient increased; yet the B value increased. The RMSE of the Kostiakov model ranged from 0.002 to 0.013, with an average value of 0.007; the values of the Horton model varied between 0.001 and 0.008, with an average value of 0.005; and the values of the Philip model ranged between 0.003 and 0.020, with an average value of 0.010. The findings suggest that the Horton model outperforms the other models, with a high degree of R2 and a low degree of MSE, followed by the Kostiakov and Philip models. Therefore, the Horton model is better than the Kostiakov and Philip models in this study.
Table 2.
Descriptive Parameters of the Fitted Kostiakov’s Equation, Horton’s Equation, and Philip’s Equation.
3.2. Hydrodynamic Parameters under Different Slope Gradients and Slope Positions
The variations in the hydrodynamic parameters under different slope gradients and slope positions are shown in Table 3. The mean Reynolds number and Froude number varied from 124.86 to 536.57 and 0.16 to 0.19 across the various slope treatments, respectively, falling below 2000 and 1, implying that the surface flow was a subcritical transition flow. The average Darcy–Weisbach friction varied from 36.01 to 152.47, and the Manning friction coefficient varied from 0.26 to 1.08 across the treatments. The observed values of flow shear stress, runoff depth, stream power, and unit energy ranged from 2.85–46.75 Pa, 5.02–10.21 × 10⁻³ m, 0.08–2.97 W m−2, and 50.95–101.93 × 10⁻³ m, respectively.
Table 3.
Hydrodynamic parameters of slope surfaces at different slopes and slope positions.
In general, the hydrodynamic parameters increase gradually with the increase of the slope gradient. The Darcy–Weisbach friction, flow shear force, Manning friction coefficient, unit energy, and runoff depth on various slopes show the following trend: lower slope < middle slope < upper slope, whereas the Reynolds number and Froude number show the opposite trend: lower slope > middle slope > upper slope. The stream power varies little between different slope positions. Significant differences (p < 0.05) in the Reynolds number, Froude number, Manning friction coefficient, flow shear stress, and runoff depth were found among the different slope positions on the 3° slope according to the multiple comparisons. For each slope treatment, there was a significant difference in the Darcy–Weisbach friction between the upper slope and lower slope positions. The hydrodynamic parameters have changed notably when the slope gradient was greater than 15°. These results suggest that slope gradient and slope position had different effects on hydrodynamic parameters during the rainfall event.
3.3. Hydrodynamic Parameters in Response to Topographic Factors
A multifactor analysis of variance was performed on the hydrodynamic parameters, and the results are shown in Table 4. In general, slope gradient, slope position, and their interaction had significant impacts on the six hydrodynamic parameters, including the runoff depth, Froude number, Darcy–Weisbach friction, Manning friction coefficient, flow shear stress, and unit energy. Moreover, we applied a Mantel test to determine the correlations among the hydrodynamic parameters and topographic factors. We determined that runoff depth was significantly correlated with other hydrodynamic parameters. Slope gradient was highly correlated with the Reynolds number, flow shear stress, and stream power (Figure 2a), whereas the slope position was highly correlated with the runoff depth, Froude number, Darcy–Weisbach friction, Manning friction coefficient, and unit energy (Figure 2b). These findings indicate that topographic factors have an important influence on the hydrodynamic parameters of agricultural soils.
Table 4.
Effects of slope gradient, slope position, and their interaction on hydrodynamic parameters.
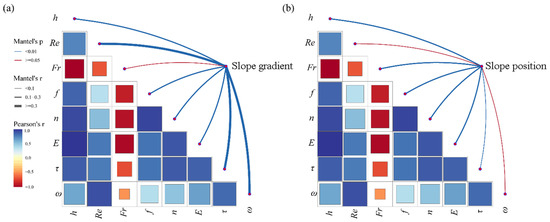
Figure 2.
Mantel test and correlation between hydrodynamic parameters and topographic factors. Note: (a) slope gradient vs. hydrodynamic parameters, (b) slope position vs. hydrodynamic parameters.
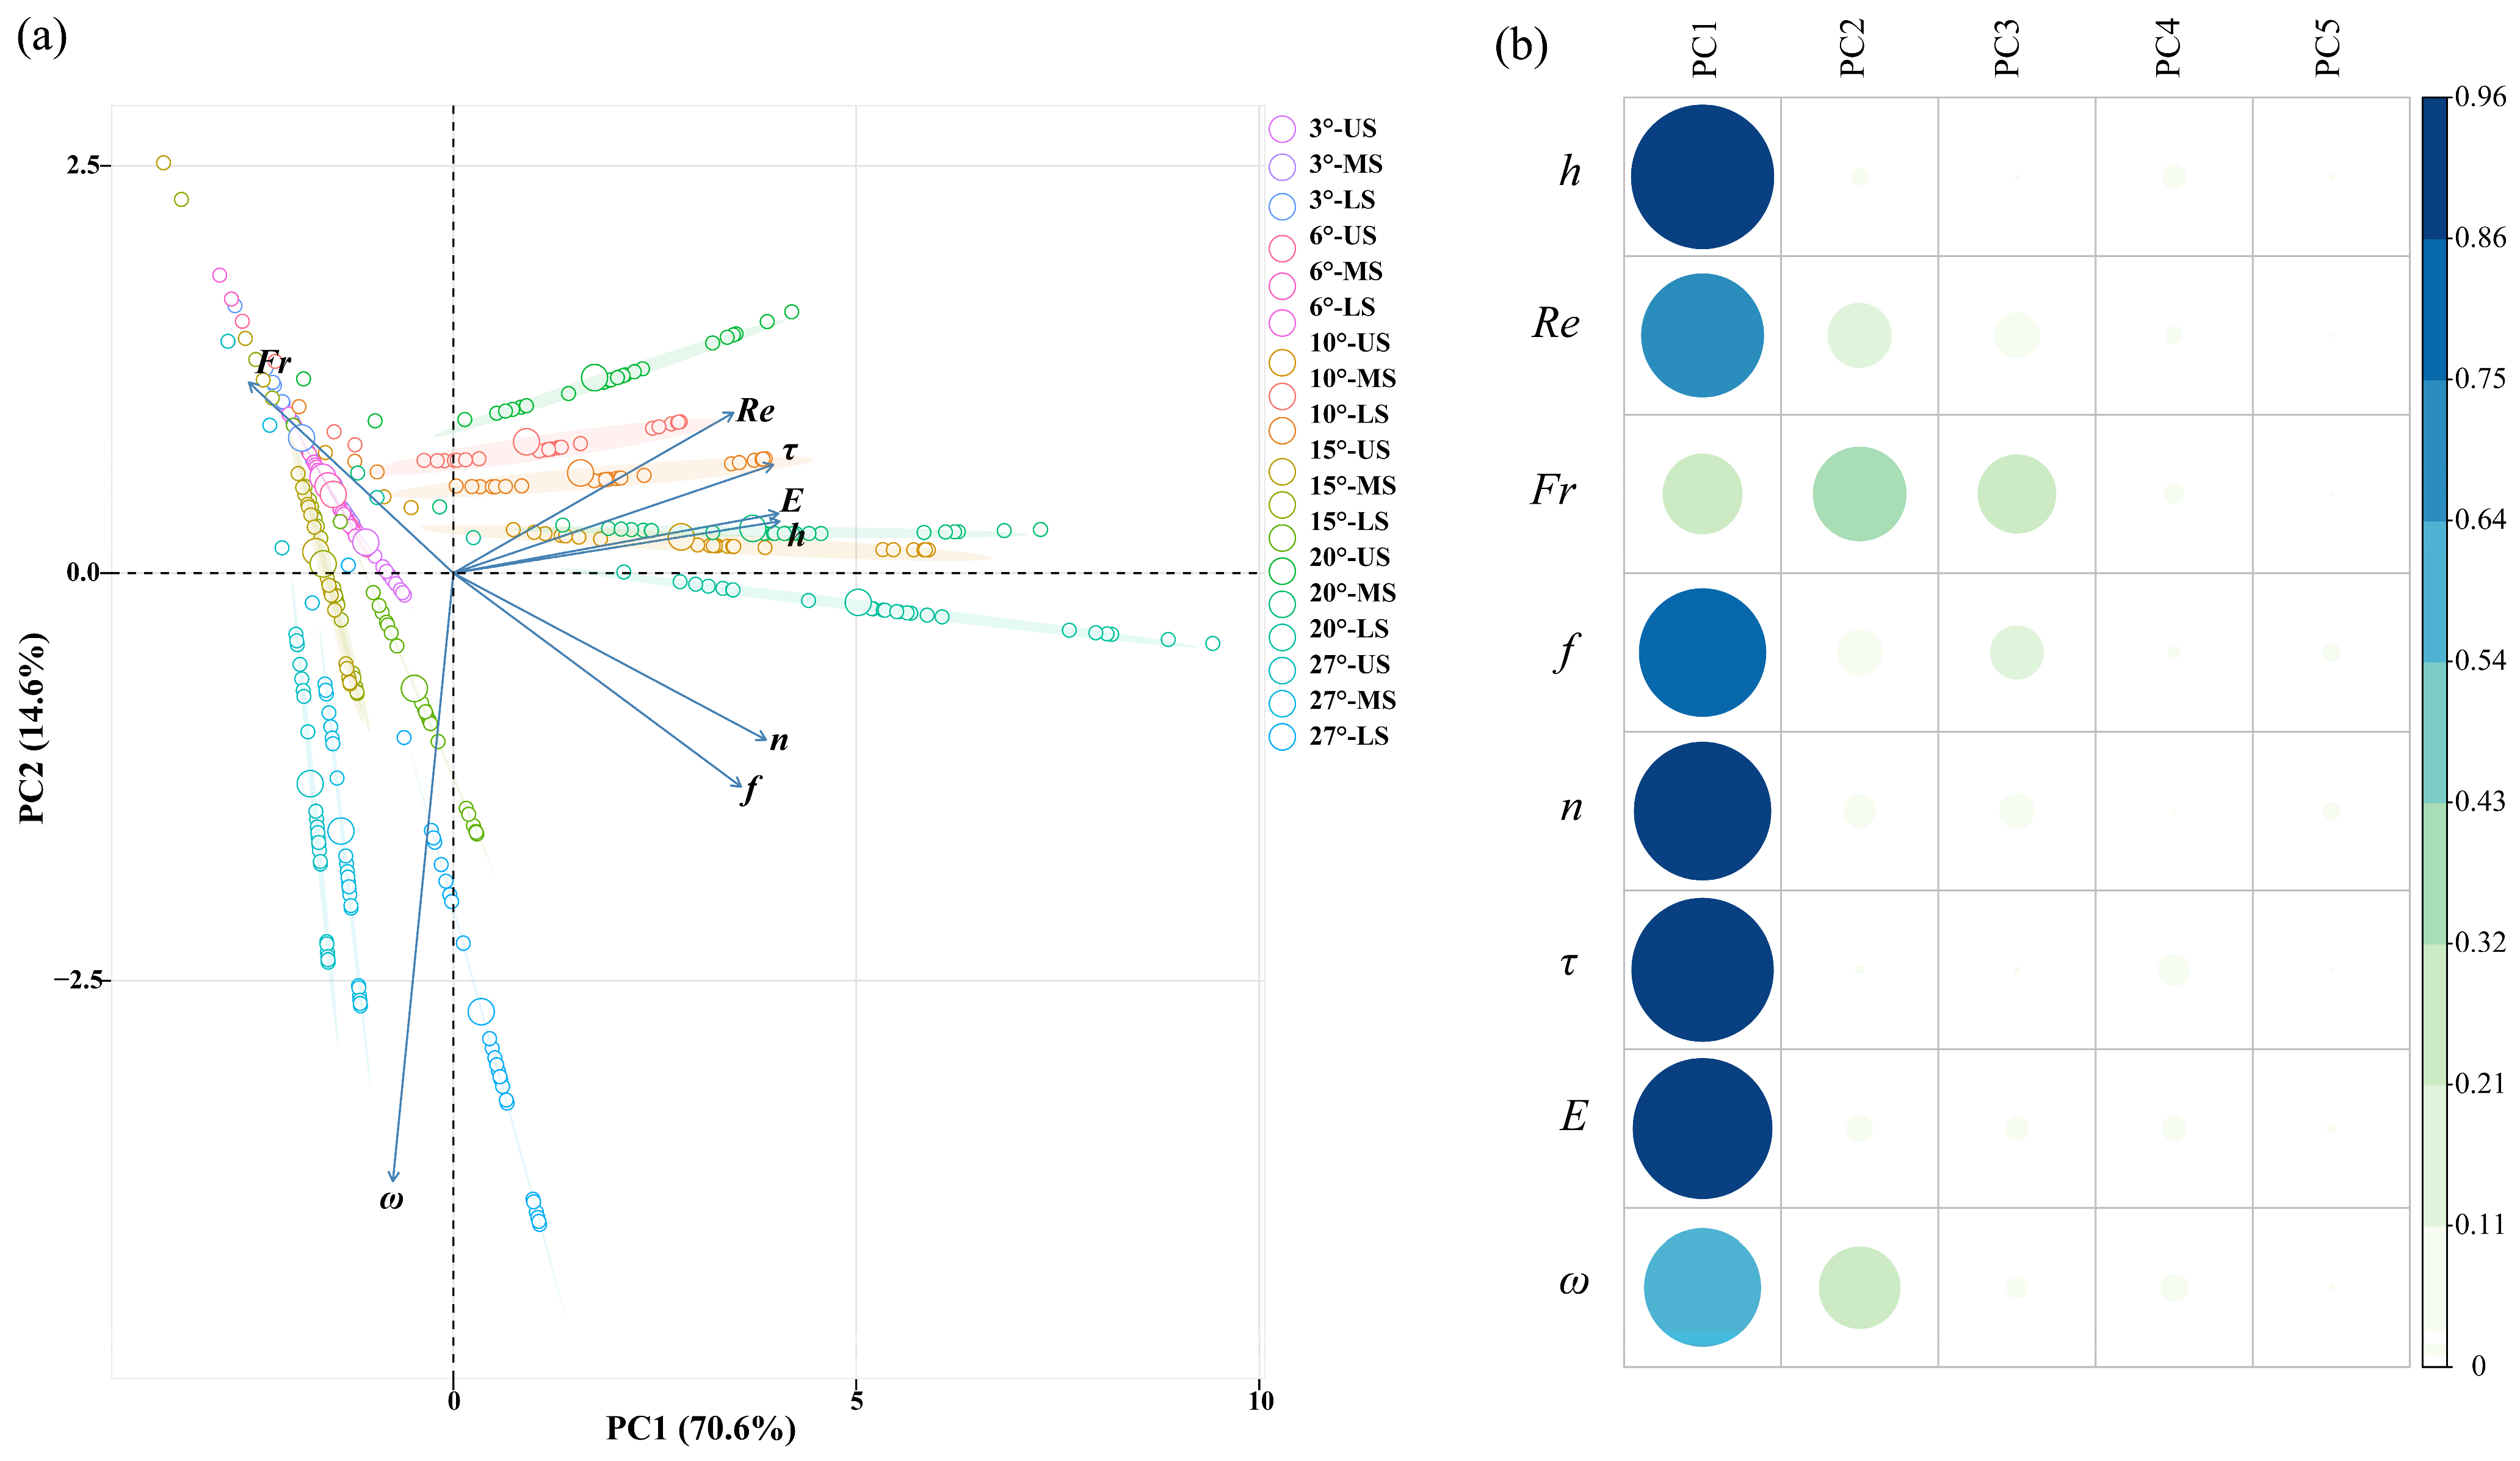
The first two principal components obtained via the principal component analysis method were extracted from these hydrodynamic parameters under different slope gradients and slope positions, and their cumulative variance reached 85.2% (70.6% and 14.6%, respectively, for components 1 and 2; Figure 3), indicating that these two components can effectively explain the comprehensive impact of the hydrodynamic parameters. Additionally, on the basis of the results of the principal component analysis, the Reynolds number, flow shear stress, runoff depth, and unit energy are located in the first quadrant; the Froude number is located in the second quadrant; the Stream power is located in the third quadrant; and the Manning friction coefficient and Darcy–Weisbach friction are located in the fourth quadrant. These results suggest that, based on the principal component loadings, the hydrodynamic parameters under different slope gradients and slope position conditions can be categorized into two comprehensive indicators, and the results can provide useful insight for developing hydrological prediction models.
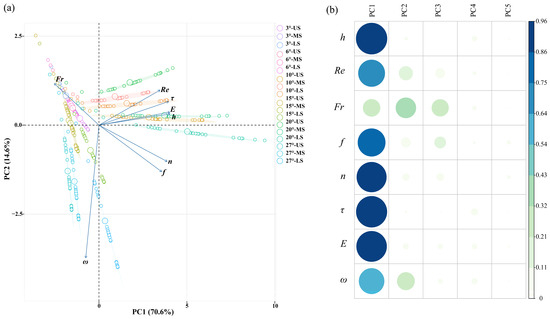
Figure 3.
PCA analysis of hydrodynamic parameters across various slope gradients and slope positions. Note: (a) biplot of PCA principal component analysis of hydrodynamic parameters; (b) heat map of Cos2 values for each factor, where Cos2 values range from 0 to 1, with darker colors indicating larger values. US means upper slope; MS means middle slope; and LS means lower slope.
3.4. Relationship between the Hydrodynamic Parameter and the Soil Detachment Rate
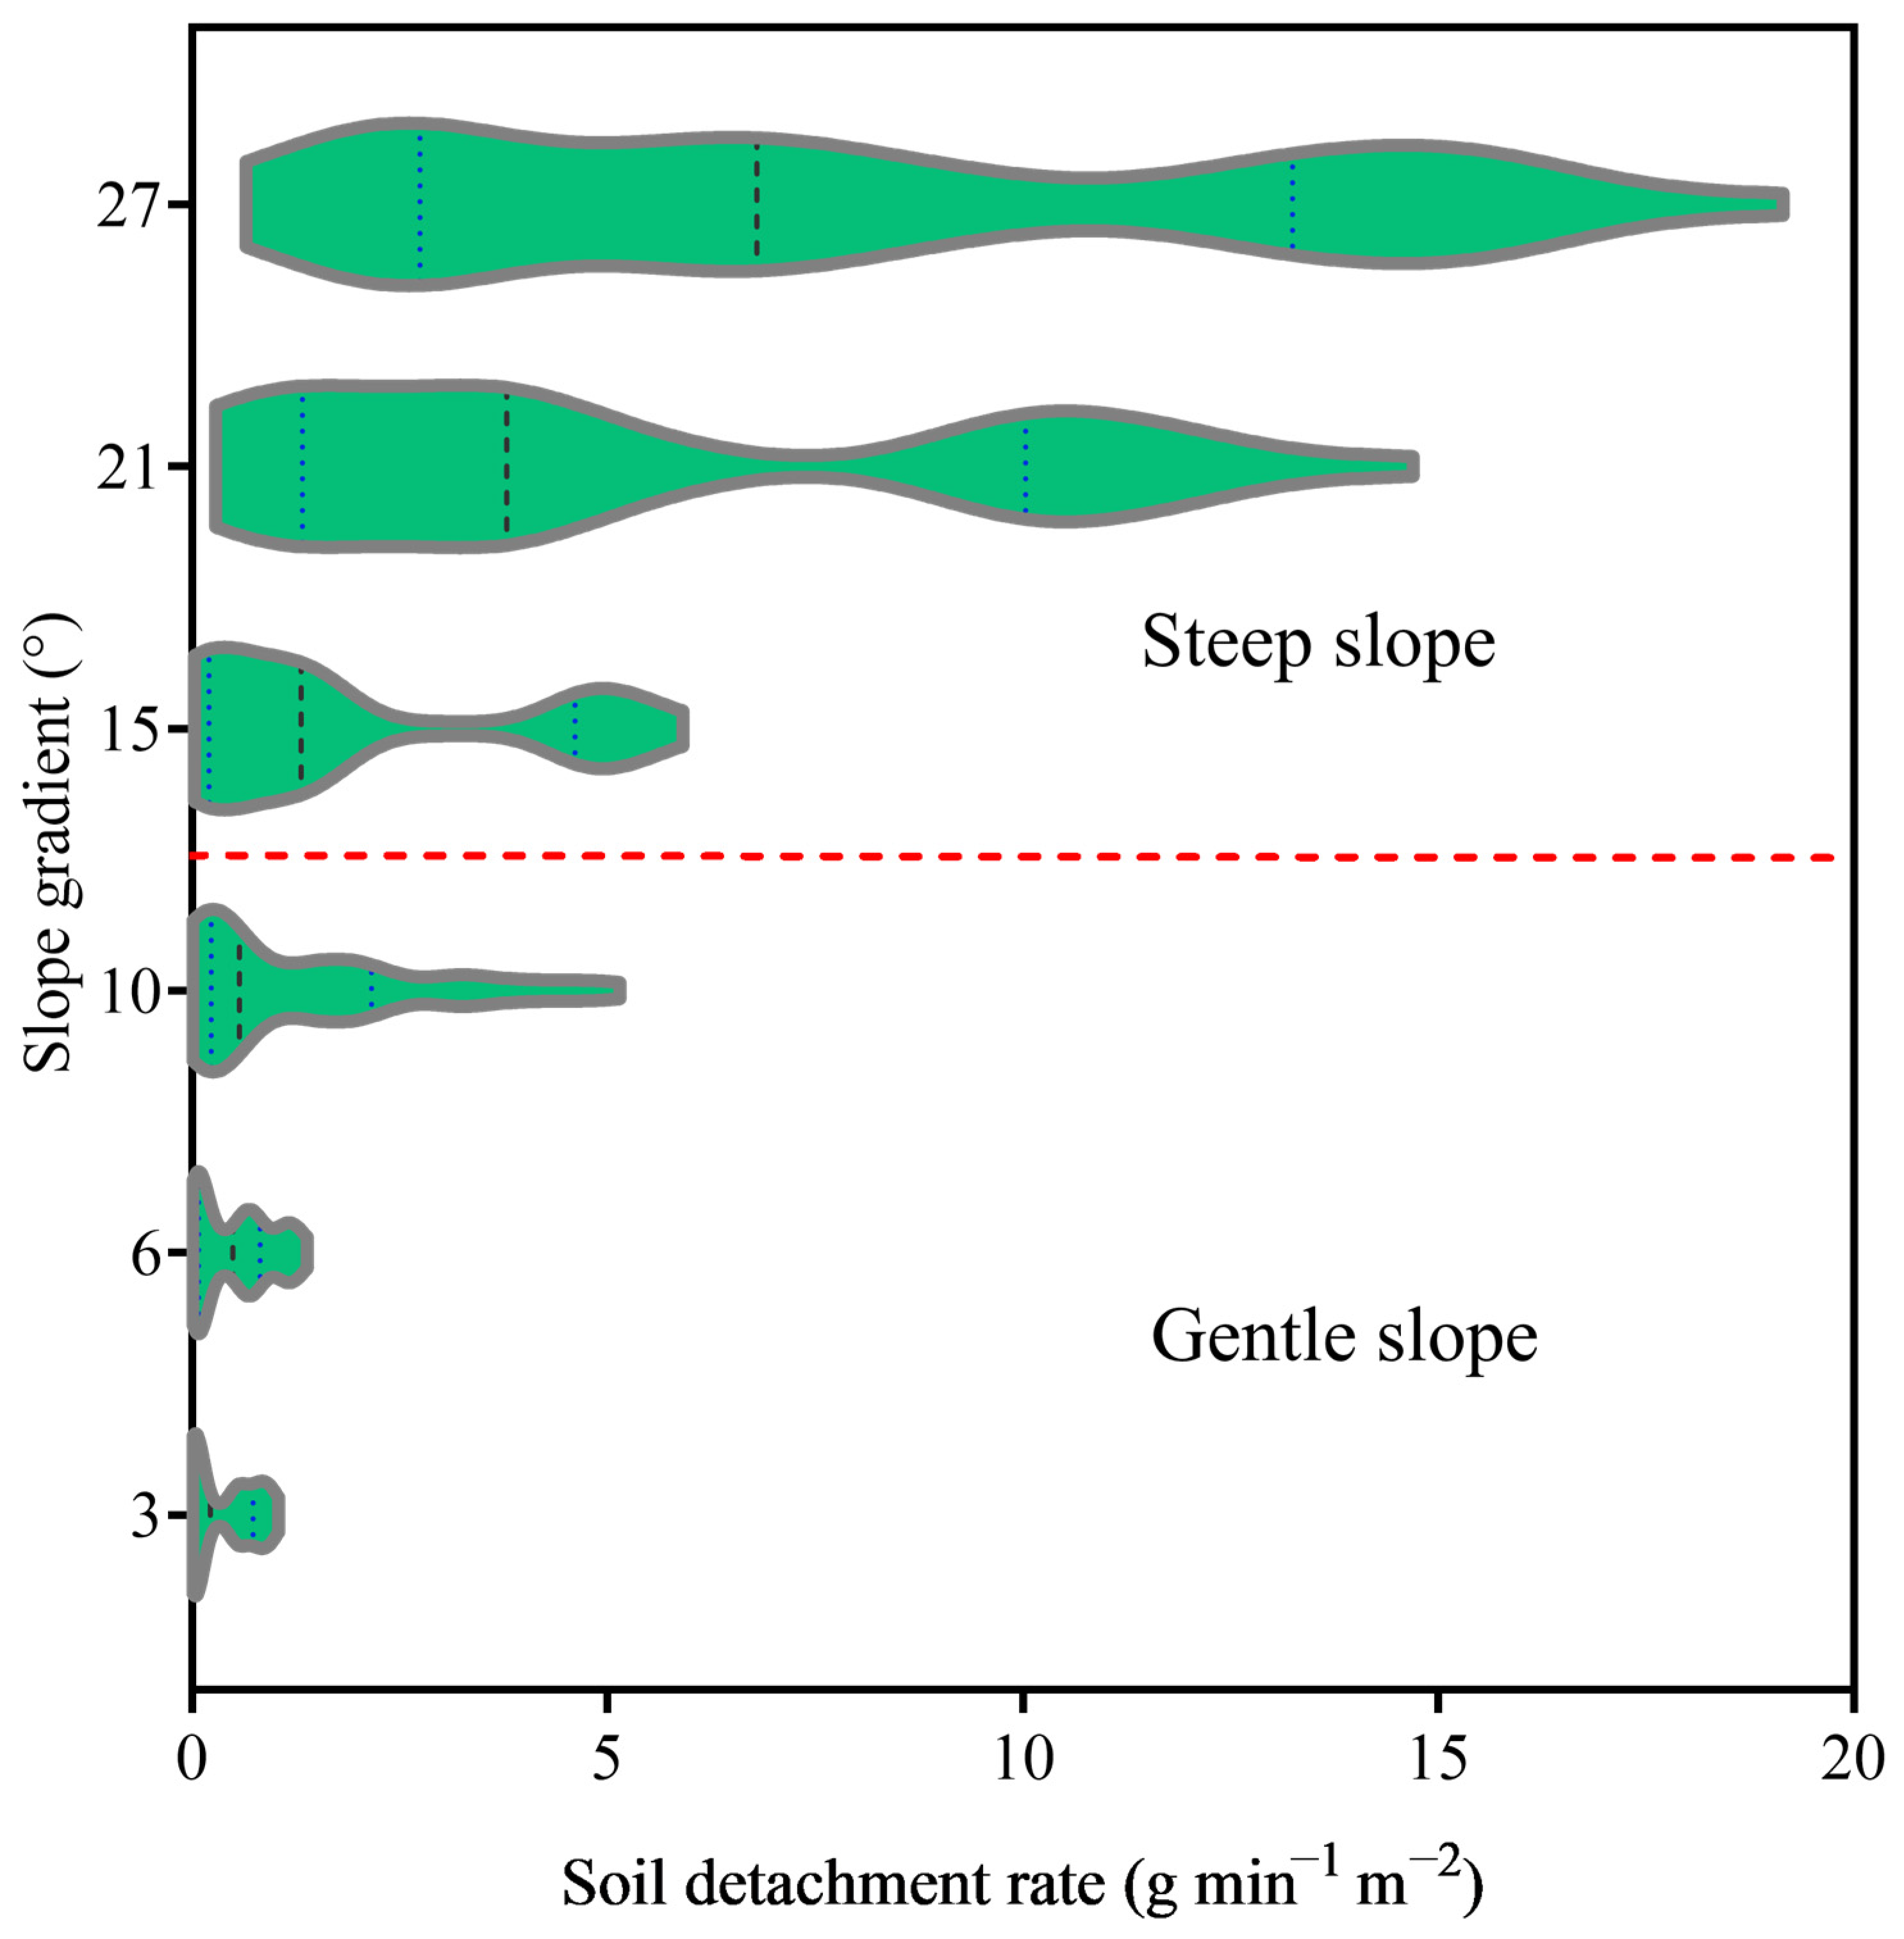
The mean soil detachment rate increased from 0.379 to 8.217 g min−1 m−2 and increased gradually with the increase of slope gradient. Moreover, the soil detachment rate under the conditions of gentle slopes was considerably greater than that under the conditions of steep slopes (Figure 4). In terms of temporal variation, the soil detachment rate gradually increased and eventually stabilized across various slope gradients. In addition, the soil detachment rate was significantly correlated with the hydrodynamic parameters (Table 5). The results of the Pearson correlation analysis revealed that the soil detachment rate was significantly correlated with factors such as the Reynolds number, Darcy–Weisbach friction, flow shear stress, Manning friction coefficient, runoff depth, stream power, and unit energy. Conversely, a significant negative correlation was found with the Froude number factor.

Figure 4.
Soil detachment rate under different slope gradients. The dashed red line indicates approximate boundary between gentle slope and steep slope.
Table 5.
Pearson correlation coefficients between the soil detachment rate and the hydrodynamic parameters.
The soil detachment rate was significantly correlated with the infiltration rate and could be fitted via a function under different slope gradient treatments. The findings indicate that there is a significant linear relationship between soil detachment rate and infiltration rate under slope gradients of 3°, 6°, and 15° (Figure 5a–c). However, the relationship between the soil detachment rate and the infiltration rate exhibits a significant exponential function under slope gradients of 3°, 6°, and 15° (Figure 5d–f), indicating a dramatic change in the steep slope treatments. These results imply that the soil detachment rate increased with the decreasing infiltration rate on slopes. In addition, the infiltration rate can be effectively used to estimate the soil detachment rate on sloping croplands in purple soil regions.
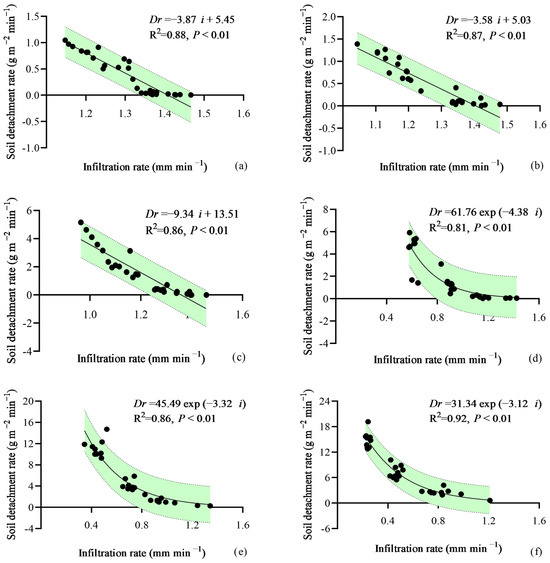
Figure 5.
Relationship between the soil separation rate (Dr) and the infiltration rate (i) under different slope gradient treatments. Note: (a) 3°, (b) 6°, (c) 10°, (d) 15°, (e) 21°, and (f) 27°. The shaded areas corresponded to 95% confidence intervals.
4. Discussion
As the slope gradient increased, the infiltration rate decreased, and the soil detachment rate increased during rainfall events. In this study, the mean flow velocity was to be 3.05, 3.23, 5.11, 5.59, 5.80, and 7.56 cm s−1 for 3°, 6°, 10°, 15°, 21°, and 27°, respectively. An increase in the mean flow velocity may accelerate the runoff kinetic energy of runoff and then decrease the infiltration capacity. A previous study indicated that the velocity of overland water increases with increasing slope gradient under the same rainfall conditions, and that the infiltration capacity decreases [8,9]. At the beginning of a rainfall event, most of the water is absorbed by the soil, but as the soil becomes saturated, a portion of the rain fills surface depressions and excess water runs off the field even on land with a gentle slope. When the slope is large, the water flow rate is fast and the duration is short, thereby resulting in a small infiltration. In addition, an increase in the Darcy–Weisbach fiction demonstrated that the energy consumed to overcome the underlying surface resistance tends to increase, leading to less energy being available for transporting sediment and detaching soil [33]. Besides, as the slope steepens, more fine particles susceptible to being washed in and clog pores below the soil surface are transported by overland flow, thus reducing the probability of pore clogging within the seal layer and, consequently, its final thickness and permeability [11].
In this experiment, the hydrodynamic characteristics and sediment yields on slopes increased with increasing the slope gradient, which is in line with findings from previous reports conducted by Peng et al. (2015) [34] and He et al. (2024) [19]. However, Liu and Singh (2004) [35] reported that the impact of slope gradient on several parameters (i.e., flow velocity and flow shear stress) could be negative or positive under different conditions. Thus, the impact of slope gradient on hydrodynamic parameters in overland flow remains a controversial issue. Our results revealed that 15° was the critical slope gradient for soil erosion rates and hydrodynamic characteristics, yet the reported value of the critical slope gradient for the flow shear stress varied from 41.5° to 50° [36]. In addition, Wu et al. (2017) [37] proposed that the critical slopes for the runoff rate and shear stress were within the ranges of 10.5–26° and 11–43.5°, respectively. The differences in these results are mainly because of the complexity of the influencing factors and the difference in the technique adopted by different researchers, and the critical slope gradients were greatly different. However, the precise reasons for these contradictory observations remain unclear and may be attributed to variations in land surface properties or soil physical characteristics among the respective studies [37].
As a crucial topographic factor, slope position regulates the flow of water and eroded materials on a hillslope [38]. The Reynolds number and Froude number were observed to generally increased along the slope transect from the upper to lower slope positions. Here, we found that the mean flow velocity was significantly greater at the upper slope position than at the lower slope position across various slope treatments, which in turn affected other hydrological parameters. This is partly because the gravity acceleration of runoff increased rapidly as the flow moved to lower slopes and partly because the kinetic energy of runoff increased as the slope increased for the same rainfall event [39]. Previous studies have demonstrated that lower slopes receive more water through surface runoff and subsurface flow, whereas upper slopes promote rapid downwards drainage during precipitation [40,41]. Additionally, finer soil particles in topsoil are more likely to be washed downhill [42], where the accumulation of water and sediments in the lower parts of slopes can potentially influence soil infiltration. Qiu et al. (2024) [43] and Wu et al. (2022) [44] also noted that the soil infiltration capacity generally declines from the top to the foot along a slope and that a lower infiltration capacity can lead to a shallow distribution of soil water at downslope positions, thereby exacerbating runoff generation and sediment detachment.
We investigated the effects of topographic factors (i.e., slope gradient and slope position) on hydrodynamic parameters and established a relationship between the soil detachment rate and the infiltration rate during a 90 mm h−1 rainfall event. The findings need to be interpreted with caution because of the limitations of this experiment (e.g., the lack of different slope positions for infiltration rate and soil detachment rate, vegetation coverage types, and soil surface roughness influences). Consequently, additional studies should be considered in the future to achieve general applicability to agricultural areas with different soil types, varying-intensity rainfall patterns, and tillage-management practices. Therefore, conducting infiltration tests across various soil layers at a larger scale is imperative for a more in-depth analysis of the underlying causes of these differences. Moreover, this study was conducted on a steel trough created indoors by simulated rainfall, which may differ from a natural field. The interaction between soil erosion processes and hydrodynamic parameters requires further research under field experimental conditions.
5. Conclusions
Simulated rainfall experiments were designed to examine the influences of slope gradient and slope position on soil infiltration and hydrodynamic parameters in sloping cropland with purple soil in Southwest China. The findings revealed that infiltration rate and cumulative infiltration amount at a rate of 90 mm h−1 rainfall for 1 h decreased gradually with increasing slope gradient. The Horton model is the best for predicting the infiltration rate, in the study area. Slope gradient, slope position, and their interaction had significant impacts on most of the hydrodynamic parameters. Overall, hydrodynamic parameters increase gradually with the increase of slope gradient. The Darcy–Weisbach friction, flow shear force, Manning friction coefficient, unit energy, and runoff depth on various slopes exhibit the following trend: lower slope < middle slope < upper slope, whereas the Reynolds number and Froude number show the opposite trend: lower slope > middle slope > upper slope. The relationship between the soil detachment rate and infiltration rate is a linear function under gentle slope conditions and an exponential function under steep slope conditions. These findings highlight the importance of hydrodynamic parameters and infiltration characteristics in response to topographic factors in bare soil surface, whereas further research is needed to examine the hydrological processes response of different vegetation-covered based on long-term field experiments. Our results can provide valuable reference for developing hydrological models and managing water resources in purple soil regions.
Author Contributions
Y.W.: conceptualization, investigation, methodology, project administration, writing—original draft. Z.M.: data curation and investigation. D.L.: review and editing. G.H. and J.Z.: resources, and editing, supervision. All authors have read and agreed to the published version of the manuscript.
Funding
This research was funded by the National Natural Science Foundation of China (grant number 42277326) and the National Natural Science Foundation of Sichuan Province (grant number 2023NSFSC0119).
Institutional Review Board Statement
Not applicable.
Data Availability Statement
Data will be made available upon request from the author.
Conflicts of Interest
The authors declare that there are no conflicts of interest.
References
- Ribolzi, O.; Patin, J.; Bresson, L.M.; Latsachack, K.O.; Mouche, E.; Sengtaheuanghoung, O.; Silvera, N.; Thiebaux, J.P.; Valentin, C. Impact of slope gradient on soil surface features and infiltration on steep slopes in northern Laos. Geomorphology 2011, 127, 53–63. [Google Scholar] [CrossRef]
- Leung, A.K.; Garg, A.; Coo, J.L.; Ng, C.W.W.; Hau, B.C.H. Effects of the roots of cynodon dactylon and schefflera heptaphylla on water infiltration rate and soil hydraulic conductivity. Hydrol. Process. 2015, 29, 3342–3354. [Google Scholar] [CrossRef]
- Williams, J.D.; Reardon, C.; Wuest, S.B.; Long, D.S. Soil water infiltration after oil seed crop introduction into a Pacific Northwest winter wheat-fallow rotation. J. Soil Water Conserv. 2020, 75, 739–745. [Google Scholar] [CrossRef]
- Liu, H.; Lei, T.W.; Zhao, J.; Yuan, C.P.; Fan, Y.T.; Qu, L.Q. Effects of rainfall intensity and antecedent soil water content on soil infiltrability under rainfall conditions using the run off-on-out method. J. Hydrol. 2011, 396, 24–32. [Google Scholar] [CrossRef]
- Harden, C.P.; Scruggs, P.D. Infiltration on mountain slopes: A comparison of three environments. Geomorphology 2003, 55, 5–24. [Google Scholar] [CrossRef]
- Mei, X.M.; Zhu, Q.K.; Ma, L.; Zhang, D.; Wang, Y.; Hao, W.J. Effect of stand origin and slope position on infiltration pattern and preferential flow on a Loess hillslope. Land Degrad. Dev. 2018, 29, 1353–1365. [Google Scholar] [CrossRef]
- Cui, Z.; Wu, G.L.; Huang, Z.; Liu, Y. Fine roots determine soil infiltration potential than soil water content in semi-arid grassland soils. J. Hydrol. 2019, 578, 124023. [Google Scholar] [CrossRef]
- Chaplot, V.; Le Bissonnais, Y. Field measurements of interrill erosion under different slopes and plot sizes. Earth Surf. Proc. Landf. 2000, 25, 145–153. [Google Scholar] [CrossRef]
- Yuan, J.P.; Lei, T.W.; Guo, S.Y.; Jiang, D.S. Study on spatial variation of infiltration rates for small watershed in loess plateau. J. Hydraul. Eng. 2001, 10, 88–92, (In Chinese with English Abstracts). [Google Scholar] [CrossRef]
- Janeau, J.L.; Briquet, J.P.; Planchon, O.; Valentin, C. Soil crusting and infiltration on steep slopes in northern Thailand. Eur. J. Soil Sci. 2003, 54, 543–553. [Google Scholar] [CrossRef]
- Assouline, S.; Ben-Hur, M. Effects of rainfall intensity and slope gradient on the dynamics of interrill erosion during soil surface sealing. Catena 2006, 66, 211–220. [Google Scholar] [CrossRef]
- Cerdà, A.; García-Fayos, P. The influence of slope angle on sediment, water and seed losses on badland landscapes. Geomorphology 1997, 18, 77–90. [Google Scholar] [CrossRef]
- Mah, M.G.C.; Douglas, L.A.; Ringrose-Voase, A.J. Effects of crust development and surface slope on erosion by rainfall. Soil Sci. 1992, 154, 37–43. [Google Scholar] [CrossRef]
- Huang, J.; Wu, P.; Zhao, X. Effects of rainfall intensity, underlying surface and slope gradient on soil infiltration under simulated rainfall experiments. Catena 2013, 104, 93–102. [Google Scholar] [CrossRef]
- Shi, G.; Wu, Y.; Li, T.; Fu, Q.; Wei, Y. Mid-and long-term effects of biochar on soil improvement and soil erosion control of sloping farmland in a black soil region, China. J. Environ. Manag. 2022, 320, 115902. [Google Scholar] [CrossRef]
- Krause, S.; Lewandowski, J.; Grimm, N.B.; Hannah, D.M.; Pinay, G.; McDonald, K.; Martí, E.; Argerich, A.; Pfister, L.; Klaus, J.; et al. Ecohydrological interfaces as hot spots of ecosystem processes. Water Resour. Res. 2017, 53, 6359–6376. [Google Scholar] [CrossRef]
- Costabile, P.; Cea, L.; Barbaro, G.; Costanzo, C.; Llena, M.; Vericat, D. Evaluation of 2D hydrodynamic-based rainfall/runoff modelling for soil erosion assessment at a seasonal scale. J. Hydrol. 2024, 632, 130778. [Google Scholar] [CrossRef]
- Rinaldi, M.; Mengoni, B.; Luppi, L.; Darby, S.E.; Mosselman, E. Numerical simulation of hydrodynamics and bank erosion in a river bend. Water Resour. Res. 2008, 44, W09428. [Google Scholar] [CrossRef]
- He, Q.; Li, B.; Zhang, F.; Shen, N.; Yang, M. Exploring the relationship between soil erosion and hydraulic parameters on slopes with clipped herbaceous vegetation through Bayesian network modeling. Land Degrad. Dev. 2024, 35, 3048. [Google Scholar] [CrossRef]
- Zhao, L.; Qin, Q.; Geng, H.; Zheng, F.; Zhang, X.J.; Li, G.; Xu, X.; Zhang, J. Effects of upslope inflow rate, tillage depth, and slope gradients on hillslope erosion processes and hydrodynamic mechanisms. Catena 2023, 228, 107189. [Google Scholar] [CrossRef]
- Abrahams, A.D.; Li, G.; Krishnan, C.; Atkinson, J.F. A sediment transport equation for interrill overland flow on rough surfaces. Earth Surf. Proc. Landf. 2001, 26, 1443–1459. [Google Scholar] [CrossRef]
- Jafarpoor, A.; Sadeghi, S.H.; Darki, B.Z.; Homaee, M. Changes in morphologic, hydraulic, and hydrodynamic properties of rill erosion due to surface inoculation of endemic soil cyanobacteria. Catena 2022, 208, 105782. [Google Scholar] [CrossRef]
- Todisco, F.; Vergni, L.; Iovino, M.; Bagarello, V. Changes in soil hydrodynamic parameters during intermittent rainfall following tillage. Catena 2023, 226, 107066. [Google Scholar] [CrossRef]
- Liu, J.; Zhou, Z.C.; Zhang, X.J. Impacts of sediment load and size on rill detachment under low flow discharges. J. Hydrol. 2019, 570, 719–725. [Google Scholar] [CrossRef]
- Shen, N.; Wang, Z.; Zhang, Q.; Wu, B.; Wang, D.; Zhang, Q.; Liu, J. Quantifying the contribution of sediment load to soil detachment rate by sediment-laden rill flow. Soil Sci. Soc. Am. J. 2017, 81, 1526–1536. [Google Scholar] [CrossRef]
- Xiao, H.; Liu, G.; Liu, P.; Zheng, P.; Zhang, J.Q.; Hu, F.N. Response of soil detachment rate to the hydraulic parameters of concentrated flow on steep loessial slopes on the Loess Plateau of China. Hydrol. Process. 2017, 31, 2613–2621. [Google Scholar] [CrossRef]
- Gimenez, R.; Govers, G. Flow detachment by concentrated flow on smooth and irregular beds. Soil Sci. Soc. Am. J. 2002, 66, 1475–1483. [Google Scholar] [CrossRef]
- Chen, X.Y.; Huang, Y.H.; Zhao, Y.; Mo, B.; Mi, H.X. Comparison of loess and purple rill erosions measured with volume replacement method. J. Hydrol. 2015, 530, 476–483. [Google Scholar] [CrossRef]
- Ma, J.; Xu, M.; Wu, J.; Yang, G.; Zhang, X.; Song, C.; Long, l.; Chen, C.; Xu, C.; Wang, Y. Effects of variable-sized polyethylene microplastics on soil chemical properties and functions and microbial communities in purple soil. Sci. Total Environ. 2023, 868, 161642. [Google Scholar] [CrossRef]
- Wang, Y.; Jin, Y.; Wang, J.; Ma, Z.; Liu, X.; Liang, X. Laboratory-Scaled Investigation into Combined Impacts of Temporal Rainfall Patterns and Intensive Tillage on Soil and Water Loss. Agronomy 2023, 13, 1472. [Google Scholar] [CrossRef]
- Wang, L.H.; Ma, B.; Wu, F.Q. Infiltration characteristics in sloping farmland at different growth stages of soybean (Glycine max L.) in loess area. Sci. Soil Water Conserv. 2015, 13, 15–24. [Google Scholar] [CrossRef]
- Aru, S.; Chang, S.L.; Zhang, Y.T. Comparative analysis and simulation of soil moisture infiltration characteristics in different communities in the forests of Tianshan Mountains, China. Acta Ecol. Sin. 2019, 39, 9111–9118. [Google Scholar] [CrossRef]
- Sun, W.; Mu, X.; Gao, P.; Zhao, G.; Li, J.; Zhang, Y.; Chiew, F. Landscape patches influencing hillslope erosion processes and flow hydrodynamics. Geoderma 2019, 353, 391–400. [Google Scholar] [CrossRef]
- Peng, W.; Zhang, Z.; Zhang, K. Hydrodynamic characteristics of rill flow on steep slopes. Hydrol. Process. 2015, 29, 3677–3686. [Google Scholar] [CrossRef]
- Liu, Q.Q.; Singh, V.P. Effect of microtopography, slope length and gradient, and vegetative cover on overland flow through simulation. J. Hydrol. Eng. 2004, 9, 375–382. [Google Scholar] [CrossRef]
- Liu, Q.Q.; Chen, L.; Li, J.C. Influences of slope gradient on soil erosion. Appl. Math. Mech. 2001, 22, 449–457. [Google Scholar] [CrossRef]
- Wu, S.; Yu, M.; Chen, L. Nonmonotonic and spatial-temporal dynamic slope effects on soil erosion during rainfall-runoff processes. Water Resour. Res. 2017, 53, 1369–1389. [Google Scholar] [CrossRef]
- Magdić, I.; Safner, T.; Rubinić, V.; Rutić, F.; Husnjak, S.; Filipović, V. Effect of slope position on soil properties and soil moisture regime of Stagnosol in the vineyard. J. Hydrol. Hydromech. 2022, 70, 62–73. [Google Scholar] [CrossRef]
- Kang, S.; Zhang, L.; Song, X.; Zhang, S.; Liu, X.; Liang, Y.; Zheng, S. Runoff and sediment loss responses to rainfall and land use in two agricultural catchments on the Loess Plateau of China. Hydrol. Process. 2001, 15, 977–988. [Google Scholar] [CrossRef]
- Famiglietti, J.S.; Rudnicki, J.W.; Rodell, M. Variability in surface moisture content along a hillslope transect: Rattlesnake Hill. Texas. J. Hydrol. 1998, 210, 259–281. [Google Scholar] [CrossRef]
- Qiu, Y.; Fu, B.J.; Wang, J.; Chen, L.D. Soil moisture variation in relation to topography and land use in a hillslope catchment of the Loess Plateau, China. J. Hydrol. 2001, 240, 243–263. [Google Scholar] [CrossRef]
- Lal, R. Soil erosion and the global carbon budget. Environ. Int. 2003, 29, 437–450. [Google Scholar] [CrossRef] [PubMed]
- Qiu, D.; Xu, R.; Gao, P.; Mu, X. Effect of vegetation restoration type and topography on soil water storage and infiltration capacity in the Loess Plateau, China. Catena 2024, 241, 108079. [Google Scholar] [CrossRef]
- Wu, X.; Yang, Y.; He, T.; Wang, Y.; Wendroth, O.; Liu, B. Mechanical sowing alters slope-scale spatial variability of saturated hydraulic conductivity in the black soil region of Northeast China. Catena 2022, 212, 106115. [Google Scholar] [CrossRef]


Disclaimer/Publisher’s Note: The statements, opinions and data contained in all publications are solely those of the individual author(s) and contributor(s) and not of MDPI and/or the editor(s). MDPI and/or the editor(s) disclaim responsibility for any injury to people or property resulting from any ideas, methods, instructions or products referred to in the content. |
© 2024 by the authors. Licensee MDPI, Basel, Switzerland. This article is an open access article distributed under the terms and conditions of the Creative Commons Attribution (CC BY) license (https://creativecommons.org/licenses/by/4.0/).