Abstract
At present, the extraction of irrigation canal network distribution information is of great significance for developing a digital twin irrigation district. However, due to the low resolution of remote sensing images, it is difficult to effectively identify the canal networks, especially for channels with a width of less than 1 m, where recognition is insufficient. Therefore, the purpose of this study is to extract canal networks of different widths in an irrigation district in Shaanxi Province as the research area. A rule-based object-oriented classification method was employed, utilizing image data collected by the DJI Mavic 3 multispectral UAV (Unmanned Aerial Vehicle) to explore the accuracy of this method in extracting canal distribution information. Based on UAV multispectral remote sensing imagery, the segmentation parameters for the remote sensing imagery were determined using ENVI 5.6 software, with the segmentation threshold set at 60 and the merging threshold set at 80. By combining the spectral and spatial differences between the canals and other ground objects, rules for extracting canal network distribution information were established, and the information on the distribution of channels in this irrigation area was finally obtained. The experimental results showed a maximum recall rate of 91.88% and a maximum precision rate of 57.59%. The overall recall precision rates for the irrigation district were 85.74% and 55.08%, respectively. This method provides a new solution for identifying and extracting canal systems in irrigation districts, offering valuable insights for acquiring canal distribution information and providing a scientific basis for precision irrigation.
1. Introduction
As the concept of water conservation continues to deepen, agricultural water-saving practices are becoming more controllable and precise. Accurate extraction of canal distribution information plays an important role in the digital processing of irrigation channels and is also a key component of agricultural irrigation systems. Digital processing of the canal system allows for more precise recording of channel information, providing data support for water-saving schemes in irrigation areas. It also enables accurate calculations of water resource allocation for farmlands, facilitating the construction of intelligent irrigation districts that focus on efficient water conservation and precise irrigation. The digital processing of irrigation canal systems primarily relies on remote-sensing images. Depending on the remote sensing platform, image acquisition methods can generally be divided into orbital, sub-orbital, and terrestrial. Traditional photogrammetry operations are not only time-consuming but if issues such as missed shots or insufficient overlap occur during data collection, additional flights are required, significantly increasing costs.
With the rapid advancement of modern remote sensing technology, Unmanned Aerial Vehicles (UAVs) have become essential tools for acquiring surface information [1]. UAV remote sensing systems offer a highly efficient and cost-effective means of extracting information on the distribution of irrigation canals owing to their mobility, speed and affordability [2,3]. The application of this technology offers unprecedented opportunities for accurate and detailed collection of geospatial data [4,5,6]. High-resolution low-altitude UAV remote sensing images provide greater detail in capturing parameters such as feature geometry, texture, and topological relationships, which enhances the ability to identify feature types, makes the extraction of distribution information of agricultural irrigation canal systems [7] faster and more detailed, and makes the remote sensing monitoring of the distribution information of sublateral canals in the field possible.
Currently, the extraction methods for agricultural irrigation canals mainly include the combination of supervised classification [8,9,10] and visual interpretation [11,12], unsupervised classification [12,13,14], support vector machines (SVM) [15,16,17,18], and object-oriented approaches [19,20,21,22]. The object-oriented method is a fuzzy classification algorithm using decision support for high-resolution remote sensing images. It operates on the principle that pixels sharing similar characteristics such as color, shape, and texture are grouped into objects. Different categories are defined by specifying the spectral, texture and spatial characteristics of each object, with a defuzzification function used to establish classification criteria. This method accurately assigns a probability for each object belonging to a specific category. The probability is that each object belongs to a certain class, and generate classification results according to the maximum probability. Although supervised classification methods combined with visual interpretation can achieve high recognition accuracy, they are limited by low automation and efficiency. In contrast, the object-oriented method solves the noise problem through image segmentation and fully leverages the geometric, spectral and spatial relationship features of the drainage system. This enables it to achieve high recognition accuracy even when the surface coverage is complex, and meets the requirements of fast and accurate remote sensing monitoring of irrigation canal systems [20].
For example, Zhang et al. [23] achieved an accuracy of 87.5% by using an object-oriented segmentation method based on UAV remote sensing images, integrating spectral and shape feature fusion rules. Han et al. [24] used an object-oriented method based on the interpretation of high-resolution single multi-spectral image data, and the results showed that the extraction accuracy of sublateral canals reached 75.7%, but failed to effectively extract channels with a width of less than 1 m at the top of the canals. Mhangara et al. [25] proposed an object-oriented approach to classify roads using high-resolution aerial imagery by establishing classification rules through spectral, geometric, and textural properties, and the results showed an accuracy of up to 93.6%, which demonstrated the potential of the method for application. Yue et al. [26] used object-oriented method for water body information extraction based on SPOT5 images, which provides higher classification accuracy compared to pixel based supervised classification. Kumar et al. [27] used an object-oriented method to extract road network based on high resolution images using spatial and spectral information to extract road features. The results showed that the completeness and correctness of the road network were 87.98% and 79.90%, respectively. In addition, Yi et al. [28] successfully extracted the main canals and branch canals and identified a sublateral canal in the Hetao Irrigation District using satellite remote sensing images and the support vector machine (SVM) method, providing valuable information support for irrigation supervision and management in the district.
The purpose of this study is to extract canal systems of different widths in the Zeyuan Agricultural Irrigation Area of Wugong Town, Xianyang City, Shaanxi Province. A rule-based object-oriented classification method was applied, utilizing multispectral image data captured by the DJI Mavic 3 UAV to obtain distribution information of the canal systems in the irrigation area, and to explore the accuracy of this method in extracting canal system distribution information. The distribution of irrigation canals governs the entire water circulation system of the district. Real-time monitoring and updating of canal distribution can facilitate the rational allocation of irrigation water resources, improve water use efficiency, and enable precision irrigation, contributing to the efficient, sustainable utilization of agricultural resources.
2. Materials and Methods
2.1. Study Area
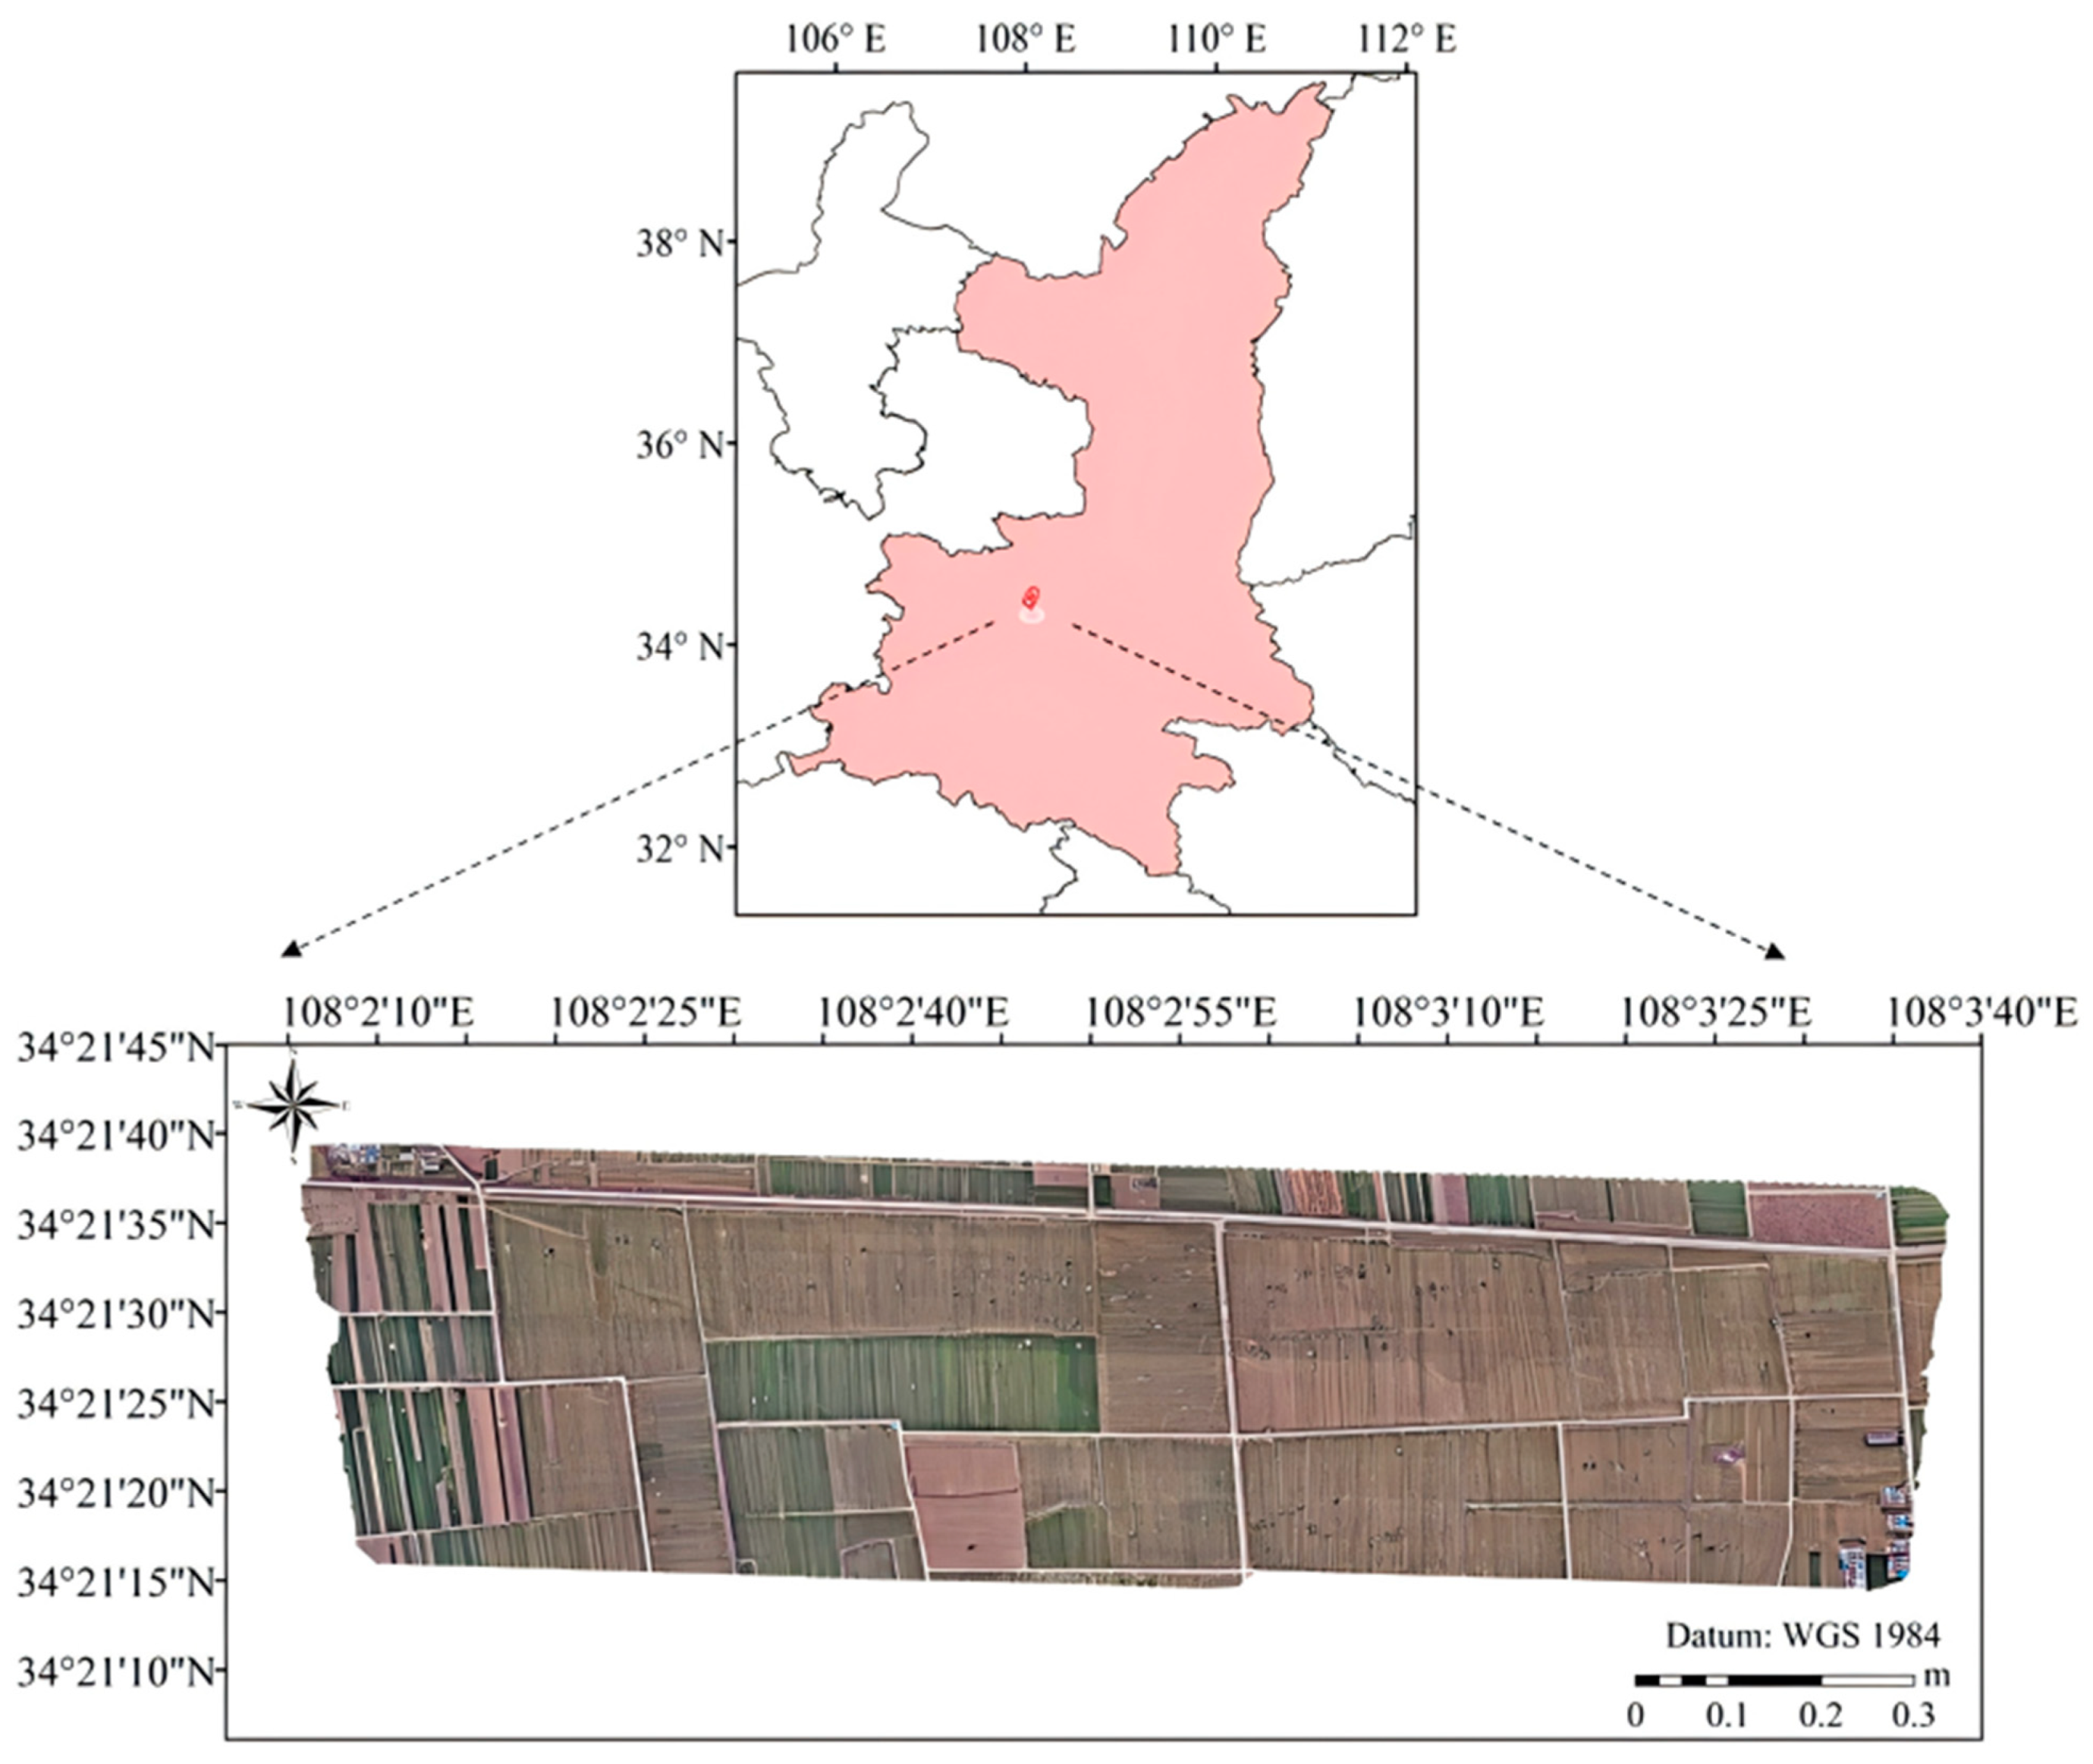
The experimental irrigation district is located in the Zeyuan Agricultural Irrigation Area, Wugong Town, Xianyang City, Shaanxi Province, with geographic coordinates ranging from 108°2′ to 108°3′ E longitude and 34°21′ to 34°21′ N latitude (Figure 1). The experiment was conducted at noon on a clear, cloudless day in March 2024 to collect UAV data. The experimental area sources water from the Baoji Gorge Main Canal, distributing it through spur canals, lateral canals, and sublateral ditches for farmland irrigation, with wheat and corn as the primary crops. The study area covers approximately 1.27 km2. The distribution and types of canal systems in the study irrigation area were determined after field inspection, in which most of the channel sections were U-shaped, and the width of the top of the canal and the depth of the canal in the study irrigation area were measured in the field (Table 1). The width of the top of lateral canals, and sublateral ditches are less than 1 m, which was the focus of the research on the method of extracting information about the distribution of the canal systems in the field.

Figure 1.
Research overview figure.

Table 1.
Basic information on the canal system in the study irrigation area.
2.2. Drainage System Image Data Acquisition
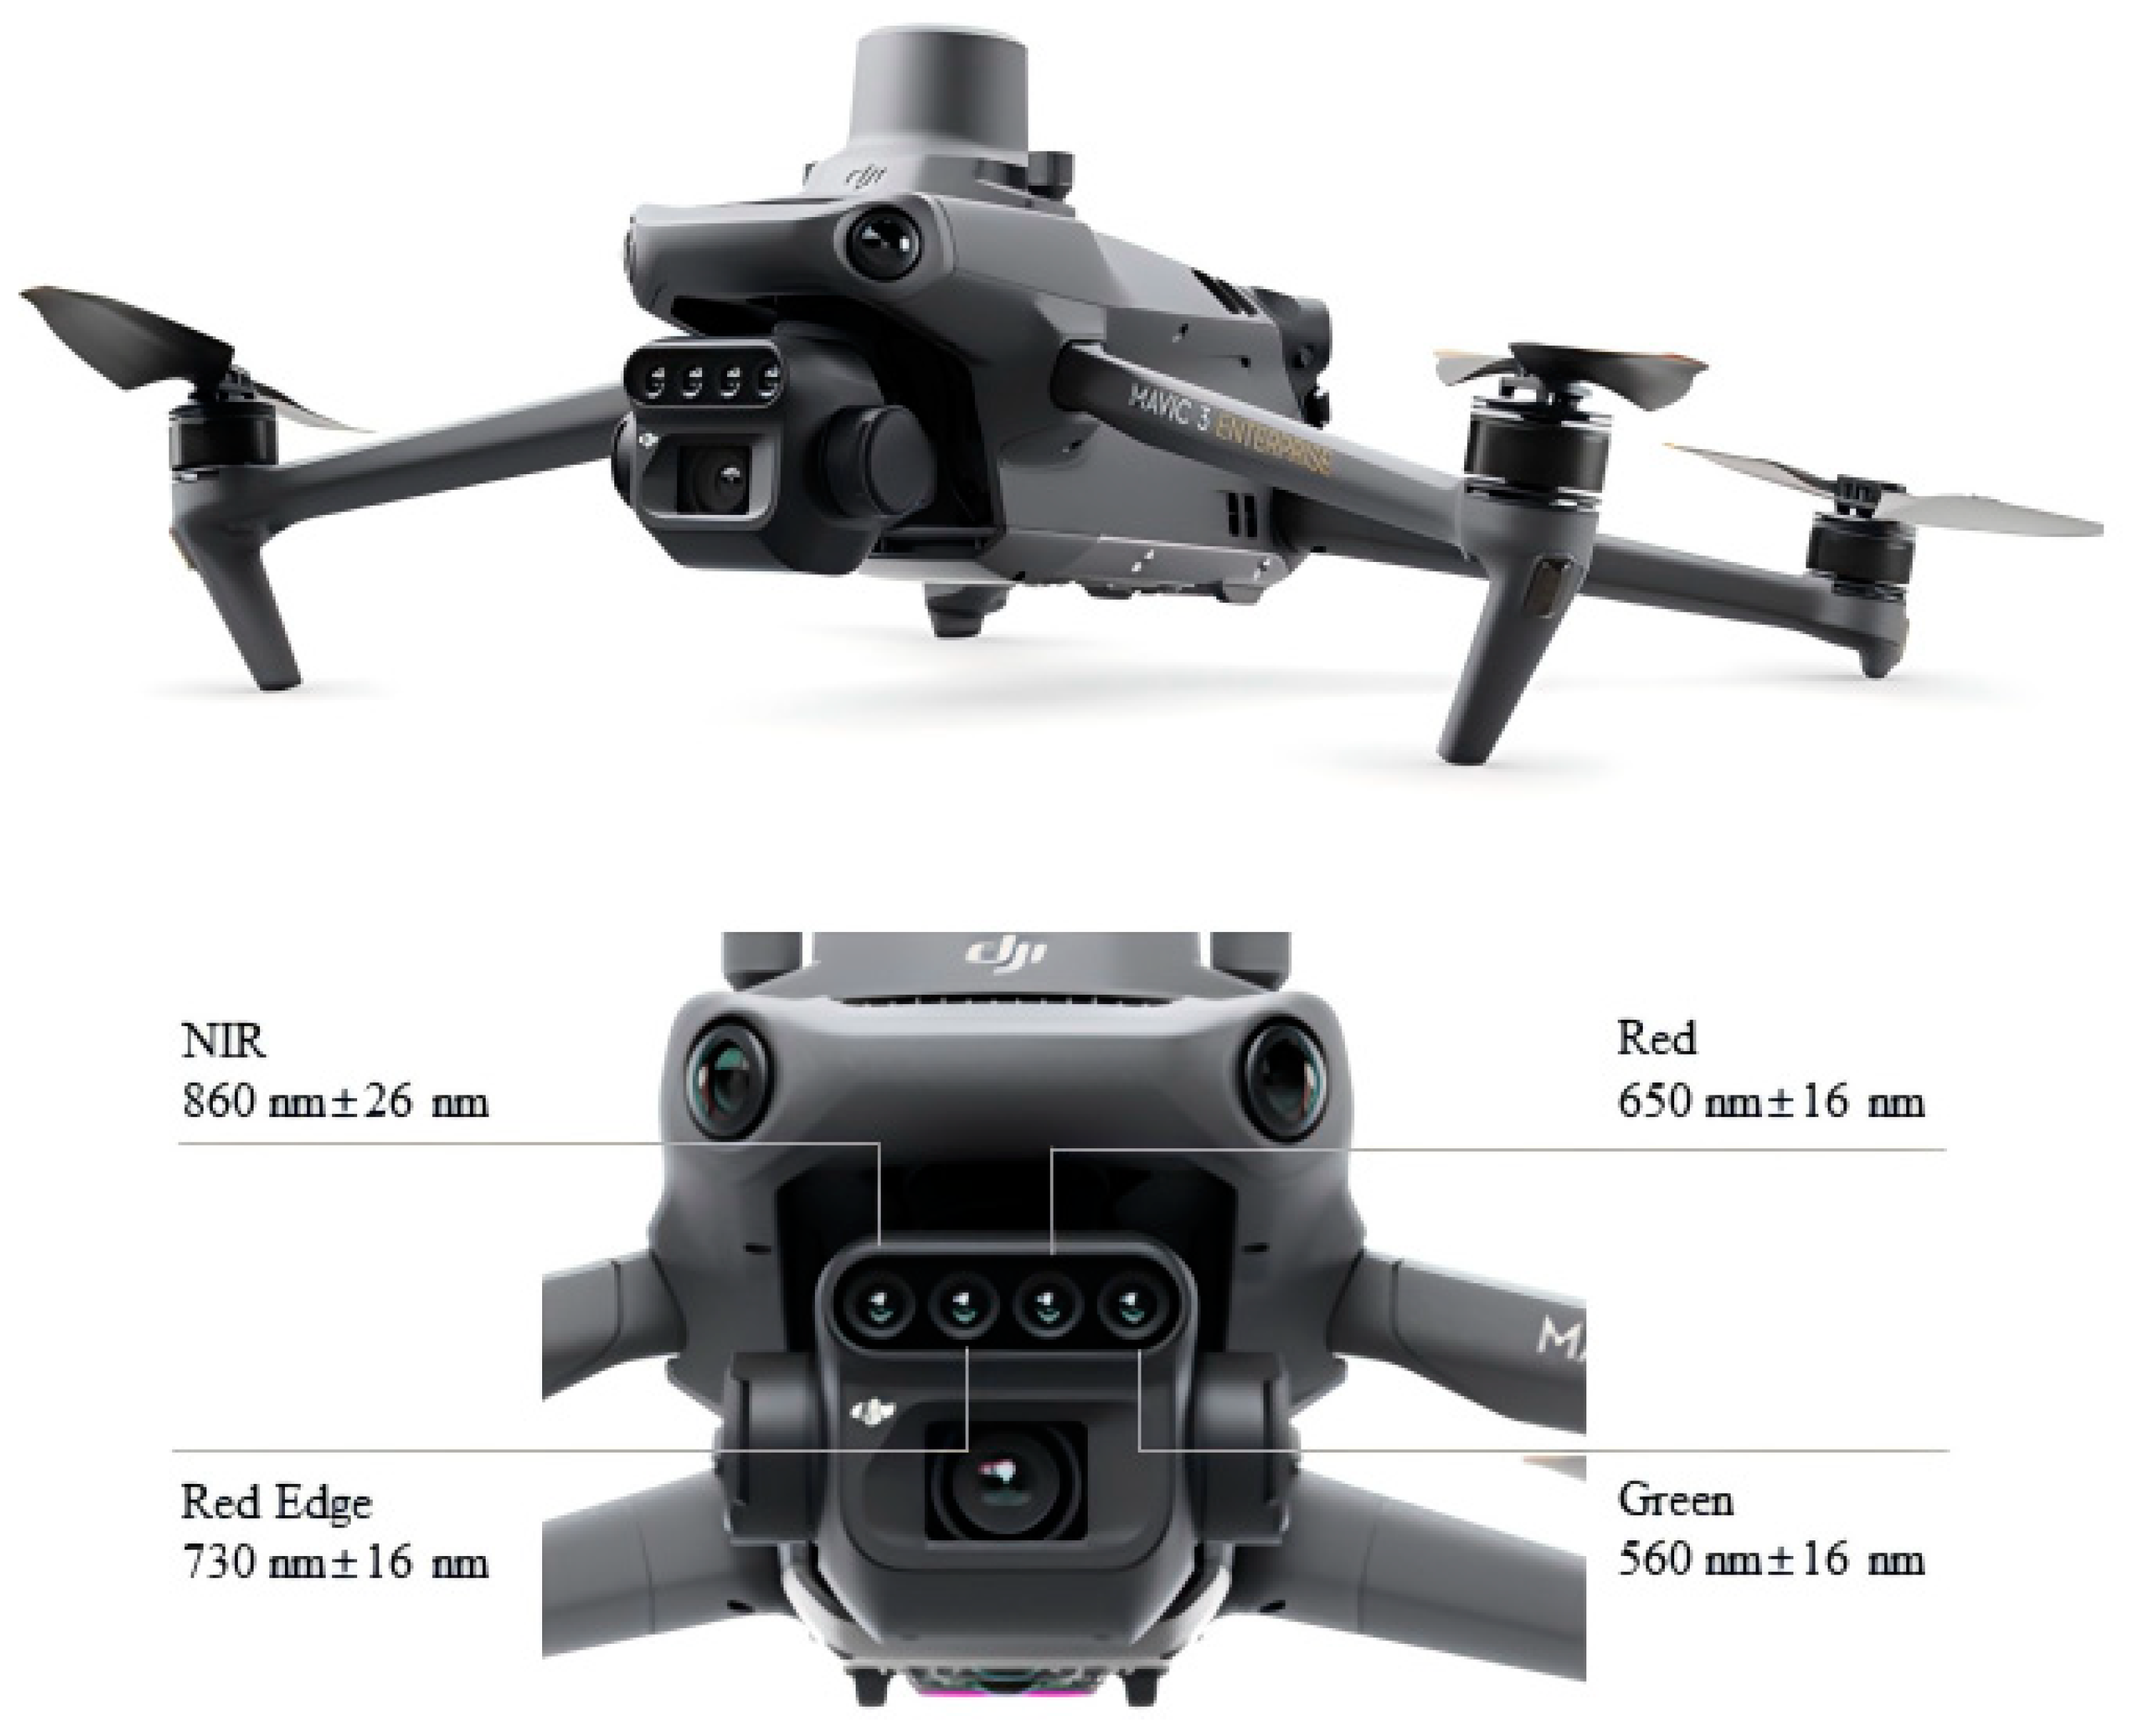
The experiment utilized the DJI Mavic 3 Multispectral drone (Shenzhen Dajiang Innovation Technology Co, Ltd; Shenzhen, China), equipped with visible light and multispectral cameras as the remote sensing data acquisition platform (Figure 2). The drone and its related parameters are detailed in Table 2. To ensure the quality of the UAV images, the UAV operated at noon under clear, cloudless skies with wind speeds below level 3. The UAV flew at an altitude of 100 m, with a heading overlap rate of 80% and a sideward overlap rate of 75%. A total of 9080 high-resolution multispectral images were captured, mainly covering crops, canals, roads, trees, and weeds. Additionally, the main hardware specifications of the computer are as follows: CPU is an i5-13400F (Intel, Santa Clara, CA, USA), GPU is an RTX 4060, RAM is 32 GB, and SSD is 500 GB.

Figure 2.
DJI Mavic 3 multispectral.
Table 2.
DJI Mavic 3 multispectral main parameters.
2.3. Methods
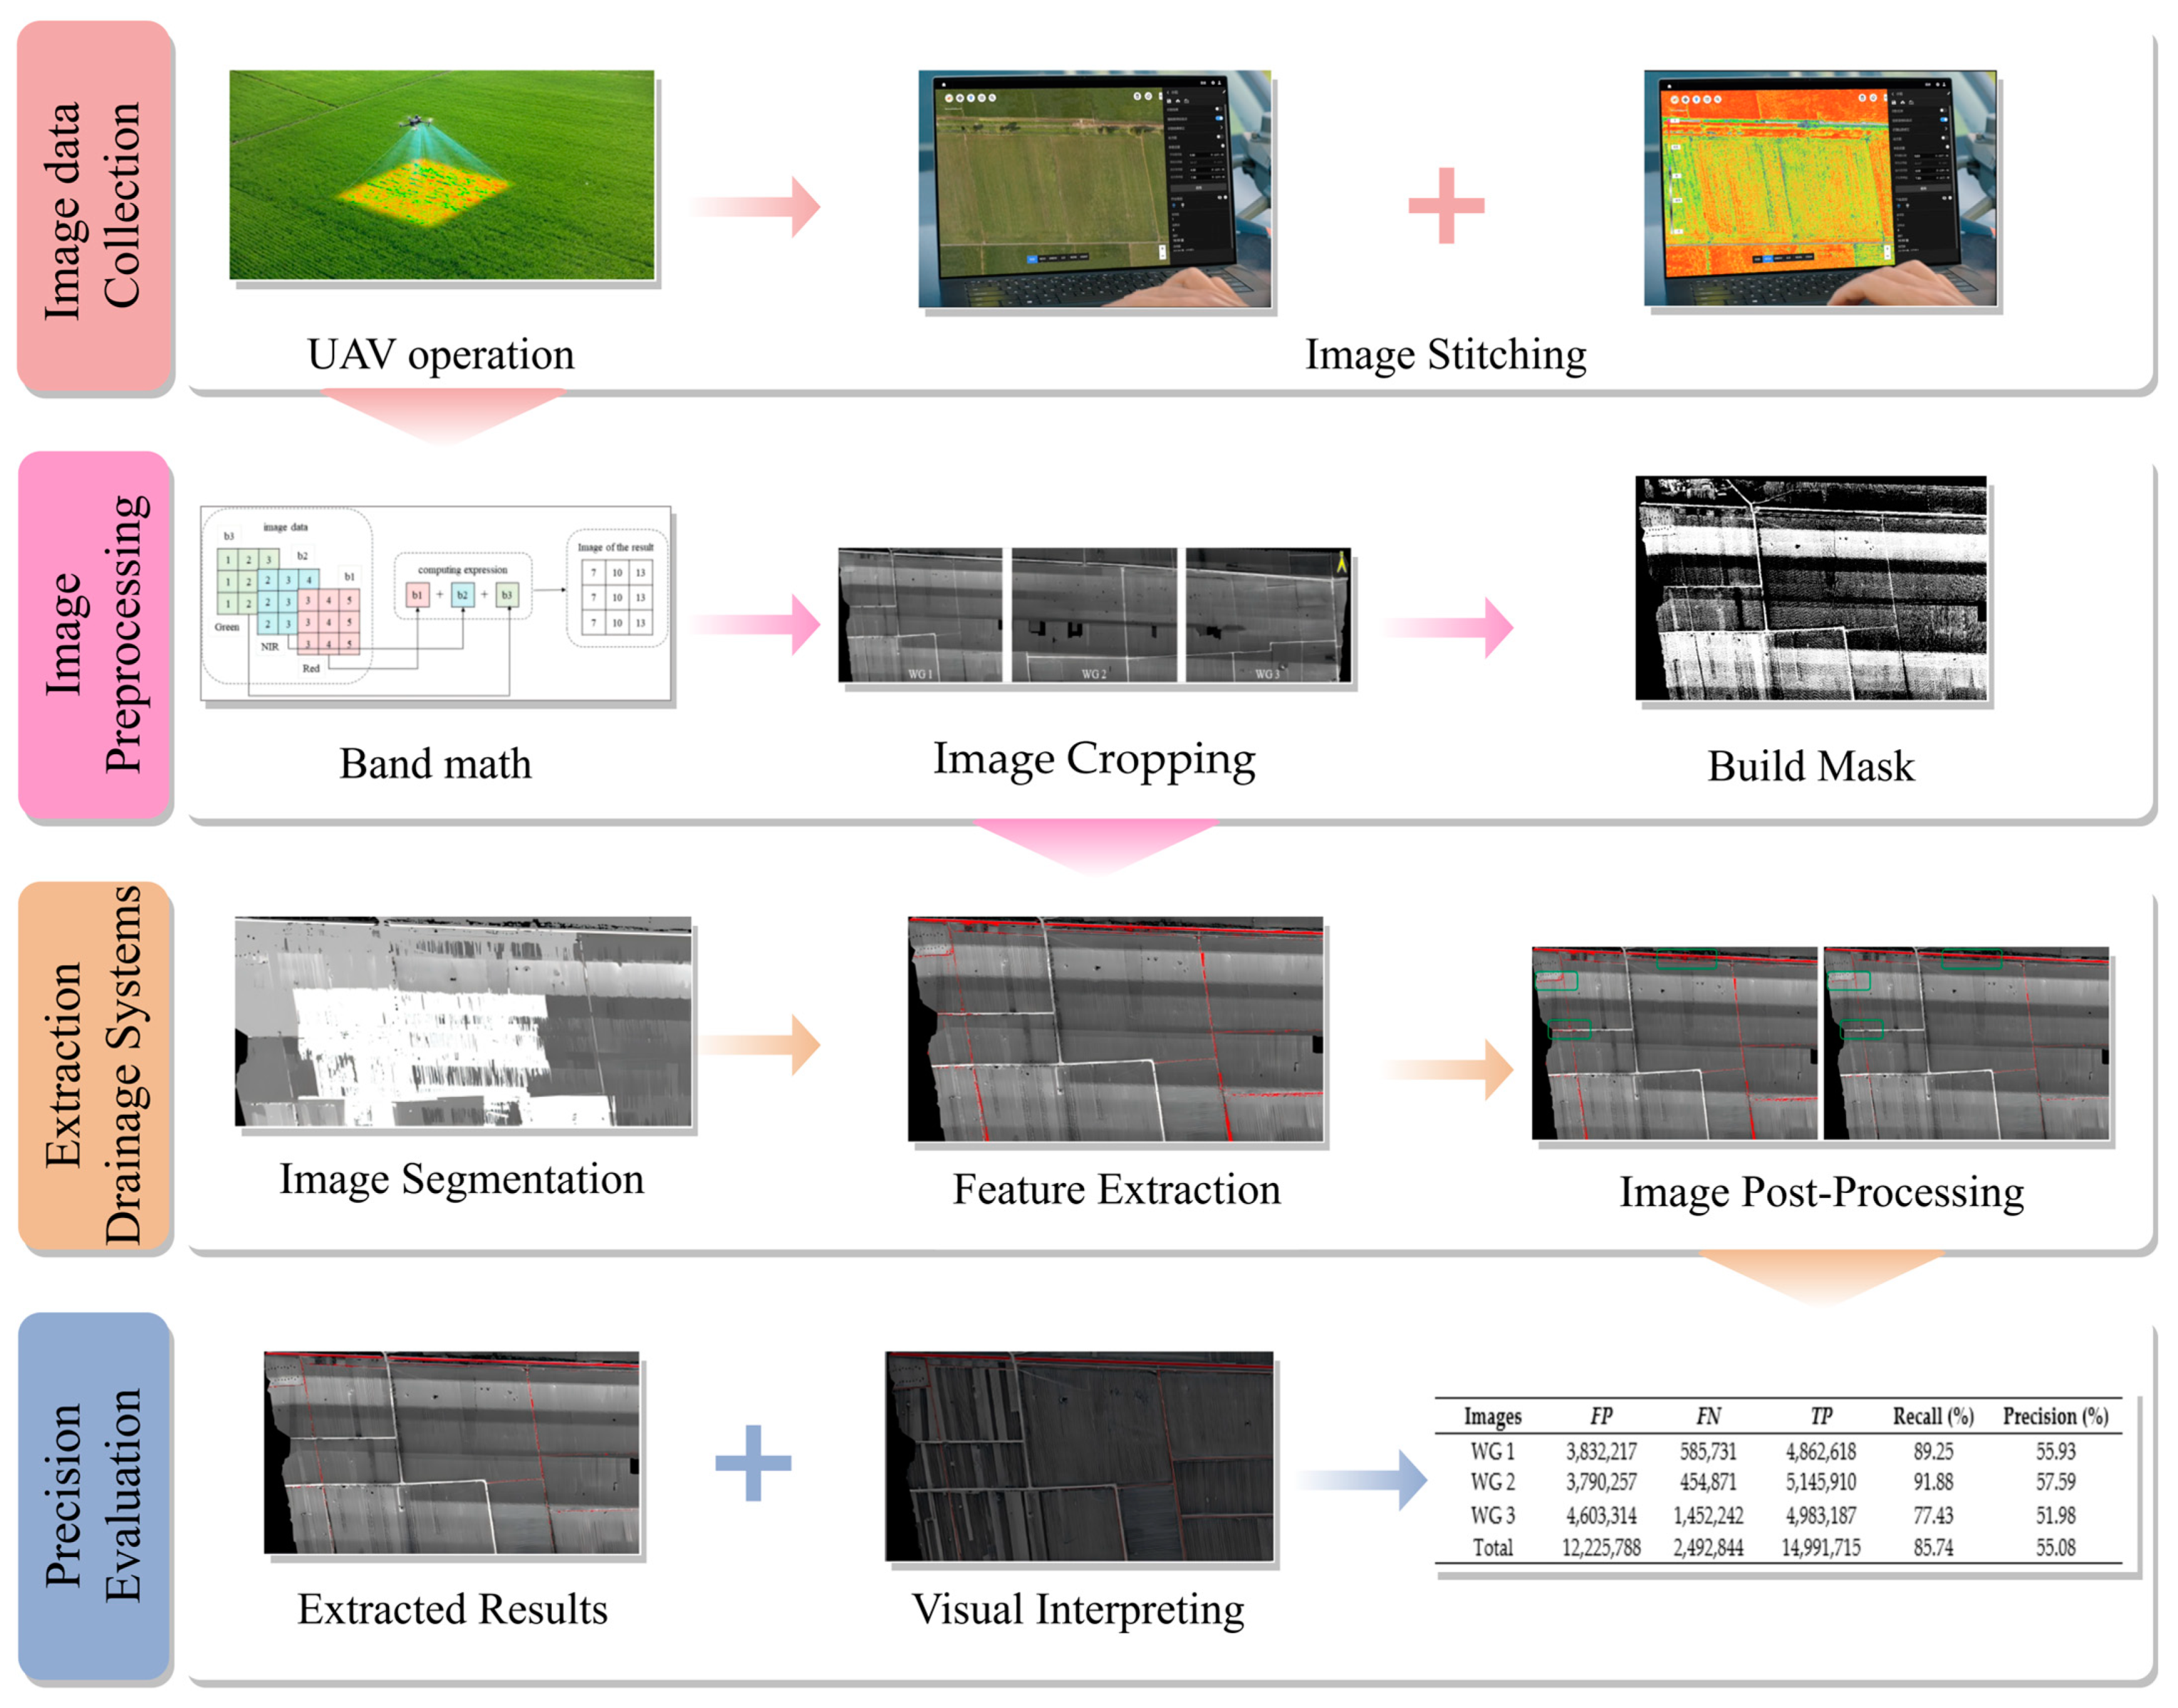
First, to obtain information on the canal system distribution in the irrigation area under study, the DJI Mavic 3 Multispectral was used for image data collection. The collected images were then stitched together and pre-processed. Next, an edge-based detection segmentation method combined with the Full Lambda Schedule merging algorithm was applied to the pre-processed images. A rule-based object-oriented method was employed to extract canal system information. By leveraging the differences in spectral and spatial features between the canal system and surrounding objects, rules for extracting canal system information were established. This process produced vector images of the canal system, which were then post-processed using ArcGIS 10.8 software. Finally, a comparison was made with the results of visual interpretation, and accuracy assessments were conducted based on the experimental irrigation area and canal system types (Figure 3).

Figure 3.
Flowchart for extracting information on drainage system distribution.
Accuracy evaluation [29] of remote sensing images is an important way to test the extraction results, which is an indispensable work for remote sensing image analysis. Generally, accuracy evaluation is conducted by comparing the extracted data with reference results. Since the results of manual visual interpretation are highly reliable, they are used as the reference. Commonly used metrics for accuracy evaluation include recall and precision [30,31,32]. Recall indicates the proportion of correctly extracted canal pixels to the total number of canal pixels identified through manual visual interpretation. Precision represents the proportion of correctly extracted canal pixels to the total number of pixels in the extracted canal results.
Recall:
In the formula, TP represents the number of correctly extracted canal pixels (where both the extraction result and visual interpretation identify the pixel as a canal). FN represents the number of canal pixels that were incorrectly extracted as background (where the extraction result identifies the pixel as background, but visual interpretation identifies it as a canal).
Precision:
In the formula, TP represents the number of correctly extracted canal pixels (where both the extraction result and visual interpretation identify the pixel as a canal). FP represents the number of pixels incorrectly identified as canals (where the extraction result identifies the pixel as a canal, but visual interpretation identifies it as background).
3. Image Preprocessing
3.1. Band Stacking
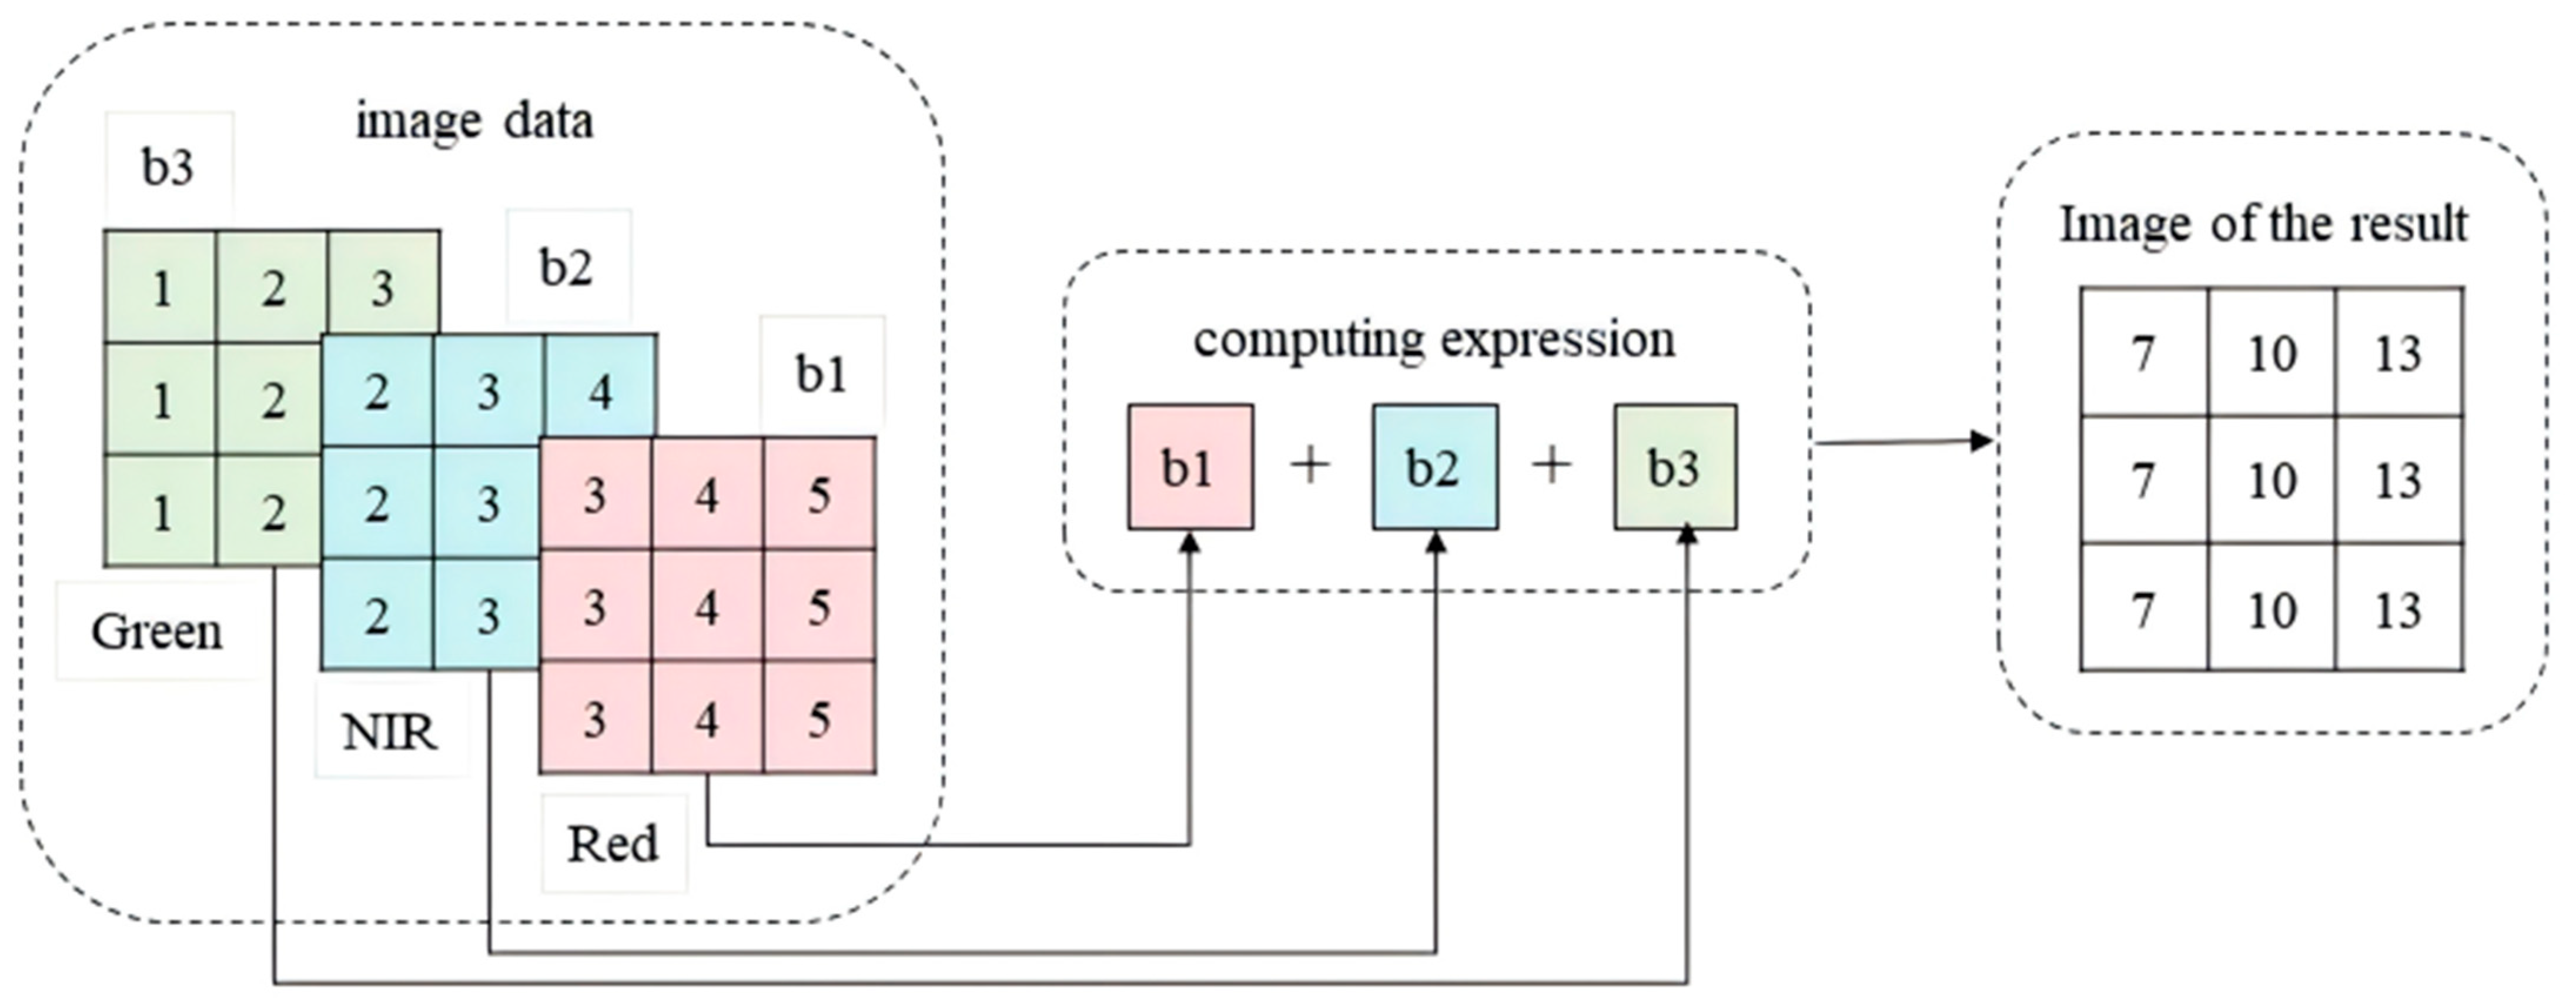
Band math [33,34,35,36] was used in ENVI to perform mathematical operations on the pixel value corresponding to each pixel point. The expression is the sum of three variables; each variable corresponds to an image data, summing these three image data and outputting the resultant image. This study selects multispectral images for the red band, green band, and near-infrared band (Figure 4).

Figure 4.
Schematic diagram of wave operation.
3.2. Image Cropping
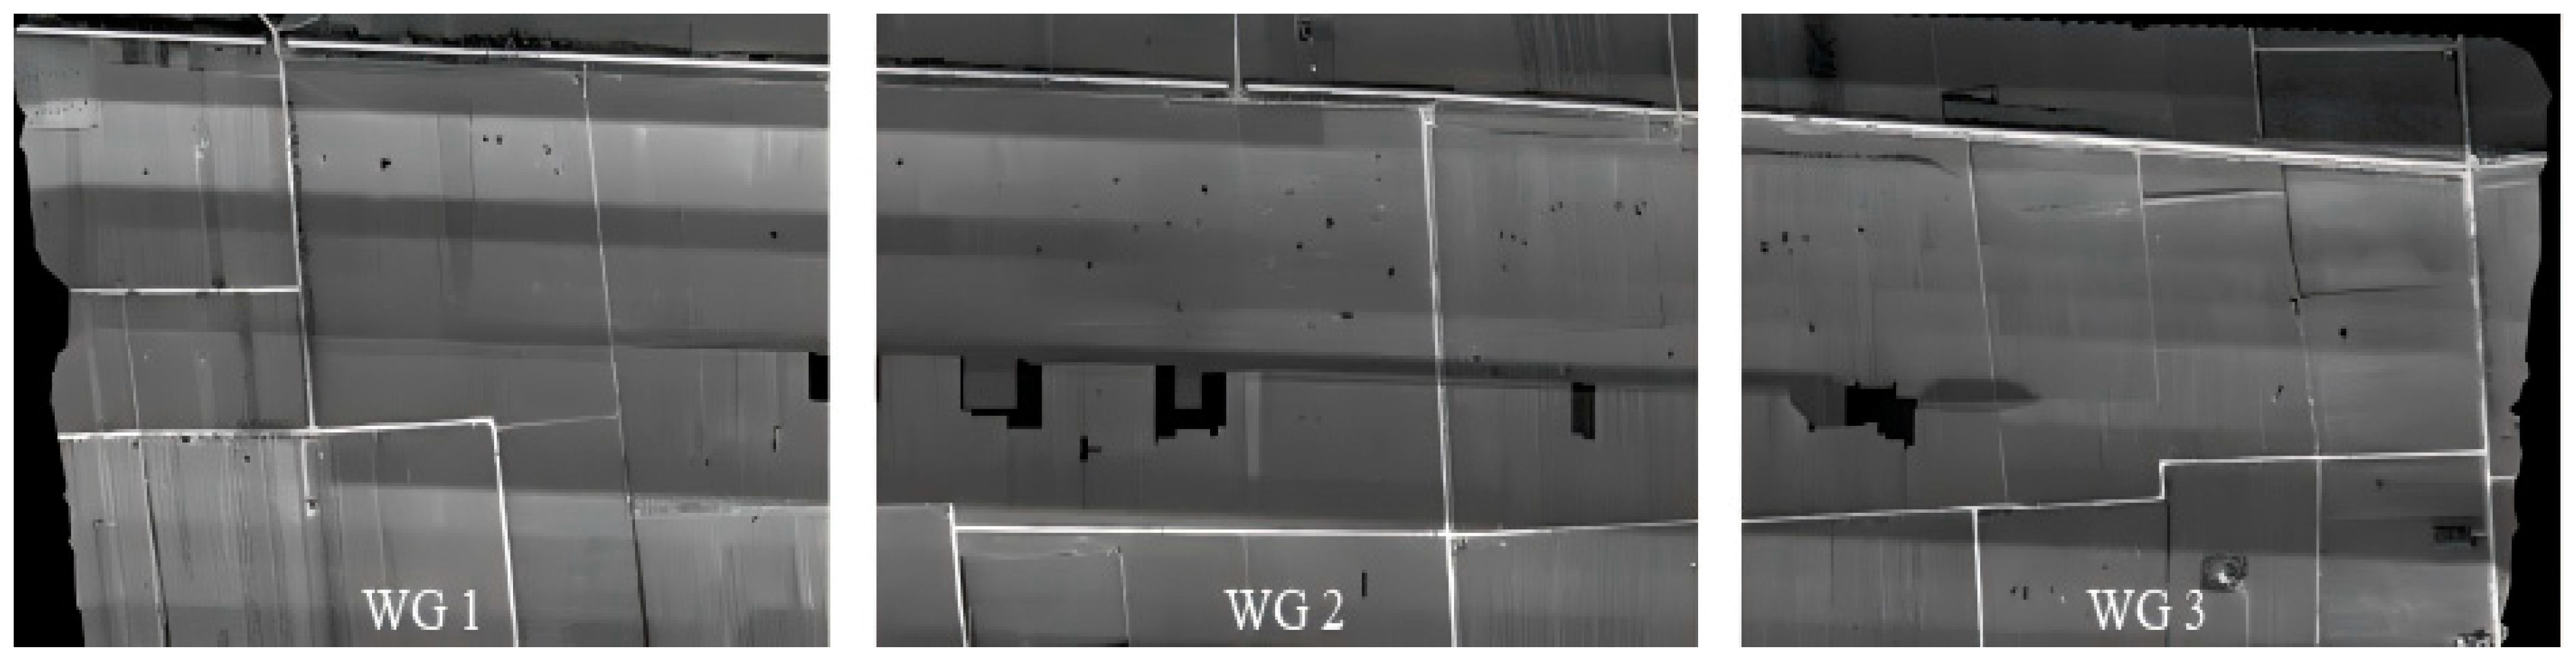
Due to the large size of the images, the blended images after band stacking were cropped using ArcGIS software to facilitate post-processing. Three cropped images were obtained, named WG 1, WG 2, and WG 3 from left to right (Figure 5). WG 1 represents the experimental area, while WG 2 and WG 3 represent the validation areas.

Figure 5.
Figure of the experimental irrigation area after cropping.
3.3. Mask Processing
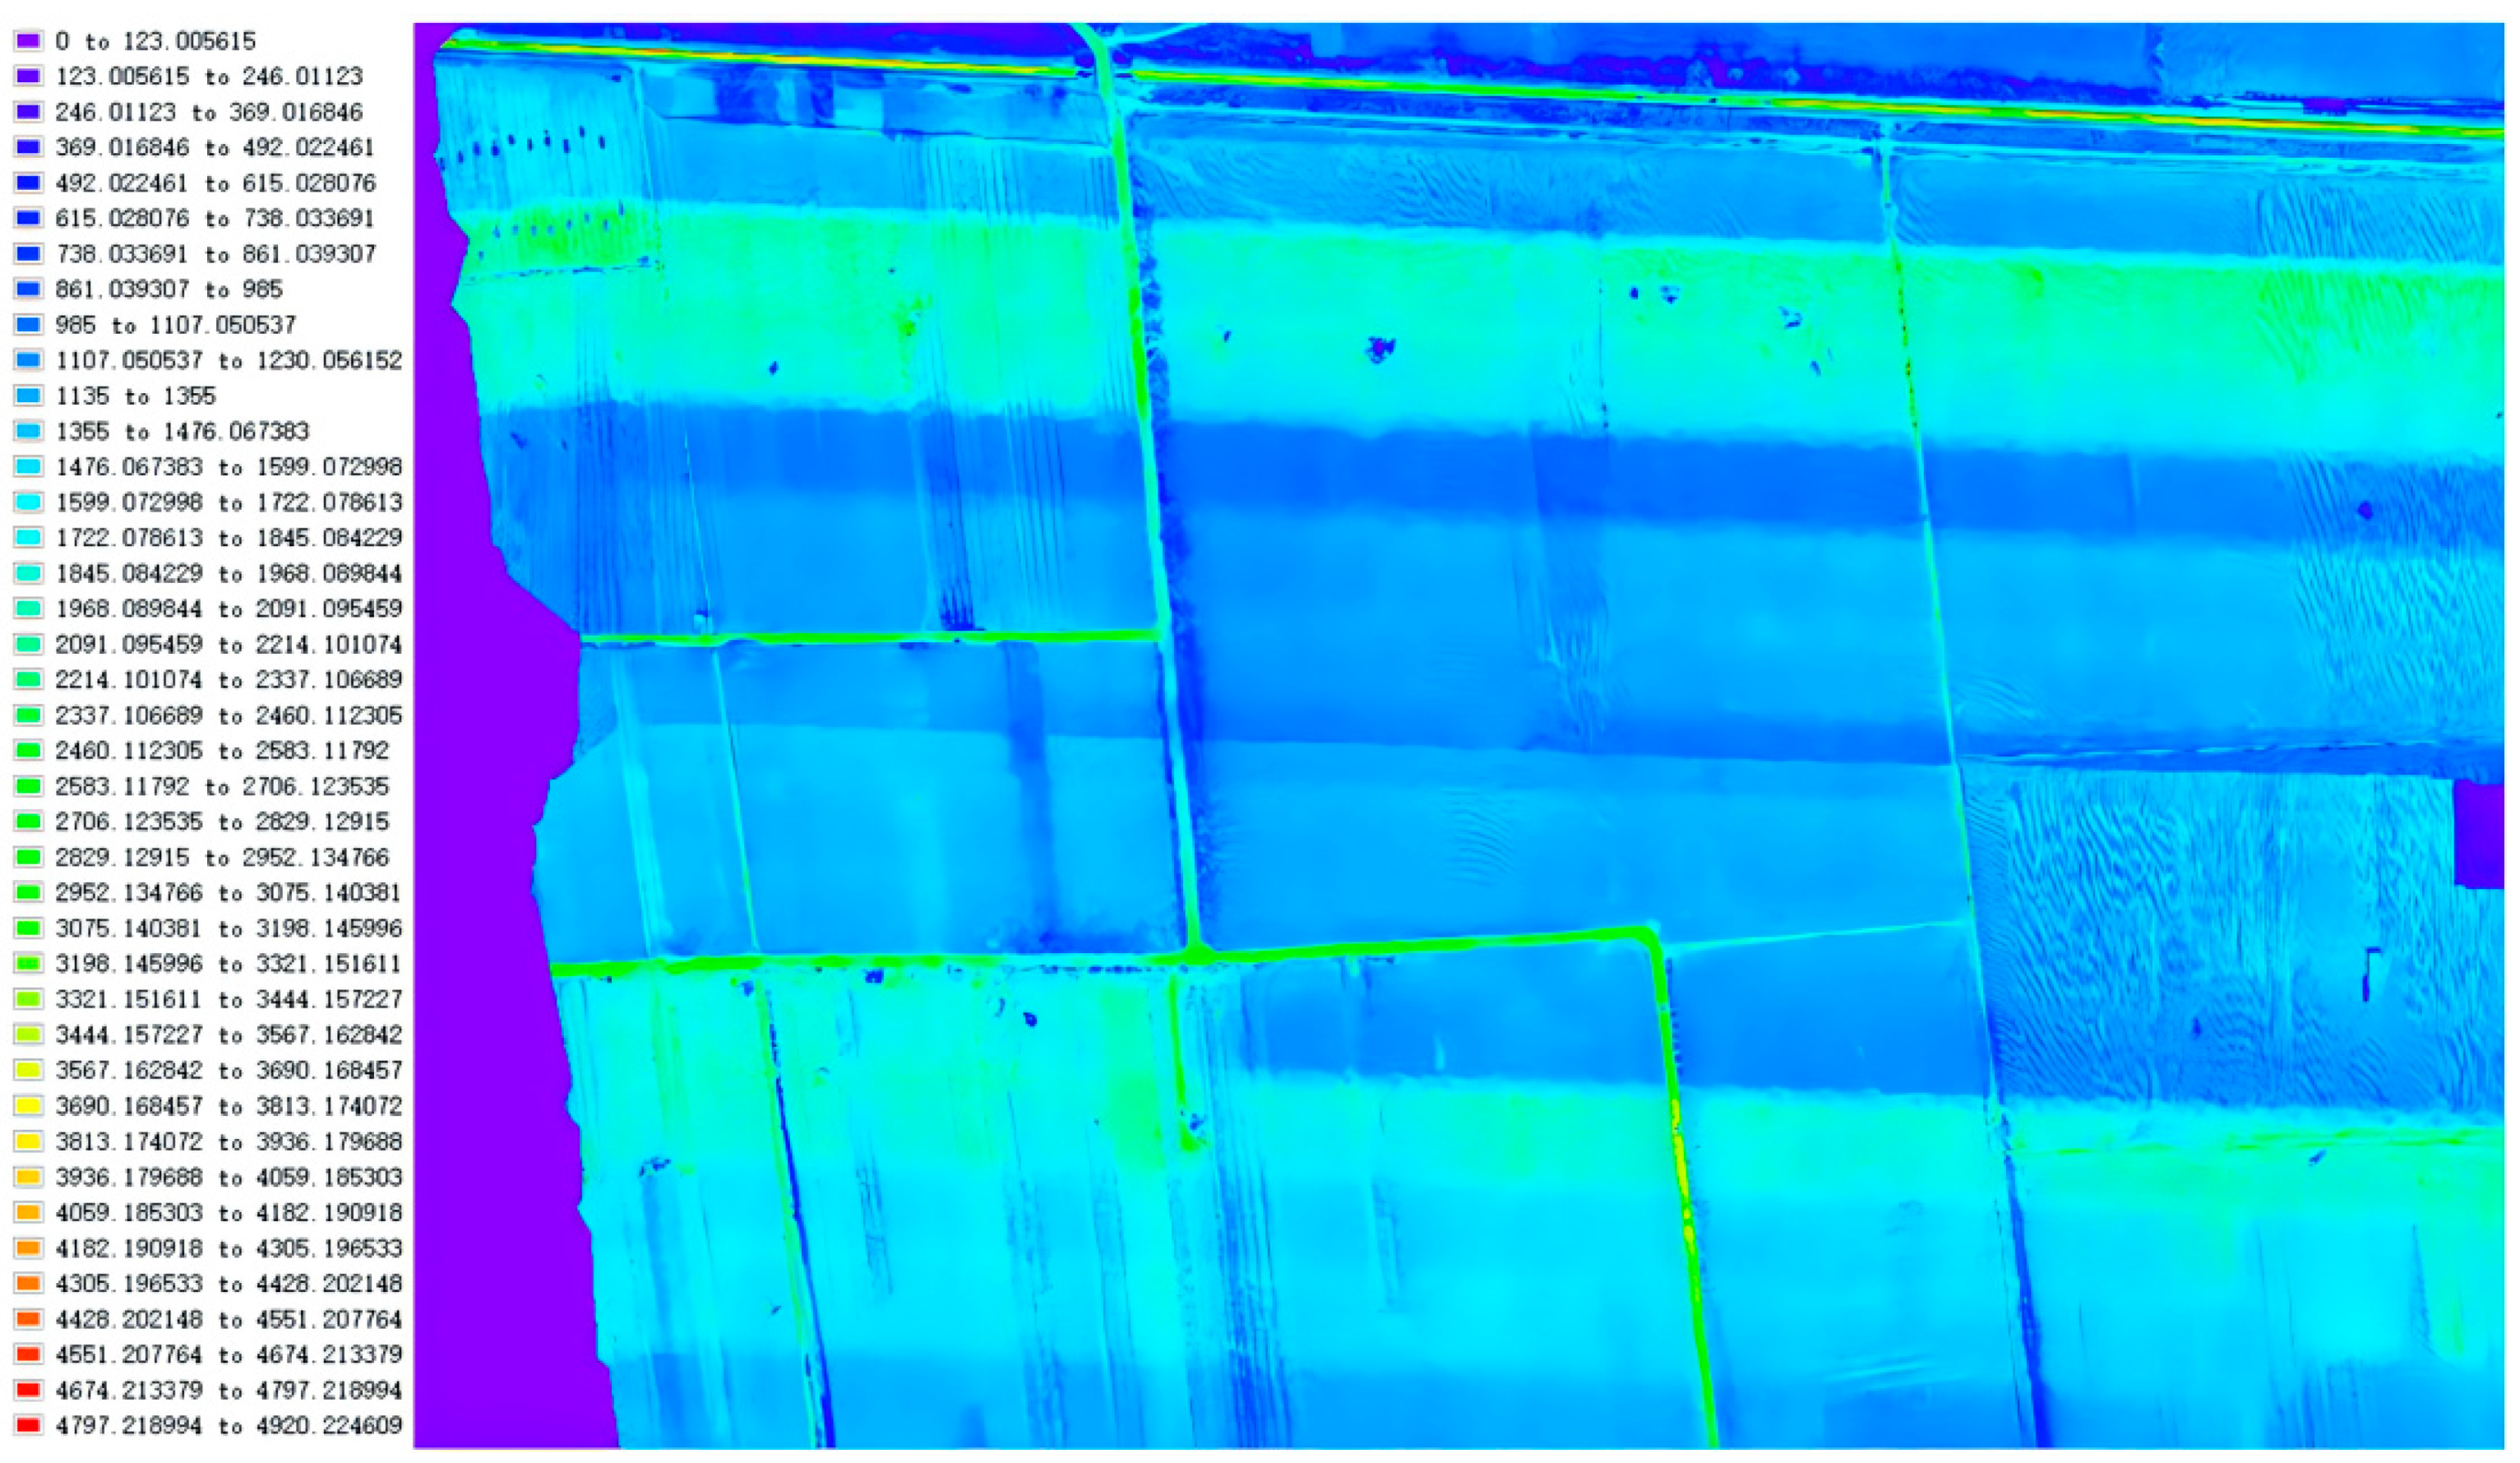
In blended images, various surface features have corresponding spectral quantization values. When extracting canal distribution information, the spectral characteristics of the canal system can be fully utilized. By setting the parameters of the spectral characteristics, i.e., the range of spectral values, the mixed images can undergo preprocessing to enhance extraction efficiency. Using the “Raster Color Slices” tool in ENVI software [37], the spectral value range for WG1 was determined to be [0, 4920]. The spectral intervals of the drainage systems were observed and adjusted through repeated trials to distinguish all drainage systems from other information as much as possible. Ultimately, the interval of other information was determined to be [985, 1355], and the drainage system was in [0, 985] ∪ [1355, 4920]. Then, Build Mask [38,39,40,41,42] was used to create a mask to preserve the drainage system information.
4. Research on the Extraction of Drainage System Distribution Information Based on Object-Oriented Approach
4.1. Research on the Extraction of Drainage System Distribution Information by Rule-Based Object-Oriented Method
The object-oriented method is used to extract the distribution information of the drainage system in the study area. The object-oriented method segments homogeneous pixels into objects of varying sizes using various segmentation algorithms. It fully utilizes spectral, shape, texture, and other feature information of the objects, and realizes the extraction of image information with the object as a unit. Compared with traditional pixel-based classification methods [43,44,45], it has unique advantages in processing high-resolution images. It can effectively improve classification accuracy and eliminate the “salt and pepper (SAP) noise”. The salt and pepper noise, also known as impulse noise, randomly changes some pixel values and appears as white and black pixels on a binary image. The main steps include image segmentation, feature extraction, rule establishment and classification.
4.2. Remote Sensing Image Segmentation Methods and Determination of Segmentation Parameters
Image segmentation is the basis and the most crucial part of object-oriented classification, where all pixels of the same object are assigned the same meaning after segmentation [46,47,48,49]. In high-resolution UAV images, channels are faceted features with a certain length as well as width, which differ significantly from the surrounding features. In ENVI, the best results can be achieved by using an edge-based detection-based segmentation method combined with the merging algorithm Full Lambda Schedule [50,51,52,53]. This merging algorithm is used to merge regions with the presence of large, more textured patches, such as woods, clouds, etc., and can iteratively merge small neighboring patches based on the combination of spectral and spatial information.
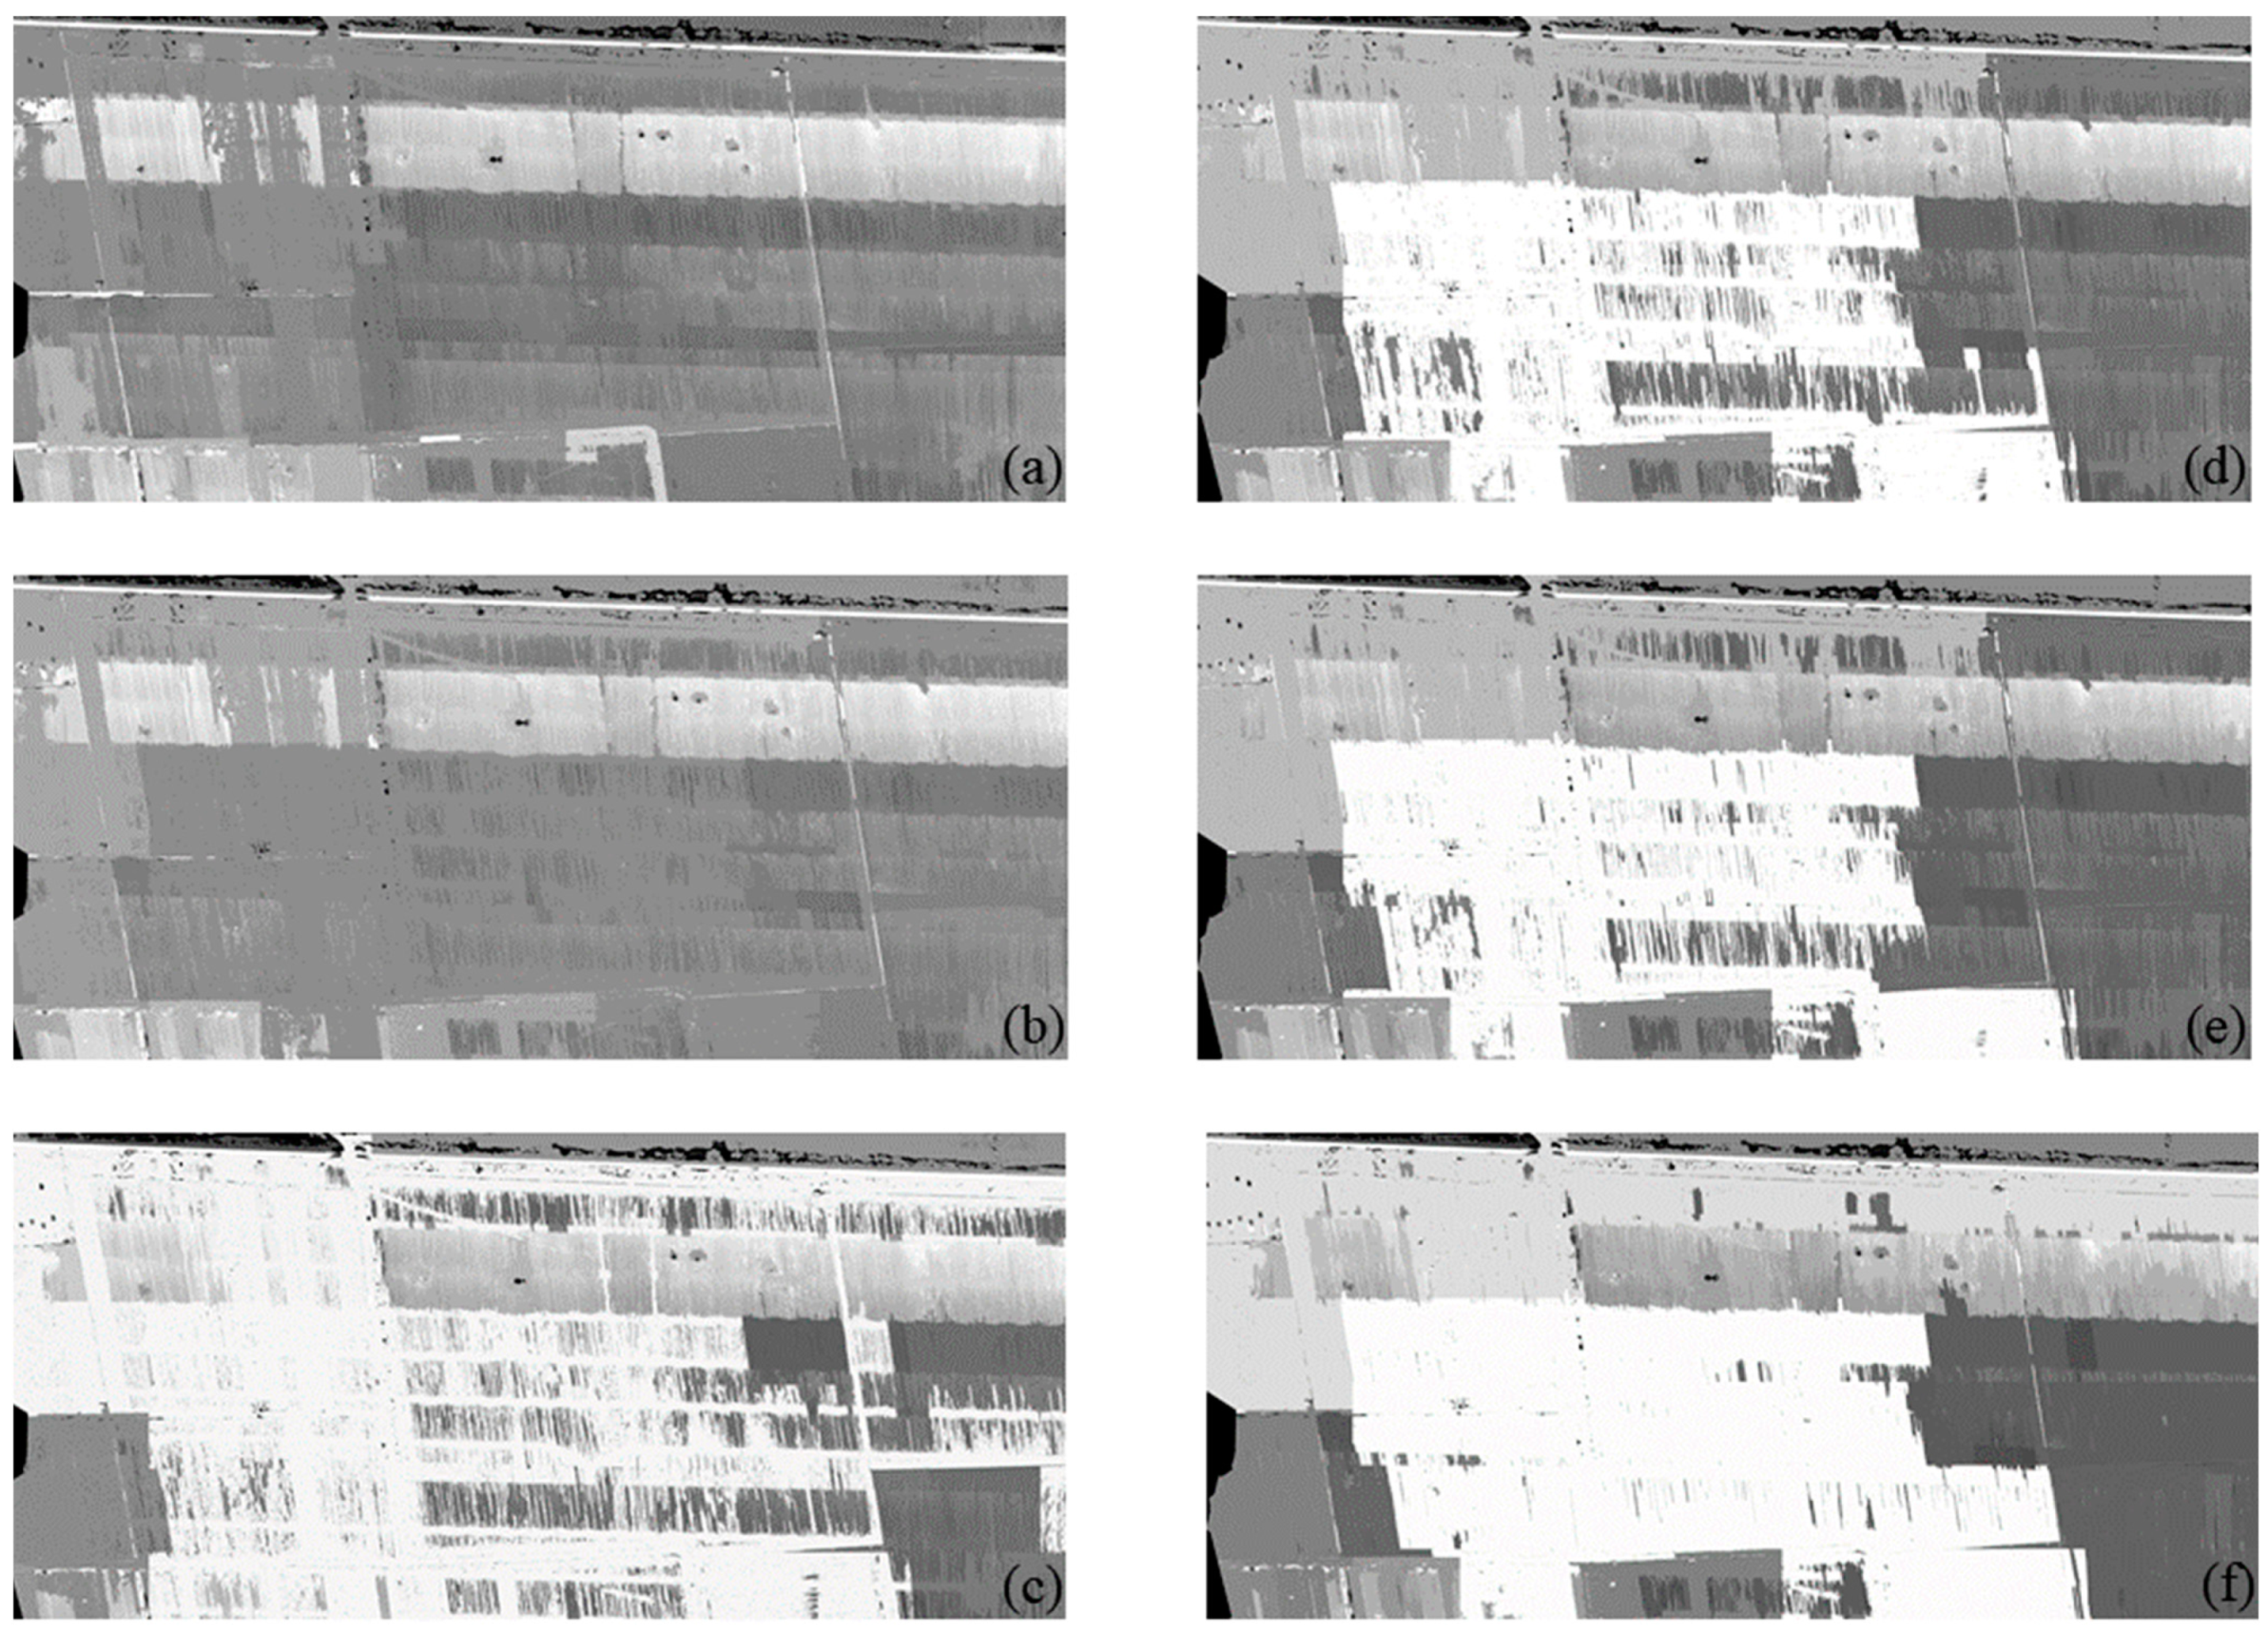
Before performing image segmentation, it is necessary to linearly optimize and stretch the image (2%). The scale parameters for segmentation and merging algorithms range from 0 to 100 [48]. The object-oriented feature extraction module has a real-time preview capability for segmentation results, allowing for the selection of appropriate segmentation thresholds through real-time preview to achieve optimal edge feature segmentation. Choosing a smaller segmentation scale may result in more small patches in the segmented remote sensing image. A higher number of small patches can increase the difficulty of extracting channels in the later stages, potentially leading to the accidental removal of short channel segments and reducing extraction accuracy. Conversely, selecting a larger segmentation scale may result in incomplete segmentation of the remote sensing image. Starting from a scale parameter of 0, the segmentation scale parameter increases in steps of 5, while the merging scale parameter increases in steps of 10. After previewing and analyzing the segmentation effect of different segmentation scales, 55, 60 and 65 are selected for preliminary segmentation of remote sensing images. From Figure 6, it is observed that compared to image (b), there are more small patches at a segmentation scale of 55, while at a scale of 65, the segmentation of the remote sensing image is incomplete. Therefore, for this study, a segmentation scale of 60 was selected for image classification.

Figure 6.
(a–c) correspond to segmentation scales of 55, 60, and 65, respectively; while (d–f) all use a segmentation scale of 60, with merging scales of 70, 80, and 90, respectively.
The segmentation result of remote sensing image with segmentation scale [54,55,56,57] of 60 has the phenomenon that the same feature object is segmented and the feature object is misclassified. These issues can be partially resolved using a merging algorithm. When the segmentation scale is 60, the preliminary merging scale [58,59,60] is 70, 80 and 90 after comparing and analyzing different merging scales. When the merging scale is small (merging scale of 70, Figure 6d), there are still more small patches, and when the merging scale is large (merging scale of 90, Figure 6f), it will result in the over-merging of small patches. Therefore, in this study, a merging scale of 80 was chosen for remote sensing image classification, with a default texture kernel size of 3.
4.3. Feature Extraction and Rule Creation
4.3.1. Classification Based on Spectral Mean
In the rule-based classification interface, each category is composed of several rules, and each rule is described by multiple attribute expressions [61]. The calculation of object feature parameters mainly includes spectral [62], texture [63,64], and spatial characteristics [65,66]. The spectral features of an object are transmitted to the remote sensing sensor after electromagnetic radiation or reflection and then expressed in the form of pixel grey values [67]. Spectral characteristics include the average gray value, standard deviation, maximum value, and minimum value. The features that describe the texture information of an image object or its sub-objects are called texture features. Spatial features, also known as geometric features, are also one of the main features describing the image object [68,69,70]. Commonly used spatial features include: area, length, compactness, concavity, extensibility, rectangularity, solidity, roundness, shape elements, and principal direction.
The spectral information of the drainage system is more different from that of some of the cultivated areas and can be used as a feature to extract drainage system information. In the classification based on spectral mean, the retained information pertains specifically to the drainage system. The range of canal system information determined in the mask processing is [0, 985] ⋃ [1355, 4920] (Figure 7), which is manually fine-tuned to remove the spectral mean range of [985, 2000] where some of the cultivated land information is located, and retain the canal system distribution information. However, for high-resolution UAV remote sensing images, which have fewer spectral bands and limited spectral information, relying solely on spectral features to identify the canal system is insufficient. Drainage systems are characterized by linear distribution in high-resolution remote sensing images, so spatial features can be selected to further extract drainage system distribution information.

Figure 7.
Spectral distribution figure of drainage systems.
4.3.2. Classification Based on Area and Rectangular Fit Rules
In non-georeferenced data, the area of a single pixel is 1. Consequently, the area of an image object is the number of pixels forming it. If the image data are georeferenced, the area of an image object is the true area covered by one pixel times the number of pixels forming the image objects [71]. The area of canal systems in UAV remote sensing images differs significantly from that of other land features. Therefore, their distinctiveness in terms of area can be used to further eliminate non-canal features. After repeated trials, the final area interval for canal system extraction was determined to be [0.2, 500].
Rectangular Fit [71,72] is a measure of rectangularity, where a perfect rectangle has a value of 1, and non-rectangular shapes have values less than 1. The formula for Rectangular Fit is defined as:
Rectangular Fit = Area/(Maximum Diameter × Minimum Diameter)
After repeated testing, the final Rectangular Fit value for canal systems was determined to be less than 0.74.
4.3.3. Extraction Based on Elongation and Compactness
Elongation is defined as the ratio of the maximum diameter to the minimum diameter of a polygon. A square has an elongation value of 1, while a rectangle has an elongation value greater than 1. The extraction method based on elongation rules is suitable for geographic features with linear characteristics and prominent elongation in their texture information, such as rivers and mountain ranges. Similarly, canal systems, which also exhibit linear characteristics, can be extracted using the elongation rule. After repeated testing, the final elongation value for canal systems was determined to be greater than 2.
Compactness [71] is a measure of how closely a polygon’s shape approximates a circle. It is calculated using the following formula:
Compactness = Sqrt (4 × Area/π)/Perimeter
In the extraction results, there are still several small patches with varying shapes. These can be eliminated using the compactness criterion. After repeated testing, the final compactness value for canal systems was determined to be less than 0.2.
4.4. Image Post-Processing
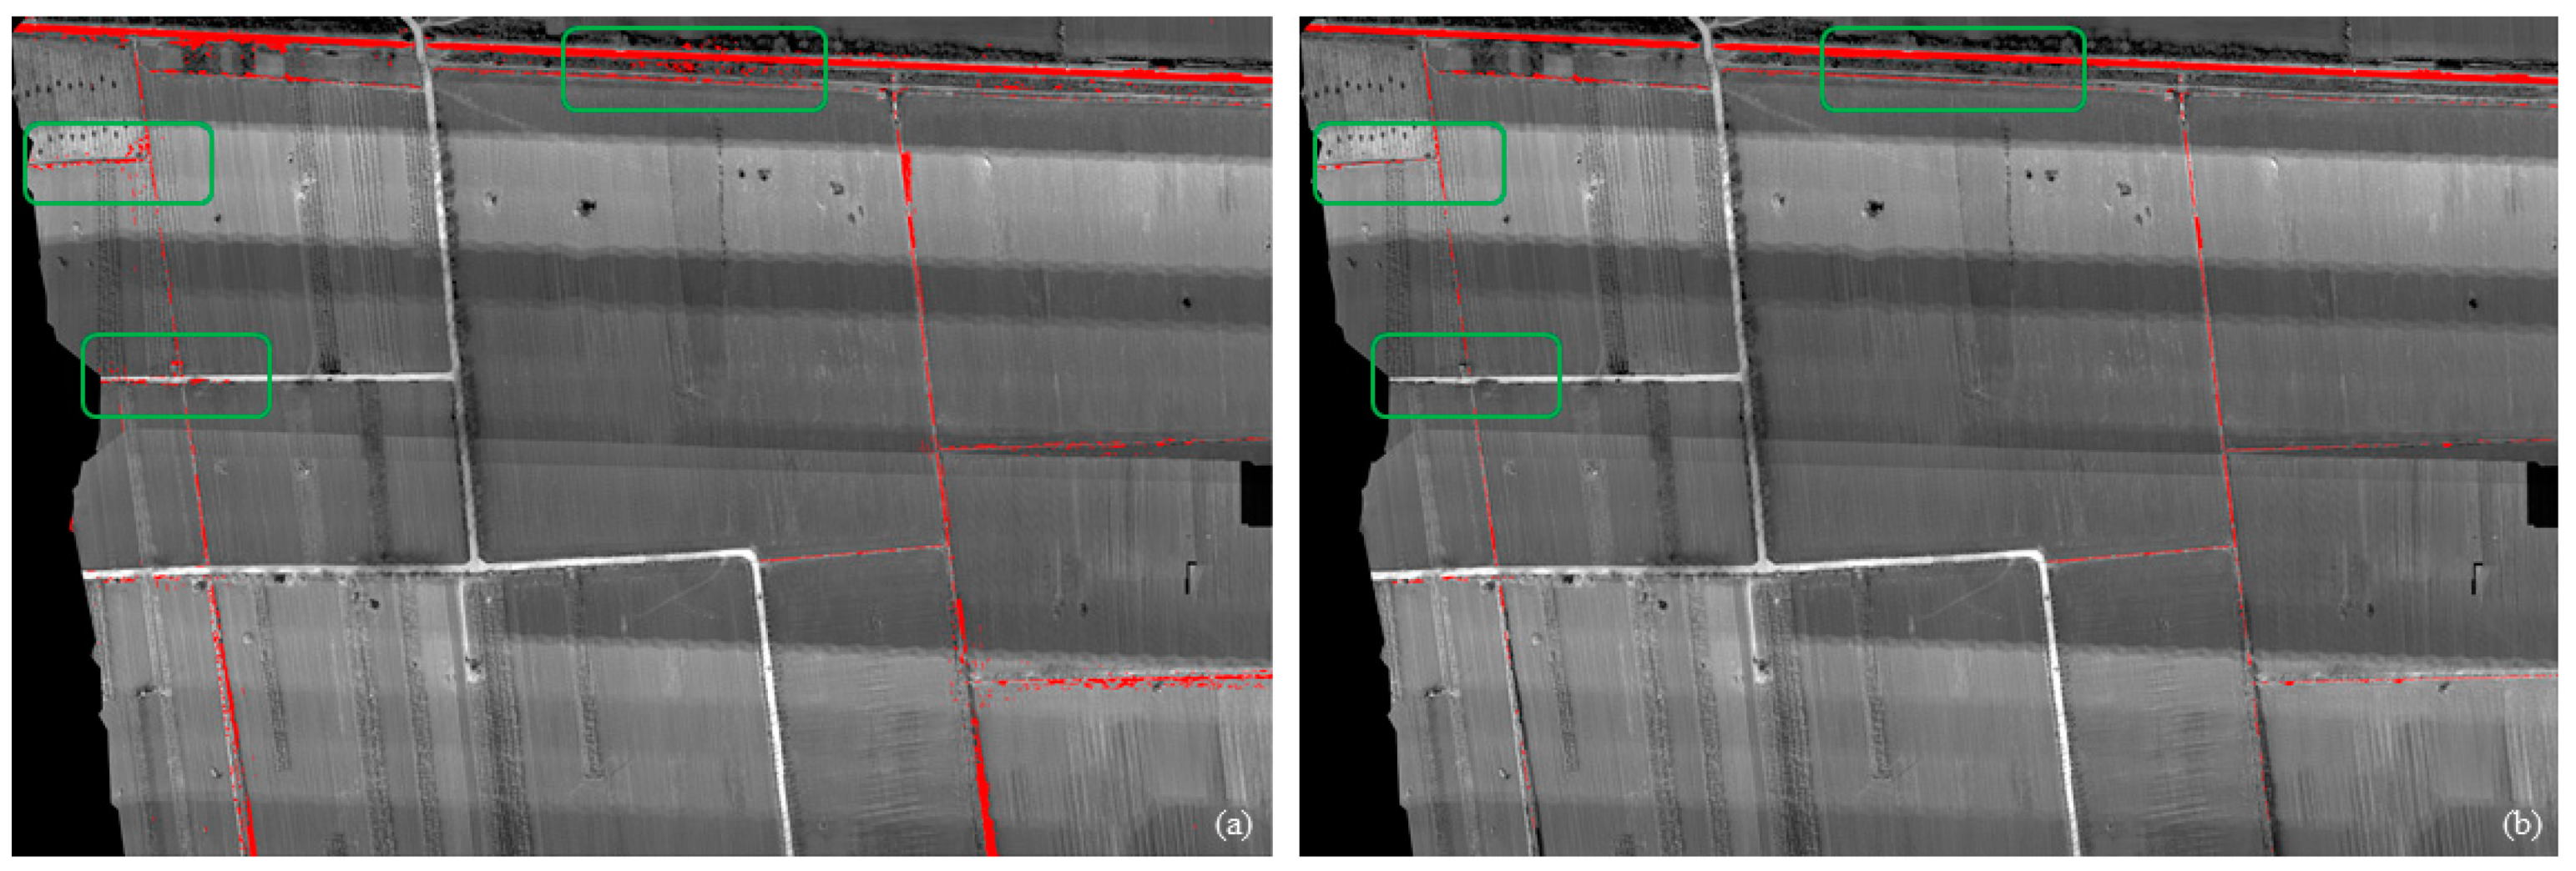
The vectorization results of the minor canals reflect the distribution information of canal systems in the remote sensing images. However, during image segmentation and feature extraction, it is inevitable that some patches not belonging to the desired extraction results will be generated. Therefore, these anomalous patches need to be removed before the extraction results can be used as a vector layer representing the canal system. In remote sensing image processing [73] software such as ArcGIS and ENVI, operations like modifying and deleting vector data can be performed [74,75]. In this study, by editing the vector data in ArcGIS, a vector image of the canal system was obtained. The vector data were then overlaid on the image after band calculations (Figure 8). Figure 8 shows a comparison before and after image processing. By observing and comparing the patches within the green boxes at the corresponding locations in Figure 8a,b, it can be seen that after vector data editing, the anomalous patches can be removed.

Figure 8.
Comparison of Images Before and After Post-Processing: (a) Spectral characterization and spatial feature extraction results figure; (b) Image post-processing figure.
5. Results and Analyses
5.1. Drainage System Extraction Results
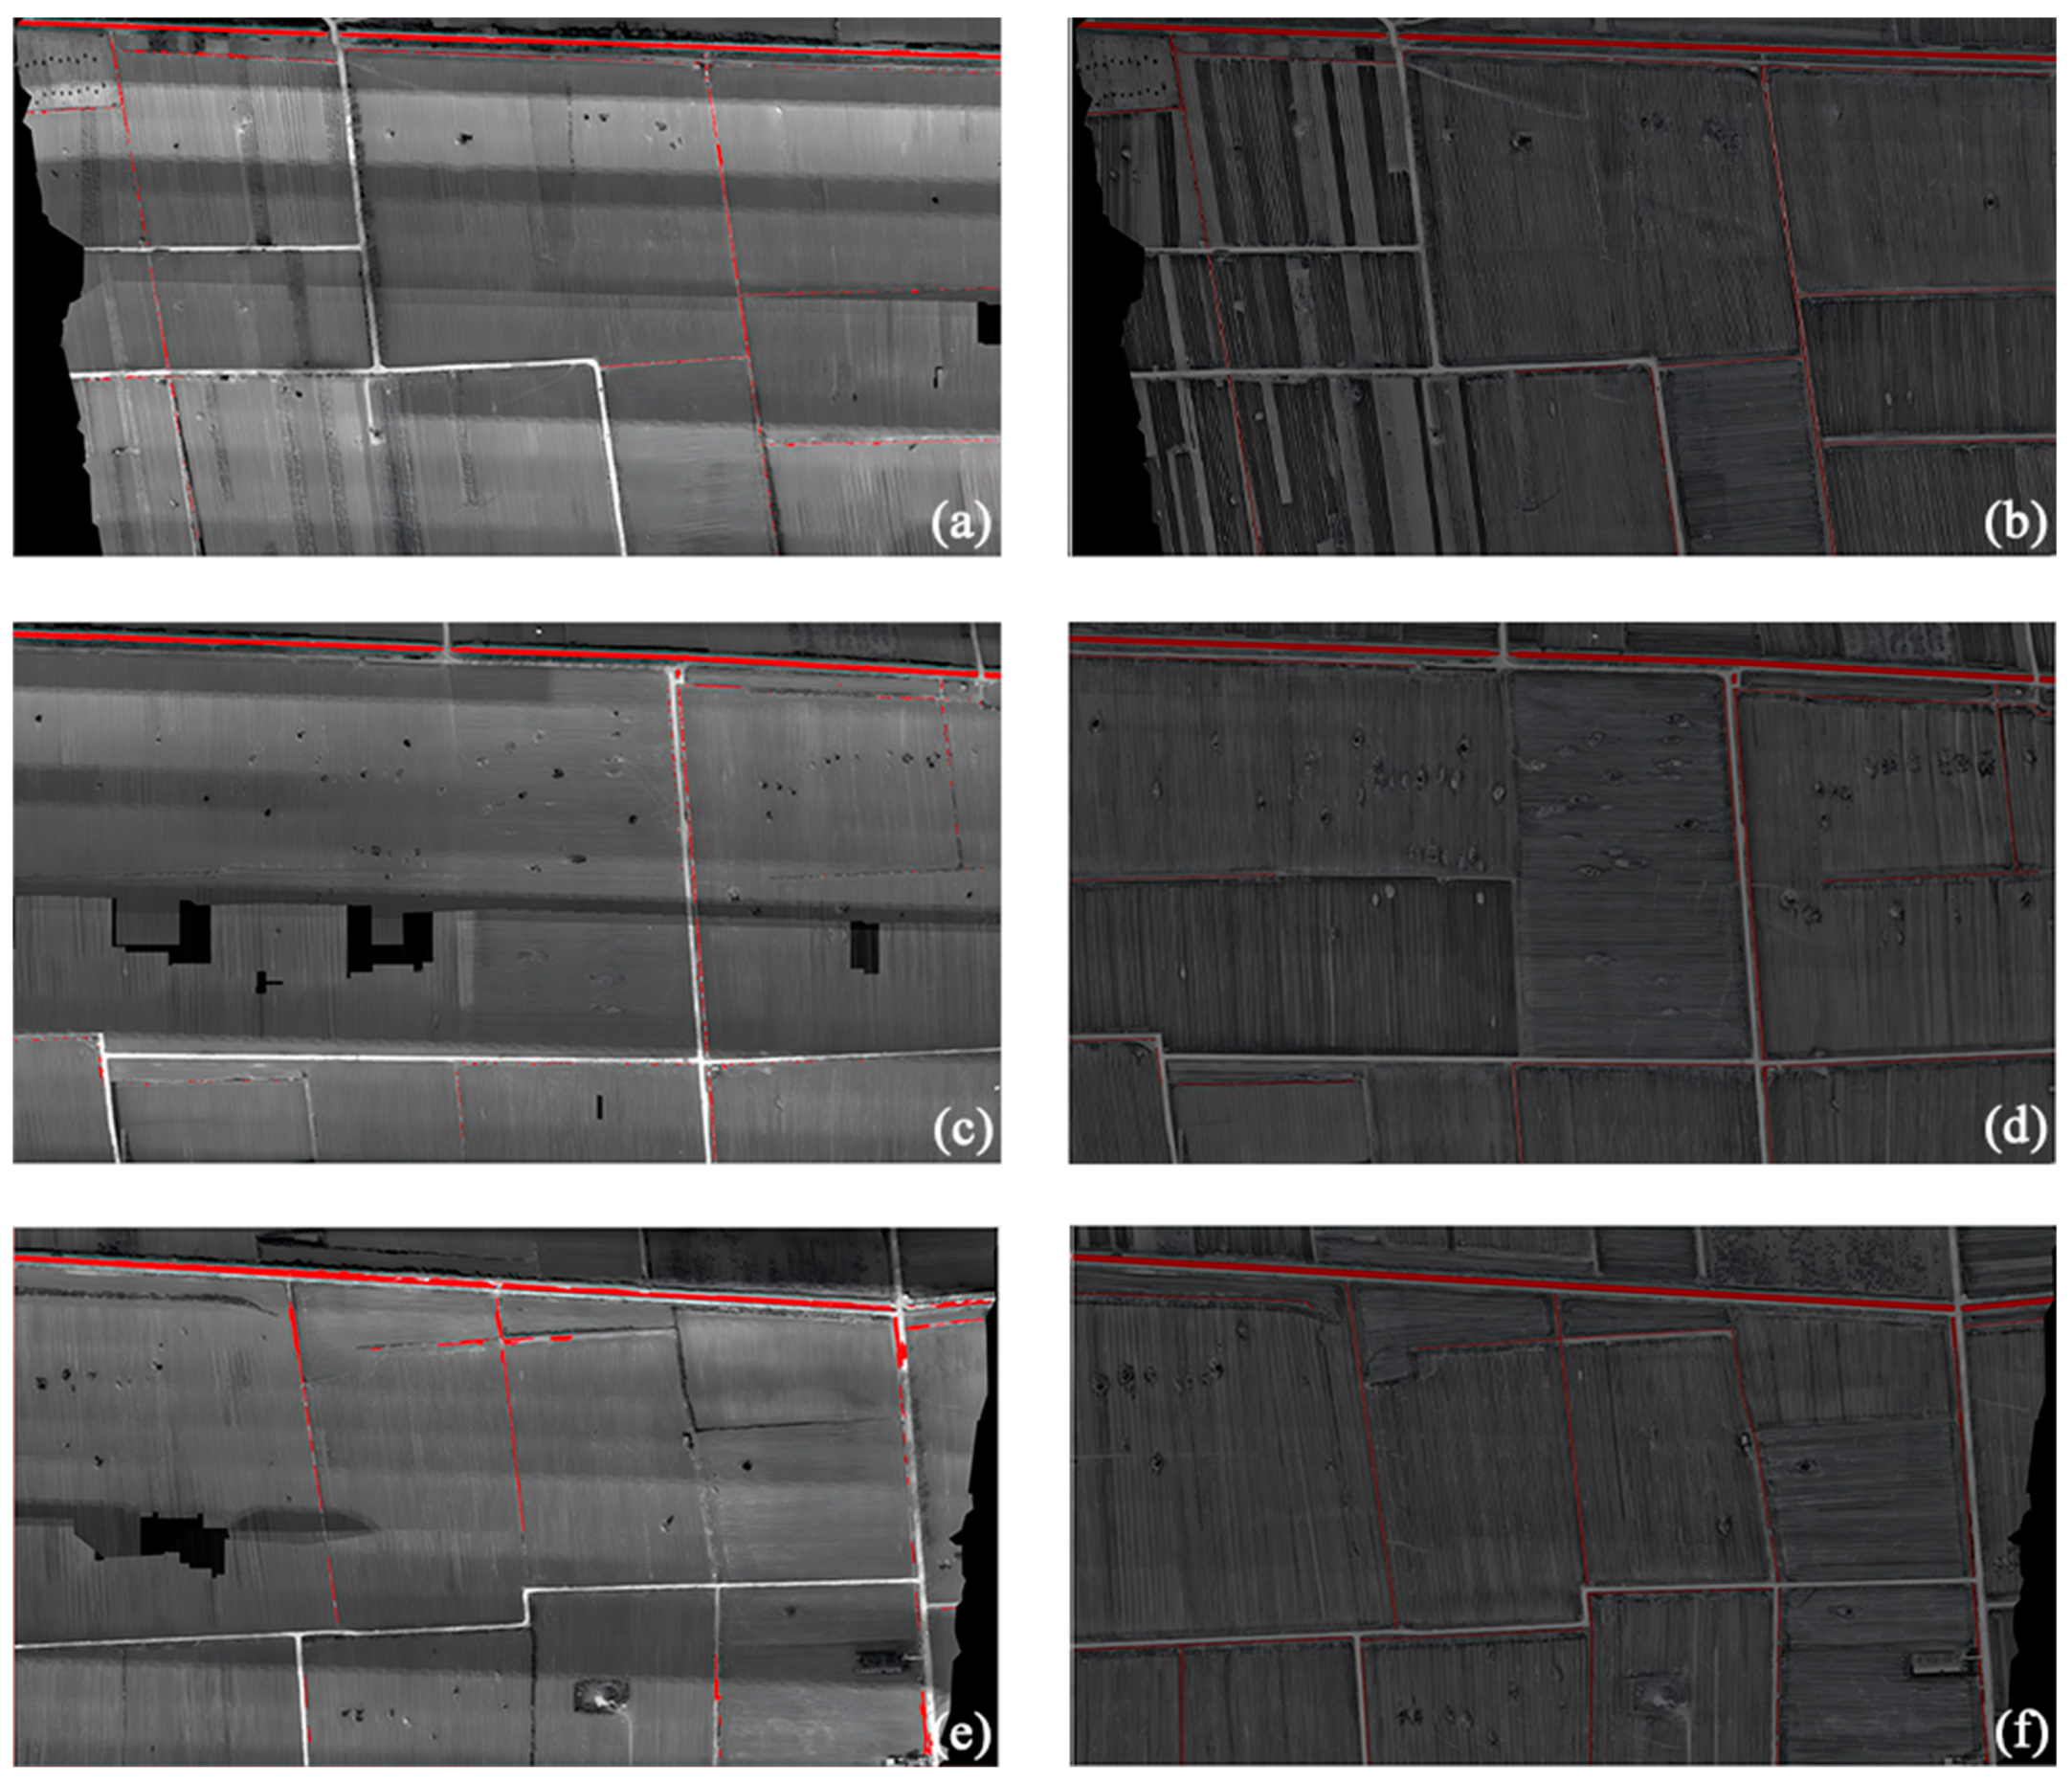
The extraction results of the canal system using the feature combination classification method based on the object-oriented approach are shown in Figure 9. Figure 9a,c,e display the extracted distribution information of canal systems for WG 1, WG 2, and WG 3, respectively, with the red parts indicating the extraction results. Figure 9b,d,f show the accurate canal distribution information (i.e., results from manual visual interpretation), with the red parts representing the correct canal information. In Figure 9a–f, the northernmost sections are spur channels. Apart from these, the rest are either lateral canals or sublateral ditches. The canals running in the north-south direction are mostly lateral canals, while those running in the east-west direction are primarily sublateral ditches. Through comparison of the extraction results with visual interpretation, it was found that the extraction accuracy of spur channels is relatively higher compared to lateral canals and sublateral ditches. However, the extraction results for sublateral ditches are relatively poorer compared to spur canals and lateral channels.

Figure 9.
(a,c,e) show the extraction results of WG 1, WG 2 and WG 3, respectively; (b,d,f) show the visual interpretation of WG 1, WG 2 and WG 3, respectively.
5.2. Precision Evaluation and Analysis
This study uses two evaluation indicators to evaluate the precision of the extraction results. The evaluation indicators include Recall and Precision. The overall recall rate for the irrigation area is 85.74%, and the precision rate is 55.08%. The recall rates for WG 1, WG 2, and WG 3 are 89.25%, 91.88%, and 77.43%, respectively, while the precision rates are 55.93%, 57.59%, and 51.98%, respectively. The highest recall in the test area is 91.88% for WG 2 and the lowest is 77.43% for WG 3 (Table 3). The recall of spur canal, lateral canal and sublateral ditches were 96.30%, 52.31% and 39.89%, respectively, and the precision was 70.36%, 24.20% and 14.84%, respectively (Table 4). The results of accuracy evaluation based on the type of channel showed that the recall and precision of the spur canal, lateral canal and sublateral ditches are in descending order. A comparison of the extraction result images reveals that in the WG 3 image, there are discontinuous debris at the bottom of the branch canals. During the image segmentation and merging process, the spectral inconsistency with the surrounding areas results in these regions being segmented into small patches. In further spatial feature processing, these patches are mistakenly removed, reducing the extraction accuracy.
Table 3.
Canal extraction accuracy (Based on the experimental irrigation area).
Table 4.
Canal extraction accuracy (Based on canal type).
6. Discussion
6.1. Impact of Object-Oriented Approach Based on Extraction Accuracy
Using multi-spectral images of the irrigation area, the information on the distribution of drainage systems was extracted by using the rule-based object-oriented method of ENVI software. The extraction results were post-processed to obtain the highest recall rate of 91.88% and the precision rate of 55.08% of the drainage systems of the irrigation area in the experimental area, which showed that the method had a high degree of accuracy. The essence of the object-oriented remote sensing image classification method is to use objects, rather than individual pixels, as the smallest unit and categorize them from high to low levels. This approach reduces the information extraction errors caused by pixel-based classification and improves the extraction accuracy of classification results. It not only fully utilizes the inherent information in the images but also facilitates effective image extraction. Traditional pixel-based classification methods are prone to the “salt-and-pepper effect,” where misclassification of individual pixels leads to increased image noise. The object-oriented method mitigates this phenomenon by processing the image as objects, significantly reducing noise and enhancing classification smoothness and accuracy. Benz et al. [76], through their study on high-resolution satellite images involving image preprocessing, object-based image segmentation, feature extraction, and classification, demonstrated that object-oriented processing significantly reduces the salt-and-pepper effect commonly found in traditional pixel-based classification methods. This leads to improved smoothness and consistency in classification results. The object-based approach is more accurate in identifying and classifying complex land features, resulting in a notable enhancement in classification accuracy. By utilizing features such as shape and texture of objects, the classification results better reflect the actual spatial distribution and characteristics of the land features, thereby enhancing the practical application value of remote sensing images. Fetai et al. [77] conducted a study investigating the use of UAV platforms combined with high-resolution optical sensors and the ENVI Feature Extraction module for cadastral map extraction. The accuracy assessment results showed that 80% of the cadastral boundaries were correctly identified. Zhao et al. [78] proposed an object-oriented convolutional neural network (OCNN) classification method to identify complex forests using data from Sentinel-2, RapidEye, and LiDAR. In the OCNN approach, the ResNet-18 convolutional neural network model performed the best, achieving a forest classification accuracy of 85.68%. Although it has strong adaptability to data, this leads to weak interpretability in the operation process, making it difficult to grasp the key parameters in the feature learning process. Yue et al. [26] utilized SPOT5 images and applied an object-oriented classification method to successfully extract water bodies. The results showed that the object-oriented classification method applied to water information extraction is more effective and has higher classification accuracy than the pixel-oriented supervised classification method.
6.2. Effect of Canal Type on Extraction Accuracy
In the process of extracting canal information from UAV remote sensing images using the rule-based object-oriented method, the width of the top of the canal affects the level of extraction accuracy. The accuracy evaluation of canal system extraction based on canal types shows that the spur canal had the highest recall and precision, at 96.30% and 70.36%, respectively. Next was the lateral canal, with a recall of 52.31% and a precision of 24.40%. Lastly, the sublateral canal had the lowest recall and precision, at 39.89% and 14.84%, respectively (Table 4). The corresponding canal top widths, from wide to narrow, are spur canal, lateral canal, and sublateral canal. Among them, the lateral canal, with a canal top width of 2.77 m, serves as a transition between the spur canal and the lateral canal, though it accounts for only a small portion. In addition to this, the canal top widths of both the lateral canal and the sublateral canal are less than 1 m. The experimental results indicate that the extraction accuracy is positively correlated with the canal top width. As the canal top width narrows, the extraction accuracy decreases. Moreover, this method is capable of extracting canal information with a width of less than 1 m. Xue et al. [79] developed an automatic river width extraction (ARWE) method based on satellite images for the automatic extraction of river width in the whole basin. The results show that when satellite images are used to extract the maximum and minimum river widths of the Yellow River Basin, the extraction errors of different river widths are significantly different, with an extraction error of 0.97 m for a large river (297.4 m) and 10.9% for a fine river (10 m). Kotluri et al. [80] extracted the polygonal extent of the river channel using high-resolution Google Maps images to extract the centerline and channel width. Compared to traditional manual measurement methods, this approach is more convenient, faster, and accurate. Zhou et al. [81] conducted a study on road extraction based on accurately extracting the centerline. The results showed that for wider roads, the average extraction accuracy could reach 95.676%. Han et al. [24] conducted a study in the Hetao Irrigation District of Inner Mongolia, using a fixed-wing UAV to interpret multispectral data of field ditches. The study found that the top width of the ditches ranged from a maximum of 2.1 m to a minimum of 1.0 m. The results showed that canals with larger top widths had an extraction accuracy of over 85%, while canals with smaller top widths had an extraction accuracy of only 70%. Zhang et al. [82] used ENVI 5.1 software to extract ecological canal information from a section of the Hetao Irrigation District in Inner Mongolia. The study found that the extraction accuracy for spur canals and lateral channels was relatively high, while the accuracy for agricultural canals was lower. The main reasons for this discrepancy were the smaller top widths of the agricultural canals, as well as the presence of roadside trees or weeds along the canal sides. Additionally, the presence of sediment in the lateral channels or agricultural canals affected the extraction of canal information, thereby reducing the extraction accuracy.
7. Conclusions and Recommendations
This study employs a rule-based object-oriented approach to extract canal system information using UAV multispectral imagery. The study indicates that the spectral characteristics and spatial features of the irrigation canal system can be fully leveraged to improve the accuracy of canal distribution information extraction of the canal system in the irrigation area. The extraction accuracy is positively correlated with the canal top width, and the accuracy decreases as the canal top width narrows. The results show that the extraction accuracy of the spur canal and lateral canal is relatively high, with recall rates of 96.30% and 52.31%, respectively, and precision rates of 70.36% and 24.40%. In contrast, the extraction accuracy for sublateral ditches is relatively low, with recall and precision rates of 39.89% and 14.84%, respectively. The overall recall and precision rates for the irrigation area are 85.74% and 55.08%, respectively. This method offers a novel approach for identifying canal systems in irrigation areas, providing valuable insights into canal distribution extraction and serving as a scientific reference for precision irrigation.
Future research should prioritize extracting canal distribution information in study areas with different regions and vegetation types to refine the rule establishment, thereby expanding their applicability. When segmenting multispectral images, the choice of threshold depends on real-time preview of the segmentation results, and these results can be further studied using eCognition software. In future studies, other methods such as fully convolutional neural (FCN) networks, supervised classification, and SVM should be explored and compared with the results to improve the extraction accuracy of canal distribution information.
Author Contributions
Conceptualization, W.W., X.H. (Xiaotao Hu) and X.H. (Xuefei Huo); methodology, X.H. (Xuefei Huo) and X.Y.; software, X.H. (Xuefei Huo), K.F. and Y.P.; validation, X.H. (Xuefei Huo) and Y.W.; formal analysis, X.H. (Xuefei Huo); investigation, W.W. and X.H. (Xiaotao Hu); resources, X.H. (Xuefei Huo), X.Y. and L.Q.; data curation, X.H. (Xuefei Huo), L.L. and Q.Y.; writing—original draft preparation, X.H. (Xuefei Huo); writing—review and editing, W.W.; visualization, X.H. (Xuefei Huo) and L.L.; supervision, W.W.; project administration, W.W.; funding acquisition, W.W. All authors have read and agreed to the published version of the manuscript.
Funding
This research was funded by the National Natural Science Foundation of China (Gant No. U2243235 and 52079113), National Key R&D Programme Project (2022YFD1900402-01).
Institutional Review Board Statement
Not applicable.
Data Availability Statement
The original contributions presented in the study are included in the article, further inquiries can be directed to the corresponding author.
Acknowledgments
Thanks to irrigation district staff for providing the base data, and Key Laboratory of Agricultural Soil and Water Engineering in Arid and Semiarid Areas for providing the drone.
Conflicts of Interest
The authors declare no conflicts of interest.
References
- Rahman, M.F.F.; Fan, S.; Zhang, Y.; Chen, L. A Comparative Study on Application of Unmanned Aerial Vehicle Systems in Agriculture. Agriculture 2021, 11, 22. [Google Scholar] [CrossRef]
- Yang, B.; Pei, Z.; Zhou, Q.; Liu, H. Key Technologies of Crop Monitoring Using Remote Sensing at a National Scale: Progress and Problems. Trans. Chin. Soc. Agric. Eng. 2002, 18, 191–194. [Google Scholar]
- Shi, Y.; Bai, M.; Li, Y.; Li, Y. Study on UAV Remote Sensing Technology in Irrigation District Informationization Construction and Application. In Proceedings of the 2018 10th International Conference on Measuring Technology and Mechatronics Automation (ICMTMA), Changsha, China, 10–11 February 2018; IEEE: Piscataway, NJ, USA, 2018; pp. 252–255. [Google Scholar]
- Wang, P.; Luo, X.; Zhou, Z.; Zang, Y.; Hu, L. Key technology for remote sensing information acquisition based on micro UAV. Trans. Chin. Soc. Agric. Eng. 2014, 30, 1–12. [Google Scholar]
- Yin, X. Study on Development Evaluation and Operation System of Regional Circular Economy. Ph.D. Thesis, Tianjin University, Tianjin, China, 2009. [Google Scholar]
- Huang, Y.; Thomson, S.J.; Hoffmann, W.C.; Lan, Y.; Fritz, B.K. Development and prospect of unmanned aerial vehicle technologies for agricultural production management. Int. J. Agric. Biol. Eng. 2013, 6, 1. [Google Scholar]
- Huang, Y.; Fipps, G.; Maas, S.J.; Fletcher, R.S. Airborne remote sensing for detection of irrigation canal leakage. Irrig. Drain. 2010, 59, 524–534. [Google Scholar] [CrossRef]
- Haq, M.A.; Rahaman, G.; Baral, P.; Ghosh, A. Deep Learning Based Supervised Image Classification Using UAV Images for Forest Areas Classification. J. Indian Soc. Remote Sens. 2021, 49, 601–606. [Google Scholar] [CrossRef]
- Zhang, X.; Chen, G.; Wang, W.; Wang, Q.; Dai, F. Object-Based Land-Cover Supervised Classification for Very-High-Resolution UAV Images Using Stacked Denoising Autoencoders. IEEE J. Sel. Top. Appl. Earth Observ. Remote Sens. 2017, 10, 3373–3385. [Google Scholar] [CrossRef]
- Khan, S.; Tufail, M.; Khan, M.T.; Khan, Z.A.; Iqbal, J.; Alam, M. A novel semi-supervised framework for UAV based crop/weed classification. PLoS ONE 2021, 16, e251008. [Google Scholar] [CrossRef]
- Xu, D.; Li, Y.; Cai, L.; Vincent, B. Applied study of satellite image in identification of irrigation and drainage system. Trans. Chin. Soc. Agric. Eng. 2004, 20, 36–39. [Google Scholar]
- Bahadur, K.C.K. Improving Landsat and IRS Image Classification: Evaluation of Unsupervised and Supervised Classification through Band Ratios and DEM in a Mountainous Landscape in Nepal. Remote Sens. 2009, 1, 1257–1272. [Google Scholar] [CrossRef]
- Garcia-Dias, R.; Prieto, C.A.; Almeida, J.S.; Ordovás-Pascual, I. Machine learning in APOGEE. Astron. Astrophys. 2018, 612, A98. [Google Scholar] [CrossRef]
- Romero, A.; Gatta, C.; Camps-Valls, G. Unsupervised Deep Feature Extraction for Remote Sensing Image Classification. IEEE Trans. Geosci. Remote Sens. 2016, 54, 1349–1362. [Google Scholar] [CrossRef]
- Sun, H.; Wang, L.; Liu, H.; Sun, Y. Hyperspectral Image Classification with the Orthogonal Self-Attention ResNet and Two-Step Support Vector Machine. Remote Sens. 2024, 16, 1010. [Google Scholar] [CrossRef]
- Traoré, F.; Palé, S.; Zaré, A.; Traoré, M.K.; Ouédraogo, B.; Bonkoungou, J. A Comparative Analysis of Random Forest and Support Vector Machines for Classifying Irrigated Cropping Areas in The Upper-Comoé Basin, Burkina Faso. Indian J. Sci. Technol. 2024, 17, 713–722. [Google Scholar] [CrossRef]
- Mountrakis, G.; Im, J.; Ogole, C. Support vector machines in remote sensing: A review. ISPRS-J. Photogramm. Remote Sens. 2011, 66, 247–259. [Google Scholar] [CrossRef]
- Mather, M.P.A.P. Support vector machines for classification in remote sensing. Int. J. Remote Sens. 2005, 26, 1007–1011. [Google Scholar]
- Gu, Z.; Zhang, C.; Yang, J.; Zhu, D.; Yue, A. Method of Extracting Irrigation and Drainage Ditches Based on High Remote Sensing Image. Agric. Eng. 2014, 4, 64–67– 72. [Google Scholar]
- Wu, J.; Liu, J.; Huang, X.; Peng, J.; Li, H. Automatic identification of irrigation and drainage system in land reclamation area based on object-oriented classification. Trans. Chin. Soc. Agric. Eng. 2012, 28, 25–31. [Google Scholar]
- Han, Y.; Wang, P.; Zheng, Y.; Yasir, M.; Xu, C.; Nazir, S.; Hossain, M.S.; Ullah, S.; Khan, S. Extraction of Landslide Information Based on Object-Oriented Approach and Cause Analysis in Shuicheng, China. Remote Sens. 2022, 14, 502. [Google Scholar] [CrossRef]
- Dahiya, S.; Garg, P.K.; Jat, M.K. Object oriented approach for building extraction from high resolution satellite images. In Proceedings of the 2013 3rd IEEE International Advance Computing Conference (IACC), Ghaziabad, India, 22–23 February 2013; IEEE: Piscataway, NJ, USA, 2013; pp. 1300–1305. [Google Scholar]
- Zhang, Z.; Han, Y.; Chen, J.; Cao, Y.; Wang, S.; Wang, G.; Du, N. Fusion rules and image enhancement of unmanned aerial vehicle remote sensing imagery for ecological canal data extraction. Desalin. Water Treat. 2019, 166, 168–179. [Google Scholar] [CrossRef]
- Han, W.; Zhang, L.; Zhang, H.; Shi, Z.; Yuan, M.; Wang, Z. Extraction Method of Sublateral Canal Distribution Information Based on UAV Remote Sensing. Trans. Chin. Soc. Agric. Mach. 2017, 48, 205–214. [Google Scholar]
- Mhangara, P.; Odindi, J.; Kleyn, L.; Remas, H. Road Extraction Using Object Oriented Classification. 2011. Available online: https://www.researchgate.net/profile/John-Odindi/publication/267856733_Road_extraction_using_object_oriented_classification/links/55b9fec108aed621de09550a/Road-extraction-using-object-oriented-classification.pdf (accessed on 30 July 2015).
- Yue, Y.; Gong, J.; Wang, D. The extraction of water information based on SPOT5 image using object-oriented method. In Proceedings of the 2010 18th International Conference on Geoinformatics, Beijing, China, 18–20 June 2010; IEEE: Piscataway, NJ, USA, 2010; pp. 1–5. [Google Scholar]
- Kumar, M.; Singh, R.K.; Raju, P.L.N.; Krishnamurthy, Y.V.N. Road Network Extraction from High Resolution Multispectral Satellite Imagery Based on Object Oriented Techniques. ISPRS Ann. Photogramm. Remote Sens. Spat. Inf. Sci. 2014, 8, 107–110. [Google Scholar] [CrossRef]
- Yi, Z. The Application of Remote Sensing Technology in Irrigation Management. Master’s Thesis, Lanzhou Jiaotong University, Lanzhou, China, 2014. [Google Scholar]
- Ranawana, R.; Palade, V. Optimized Precision—A New Measure for Classifier Performance Evaluation. In Proceedings of the 2006 IEEE International Conference on Evolutionary Computation, Vancouver, BC, Canada, 16–21 July 2006; IEEE: Piscataway, NJ, USA, 2006; pp. 2254–2261. [Google Scholar]
- Su, L.T. The Relevance of Recall and Precision in User Evaluation. J. Am. Soc. Inf. Sci. 1994, 45, 207–217. [Google Scholar] [CrossRef]
- Junker, M.; Hoch, R.; Dengel, A. On the evaluation of document analysis components by recall, precision, and accuracy. In Proceedings of the Fifth International Conference on Document Analysis and Recognition. ICDAR ′99 (Cat. No.PR00318), Bangalore, India, 22–22 September 1999; IEEE: Piscataway, NJ, USA, 1999; pp. 713–716. [Google Scholar]
- Zhang, X.; Feng, X.; Xiao, P.; He, G.; Zhu, L. Segmentation quality evaluation using region-based precision and recall measures for remote sensing images. ISPRS-J. Photogramm. Remote Sens. 2015, 102, 73–84. [Google Scholar] [CrossRef]
- Yu, X.; Xia, Y.; Zhou, J.; Jiang, W. Landslide Susceptibility Mapping Based on Multitemporal Remote Sensing Image Change Detection and Multiexponential Band Math. Sustainability 2023, 15, 2226. [Google Scholar] [CrossRef]
- Ma, Y.; Zhang, J.; Gao, Y. High Resolution Remote Sensing Image Classification of Coastal Zone and Its Automatic Realization. In Proceedings of the 2008 International Conference on Computer Science and Software Engineering, Wuhan, China, 12–14 December 2008; IEEE: Piscataway, NJ, USA; Volume 12008, pp. 827–829. [Google Scholar]
- Kayet, N.; Pathak, K.; Chakrabarty, A.; Kumar, S.; Chowdary, V.M.; Singh, C.P.; Sahoo, S.; Basumatary, S. Assessment of foliar dust using Hyperion and Landsat satellite imagery for mine environmental monitoring in an open cast iron ore mining areas. J. Clean. Prod. 2019, 218, 993–1006. [Google Scholar] [CrossRef]
- Samani Majd, A.M.; Bleiweiss, M.P.; DuBois, D.; Shukla, M.K. Estimation of the fractional canopy cover of pecan orchards using Landsat 5 satellite data, aerial imagery, and orchard floor photographs. Int. J. Remote Sens. 2013, 34, 5937–5952. [Google Scholar] [CrossRef]
- Md Tarmizi, N.; Samad, A.M.; Yusop, M.S.M. Shoreline data extraction from QuickBird satellite image using semi-automatic technique. In Proceedings of the 2014 IEEE 10th International Colloquium on Signal Processing and its Applications, Kuala Lumpur, Malaysia, 7–9 March 2014; IEEE: Piscataway, NJ, USA, 2014; pp. 157–162. [Google Scholar]
- Gao, X.; Wang, M.; Yang, Y.; Li, G. Building Extraction From RGB VHR Images Using Shifted Shadow Algorithm. IEEE Access 2018, 6, 22034–22045. [Google Scholar] [CrossRef]
- Chen, J.; Xu, Y.; Lu, S.; Liang, R.; Nan, L. 3D Instance Segmentation of MVS Buildings; Cornell University Library: Ithaca, NY, USA, 2022. [Google Scholar]
- Araújo, G.K.D.; Rocha, J.V.; Lamparelli, R.A.C.; Rocha, A.M. Mapping of summer crops in the State of Paraná, Brazil, through the 10-day spot vegetation NDVI composites. Eng. Agrícola 2011, 31, 760–770. [Google Scholar] [CrossRef]
- Hao, J.; Dong, F.; Li, Y.; Wang, S.; Cui, J.; Zhang, Z.; Wu, K. Investigation of the data fusion of spectral and textural data from hyperspectral imaging for the near geographical origin discrimination of wolfberries using 2D-CNN algorithms. Infrared Phys. Technol. 2022, 125, 104286. [Google Scholar] [CrossRef]
- Zhang, H.; Zhang, S.; Chen, Y.; Luo, W.; Huang, Y.; Tao, D.; Zhan, B.; Liu, X. Non-destructive determination of fat and moisture contents in Salmon (Salmo salar) fillets using near-infrared hyperspectral imaging coupled with spectral and textural features. J. Food Compos. Anal. 2020, 92, 103567. [Google Scholar] [CrossRef]
- Gao, Y.; Mas, J.F. A comparison of the performance of pixel-based and object-based classifications over images with various spatial resolutions. Online J. Earth Sci. 2008, 2, 27–35. [Google Scholar]
- Ye, Z.; Yang, K.; Lin, Y.; Guo, S.; Sun, Y.; Chen, X.; Lai, R.; Zhang, H. A comparison between Pixel-based deep learning and Object-based image analysis (OBIA) for individual detection of cabbage plants based on UAV Visible-light images. Comput. Electron. Agric. 2023, 209, 107822. [Google Scholar] [CrossRef]
- Sibaruddin, H.I.; Shafri, H.Z.M.; Pradhan, B.; Haron, N.A. Comparison of pixel-based and object-based image classification techniques in extracting information from UAV imagery data. Iop Conf. Series. Earth Environ. Sci. 2018, 169, 12098. [Google Scholar] [CrossRef]
- Chen, B.; Qiu, F.; Wu, B.; Du, H. Image Segmentation Based on Constrained Spectral Variance Difference and Edge Penalty. Remote Sens. 2015, 7, 5980–6004. [Google Scholar] [CrossRef]
- Minaee, S.; Boykov, Y.; Porikli, F.; Plaza, A.; Kehtarnavaz, N.; Terzopoulos, D. Image Segmentation Using Deep Learning: A Survey. IEEE Trans. Pattern Anal. Mach. Intell. 2022, 44, 3523–3542. [Google Scholar] [CrossRef]
- Cheng, H.D.; Jiang, X.H.; Sun, Y.; Wang, J. Color image segmentation: Advances and prospects. Pattern Recognit. 2001, 34, 2259–2281. [Google Scholar] [CrossRef]
- Ghosh, S.; Das, N.; Das, I.; Maulik, U. Understanding Deep Learning Techniques for Image Segmentation. ACM Comput. Surv. 2020, 52, 1–35. [Google Scholar] [CrossRef]
- Wang, J.; Jiang, L.; Wang, Y.; Qi, Q. An Improved Hybrid Segmentation Method for Remote Sensing Images. ISPRS Int. J. Geo-Inf. 2019, 8, 543. [Google Scholar] [CrossRef]
- Kucharczyk, M.; Hay, G.J.; Ghaffarian, S.; Hugenholtz, C.H. Geographic Object-Based Image Analysis: A Primer and Future Directions. Remote Sens. 2020, 12, 2012. [Google Scholar] [CrossRef]
- Hamedianfar, A.; Shafri, H.Z.M.; Mansor, S.; Ahmad, N. Improving detailed rule-based feature extraction of urban areas from WorldView-2 image and lidar data. Int. J. Remote Sens. 2014, 35, 1876–1899. [Google Scholar] [CrossRef]
- Khatriker, S.; Kumar, M. Building Footprint Extraction from High Resolution Satellite Imagery Using Segmentation. Int. Arch. Photogramm. Remote Sens. Spat. Inf. Sci. 2018, 5, 123–128. [Google Scholar] [CrossRef]
- Kavzoglu, T.; Tonbul, H. A comparative study of segmentation quality for multi-resolution segmentation and watershed transform. In Proceedings of the 2017 8th International Conference on Recent Advances in Space Technologies (RAST), Istanbul, Turkey, 19–22 June 2017; IEEE: Piscataway, NJ, USA, 2017; pp. 113–117. [Google Scholar]
- Yang, J.; He, Y.; Weng, Q. An Automated Method to Parameterize Segmentation Scale by Enhancing Intrasegment Homogeneity and Intersegment Heterogeneity. IEEE Geosci. Remote Sens. Lett. 2015, 12, 1282–1286. [Google Scholar] [CrossRef]
- Cheng, J.; Li, L.; Luo, B.; Wang, S.; Liu, H. High-resolution remote sensing image segmentation based on improved RIU-LBP and SRM. Eurasip. J. Wirel. Commun. Netw. 2013, 2013, 263. [Google Scholar] [CrossRef]
- Zhou, Y.; Li, J.; Feng, L.; Zhang, X.; Hu, X. Adaptive Scale Selection for Multiscale Segmentation of Satellite Images. IEEE J. Sel. Top. Appl. Earth Observ. Remote Sens. 2017, 10, 3641–3651. [Google Scholar] [CrossRef]
- Hu, Z.; Zhang, Q.; Zou, Q.; Li, Q.; Wu, G. Stepwise Evolution Analysis of the Region-Merging Segmentation for Scale Parameterization. IEEE J. Sel. Top. Appl. Earth Observ. Remote Sens. 2018, 11, 2461–2472. [Google Scholar] [CrossRef]
- Wang, Y.; Meng, Q.; Qi, Q.; Yang, J.; Liu, Y. Region Merging Considering Within- and Between-Segment Heterogeneity: An Improved Hybrid Remote-Sensing Image Segmentation Method. Remote Sens. 2018, 10, 781. [Google Scholar] [CrossRef]
- Gu, H.; Han, Y.; Yang, Y.; Li, H.; Liu, Z.; Soergel, U.; Blaschke, T.; Cui, S. An Efficient Parallel Multi-Scale Segmentation Method for Remote Sensing Imagery. Remote Sens. 2018, 10, 590. [Google Scholar] [CrossRef]
- Jahjah, M.; Ulivieri, C. Automatic archaeological feature extraction from satellite VHR images. Acta Astronaut. 2010, 66, 1302–1310. [Google Scholar] [CrossRef]
- Musleh, A.A.; Jaber, H.S. Comparative Analysis of Feature Extraction and Pixel-based Classification of High-Resolution Satellite Images Using Geospatial Techniques. E3S Web Conf. 2021, 318, 4007. [Google Scholar] [CrossRef]
- Salas, E.; Boykin, K.; Valdez, R. Multispectral and Texture Feature Application in Image-Object Analysis of Summer Vegetation in Eastern Tajikistan Pamirs. Remote Sens. 2016, 8, 78. [Google Scholar] [CrossRef]
- Lai, X.; Yang, J.; Li, Y.; Wang, M. A Building Extraction Approach Based on the Fusion of LiDAR Point Cloud and Elevation Map Texture Features. Remote Sens. 2019, 11, 1636. [Google Scholar] [CrossRef]
- Ruiz, L.A.; Recio, J.A.; Fernández-Sarría, A.; Hermosilla, T. A feature extraction software tool for agricultural object-based image analysis. Comput. Electron. Agric. 2011, 76, 284–296. [Google Scholar] [CrossRef]
- Domínguez-Beisiegel, M.; Castañeda, C.; Mougenot, B.; Herrero, J. Analysis and Mapping of the Spectral Characteristics of Fractional Green Cover in Saline Wetlands (NE Spain) Using Field and Remote Sensing Data. Remote Sens. 2016, 8, 590. [Google Scholar] [CrossRef]
- Salleh, S.A.; Khalid, N.; Danny, N.; Zaki, N.A.M.; Ustuner, M.; Latif, Z.A.; Foronda, V. Support Vector Machine (SVM) and Object Based Classification in Earth Linear Features Extraction: A Comparison. Rev. Int. De Géomatique 2024, 33, 183–199. [Google Scholar] [CrossRef]
- Lv, Z.; Zhang, P.; Atli Benediktsson, J. Automatic Object-Oriented, Spectral-Spatial Feature Extraction Driven by Tobler’s First Law of Geography for Very High Resolution Aerial Imagery Classification. Remote Sens. 2017, 9, 285. [Google Scholar] [CrossRef]
- Li, W.; Li, Y.; Gong, J.; Feng, Q.; Zhou, J.; Sun, J.; Shi, C.; Hu, W. Urban Water Extraction with UAV High-Resolution Remote Sensing Data Based on an Improved U-Net Model. Remote Sens. 2021, 13, 3165. [Google Scholar] [CrossRef]
- Feng, Q.; Liu, J.; Gong, J. UAV Remote Sensing for Urban Vegetation Mapping Using Random Forest and Texture Analysis. Remote Sens. 2015, 7, 1074–1094. [Google Scholar] [CrossRef]
- Xie, H.; Tong, X.; Heipke, C.; Lohmann, P.; Sorgel, U. Object-based binary encoding algorithm -an integration of hyperspectral data and DSM. In Proceedings of the 2009 Joint Urban Remote Sensing Event, Shanghai, China, 20–22 May 2009; IEEE: Piscataway, NJ, USA, 2009; pp. 1–6. [Google Scholar]
- Peng, K.; Jiang, W.; Hou, P.; Wu, Z.; Cui, T. Detailed wetland-type classification using Landsat-8 time-series images: A pixel- and object-based algorithm with knowledge (POK). Gisci. Remote Sens. 2024, 61, 2293525. [Google Scholar] [CrossRef]
- De Angeli, S.; Serpetti, M.; Battistin, F. A Newly Developed Tool for the Post-Processing of GPR Time-Slices in A GIS Environment. Remote Sens. 2022, 14, 3459. [Google Scholar] [CrossRef]
- Ezeomedo, I.C.A.J. Mapping of Urban Features of Nnewi Metropolis Using High Resolution Satellite Image and Support Vector Machine Classifier. J. Environ. Earth Sci. 2019, 9, 116–130. [Google Scholar]
- MohanRajan, S.N.; Loganathan, A.; Manoharan, P. Survey on Land Use/Land Cover (LU/LC) change analysis in remote sensing and GIS environment: Techniques and Challenges. Environ. Sci. Pollut. Res. 2020, 27, 29900–29926. [Google Scholar] [CrossRef] [PubMed]
- Benz, U.C.; Hofmann, P.; Willhauck, G.; Lingenfelder, I.; Heynen, M. Multi-resolution, object-oriented fuzzy analysis of remote sensing data for GIS-ready information. ISPRS-J. Photogramm. Remote Sens. 2004, 58, 239–258. [Google Scholar] [CrossRef]
- Fetai, B.; Oštir, K.; Fras, M.K.; Lisec, A. Extraction of Visible Boundaries for Cadastral Mapping Based on UAV Imagery. Remote Sens. 2019, 11, 1510. [Google Scholar] [CrossRef]
- Zhao, X.; Jing, L.; Zhang, G.; Zhu, Z.; Liu, H.; Ren, S. Object-Oriented Convolutional Neural Network for Forest Stand Classification Based on Multi-Source Data Collaboration. Forests 2024, 15, 529. [Google Scholar] [CrossRef]
- Xue, Y.; Qin, C.; Wu, B.; Li, D.; Fu, X. Automatic Extraction of Mountain River Surface and Width Based on Multisource High-Resolution Satellite Images. Remote Sens. 2022, 14, 2370. [Google Scholar] [CrossRef]
- Kotluri, S.K.; Pandey, P.; Pandey, A.K. A Google Earth and ArcGIS-based protocol for channel width extraction. J. Earth Syst. Sci. 2024, 133, 9. [Google Scholar] [CrossRef]
- Zhou, T.; Sun, C.; Fu, H. Road Information Extraction from High-Resolution Remote Sensing Images Based on Road Reconstruction. Remote Sens. 2019, 11, 79. [Google Scholar] [CrossRef]
- Zhang, Z.; Han, Y.; Chen, J.; Wang, S.; Wang, G.; Du, N. Information extraction of ecological canal system based on remote sensing data of unmanned aerial vehicle. J. Drain. Irrig. Mach. Eng. 2018, 36, 1006–1011. [Google Scholar]
Disclaimer/Publisher’s Note: The statements, opinions and data contained in all publications are solely those of the individual author(s) and contributor(s) and not of MDPI and/or the editor(s). MDPI and/or the editor(s) disclaim responsibility for any injury to people or property resulting from any ideas, methods, instructions or products referred to in the content. |
© 2024 by the authors. Licensee MDPI, Basel, Switzerland. This article is an open access article distributed under the terms and conditions of the Creative Commons Attribution (CC BY) license (https://creativecommons.org/licenses/by/4.0/).