Article

Development of Elite Mother Palms from the Best-Performing Slow-Vertical-Growth Oil Palm (Elaeis guineensis Jacq.) Genotypes

by
Anitha Pedapati
1,*,
Kancherla Suresh
1,
Ravi Kumar Mathur
2,
Govindan Ravichandran
1,
Prathapani Naveen Kumar
3,
Hosahalli Parvathappa Bhagya
4,
Banisetti Kalyana Babu
1 and
Kariyappa Sankar Narayana
1
1
Indian Institute of Oil Palm Research (IIOPR), Indian Council of Agricultural Research (ICAR), Pedavegi 534450, India
2
Indian Institute of Oilseeds Research (ICAR), Indian Council of Agricultural Research (ICAR), Hyderabad 500030, India
3
Indian Institute of Horticultural Research (IIHR), Indian Council of Agricultural Research (ICAR), Bengaluru 560089, India
4
Directorate of Cashew Research (ICAR), Indian Council of Agricultural Research (ICAR), Puttur, Karnataka 574202, India
*
Author to whom correspondence should be addressed.
Agriculture 2024, 14(11), 2007; https://doi.org/10.3390/agriculture14112007
Submission received: 10 September 2024 / Revised: 19 October 2024 / Accepted: 24 October 2024 / Published: 8 November 2024
(This article belongs to the Section Crop Genetics, Genomics and Breeding)

Abstract

:
Harvesting is a serious issue in oil palm plantations after 15–20 years owing to the increased height of the trees (>9 m). The slow vertical growth of the oil palm dura genotypes is desired for increasing the D × P progenies’ productivity and economic life span upto ten years. A reduced height increment has a long-term impact on harvesting costs. The current study assessed 308 genotypes generated from African germplasm. Over a three year period, the biometric properties of eleven D × D crosses were evaluated in order to quantify genetic parameters and phenotypic correlations, and principal component analysis was performed for genetic attributes of the better-performing dwarf progenies in terms of yield. The evaluated genotypes have a highly significant influence (p < 0.01) on the majority of characteristics. The progenies yielded between 165 and 208 kg of fresh fruit bunches (FFBs) per palm every year. The height increment (HI) varied between 17% and 19%, with an overall average of 18%. Genotypes G8, G300, and G221 had the lowest yearly height increments, measuring 28.98, 29.19, and 30.87 cm, respectively. The outcome of the present study shows that they are slow-height-increment genotypes with a high FFB yield (>25 T/Ha). The creation of dura parents with a slow height increment in combination with a high bunch weight helps for prolonging the productive life of the palm to more than 35 years, adding value to obtain distinct oil palm varieties. Overall, this targeted breeding effort towards developing dwarf oil palm hybrids reflects a strategic approach to addressing specific challenges in oil palm cultivation, ultimately helping to promote the oil palm sector globally.

1. Introduction

The oil palm (Elaeis guineensis Jacq.), popularly known as the golden palm, is one of the most economically important and largest vegetable-oil-yielding perennial crops (4–6 t oil/ha/year); one acre of oil palm plantations may yield up to 10 times more oil than other major oilseed crops. Indonesia stands as the dominant player, contributing a massive 59% of the global production, translating to 47 million metric tons. Following Indonesia, Malaysia holds a substantial 24% share, with 19 million metric tons. India ranks 13th in palm oil production, with 305,000 Metric Tons, 0.4% of global production [1]. Thailand, Colombia, and Nigeria also contribute notable shares, with 4%, 2%, and 2%, respectively. Other oil palm growing countries make up the remaining percentage, each contributing between 0.74% and 1% of the global production. This distribution highlights the concentration of palm oil production in Southeast Asia, particularly in Indonesia and Malaysia, which together account for over 80% of the world’s palm oil production. The data provide a clear picture of the key players in the palm oil market and their respective contributions. There is a significant disparity between the actual and potential use of oil palm germplasm [2].
The enhancement of oil palm crops through the extensive use of a limited number of closely related parents may lead to a restricted genetic base and inbreeding depression. To address this issue, oil palm breeders have identified genetically diverse, trait-specific germplasm lines through the study and characterization of existing oil palm germplasm. The primary goal for oil palm breeders is to create high-yielding cultivars with a broad genetic foundation [3]. The most crucial characteristic for oil palm production is oil yield, making its optimization the main objective in enhancing trait-specific oil palm varieties [4]. One of the biggest challenges in any hybridization program is finding the optimal pairing of two (or more) parental genotypes to maximize variance within related breeding populations. This maximizes the likelihood of identifying superior transgressive segregants in the segregating populations. The most difficult task for plant breeders in every hybridization attempt is figuring out how to blend multiple parental genotypes effectively to maximize diversity within related breeding populations. While D × D oil palm genotypes are not ideal for direct commercial oil production, they play a crucial role in breeding programs. By assessing and selecting for key traits such as mesocarp content, fruit size, disease resistance, and growth vigor, breeders can develop promising lines that contribute to the production of high-yield tenera palms. The integration of traditional breeding techniques with modern technologies like MAS will further enhance the efficiency and effectiveness of these programs, ultimately leading to more productive and sustainable oil palm cultivars [5,6].
The Genetic Coefficient of Variation (GCV) indicates the proportion of variability in traits due to genetic differences among genotypes. The Phenotypic Coefficient of Variation (PCV) includes both genetic and environmental contributions to trait variability [7]. Higher GCV values suggest that there is significant genetic variation for that trait, which could be exploited in breeding programs. Selecting progenies based on one or more descriptors can cause unwanted modifications in others due to negative correlations between them [8]. To address this issue, principal component analysis (PCA) is utilized as a multivariate method to discover and identify the independent descriptors that influence plant traits [9].
To address the harvesting issue, we must develop a dwarf or low-height-increment genotype. Reduced height increments have a long-term impact on harvesting costs [10,11]. The oil palm sector prioritizes height reduction due to the high expense of harvesting tall palms [12]. Identifying dwarf palms with commercial significance is challenging, with few known instances globally. Harvesting is a serious issue in elderly oil palm estates; hence, the creation of dwarf palms is extremely beneficial to farmers.

2. Materials and Methods

2.1. Experimental Area Description

During the growing season, a field experiment was undertaken at the ICAR-Indian Institute of Oil Palm Research, Pedavegi, Eluru district, Andhra Pradesh, India. The location is located at around 16°48′ N latitude and 81°12′ E longitude. The location receives an average annual rainfall of around 785.6 mm, has an average temperature range of 28 °C to 36 °C, and is primarily red sandy loam soil (Figure 1).

2.2. Oil Palm Genotypes

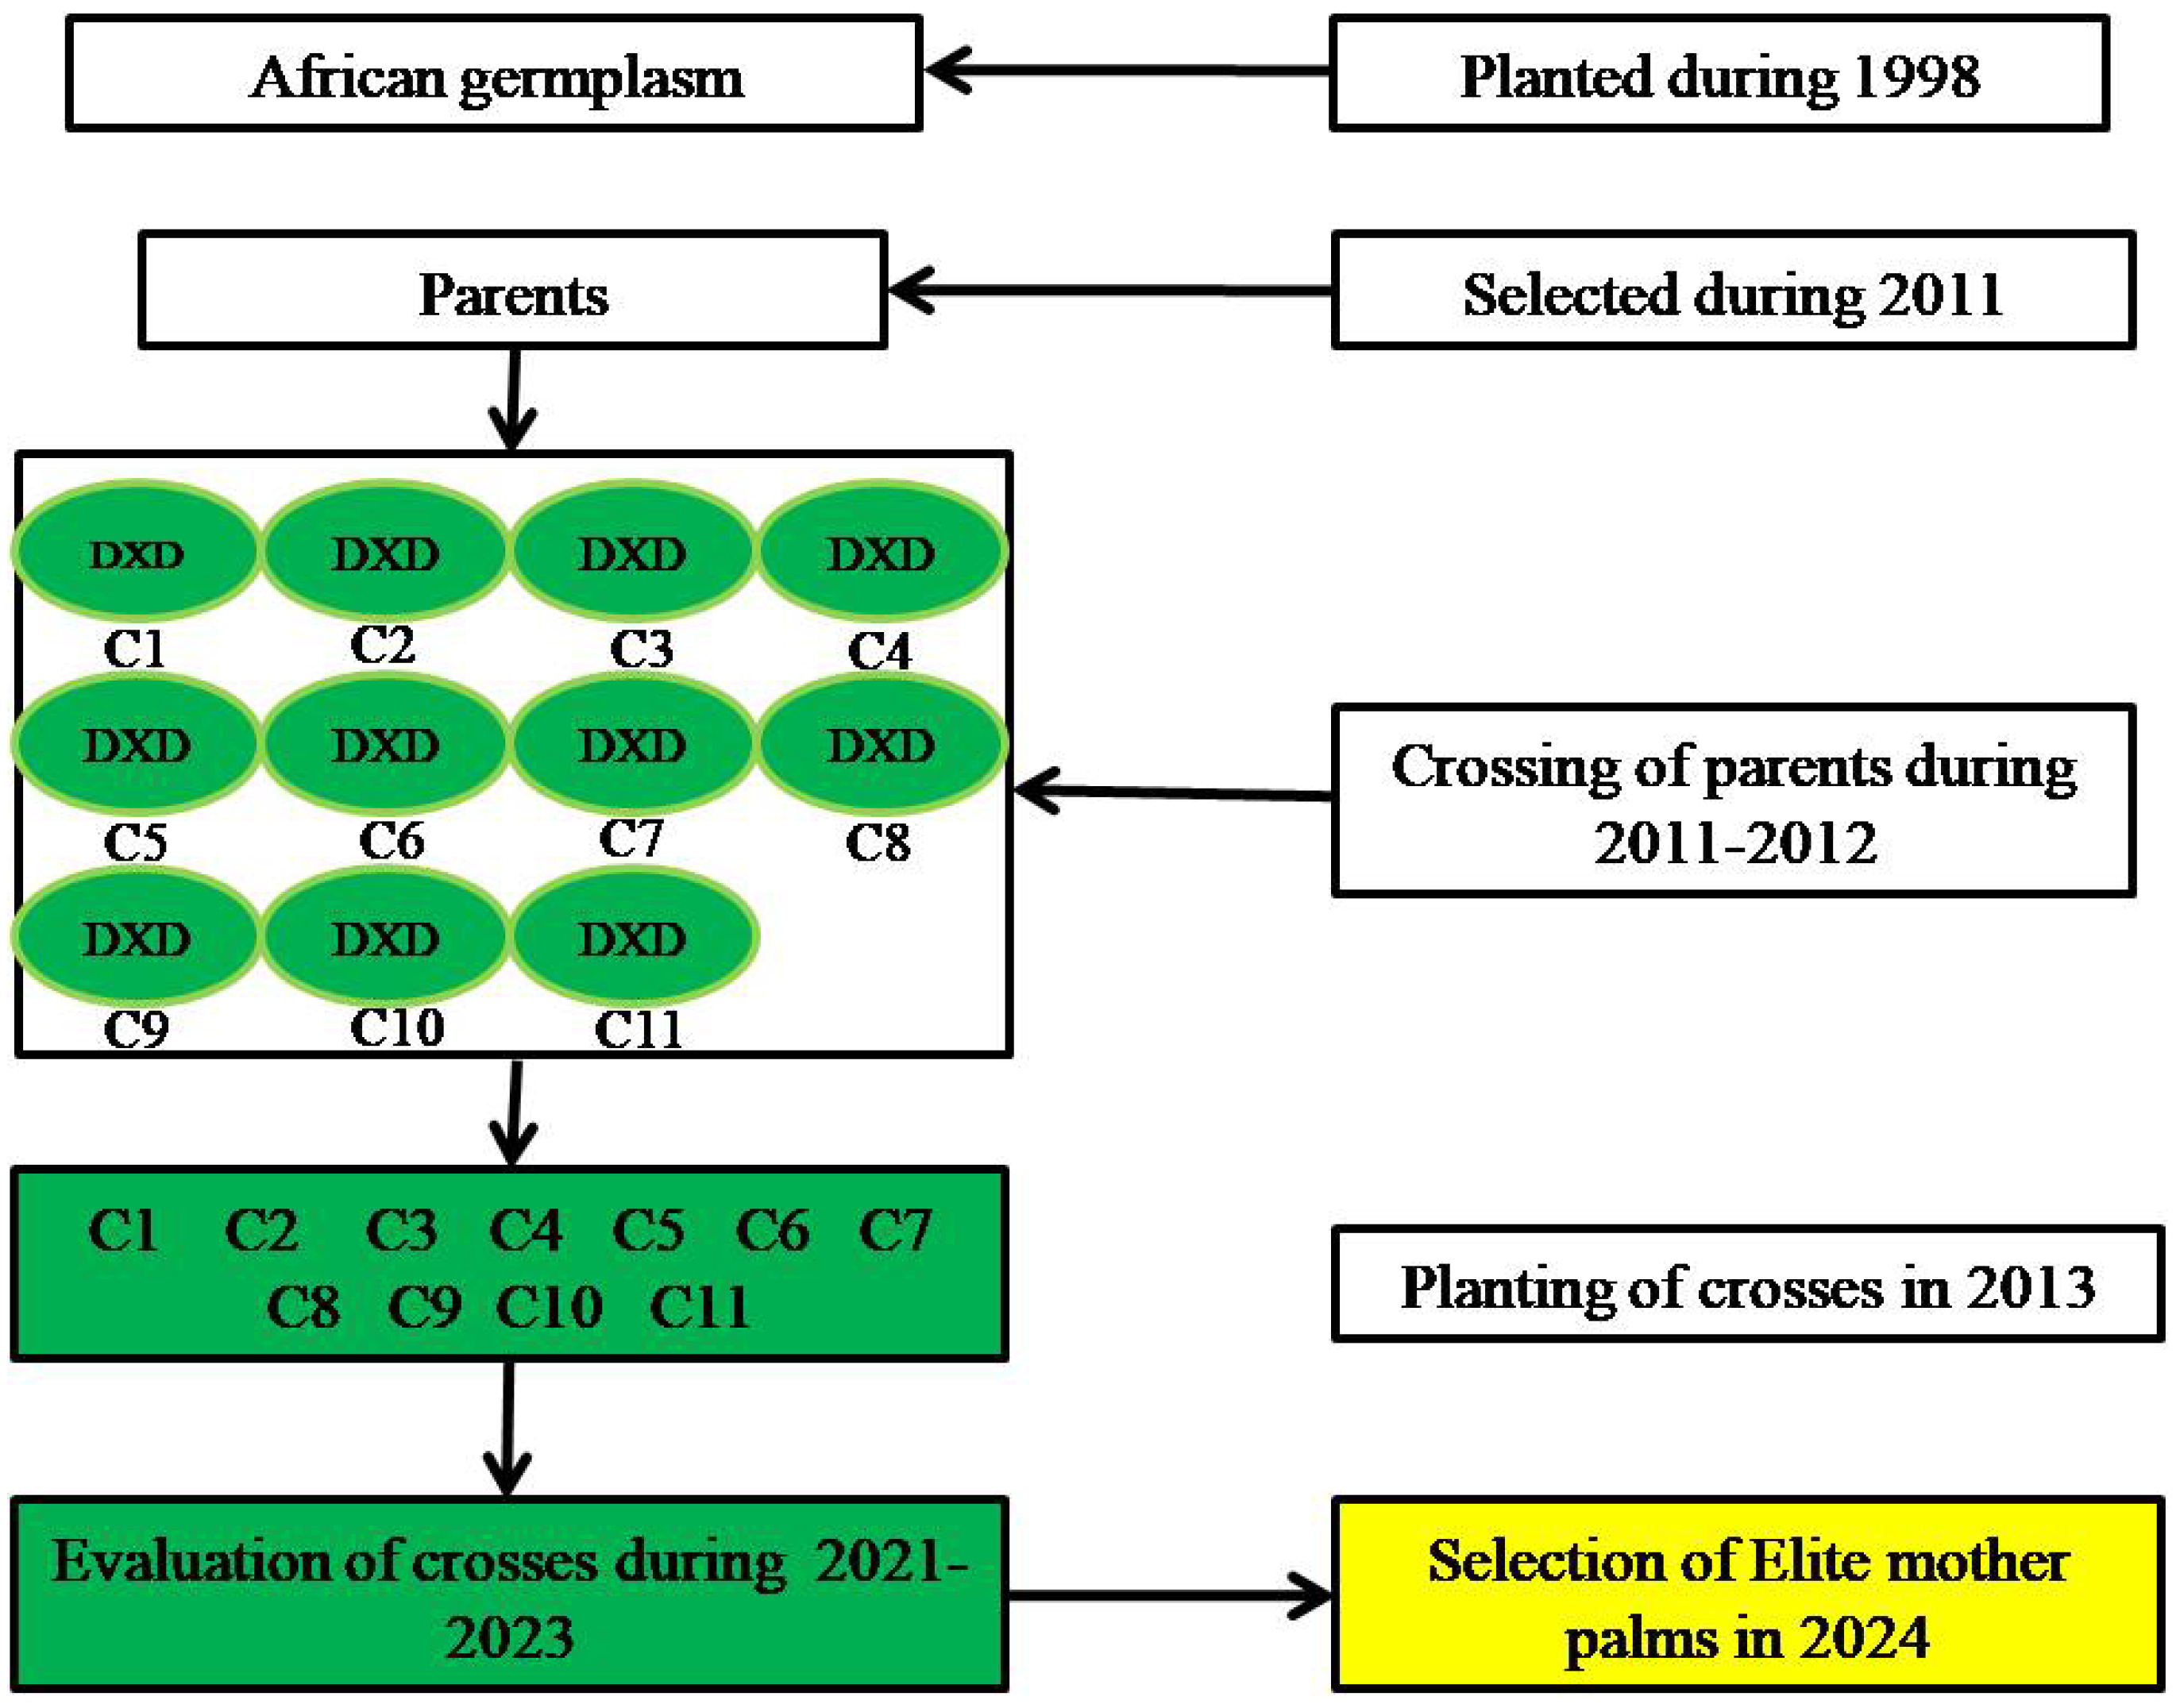
In this investigation, 308 oil palm genotypes planted during 2013 were utilized for the development of dwarf dura breeding lines. This collection of oil palm genotypes resulted from eleven crosses made between promising selected African germplasm (Zambia and Tanzania) planted in 1998 (Figure 2). Eleven crosses, each with four replicates, made up nine palms in a randomized complete block design (Table 1). As a result, these genotypes were chosen as a benchmark for evaluating new genotypes. The experimental data were drawn (average of three years) together from 2021 to 2023.

2.3. Biometric Observations

The following nine traits were assessed in the present study: bunch index (BI, %), bunch number (BN), bunch weight (BW, kg/palm/year), girth (GT, cm), height (HT, cm), height increment (HI, cm), leaf area (LA, sqm), sex ratio (SR), and total dry matter (TDM, kg). Every harvest, the number of fruit bunches produced was recorded for each individual palm to note the FFB (fresh fruit bunch) yield. During the busiest time of year, harvesting often occurs twice a month; otherwise, it happens just once. It is given annually as the quantity of bunches per palm, which we considered usually by noting the FFB yield. The total weight of all harvested bunches is indicated in kilograms per palm per year (kg/palm/year) and every harvest weight of harvested FFB was recorded in kg throughout the year. For measuring the height of the palm, we used a long, specifically marked wooden stick and measured the height of the adult palm from ground level to the 41st leaf base using a measuring tape. Every year, the height of the palm was measured in centimeters (cm). The girth of the adult palm was measured using a measuring tape at a height of 50 cm above the ground. The palm’s circumference was measured in centimeters. The performance of an individual oil palm can be known by calculating using standard formulas and elite palms can be identified for further research programs. The height increment (HI) in cm for an adult palm = height/(age of the palm-2), sex ratio (SR) = Female/(male + female + hermaphrodite), bunch dry weight = 0.5275 × FFB (kg/palm/year); bunch index (BI) = bunch dry weight/total dry matter in kg; and leaf area(LA) of adult palm in Sqm = 0.57 × NLL × LLL × LLW/100/100 [13]. The most promising genomic selection indices were those that correlated with deviations from the shared regression of the relevant characteristics. These indices were especially effective for managing the observed strong negative phenotypic and genomic correlations [14]. The aim was to maximize protein yield, either through elevated grain yield or increased protein content, while maintaining the population average for the other respective trait.

2.4. Data Analysis

To assess the performance of the evaluated genotypes, analysis of variance averages were compared using the HSD test (honestly significant difference) or Tukey’s test. Recurrent reciprocal selection (R.R.S.) allowed oil palm populations to thrive throughout several mating cycles, resulting in a higher frequency of favorable alleles linked with desirable characteristics by using graphic pad 10.3.1 version software and OPSTAT.

3. Results

The comparison of means using the Tukey test showed that the genotypes’ mean performances for BI, BN, and BW were 0.24%, 7.49 No., and 105.95 Kg/palm/year, respectively. Meanwhile, for GT, HI, HT, LA, SR, and TDM, the mean performances were 271.96, 32.99, 252.37, 7.22, 0.52, and 226.08% (Table 2 and Table 3). It is common to observe a negative correlation between bunch quantity and average bunch weight.
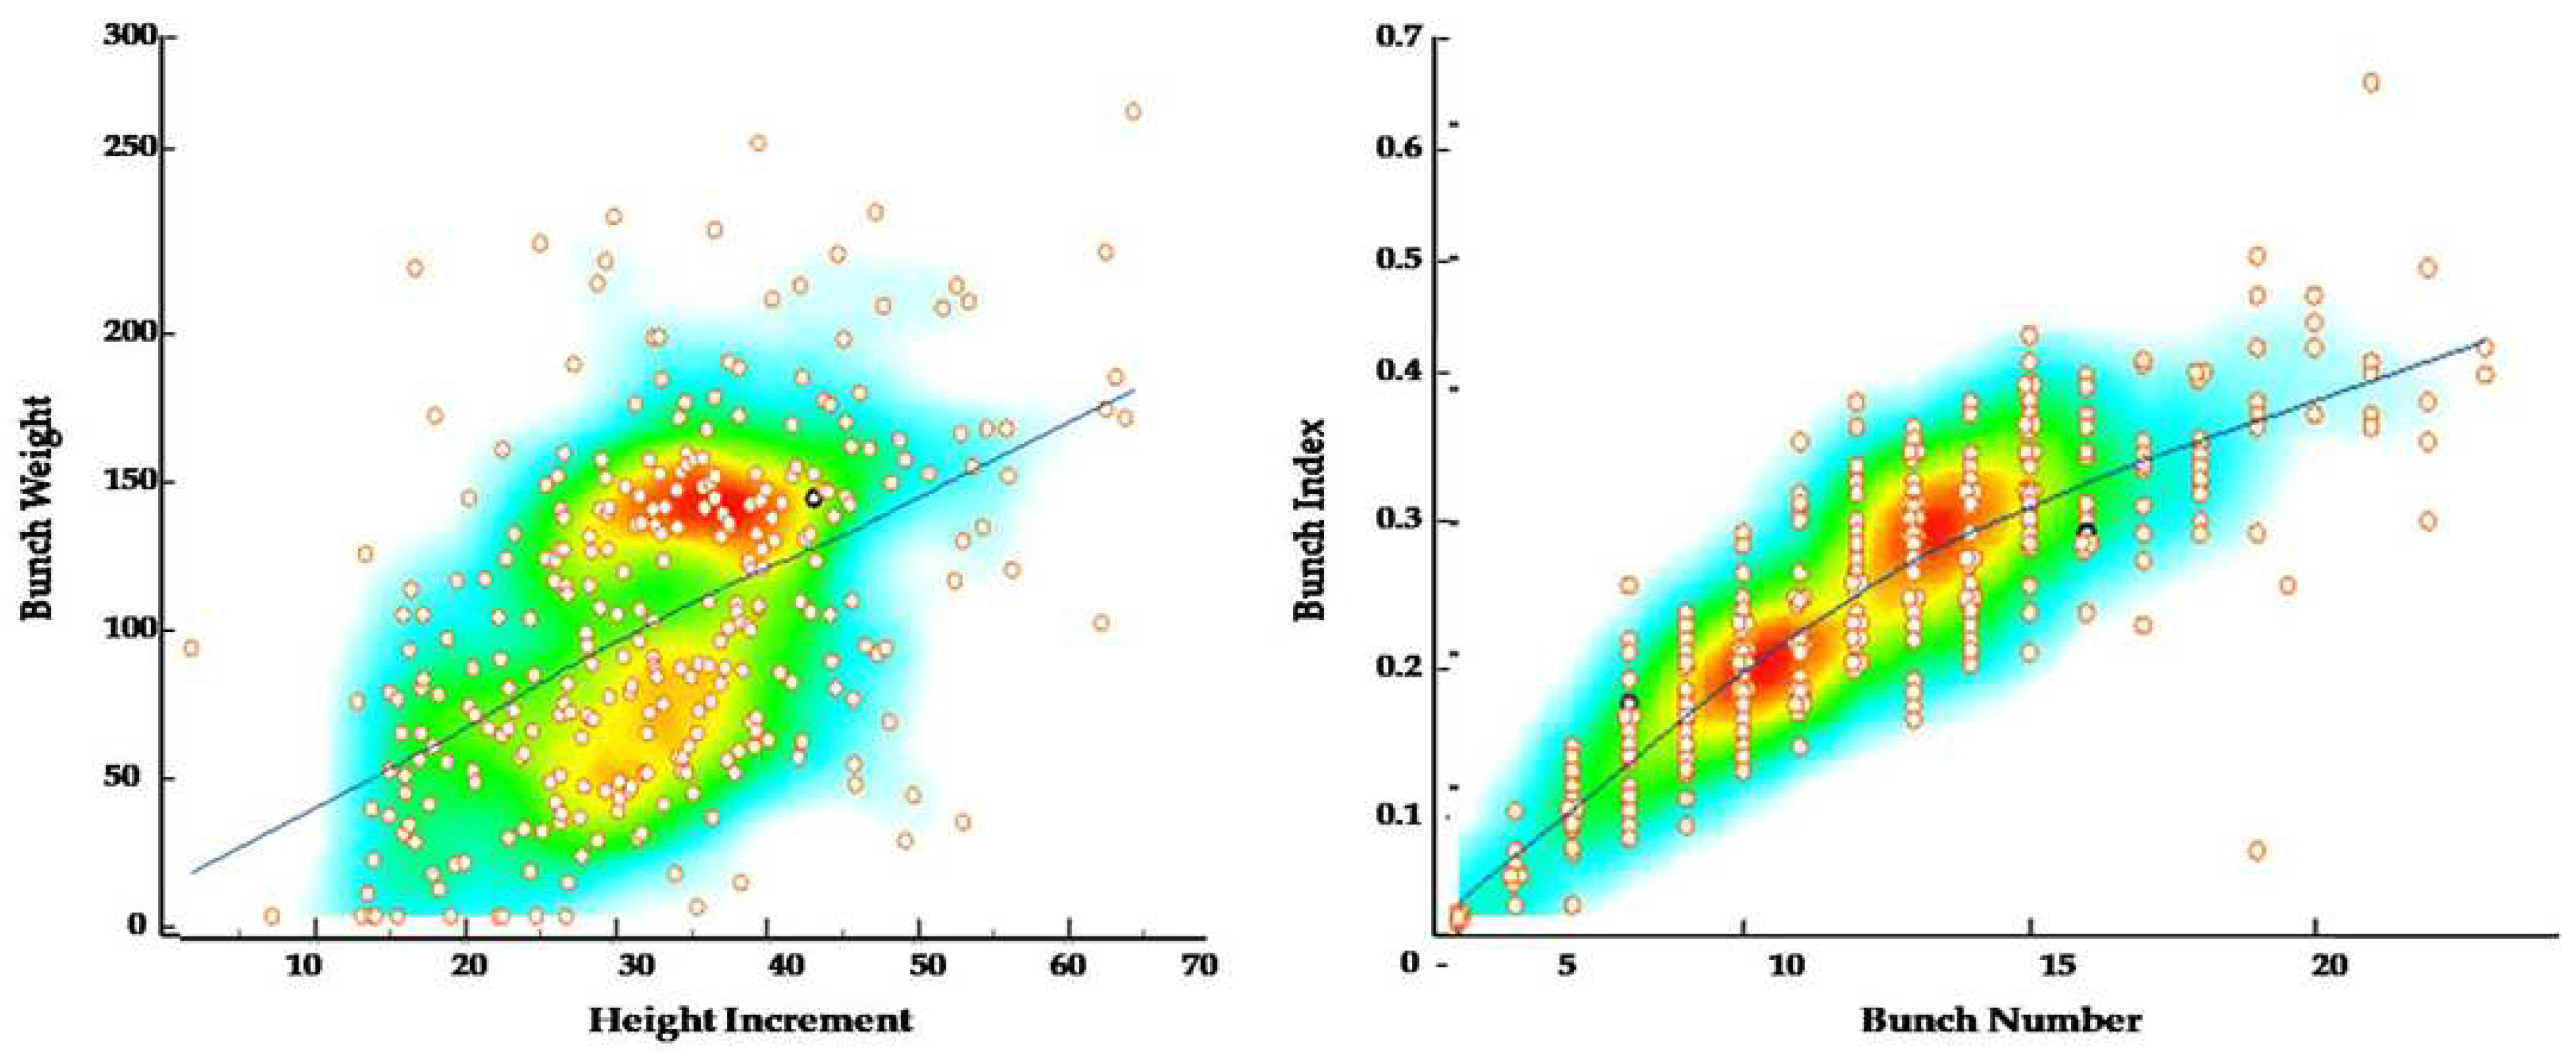
Descriptive statistics were generated from preliminary data analysis to describe the 308 oil palm dura genotypes for each attribute in this study. The range of variation and the potential for selection of the genotypes were determined by estimating the mean, maximum, and lowest values of these important traits [15]. In order to confirm the genotype variability of each trait relative to the mean, the Coefficient of Variation (CV) was also computed. The lower the CV, the more homogenous the dataset for a particular trait. The x-axis represents bunch number and the y-axis represents bunch index (Figure 3).
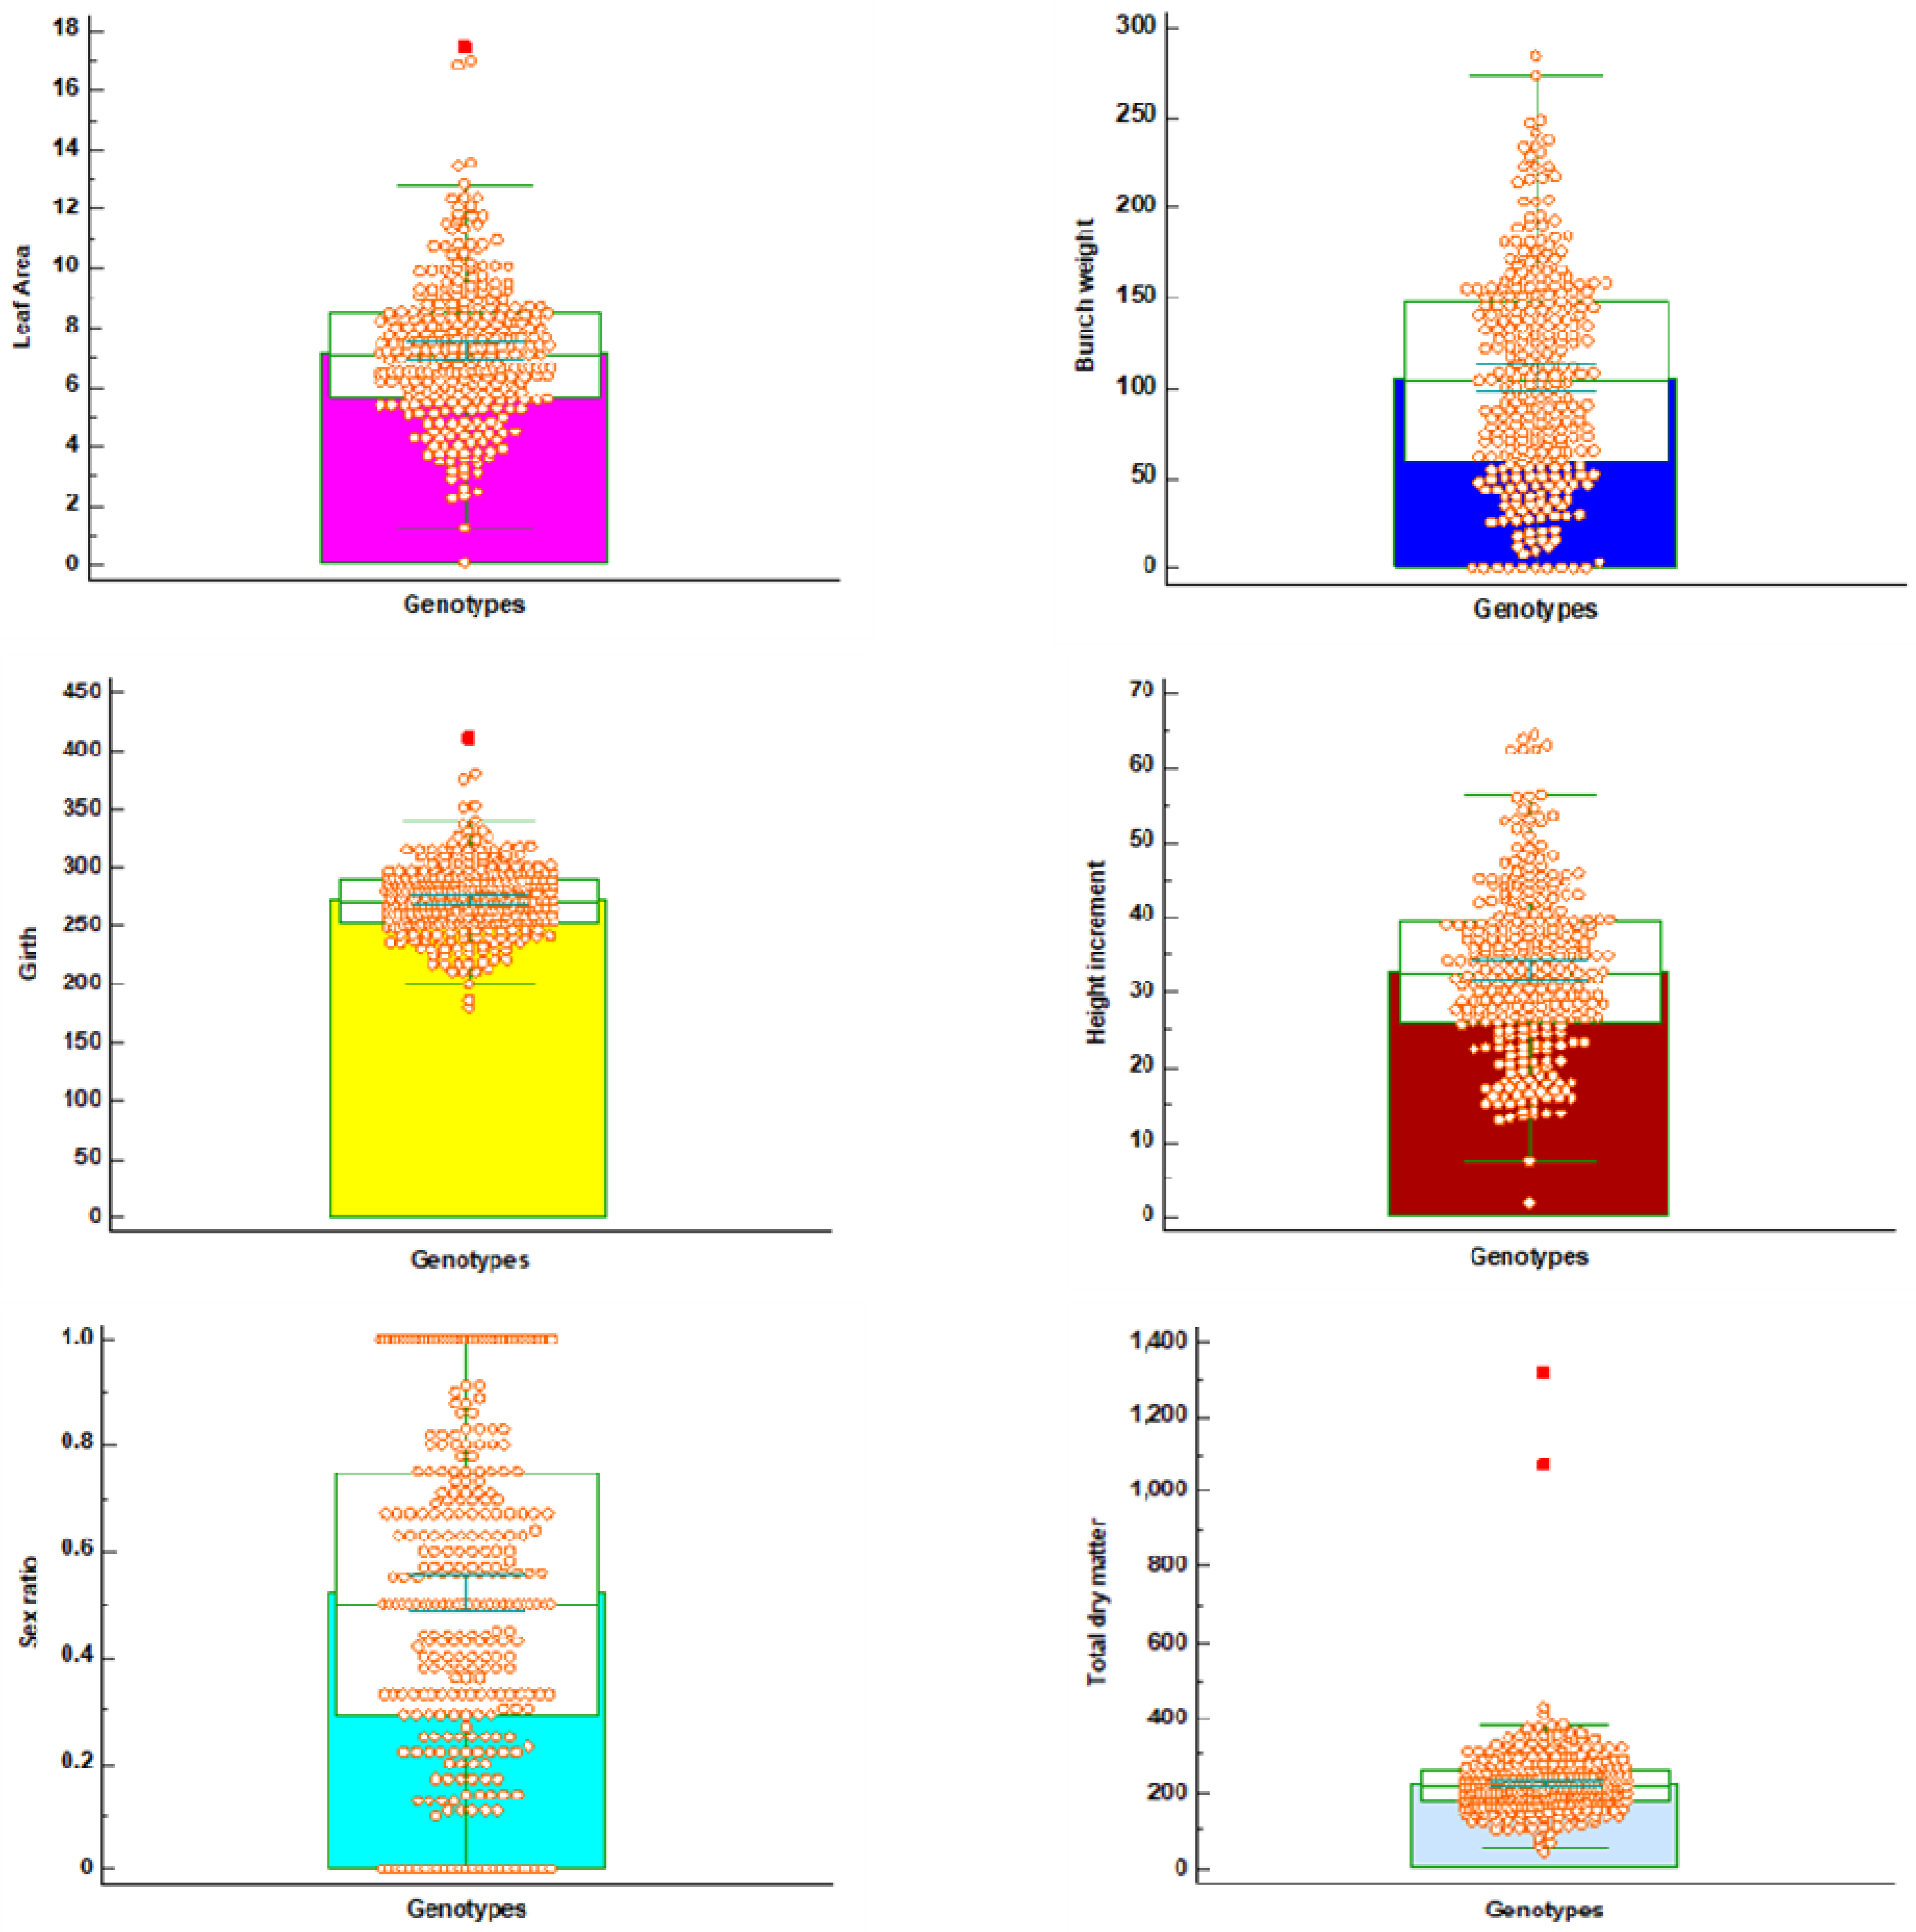
In Figure 1, individual data points are marked with orange circles. The background color represents the density of data points. Blue areas indicate lower density, green areas indicate moderate density, yellow areas indicate higher density, and red areas indicate the highest density of data points. A blue line indicates a linear regression fit, showing the overall trend in the data. The positive slope of the regression line suggests a positive correlation between “Bunch Number” and “Bunch Index”. As the bunch number increases, the bunch index also tends to increase. The highest density of data points (red and yellow areas) is concentrated around a certain range of bunch numbers (approximately 1 to 10) and bunch indices (approximately 0.1 to 0.4). There are fewer data points in the blue areas, indicating lower density. A few data points lie outside the main dense cluster, suggesting outliers with unusually high or low values for the given relationship. The scatter plot with the density heatmap and regression line provides a clear visualization of the relationship between bunch number and bunch index in the dataset. The positive correlation implies that as the bunch number increases, the bunch index also tends to increase. This information can be useful for understanding growth patterns and selecting traits for breeding programs [16]. Individual data points are marked with orange circles. The background color represents the density of data points. Blue areas indicate lower density, green areas indicate moderate density, yellow areas indicate higher density, and red areas indicate the highest density of data points. A linear regression fit, showing the overall trend in the data, is represented by the blue line. The positive slope of the regression line suggests a positive correlation between “Height Increment” and “Bunch Weight”. As the height increment increases, the bunch weight tends to increase as well. The highest density of data points (red and yellow areas) is concentrated around a certain range of height increments (approximately 20 to 50) and bunch weights (approximately 50 to 150). There are fewer data points in the blue areas, indicating lower density. A few data points lie outside the main dense cluster, suggesting outliers with unusually high or low values for the given relationship. The genotypes are scattered based on their values in different traits (Figure 4).
The high GCV (62.5%) and PCV (45.83%) of BI indicate significant genetic variability; this trait appears to have substantial genetic influence. The high GCV (66.9%) and PCV (52.47%) of BN suggest significant genetic variability and potential significance in genetic studies. The extremely high GCV (83.5%) and PCV (56.01%) of BW suggest that this trait has a high genetic influence and variability, indicating significance. The lower GCV (13.8%) and PCV (11.16%) of GT indicate less variability, suggesting this trait might be less influenced by genetic factors and more stable. The moderate GCV (40.9%) and PCV (33.59%) of HI indicate genetic influence and variability, which may be significant. The moderate to high GCV (43.4%) and PCV (33.00%) of HT suggest genetic influence and significance. The similar GCV (40%) and PCV (34.07%) of the LA values indicate genetic influence and potential significance. The high GCV (88.5%) and PCV (57.69%) of SR values suggest a significant genetic contribution, indicating importance in genetic studies.
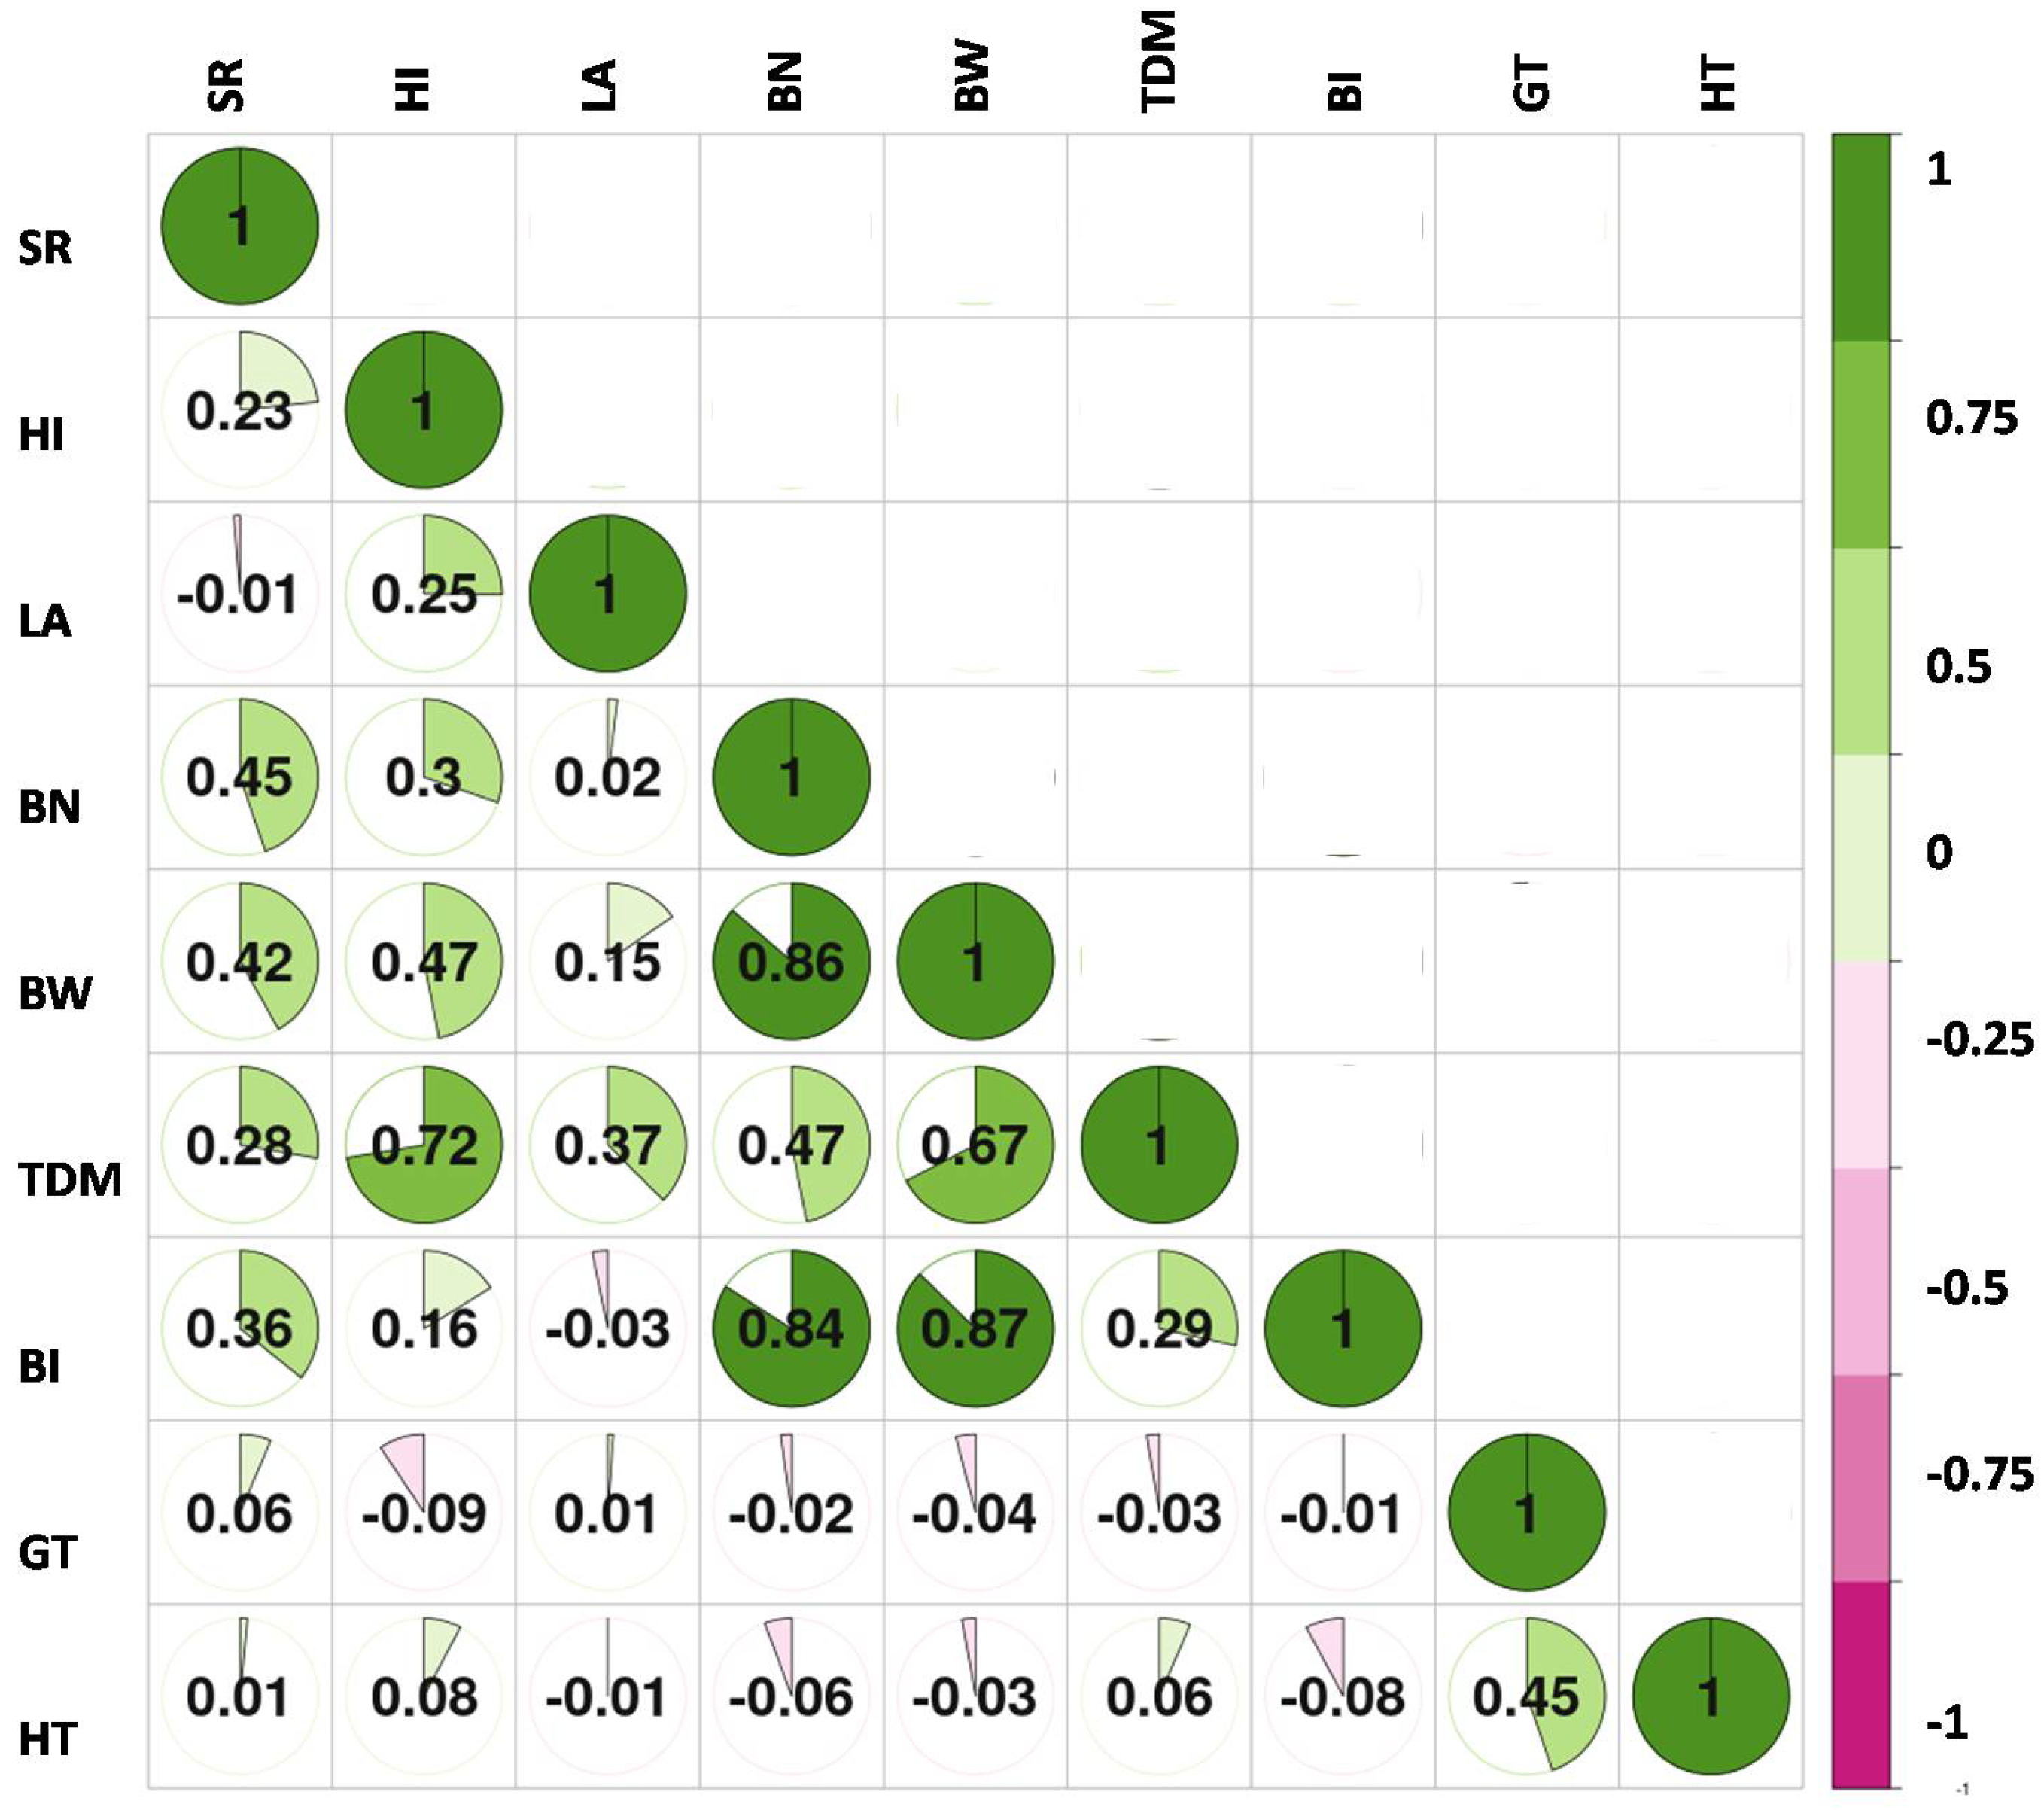
Simple correlations between oil palm yield and morphological parameters, when analyzed across 308 D × D genotypes, revealed both positive and negative correlations between the above-mentioned parameters (Figure 5).
The highlights were the positive and extremely significant (p ≤ 0.05) associations between the BI (0.87) and BW. Similarly, BW was emphatically profoundly critical (p ≤ 0.05) with SR (0.42), HI (0.47), LA (0.15), BN (0.86), and TDM (0.67); however, it was negatively significant with GT (−0.04) and HT (−0.03). Height increment (HI) had significant correlations with SR (0.23), LA (0.25), BN (0.30), BW (0.47), TDM (0.72), BI (0.16), and HT (0.08). There were positive and significant relationships between the BN and other important parameters such as SR (0.45), HI (0.30), LA (0.02), TDM (0.47), and BI (0.84), but not with GT (−0.02) and HT (−0.06). Furthermore, BI revealed an optimistic association with SR (0.36) and was highly significant (p ≤ 0.01) with BN (0.84) and BW (0.87).
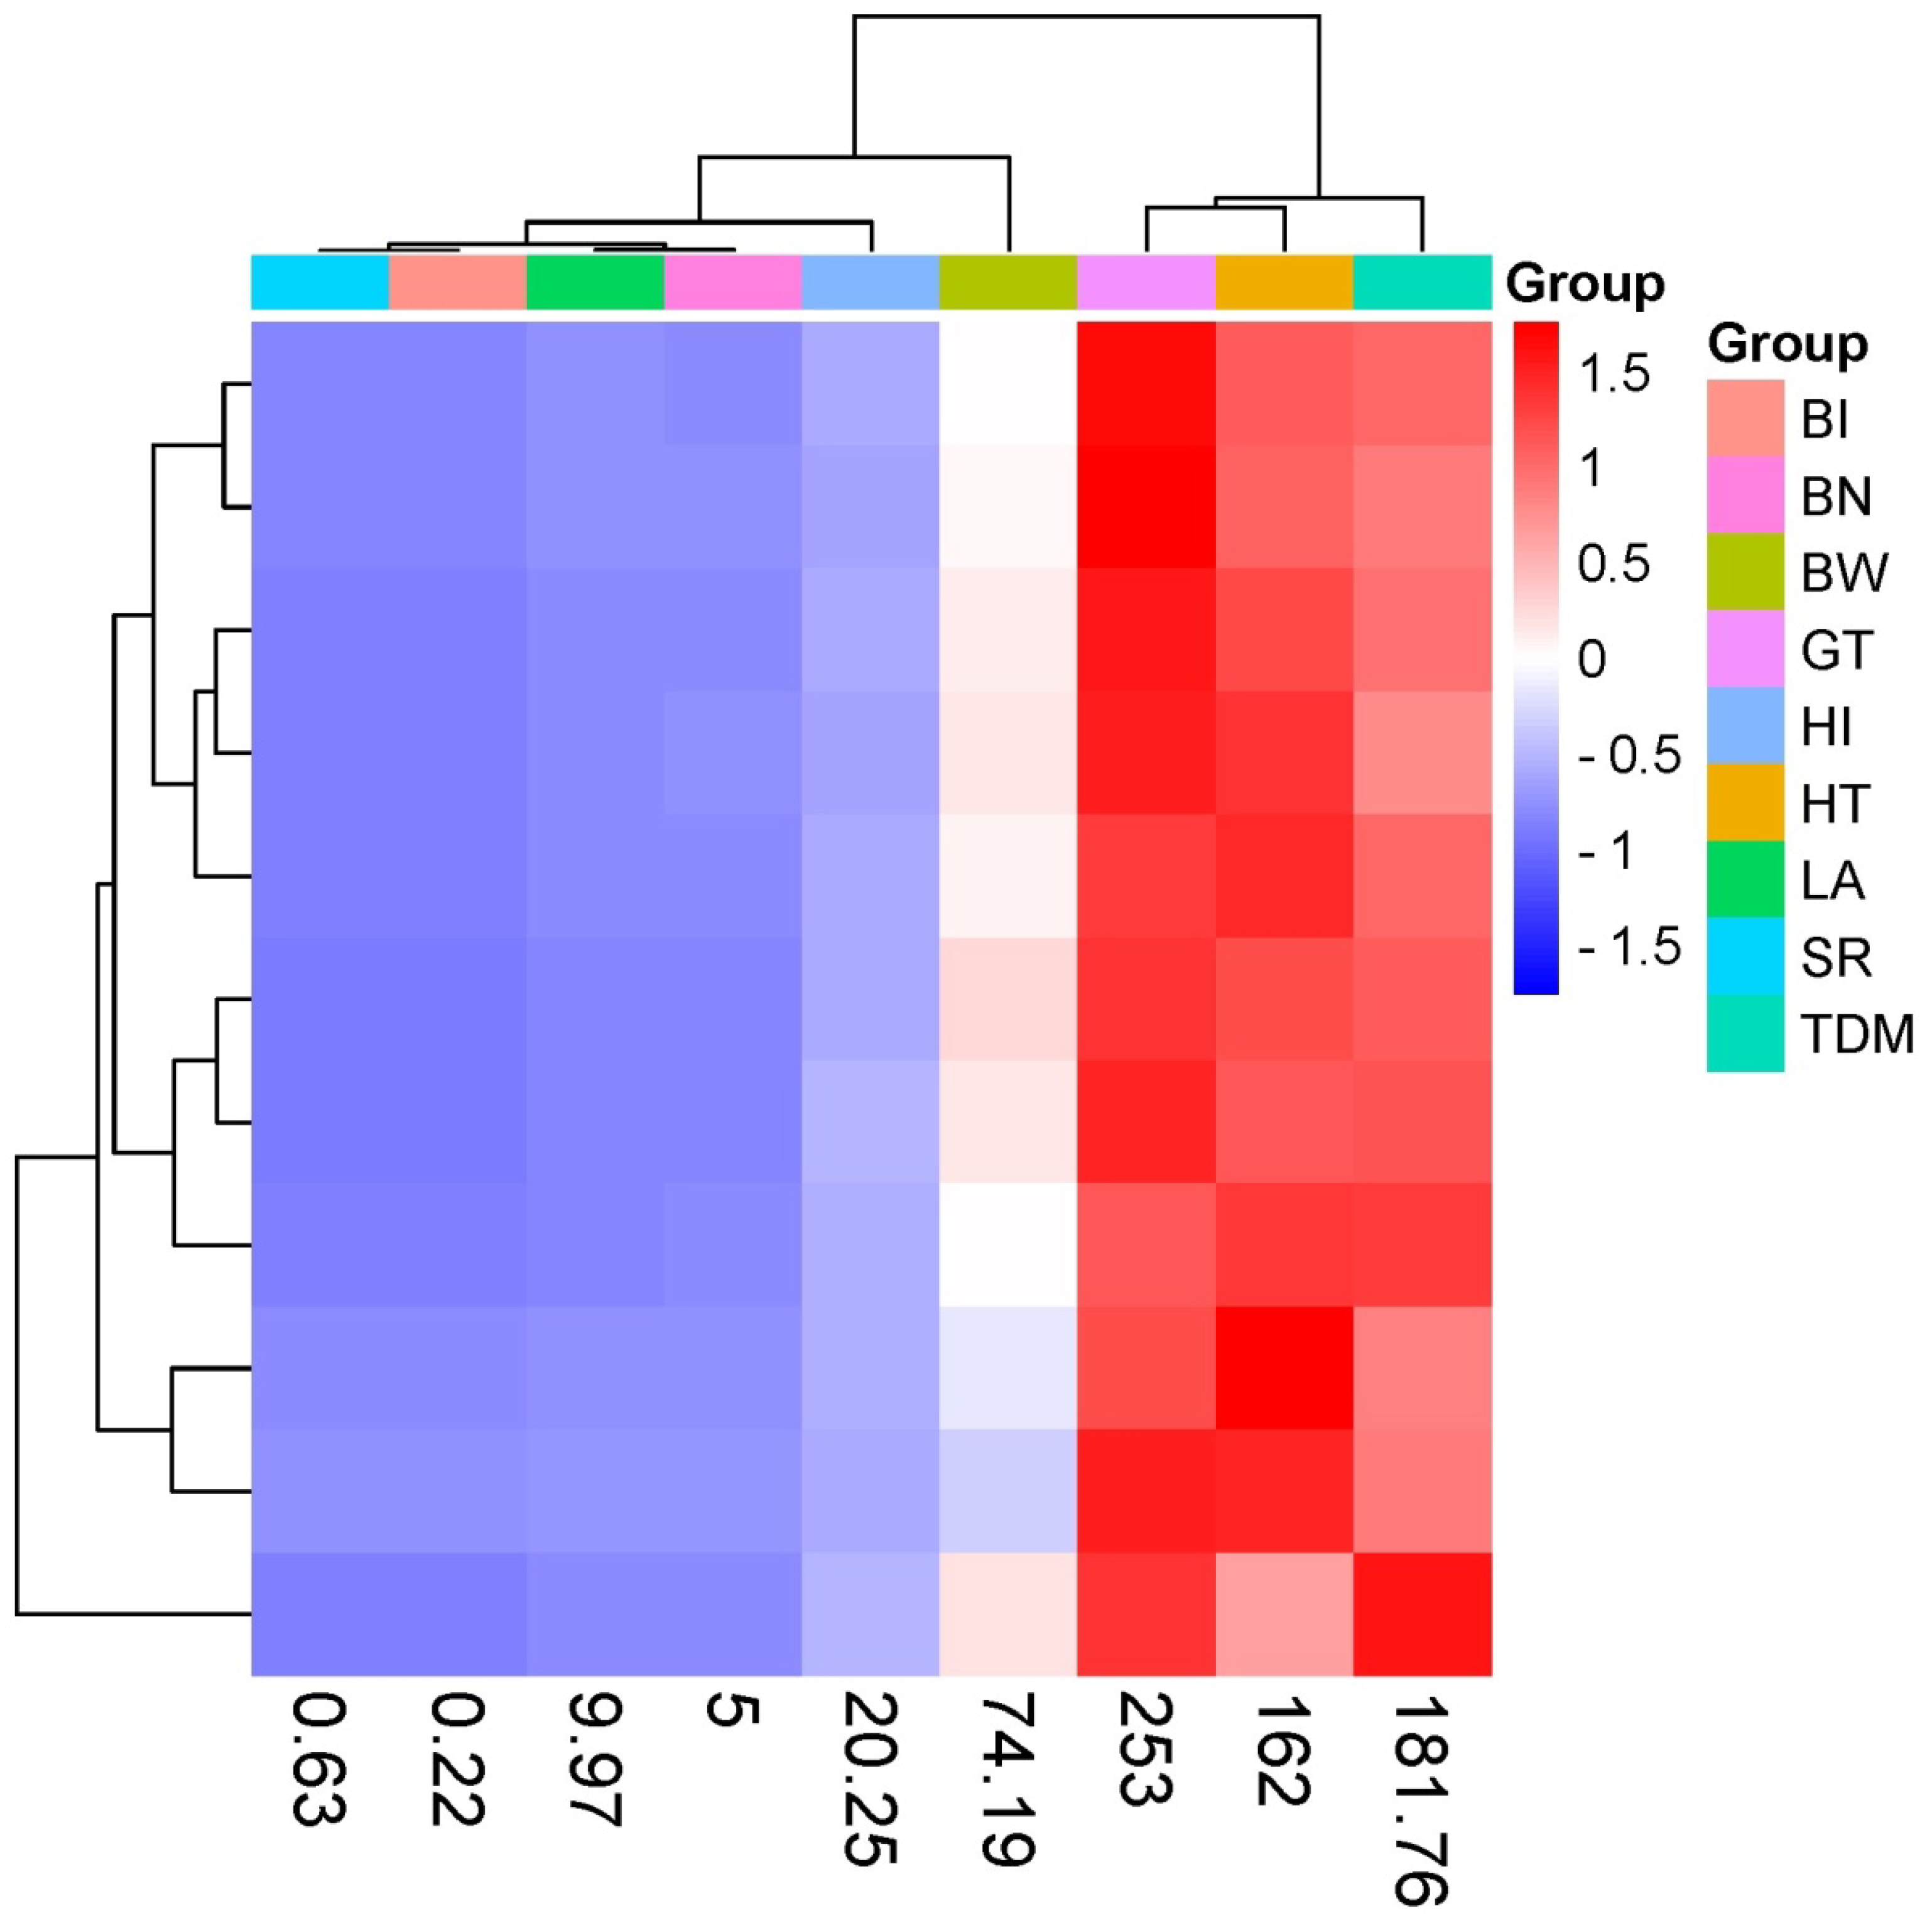
The heatmap cluster analysis yields two types of dendrograms: genotype dendrograms with a horizontal orientation and character dendrograms with a vertical orientation (Figure 4). Based on the dendrogram of genotype, 308 items are divided into two major clusters, the first cluster consisting of BN, HT, and TDM and the other group consisting of the remaining traits. The heatmap represents the clustering of different genotypes and traits (Figure 6). The horizontal dendrogram at the top clusters genotypes, while the vertical dendrogram on the left clusters traits. The color scale signifies the series of values, with blue representing minimum values and red representing maximum values. Each cell in the heatmap corresponds to a specific genotype–trait combination, with the color intensity reflecting the magnitude of the value. The numbers at the bottom (0.63, 0.22, 9.97, etc.) likely represent the mean or scaled values for each trait across the genotypes. The clustering indicates relationships between different variables or groups. Variables grouped closely together share similar patterns or values. The color intensity reveals whether the association between variables is positive or negative. Red areas indicate positive correlations or high values, while blue areas show negative correlations or low values.
Genotype clustering (Horizontal Dendrogram): Genotypes are grouped based on similarity in their trait profiles. Close branches indicate genotypes with similar characteristics. Trait clustering (Vertical Dendrogram): Traits are grouped based on their correlation across genotypes. Close branches indicate traits that vary similarly across the genotypes. Color Intensity: Blue cells indicate lower trait values, while red cells indicate higher trait values. The intensity of the color provides a visual indication of the relative magnitude of each value. There is a clear distinction in trait values across different genotypes, with some genotypes showing consistently higher values (red) and others showing lower values (blue). Traits such as those on the right side of the heatmap tend to have higher values, indicating they might be positively correlated with each other.
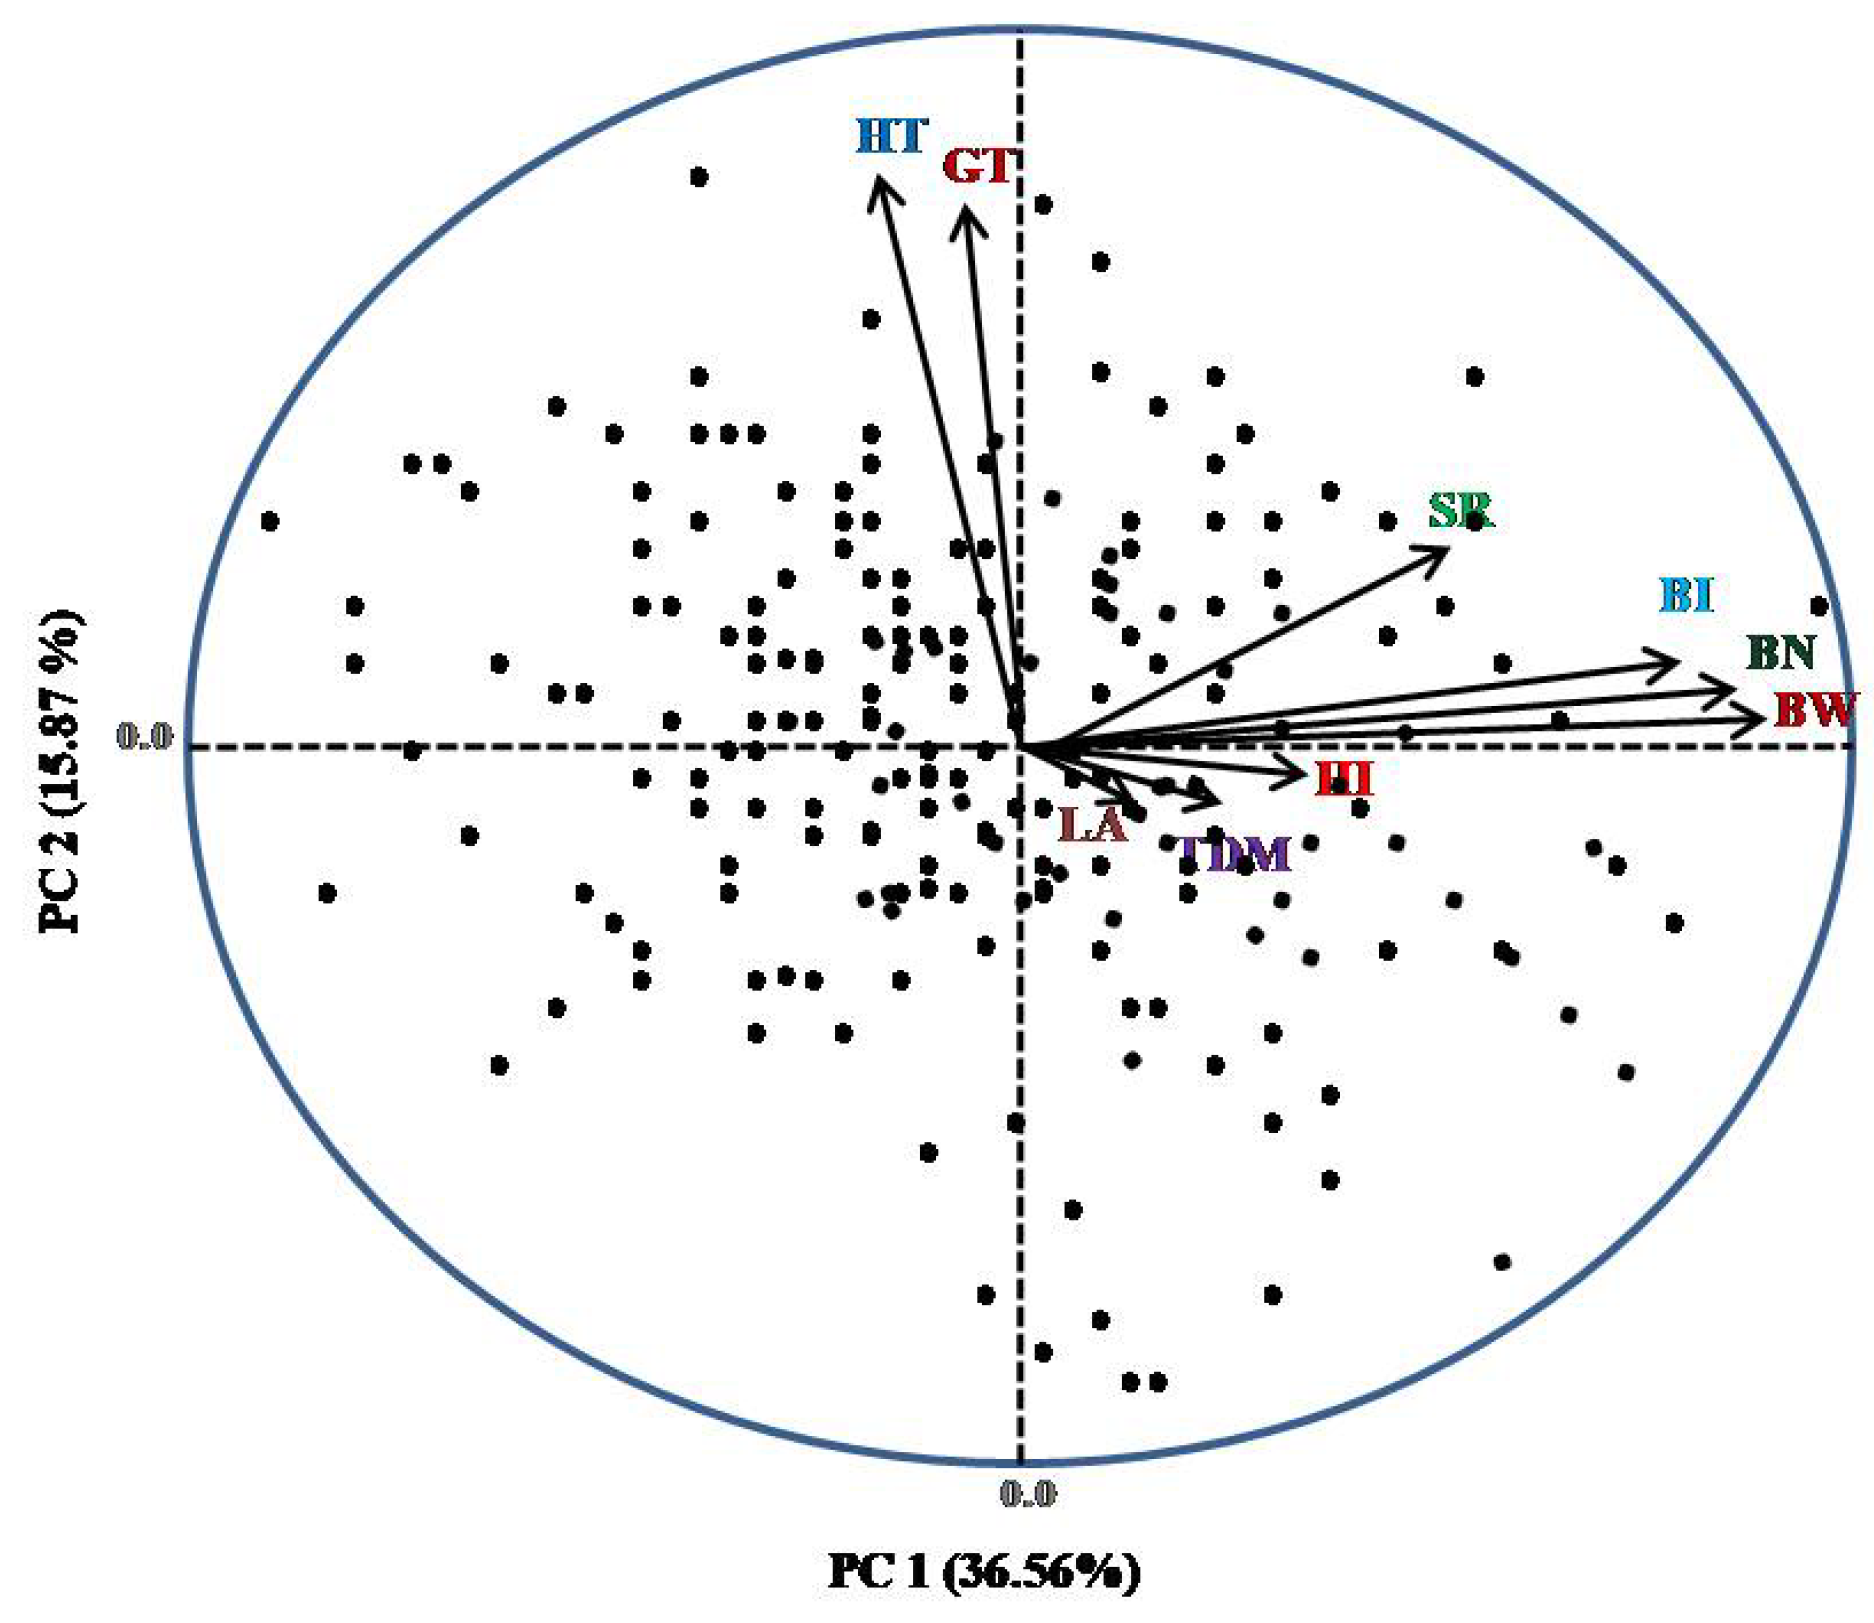
In order to obtain more trustworthy information on how to recognize genotype groups with desired qualities for oil palm breeding, the PCA was carried out (Figure 7). Out of the nine principal components (PCs), only three had eigenvalues greater than one, accounting for 67.19% of the variance across the various genotypes [17,18]. As seen in Figure 5, PC1 had a larger contribution to variability (36.56%), followed by PC2 (15.87%). With the exception of height and girth, all attributes had positive factor loadings on the PC1.

4. Discussion

The availability of genetic diversity, as well as suitable parent selection for developing seeds that add value to the created cultivars and address crop limiting concerns, are critical variables in breeding project success. The yields become stable after the 7th year, i.e., from the 8th year onwards. After initial variability, the yield stabilizes during the middle years of the palm’s life and gradually declines as the tree becomes older. The scatter plot with the density heatmap and regression line provides a clear visualization of the relationship between height increment and bunch weight in the dataset. The positive correlation implies that as the height increment of the plants increases, the bunch weight also tends to increase [19]. Families with high bunch weights typically have low numbers, and vice versa; if bunch number is decreased by removing inflorescences, the weight of the remaining bunches increases. Bunch weight increases with palm age, whereas number declines.
The moderate GCV (37.9%) and PCV (45.07%) of TDM indicate genetic influence, making it potentially significant. The GCV indicates the proportion of variability in traits due to genetic differences among the genotypes. The PCV includes both genetic and environmental contributions to trait variability [7]. Higher GCV values suggest that there is significant genetic variation for that trait, which could be exploited in breeding programs. The closer the GCV and PCV values are, the lower the environmental influence on the expression of the trait, indicating that selection based on phenotype will be more effective. Traits like SR, BW, and BN show a high GCV, indicating substantial genetic variability. It is crucial to assign appropriate weights to each trait based on their importance in the breeding objectives. Not all traits may be equally important, and some traits may have more significant economic or agronomic value [13]. Traits like GT have a lower GCV (13.8%), suggesting less genetic variability or more environmental influence; similar results was found with Swaray et al. [20]. The differences between GCV and PCV indicate the relative influence of environmental factors, with smaller differences suggesting lower environmental impact.
An important yield-determining characteristic for oil palm FFB is sex ratio. The progenies’ differences in sex ratio and other agronomic characteristics were examined. The current results concur with the previous studies by [21,22]. The oil palm FFB and oil output are the main factors considered in breeding and selection. Consequently, a reduction in male inflorescence raises the SR, which in turn causes a poor fruit set, low fresh fruit bunch yield, and low oil output. An increase in female inflorescences may put at risk the formation of male inflorescences. Based on genotype and male inflorescence output, oil palm sex ratios can be raised or lowered. The oil palm inflorescence sex, according to Hageman et al. [23], generated changes throughout time in response to both internal and external factors, consequential in periodic cycles of male and female inflorescences.
Considering the correlation between traits, positive correlations between traits imply that selecting for one trait may inadvertently improve another, while negative correlations may require trade-offs [24]. Correlation analysis was used to identify the variables that had a strong link with one another [25]. One may obtain the conclusion that two or more variables can both explain the same phenomenon when they have a strong correlation with one another. The negative association indicates that these features have a detrimental influence on BW (Figure 5). It is therefore suggested that potential genotypes can be chosen using the traits that have been investigated [11].
To identify and depict pair-wise structural differences between items, cluster analysis was utilized. Using fairly similar clustering techniques, the genotypes and significant characteristics were clustered. The data were divided into two directions (genotypes and characteristics) using two-way clustering. One advantage of two-way clustering is that it allows for the simultaneous grouping of specific objects and their variables [26,27]. The heatmap cluster analysis effectively highlights the relationships among genotypes and traits [28], enabling the identification of patterns and correlations that are crucial for breeding programs. The distinct clusters suggest that specific genotypes and traits are closely related, which can inform selective breeding strategies to optimize desirable traits such as yield and protein content.
With PCA, it is possible to determine the variables that are redundant and variables that discriminate the genotypes evaluated. The present results revealed that PC1contributed maximum variability due to yield-related traits. The characters with positive values indicate the highest contribution and its importance in divergence, whereas negative values indicate the least contribution to the total divergence [17,29]. The selected genotypes in this study may be utilized in oil palm crossing program for the development of D × P hybrids.

5. Conclusions

This study investigated and identified potential traits that can be utilized in future oil palm breeding programs. The use of mother palms in breeding programs improved prediction accuracy for individual traits as well as the genomic selection indices. This improvement was particularly notable when combining phenotypic and genomic information in a genomics-assisted selection approach during preliminary yield trials. This study examined 308 oil palm populations to analyze oil production components, vegetative features, and output. Selected genotypes G8, G300, and G221 had the lowest yearly height increments, measuring 28.98, 29.19, and 30.87 cm, respectively. The outcome of the present study shows that they are slow-height-increment genotypes with a high FFB yield (>25 T/Ha). The future of the oil palm industry will involve the development of innovative progenies with slow growth, high fresh fruit yields, and bunch components using elite dura-type female parents derived from these appraised populations. Meanwhile, genotype evaluation should focus on enhancing the capacity to choose an extraordinary parental source to produce the finest D × P hybrid tenera palms.

Author Contributions

Manuscript preparation: A.P.; review and editing: K.S., A.P., B.K.B. and G.R.; statistical analysis: A.P.; initial evaluation: R.K.M., P.N.K. and H.P.B.; field data collection: K.S.N. All authors have read and agreed to the published version of the manuscript.

Funding

This research was funded by the ICAR—Indian Institute of Oil Palm Research.

Institutional Review Board Statement

ICAR—Indian Institute of Oil Palm Research.Pedavegi–534 450, Eluru District, Andhra Pradesh. F. No. PME/10(H)/2015(4) Dated: 20 June 2024. This is to convey the approval of Director, Pedavegi of the ICAR-IIOPR for the submission of this research article entitled “Development of elite mother palms from the best performing slow vertical growth oil palm genotypes” authored by P. Anitha et al. to be published in the international journal Agriculture (MDPI). The PME Cell Reference No. assigned to the research article is I-8/2024.

Data Availability Statement

Data available on request to the corresponding author.

Acknowledgments

We acknowledge Director Pedavegiof the ICAR-IIOPR for his continuous support, as well as all the staff involved in conducting this research.

Conflicts of Interest

The authors declare no conflicts of interest.

References

  1. USDA. Production, Supply and Distribution Online (PS&D); United States Department of Agriculture Production Commodity Data, USDA: Gainesville, FL, USA, 2023.
  2. Shi, P.; Wang, Y.; Zhang, D.; Htwe, Y.M.; Ihase, L.O. Analysis on fruit oil content and evaluation on germplasm in Oil Palm. HortScience 2019, 54, 1275–1279. [Google Scholar] [CrossRef]
  3. Harun, M.H.; Noor, M.R. Fruit set and Oil Palm bunch components. J. Oil Palm Res. 2002, 14, 24–33. [Google Scholar]
  4. Myint, K.; Amiruddin, M.; Rafii, M.Y.; Abd, M.Y.; Izan, S. Character interrelationships and path analysis for yield components in MPOB-Senegal oil palm germplasm. Sains Malaysiana 2021, 50, 699–709. [Google Scholar]
  5. Bakoume, C.; Louise, C. Breeding for oil yield and short oil palms in the second cycle of selection at La Dibamba (Cameroon). Euphytica 2007, 156, 195–202. [Google Scholar] [CrossRef]
  6. Junaidah, J.; Rafii, M.Y.; Chin, C.W.; Saleh, G. Performance of tenera oil palm population derived from crosses between Deli dura and pisifera from different sources on inland soils. J. Oil Palm Res. 2011, 23, 1210–1221. [Google Scholar]
  7. Upaz-Vera, A.; Ayala-Diaz, I.; Barrera, C.F.; Hernan, M.R. Genetic gains for obtaining improved progenies of oil palm in Colombia. Euphytica 2023, 219, 38. [Google Scholar] [CrossRef]
  8. Nor Azwani, A.B.; Fadila, A.M.; Mohd Din, A.; Rajanaidu, N.; Norziha, A.; Suzana, M.; Marhalil, M.; Zulkifli, Y.; Kushairi, A. Potential oil palm genetic materials derived from introgression of germplasm (MPOB-Nigeria, MPOB-Zaire and MPOB-Cameroon accessions) to advanced (AVROS) breeding population. J. Oil Palm Res. 2020, 32, 569–581. [Google Scholar]
  9. Abdi, H.; Williams, L.J. Principal component analysis. Wiley Interdiscip. Rev. Comput. Stat. 2010, 2, 433–459. [Google Scholar] [CrossRef]
  10. Arolu, I.W.; Rafii, M.Y.; Marjuni, M.; Hanafi, M.M.; Sulaiman, Z.; Rahim, H.A.; Abidin, M.I.Z.; Amiruddin, M.D.; Din, A.K.; Nookiah, R. Breeding of high yielding and dwarf oil palm planting materials using Deli dura × Nigerian pisifera population. Euphytica 2017, 213, 1–15. [Google Scholar] [CrossRef]
  11. Sunilkumar, K.; Mathur, R.K.; Sparjanbabu, D.S.; Pillai, R.S. Evaluation of interspecific oil palm hybrids for dwarfness. J. Plant. Crops 2015, 43, 29–34. [Google Scholar]
  12. Tupaz-Vera, A.; Ayala-Diaz, I.; Barrera, C.F.; Romero, H.M. Selection of elite dura-type parents to produce dwarf progenies of Elaeisguineensis Using Genetic Parameters. Agronomy 2021, 11, 2581. [Google Scholar] [CrossRef]
  13. Corley, R.H.V.; Tinker, P.B. The Climate and Soils of the Oil Palm-Growing Regions. In The Oil Palm, 4th ed.; Blackwell Science Ltd.: Oxford, UK, 2003; pp. 53–88. [Google Scholar]
  14. Pedapati, A.; Mathur, R.K.; Ravichandran, G.; Babu, B.K.; Bhagya, H.P. Evaluation of bunch quality components in Dura x Dura progenies of Zambia and Camaroon sources of oil palm germplasm. J. Environ. Biol. 2021, 42, 1567–1577. [Google Scholar] [CrossRef]
  15. Okoye, M.; Okwuagwu, C.; Uguru, M. Population improvement for fresh fruit bunch yield and yield components in oil palm (Elaeis guineensis Jacq.). Am.-Eurasian J. Sci. Res. 2009, 4, 59–63. [Google Scholar]
  16. Tanya, P.; Hadkam, Y.; Taeprayoon, P.; Srinives, P. Estimates of repeatability and path coefficient of bunch and fruit traits in bang boet dura oil palm. J. Oil Palm Res. 2013, 25, 108–115. [Google Scholar]
  17. Anitha, P.; Mathur, R.K.; Ravichandran, G.; Kalyana Babu, B.; Bhagya, H.P. Assessment of genetic divergence and principal component analysis in oil palm (Elaeis guineensis Jacq.). J. Oilseeds Res. 2018, 35, 159–165. [Google Scholar]
  18. Suzana, M.; Zulkifli, Y.; Marhalil, M.; Rajanaidu, N.; Ong-Abdullah, M. Principal component and cluster analyses on Tanzania oil palm Elaeis guineensis Jacq. germplasm. J. Oil Palm Res. 2020, 32, 24–33. [Google Scholar]
  19. Billotte, N.; Risterucci, A.M.; Barcelos, E.; Noyer, J.L.; Amblard, P.; Baurens, F.C. Development, characterization, and across-taxa utility of oil palm (Elaeis guineensis Jacq.) Microsatellite markers. Genome 2001, 44, 413–425. [Google Scholar] [CrossRef]
  20. Swaray, S.; Amiruddin, M.D.; Rafii, M.Y.; Jamian, S.; Ismail, M.F.; Jalloh, M.; Eswa, M.; Marjuni, M.; Akos, I.S.; Yusuff, O. Oil Palm Inflorescence Sex Ratio and Fruit Set Assessment in dura × pisifera Biparental Progenies on Fibric Peat Soil. Agronomy 2021, 11, 1380. [Google Scholar] [CrossRef]
  21. Henson, I.E. Modelling oil palm yield based on source and sink. Oil Palm Bull. 2007, 54, 27–51. [Google Scholar]
  22. Noh, A.; Rafii, M.Y.; Saleh, G.; Kushairi, A. Genetic performance of 40 Deli dura × AVROS pisifera full-sib families. J. Oil Palm Res. 2010, 22, 781–795. [Google Scholar]
  23. Hageman, J.A.; Malosetti, M.; Eeuwijk, F.A.V. Two-mode clustering of genotype by trait and genotype by environment data. Euphytica 2012, 183, 349–359. [Google Scholar] [CrossRef]
  24. Krualee, S.; Sdoodee, S.; Eksomtramage, T.; Sereeprasert, V. Correlation and path analysis of palm oil yield components in oil palm (Elaeis guineensis Jacq.). Agric. Nat. Resour. 2013, 47, 528–533. [Google Scholar]
  25. Popet, P.; Eksomtramage, T.; Anothai, J.; Khomphet, T. Correlation and path analysis in commercial tenera oil palms collected from Southern Thailand. Indian J. Agric. Res. 2022, 56, 485–488. [Google Scholar] [CrossRef]
  26. Salim, W.N.S.T.M.; Yaakub, Z.; Bakar, N.A.A.; Nasir, F.M.; Marjuni, M.; Amiruddin, M.D.; Ong-Abdullah, M. Genetic variability of MPOB-Cameroon oil palm germplasm based on morphological traits using multivariate analysis. J. Oil Palm Res. 2023, 35, 476–490. [Google Scholar]
  27. Gomes Junior, R.A.; de Freitas, A.F.; da Cunha, R.N.V.; Pina, A.J.d.A.; Campos, H.O.B.; Lopes, R. Selection gains for the palm oil production from progenies of American oil palm with oil palm. Pesqui. Agropecu. Bras. 2021, 56, e02321. [Google Scholar] [CrossRef]
  28. Murugesan, P.; Mary Rani, K.L.; Naveen Kumar, P.; Ramajayam, D.; Sunil Kumar, K.; Mathur, R.K.; Ravichandran, G.; Arunachalam, V. Genetic diversity of vegetative and bunch traits of African oil palm (Elaeis guineensis) germplasm in India. Indian J. Agric. Sci. 2015, 85, 892–895. [Google Scholar] [CrossRef]
  29. Zhou, L.X.; Xiao, Y.; Xia, W.; Yang, Y.D. Analysis of genetic diversity and population structure of oil palm (Elaeis guineensis) from China and Malaysia based on species-specific simple sequence repeat markers. Genet. Mol. Res. 2015, 14, 16247–16254. [Google Scholar] [CrossRef]
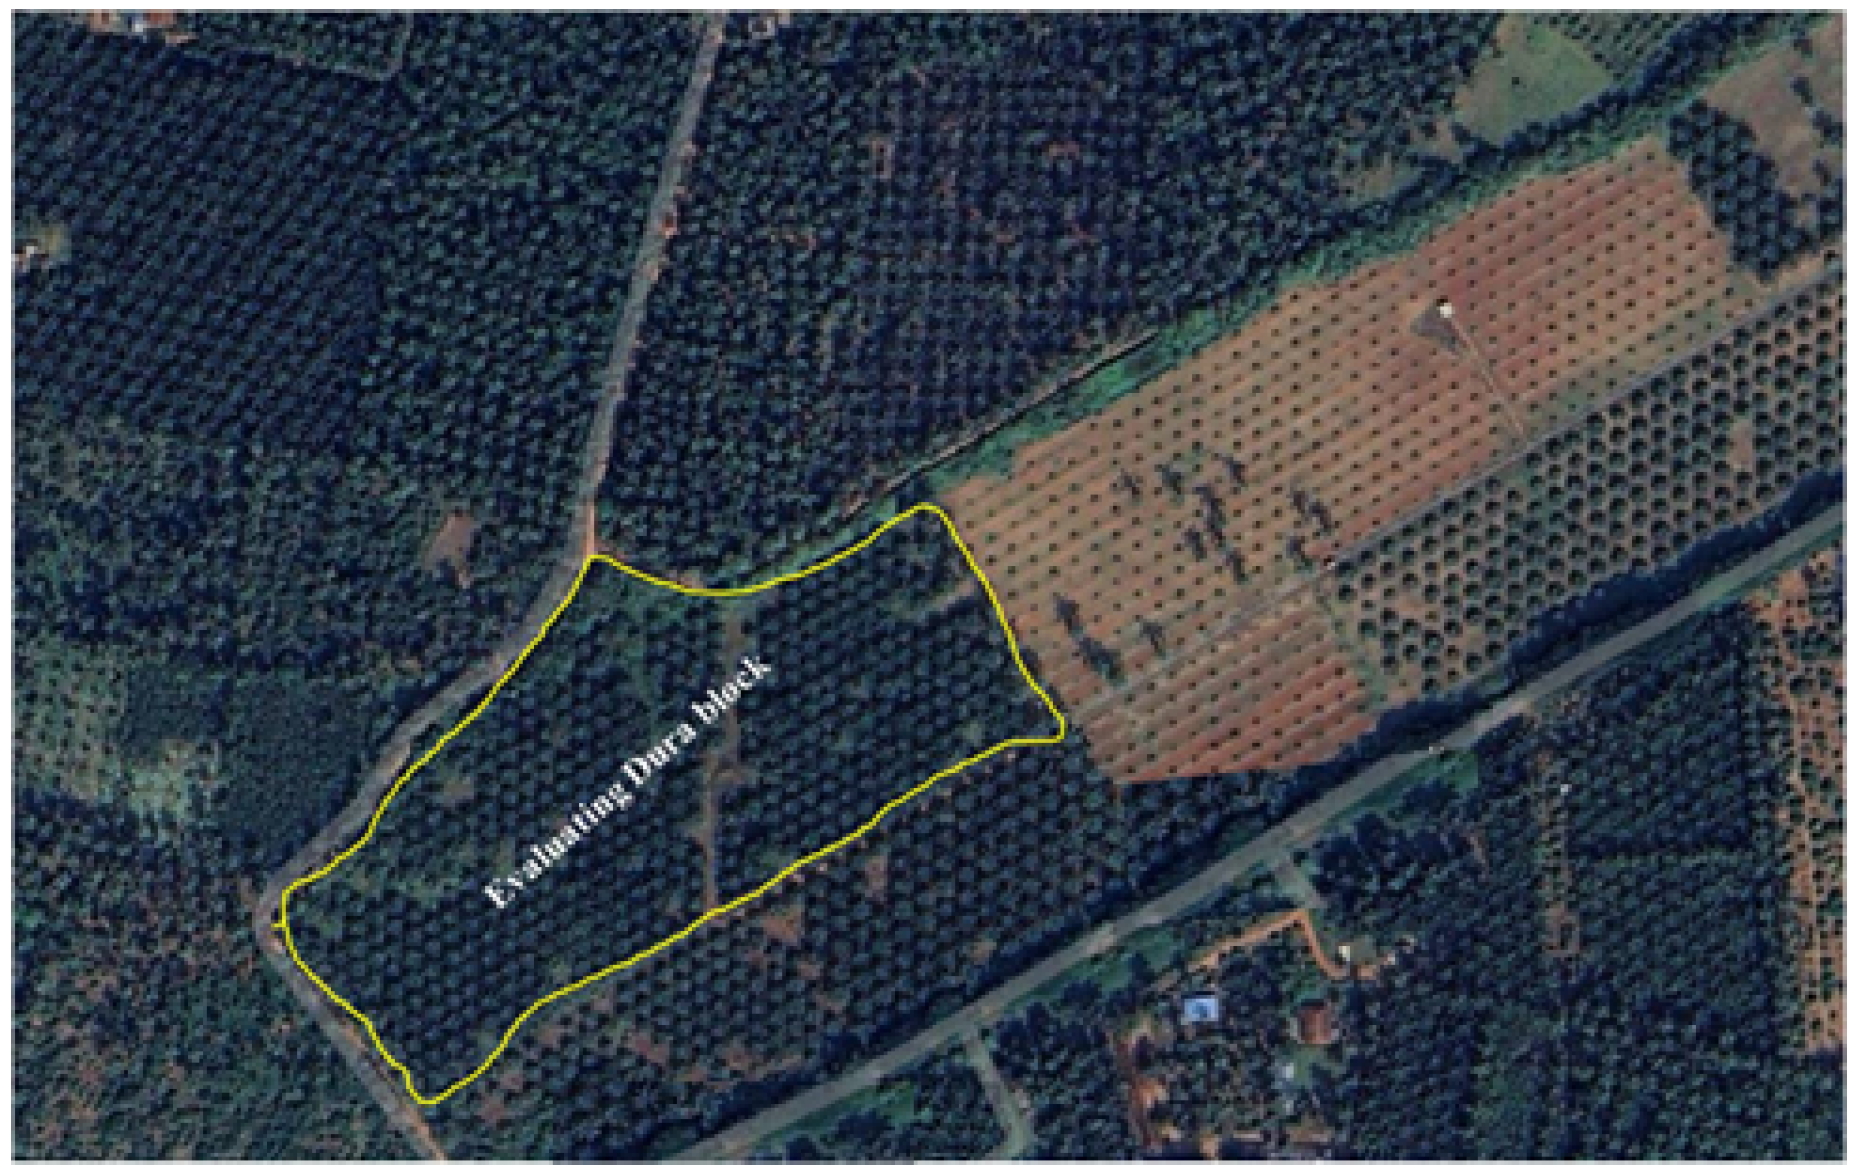
Figure 1. Dura improvement block with 308 genotypes.
Agriculture 14 02007 g001
Figure 2. The process of selection of elite mother palms.
Agriculture 14 02007 g002
Figure 3. A scatter plot with the density heatmap and regression line for important traits.
Agriculture 14 02007 g003
Figure 4. The scatter plot with the density heatmap and regression line of different oil palm traits.
Agriculture 14 02007 g004aAgriculture 14 02007 g004b
Figure 5. Matrix of correlation coefficients of bunch traits in oil palm dura genotypes. Positive correlations are shown in green, while negative correlations are in red/pink, with the intensity of color and size of the pie shapes representing the strength of the correlation. BI: bunch index; BN: bunch number; BW: bunch weight; GT: girth; HI: height increment; HT: height; LA: leaf area; SR: sex ratio; TDM: total dry matter.
Agriculture 14 02007 g005
Figure 6. Cluster heatmap of 308 D × D genotypes performance with 9 different traits. Hierarchical clustering technique provides visual representation of genotypes in distinct groups based on similarity and association with other attributes. Heatmap depicting color pattern.BI: bunch index; BN: bunch number; BW: bunch weight; GT: girth; HI: height increment; HT: height; LA: leaf area; SR: sex ratio; TDM: total dry matter.
Agriculture 14 02007 g006
Figure 7. PCA of nine parameters of 308 genotypes.BI: bunch index; BN: bunch number; BW: bunch weight; GT: girth; HI: height increment; HT: height; LA: leaf area; SR: sex ratio; TDM: total dry matter.
Agriculture 14 02007 g007
Table 1. Genotypes of oil palm utilized in this study.
SNEntryGenotypePopulationParent Source
1.C142 CD × 43 CD28Zambia
2.C2497 CD × 43 CD28Zambia
3.C3497 CD × 465 CD28Zambia
4.C4465 CD × 42 CD28Zambia
5.C540 CD × 282 CD28Zambia
6.C6410 CD × 42 CD28Zambia
7.C742 CD × 93 CD28Zambia × Tanzania
8.C842 CD × 42 CD28Zambia
9.C940 CD × 42 CD28Zambia
10.C1042 CD × 257 CD28Zambia
11.C11206 CD × 4 D28Zambia
Table 2. ANOVAof 308 oil palm dura genotypes.
VariableMeanStd DevMinMaxcvGCV (%)PCV (%)
BI0.240.110.000.630.4662.545.83
BN7.493.930.0021.330.5266.952.47
BW105.9559.350.00220.520.5683.556.01
GT271.9630.35180.00410.000.1113.811.16
HI32.9911.081.8862.170.3440.933.59
HT252.3783.2733.00434.000.3343.433.00
LA7.222.460.1117.430.3440.34.07
SR0.520.300.001.000.5888.557.69
TDM226.08101.8942.161312.020.4537.945.07
BI: bunch index; BN: bunch number; BW: bunch weight; GT: girth; HI: height increment; HT: height; LA: leaf area; SR: sex ratio; TDM: total dry matter.
Table 3. Tukey’s HSD test for oil palm genotypes.
CrossesSRHILABNBWTDMBIGTHT
47 CD × 43 CD0.391 a24.879 e7.54 abcd6.321 de86.91 f191.897 f0.221 a260.146 f199.036 g
497 CD × 43 CD0.459 a24.743 e6.531 d7.605 cd94.734 e182.062 g0.265 a273.393 d202.839 g
497 CD × 465 CD0.481 a28.455 d8.393 a7.5 cd106.389 d194.127 f0.265 a260.232 f225.179 f
465 CD × 42 CD0.677 a37.594 bc7.742 abc8.25 bc145.229 a251.459 c0.296 a288.743 b267.464 d
40 CD × 282 CD0.58 a29.107 d6.494 d9.893 a115.469 c191.957 f0.307 a278.471 c259.679 e
410 CD × 42 CD0.559 a43.504 a6.645 d9.107 ab116.988 c231.898 d0.261 a267.821 e228.464 f
42 CD × 93 CD0.401 a35.509 c6.908 cd5.357 ef85.438 f225.836 d0.197 a269.464 e344.393 a
42 CD × 42 CD0.421 a21.625 f6.757 cd4.464 f54.952 g215.528 e0.158 a294.964 a289.393 c
40 CD × 42 CD0.56 a38.75 b8.173 ab7.5 cd118.9 c271.891 b0.245 a250.9 h168.857 h
42 CD × 257 CD0.587 a35.621 c7.246 bcd8.306 bc125.6 b250.456 c0.251 a291 b306.929 b
206 CD × 4 CD0.615 a43.08 a6.999 cd8.071 bc114.838 c279.758 a0.218 a256.375 g283.786 c
Tukey’s HSD test for 308 genotypes for nine traits (p < 0.05). Crosses like 465 CD × 42 CD and 410 CD × 42 CD show promising performance in multiple traits. BI: bunch index; BN: bunch number; BW: bunch weight; GT: girth; HI: height increment; HT: height; LA: leaf area; SR: sex ratio; TDM: total dry matter.
Disclaimer/Publisher’s Note: The statements, opinions and data contained in all publications are solely those of the individual author(s) and contributor(s) and not of MDPI and/or the editor(s). MDPI and/or the editor(s) disclaim responsibility for any injury to people or property resulting from any ideas, methods, instructions or products referred to in the content.