Abstract
Planting oat forage in fallow fields during winter and producing total mixed ration (TMR) silage can effectively address issues of land wastage and forage shortages while maintaining forage quality. This study used oats and common vetch grown in winter fields in southern China as base materials, with additives including corn flour, soybean meal, corn lees, cottonseed meal, and premixes to formulate mixed feeds with roughage-to-concentrate ratios of 75:25, 70:30, and 65:35 on a dry matter basis. TMR silage was inoculated with a customized mixed lactic acid bacteria (LAB) additive composed of Lactobacillus plantarum 160 (patent number ZL202210218695.5), Lactobacillus pentosus 260 (patent number ZL202210204293), and Lactobacillus buchneri 225 (patent number ZL202210204293), at a ratio of 2:1:1, with addition rates of 4 × 10⁶, 2 × 10⁶, and 2 × 10⁶ cfu/g, respectively (IN), while sterile distilled water served as the control (CK). After a 60-day fermentation, the cornell net carbohydrate protein system (CNCPS) and in vitro digestion analysis were used to assess the effects of different roughage-to-concentrate ratios on the carbohydrate and protein components and ruminal degradation rate of fermented TMR (FTMR) silage, as well as to evaluate the impact of mixed LAB inoculation on FTMR nutritional quality, fermentation quality, and aerobic stability. The results indicated the following: (1) Regardless of the LAB addition, dry matter (DM), ether extract (EE), crude protein (CP), and Ash contents significantly decreased (p < 0.05) as the concentrate level decreased. In the IN group, as the concentrate level decreased, the water-soluble carbohydrate (WSC) content significantly increased (p < 0.05), the pH significantly decreased (p < 0.05), and the NH3-N/TN significantly decreased (p < 0.05), with LAB counts significantly higher at a 65:35 roughage-to-concentrate ratio than in the other two groups. In the CK group, no significant changes (p > 0.05) were observed in the WSC content, pH, or LAB counts. (2) CNCPS analysis showed that in the IN group, the carbohydrate (CHO) content at a 75:25 roughage-to-concentrate ratio was significantly higher than in the other two groups (p < 0.05), while the non-utilizable carbohydrate (CC) content was significantly lower (p < 0.05). As the concentrate levels decreased, the non-protein nitrogen (PA) and moderately degradable true protein (PB2) content significantly increased (p < 0.05), whereas the rapidly degradable true protein (PB1) and slowly degradable true protein (PB3) content significantly decreased (p < 0.05). In the CK group, the CHO, PA, PB2, and PC content significantly increased (p < 0.05) as concentrate levels decreased, while the PB1 and PB3 content significantly decreased (p < 0.05). (3) In vitro digestibility characteristics indicated that gas production (GP) in the IN group was significantly lower than in the CK group (p < 0.05), with crude protein degradability increasing as concentrate levels decreased, regardless of the LAB addition. (4) At a 65:35 roughage-to-concentrate ratio, aerobic stability in the IN group was significantly higher than in the CK group (p < 0.05). In conclusion, higher concentrate ratios in total mixed rations (TMRs) with varying roughage-to-concentrate proportions improve the nutritional quality and promote the ruminal degradation of the FTMR. LAB inoculant addition could be an effective approach for addressing FTMR feed challenges.
1. Introduction
Forage constitutes the cornerstone of animal husbandry, with livestock products, particularly those derived from cattle and sheep, being inextricably linked to the development of the forage industry. Despite its crucial role, China’s forage industry has experienced a delayed inception, coupled with constraints such as limited per capita arable land, resulting in a persistent state of “insufficiency” that fails to adequately meet livestock demands [1]. In southern China, winter fields encompass approximately 50 to 60% of the cultivated land area, with some regions reaching as high as 80 to 90%. Notably, in certain areas, these fields remain completely fallow during the winter season [2]. Consequently, these extensive winter fields have become “idle lands”, fostering weed proliferation and contributing to a decline in soil fertility [3]. Therefore, effectively utilizing these “idle lands” to secure livestock feed and converting them into “productive fields” for forage cultivation has become an urgent challenge.
Oat (Avena sativa L.), a traditional high-quality annual cool-season forage, is well-suited for winter planting in southern China [4]. When intercropped with common vetch (Vicia sativa L.), the resultant forage exhibits nutritional complementarity, thereby enhancing both yield and quality relative to monoculture systems [5]. This combination provides an excellent source for mixed silage production.
The fermented total mixed ration (FTMR) represents an innovative advancement in TMR silage, originating from Japan through the integration of silage and TMR technologies [6]. It typically consists of roughage (such as hay, silage, and straw), concentrates (such as grains and oilseeds), and other additives (such as probiotics and enzyme preparations), mixed to form a total mixed ration that meets the nutritional needs of ruminants. The FTMR has been shown to improve the absorption and utilization of nutrients in feed [7], reduce harmful substances during fermentation [8], and promote the growth of beneficial gut microbiota in ruminants, thereby enhancing gut health [9]. However, in practical application, issues such as fungal contamination and low digestibility are still observed, possibly due to the use of low-quality roughage and excessive roughage in the formulation [10]. Additionally, increasing the proportion of concentrates in the TMR generally elevates dry matter (DM), soluble carbohydrates, and protein levels while reducing the fiber content, directly influencing the fermentation process’s quality and the final nutritional value [11]. Wang et al. demonstrated that, compared to the traditional TMR, the FTMR exhibits superior aerobic stability, with long-term storage further reducing its susceptibility to spoilage [12]. The FTMR offers advantages over the TMR in long-distance transportation, saving time and human resources [13].
The Cornell Net Carbohydrate and Protein System (CNCPS), building on traditional feed value evaluation methods, classifies feed proteins and carbohydrates (CHO) into degradable and non-degradable fractions, offering more detailed categorization and more accurate assessment results [14]. The CNCPS allows the precise classification and calculation of nutritional components in feed, providing a detailed breakdown of carbohydrates (CHO) into rapidly degradable carbohydrates (CA), moderately degradable carbohydrates (CB1), slowly degradable carbohydrates (CB2), and non-degradable carbohydrates (CC) [14]. Key components such as non-protein nitrogen (PA), true protein (PB), and non-utilizable nitrogen (PC) are clearly distinguished, and true protein (PB) is further subdivided according to its degradation rate in the rumen into rapidly degradable true protein (PB1), moderately degradable true protein (PB2), and slowly degradable true protein (PB3) [15]. Despite these advancements, recent research on FTMR has mainly focused on fermentation quality and conventional nutrient composition, with limited exploration of carbohydrate–protein fractions and ruminal degradation rates.
The traditional single lactobacillus additive approach can no longer simultaneously address the requirements for silage fermentation quality and spoilage inhibition after aerobic exposure. As a result, mixed lactic acid bacteria (LAB) additives have become a key focus in silage inoculant research [16]. Recent studies on TMR silage have shown that inoculants can significantly improve chemical composition, increase the retention of protein and fiber, reduce DM loss, and help increase ruminant intake, daily weight gain, and milk yield while reducing silage losses during storage and feeding, thus lowering production costs [17]. For example, Lactobacillus plantarum 694, isolated from high-moisture corn silage in southern China, can alter microbial diversity and improve the fermentation quality of high-moisture Italian ryegrass [18]; co-inoculation with L. buchneri NCIMB 40,788 and Lentilactobacillus hilgardii CNCM-I-4785 enhances the stability of different silages [19,20]. However, in TMR formulations containing various roughage and concentrate ingredients, there is a lack of in-depth analysis of how inoculants respond to and adapt to different ingredient proportions. The optimization of FTMR formulations and the impact of different additives on feed quality, especially in formulations with varying roughage-to-concentrate ratios, remains a current research hotspot, and further exploration of how these benefits can be applied under different conditions is necessary.
In this study, TMR silage was prepared using winter-grown oat feed and common wild pea from southern China. Both forages were mixed with straw as roughage, and the roughage-to-concentrate ratio formed dry matter mixtures of 75:25, 70:30, and 65:35. A selected mixed LAB additive was used, and the nutritional value was evaluated using the CNCPS alongside in vitro digestion techniques. The aim was to assess the impact of the selected mixed LAB inoculant on FTMR’s nutritional components, CNCPS fractions, and fermentation quality, providing a reference for the development and utilization of unconventional feed resources.
2. Materials and Methods
2.1. Experimental Materials
Oat forage (Furlong) and common vetch (Chuanbei) were sown at 22.5 kg/hm−2 and 144.06 kg/hm−2, respectively. The plot area was 15 m2 (3 m × 5 m) in a randomized block design with 3 replications. Oat forage was harvested at the milky stage and vetch at the pod stage on 21 October 2022 at the National Grass Variety Regional Test Base of the Grassland Technology Research and Promotion Center in Sichuan Province, China (103°76′ N, 30°76′ E, 442 m~480 m above sea level). The experimental design employed a 3 × 2 factorial arrangement with two main treatments: (1) an experimental group using selected LAB additive combinations, which included Lactobacillus plantarum 160 (Patent No. ZL202210218695.5), Lactobacillus pentosus 260 (Patent No. ZL202210204293), and Lactobacillus buchneri 225 (Patent No. ZL202210204293) (IN); (2) a control group (CK) with the same volume of sterilized distilled water. The LAB strains were preserved in glycerol at −80 °C. Three roughage-to-concentrate ratios were tested: (1) 75:25, (2) 70:30, and (3) 65:35 on a dry matter (DM) basis, as shown in Table 1.

Table 1.
Composition of TMR (dry matter basis, %).
2.2. Silage Production
Freshly harvested mixed forage was chopped into 2 cm segments, and various ingredients were mixed uniformly according to each specified ratio. The undiluted LAB mixture was sprayed onto the silage material evenly using a spray bottle, with the three bacterial strains mixed in a ratio of 2:1:1 and applied at concentrations of 4 × 10⁶, 2 × 10⁶, and 2 × 10⁶ cfu/g, respectively. An equal volume of sterilized distilled water was sprayed for the control treatment. After thorough mixing, the feed was packed into sterile silage bags (26 cm × 35 cm), each containing approximately 1 kg. The bags were vacuum-sealed using a DZQ-390 vacuum packaging machine (Anshengke, Quanzhou, Fujian Province, China) and stored at room temperature (20 ± 5 °C) for 60 days of fermentation. After this period, the silage bags were opened for analysis.
2.3. Analysis of Nutrient Content of Experimental Silages
Triplicate samples of the untreated fresh forage and the TMR silage were collected before ensiling. The DM content was determined by drying the samples for 48 h in a 60 °C convection oven, following AOAC guidelines (1995) [21]. The dry matter loss (DM loss) was calculated as the difference in dry matter content between the samples taken before and after the silage process [22]. Neutral detergent fiber (NDF), acid detergent fiber (ADF) and acid detergent lignin (ADL) were measured using the method of Van Soest et al. [23]. Crude protein (CP) was analyzed with a KjeltecTM8400 automatic Kjeldahl nitrogen analyzer, according to AOAC protocols [21]. Water-soluble carbohydrate (WSC) was determined using the sulfuric acid–anthracene ketone colorimetric method [24], and starch content was assessed with a total starch determination kit (Bray Business Park, Bray, Co. Wicklow, Ireland). Ether extract (EE) content was measured by weighing 1 g of sample, extracting it with petroleum ether, and then weighing the residue after ventilation and evaporation [21]. For ash content determination, 2 g of the sample was carbonized at low temperature in an electric furnace, sintered in a muffle furnace, and weighed after cooling [21].
2.4. Determination of Fermentation Metabolites
Twenty-five grams of fresh forages were homogenized with 225 mL of sterile 25%-strength Ringer’s solution (Oxoid BR52) for 1 min. The pH of the filtrate was measured using a pH meter (PHSJ-5; LEICI, Shanghai, China). A portion of the filtrate was acidified with 50% H2SO4, centrifuged at 12,000 rpm for 15 min at 4 °C (5810R, Eppendorf, Hamburg, Germany), filtered through a 0.22 μm membrane, and analyzed for organic acids (lactic acid (LA), acetic acid (AA), butyric acid (BA), and propionic acid (PA)) using high-performance liquid chromatography (HPLC) (1100, Agilent Technologies Inc., Beijing, CA, USA) with a UV detector (210 nm) and a chromatography column (KC-811, Shimadzu Co., Ltd., Kyoto, Japan). The mobile phase was 0.1% H3PO4, with a column temperature of 50 °C and a flow rate of 0.5 mL/min [25]. NH3-N content was determined after establishing a standard curve, by adding phenol chromogenic reagent, sodium hypochlorite reagent, and sample supernatant, followed by measuring the absorbance using an enzyme-linked immunosorbent assay (ELISA) reader [26].
2.5. Enumeration of Total Bacteria
For microbial analysis, 20 g of the sample was mixed with 180 mL of sterilized distilled water and placed on a shaker at 120 rpm for 30 min to release surface microorganisms into the liquid [27]. After serial dilutions (10−1 to 10−5), 100 μL of the 10−3 and 10−5 dilutions were plated on different media for microbial counts: MRS agar for lactobacilli (incubated anaerobically at 37 °C for 48 h), Crystalline Violet Neutral Red Bile Salt agar for Enterobacteriaceae (incubated anaerobically at 37 °C for 24 h), and Potato Glucose agar for molds and yeasts (incubated aerobically at 30 °C for 72 h).
2.6. Aerobic Stability Evaluation
After 60 days of silage, 800 g of the sample was evenly distributed into a sterilized 2 L beaker, compacted, covered with two layers of sterilized cotton gauze, and left at room temperature for 7 days. The core temperature of the silage (at a depth of 10 cm) was monitored every 5 min for 7 days using a real-time temperature logger (MT-X, Shenhua Science and Technology Co., Ltd., Shenzhen, China). After 7 days of aerobic exposure, samples were taken for microbial counts, fermentation quality analysis, and nutritional quality assessment. Aerobic stability was calculated as the time during which the silage temperature exceeded the baseline ambient temperature by 2 °C [28].
2.7. Determination of Rumen Degradation Characteristics
The rumen degradation rate of fermented TMR was assessed using the in vitro gas production method. The buffer was prepared according to Menci et al. and maintained at 39 °C in a water bath, with continuous CO2 flushing until the buffer color changed from red to pink and, finally, to nearly colorless [29]. Rumen fluid was obtained from six grazing yaks with similar body weights in Qingbaijiang slaughterhouse. The collected rumen fluid was filtered and stored at −20 °C until analysis. After thawing and filtering through gauze, the rumen fluid was mixed with artificial rumen buffer at a 1:2 volume ratio, with continuous CO2 flushing. One gram of the sample was placed in a 100 mL syringe and then mixed with 50 mL of rumen fluid, sealed, and incubated at 39 °C. Gas production (GP) was recorded at intervals (2, 4, 8, 12, 24, 36, 48, and 72 h), with eight replicates per treatment. After 72 h of incubation, the residue was filtered through a 0.06 mm nylon cloth and washed and dried for the determination of dry matter degradation rate (DMD), neutral detergent fiber degradation rate (NDFD), acid detergent fiber degradation rate (ADFD), and crude protein degradation rate (CPD), and the filtrate was used for the determination of rumen pH and ammonium nitrogen (NH3-N) content.
For soluble crude protein (SCP) analysis, 0.5 g of the sample was weighed into a 125 mL conical flask, mixed with 50 mL of distilled water, and allowed to stand for 30 min before adding 10 mL of 10% trichloroacetic acid solution. After standing for an additional 20–30 min, the mixture was filtered through Whatman #54 or 541 filter paper, and the residue was rinsed twice with the trichloroacetic acid solution and transferred to a Kjeldahl nitrogen apparatus for nitrogen determination. Non-protein nitrogen (NPN) was analyzed by weighing 0.5 g of the sample, adding 50 mL of borate–phosphate buffer solution and 1 mL of sodium azide, and allowing it to stand for 3 h at room temperature. The mixture was then filtered under vacuum, rinsed with buffer, and transferred to a Kjeldahl nitrogen apparatus for nitrogen determination. Neutral detergent insoluble protein (NDIP) and acid detergent insoluble protein (ADIP) were washed, acid-washed, and transferred to the Kjeldahl nitrogen analyzer for nitrogen determination. The nutrient content for each CNCPS fraction is presented in Table 2.
Table 2.
CNCPS calculation formula.
2.8. Statistical Analysis
Two-factor ANOVA was performed using the general linear model in IBM SPSS Statistics version 22.0 (SPSS, Chicago, IL, USA), with multiple comparisons between treatments conducted using Duncan’s method. The effects of roughage-to-concentrate ratios, lactic acid bacterial agents, and their interactions on fermentation TMR were analyzed. A one-way ANOVA with Duncan’s method was used for the indicators under different treatments. Independent samples t-tests were conducted to compare the spiked group with the control group under different roughage-to-concentrate ratios, with p < 0.01 indicating highly significant differences and p < 0.05 indicating significant differences. Results were expressed as mean ± standard error. Organic acid data were analyzed using Xcalibur software, and plots were generated using Origin 2018 software (Origin Lab, Northampton, MA, USA).
3. Results
3.1. Fermentation Quality of FTMR
As shown in Table 3, pH and NH3-N/TN are significantly related to the inoculant and ratio (p < 0.01). In the CK groups, pH, LA content, AA content, and PA content were lowest in the C3 group, with NH3-N/TN in the C3 group being significantly lower than that in the C2 group (p < 0.05). In the IN groups, the pH in the I3 group was significantly lower than that in the I1 and I2 groups (p < 0.05), and NH3-N/TN was significantly lower than that in the I1 group (p < 0.05). The pH in the I3 group was significantly lower than that in the C3 group, and LA content in the I3 group was significantly higher than that in the C3 group (p < 0.05). BA was not detected in any of the groups.
Table 3.
Effect of roughage-to-concentrate ratio on fermentation characteristics of FTMR with or without inoculants for 60 days (dry matter basis, %).
3.2. Microbial Population of Fermented TMR
As shown in Table 4, the number of LAB is significantly related to the inoculant, ratio, and their interaction (p < 0.01). In the CK groups, the LAB count in the C2 group was significantly lower than that in the C1 and C3 groups (p < 0.05). Yeasts were not detected in the C2 and C3 groups, and molds were not detected in the C3 group. In the IN group, the LAB count in the I1 group was significantly higher than that in the I2 and I3 groups (p < 0.05). Yeasts were not detected in the I2 and I3 groups, and the yeast count in the I1 group was significantly lower than that in the C1 group (p < 0.05). Molds were not detected in the I3 group. Enterobacteriaceae were not detected in either the CK or IN groups.
Table 4.
Effect of roughage-to-concentrate ratio on microorganisms of FTMR with or without inoculants for 60 days.
3.3. Nutrient Composition of Fermented TMR
As shown in Table 5, WSC content is significantly related to the inoculant (p < 0.05), while CP and Ash content are highly significantly related to the inoculant (p < 0.01). DM, ADF, EE, CP, and Ash content are all highly significantly related to the ratio (p < 0.01). ADF content is significantly related to their interaction (p < 0.05), and Ash content is highly significantly related to their interaction (p < 0.01). In the CK group, ADF levels in the C2 group were significantly lower than those in the C3 group (p < 0.05), EE content in the C1 group was significantly higher than that in the C2 and C3 groups (p < 0.05), and CP content in the C3 group was significantly higher than that in the C1 group (p < 0.05). Regardless of the inoculation, the contents of DM, EE, and Ash decreased with the reduction in the concentrate ratio. In the IN group, ADF, EE, CP, starch, and Ash contents in the I1 group were significantly higher than those in the I2 and I3 groups (p < 0.05).
Table 5.
Effect of roughage-to-concentrate ratio on nutritional quality of FTMR with or without inoculants for 60 days.
3.4. Protein and Carbohydrate Fractions of Fermented TMR
As shown in Table 6, the contents of PA, PB2, and PC were significantly correlated with the inoculant (p < 0.05); the contents of PA, PB1, PB2, and PB3 were highly significantly correlated with the ratio (p < 0.01). In the CK group, the highest PC content was found in the C2 (roughage-to-concentrate ratio 70:30) group (p < 0.05), while in the IN group, it was the I3 group that had the highest content (p < 0.05).
Table 6.
Effect of roughage-to-concentrate ratio on protein components of FTMR with or without inoculants.
As shown in Table 7, the content of CHO was significantly correlated with inoculant (p < 0.05); the content of CHO and CC was highly significantly correlated with the ratio (p < 0.01); and the content of CC was significantly correlated with their interaction (p < 0.05). In the CK group, the content of CC was the highest in the C2 (roughage-to-concentrate ratio 70:30) group (p < 0.05), while the content of CC was the highest in the I1 (roughage-to-concentrate ratio 65:35) group (p < 0.05), and the content of CB1 was the lowest in the I3 group (p < 0.05).
Table 7.
Effect of roughage-to-concentrate ratio on carbohydrate components of FTMR with or without inoculants.
3.5. Rumen Degradation Characteristics of Fermented TMR
As shown in Table 8, ruminal pH ranged from 6.15 to 6.34 and NH3-N ranged from 12.33 to 17.70 mg dL−1, with I2 and I3 having significantly higher NH3-N than I1 (p < 0.05). Degradation rates of CP, NDF, ADF, and DM were highly significantly correlated with inoculant (p < 0.01). The degradation rates of CP were higher in the IN group than in the CK group (p < 0.05). I2 and I3 groups had degradation rates of NDF than C2 and C3 groups (p < 0.05).
Table 8.
Effect of roughage-to-concentrate ratio on rumen degradation characteristics of FTMR with or without inoculants.
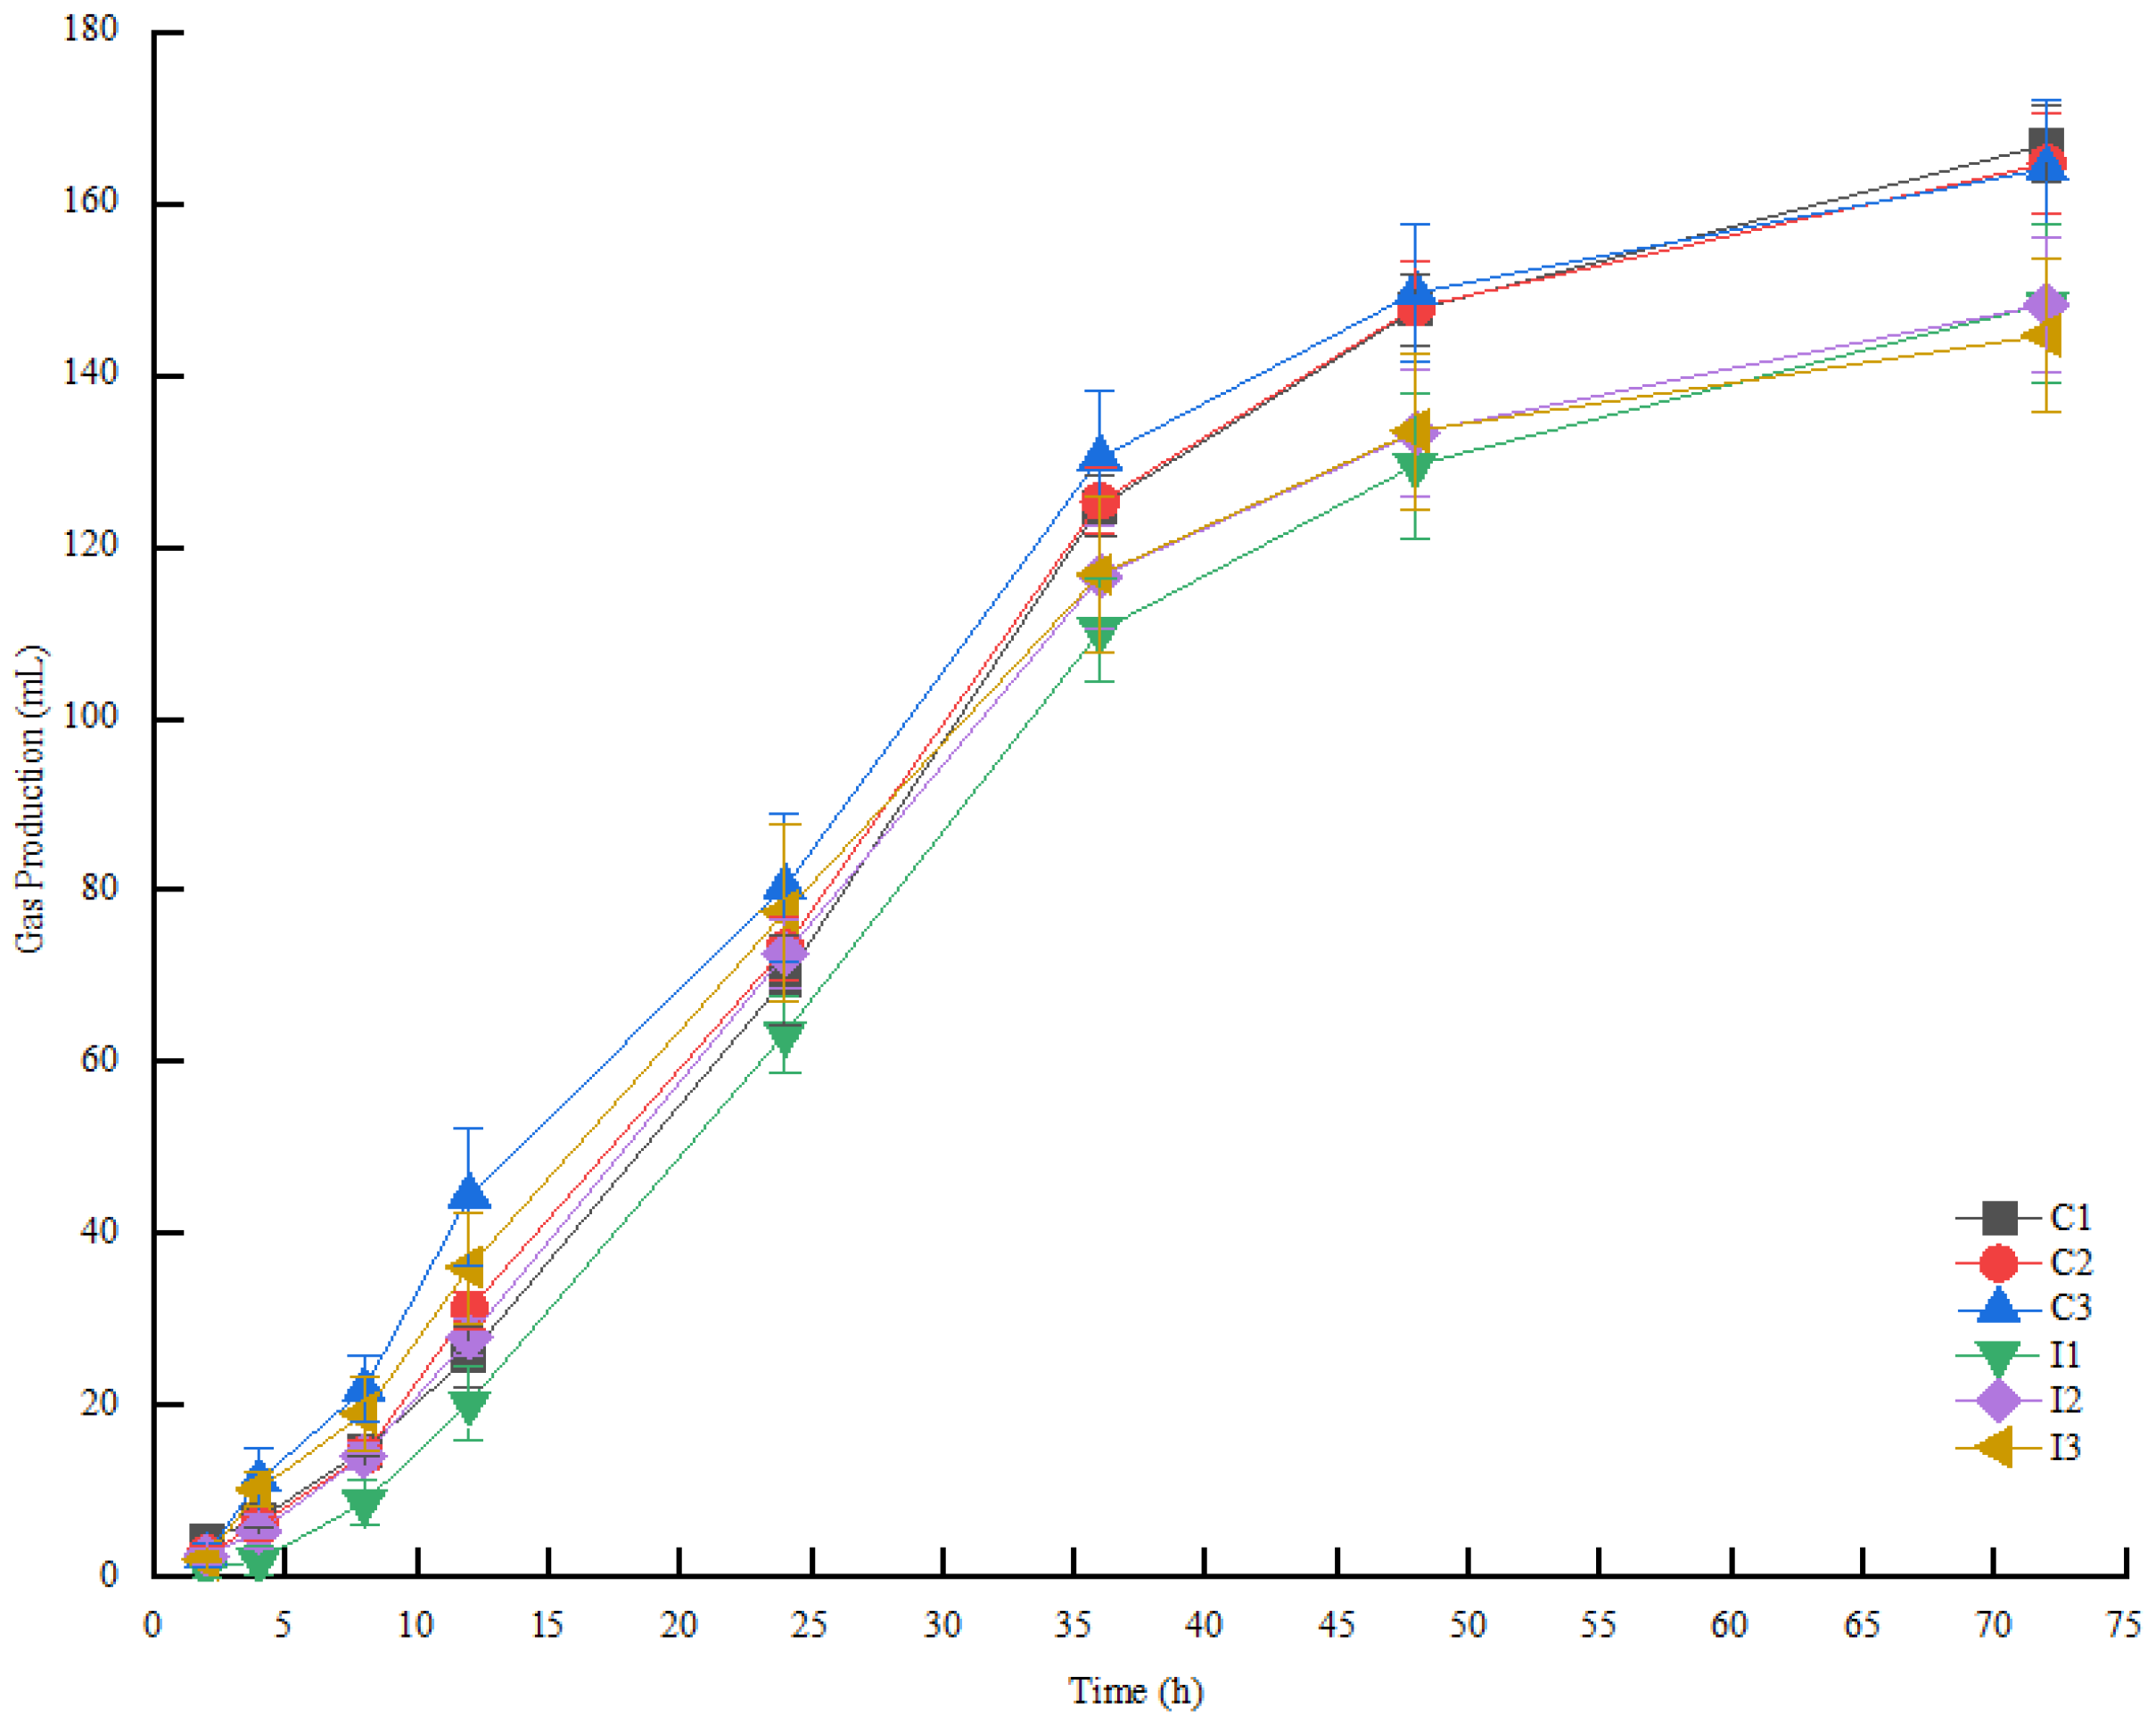
As shown in Table 9 and Figure 1, in the first 24 h, the gas production of the I1 group was significantly lower than that of the C1 group (p < 0.05), but, in 24 h~72 h, the gas production of the IN group was lower than that of the CK group with the same proportion (p < 0.05). In 12 h~36 h, the gas production increased rapidly, and became flatter in 48 h~72 h. The gas production of the IN group was lower than that of the C1 group (p < 0.05).
Table 9.
Effect of roughage-to-concentrate ratio on gas production of FTMR with or without inoculants in vitro.
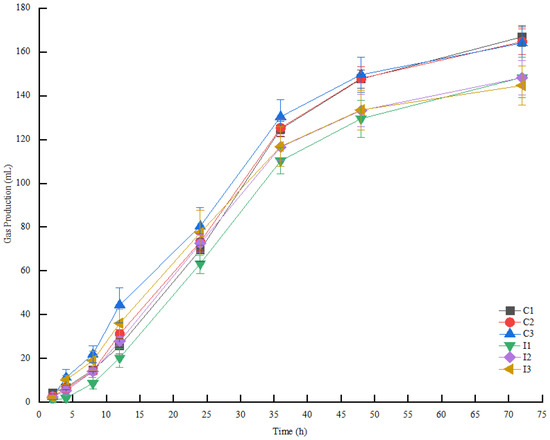
Figure 1.
Effect of roughage-to-concentrate ratio on gas production of FTMR with or without inoculants after digestion in vitro. Note: C1 represents the control group with a ratio of 65:35, C2 represents the control group with a ratio of 70:30, C3 represents the control group with a ratio of 75:25, I1 represents the inoculant group with a ratio of 65:35, I2 represents the inoculant group with a ratio of 70:30, and I3 represents the inoculant group with a ratio of 75:25.
3.6. Influence of Roughage-to-Concentrate Ratio on the Aerobic Stability of Fermentation TMR
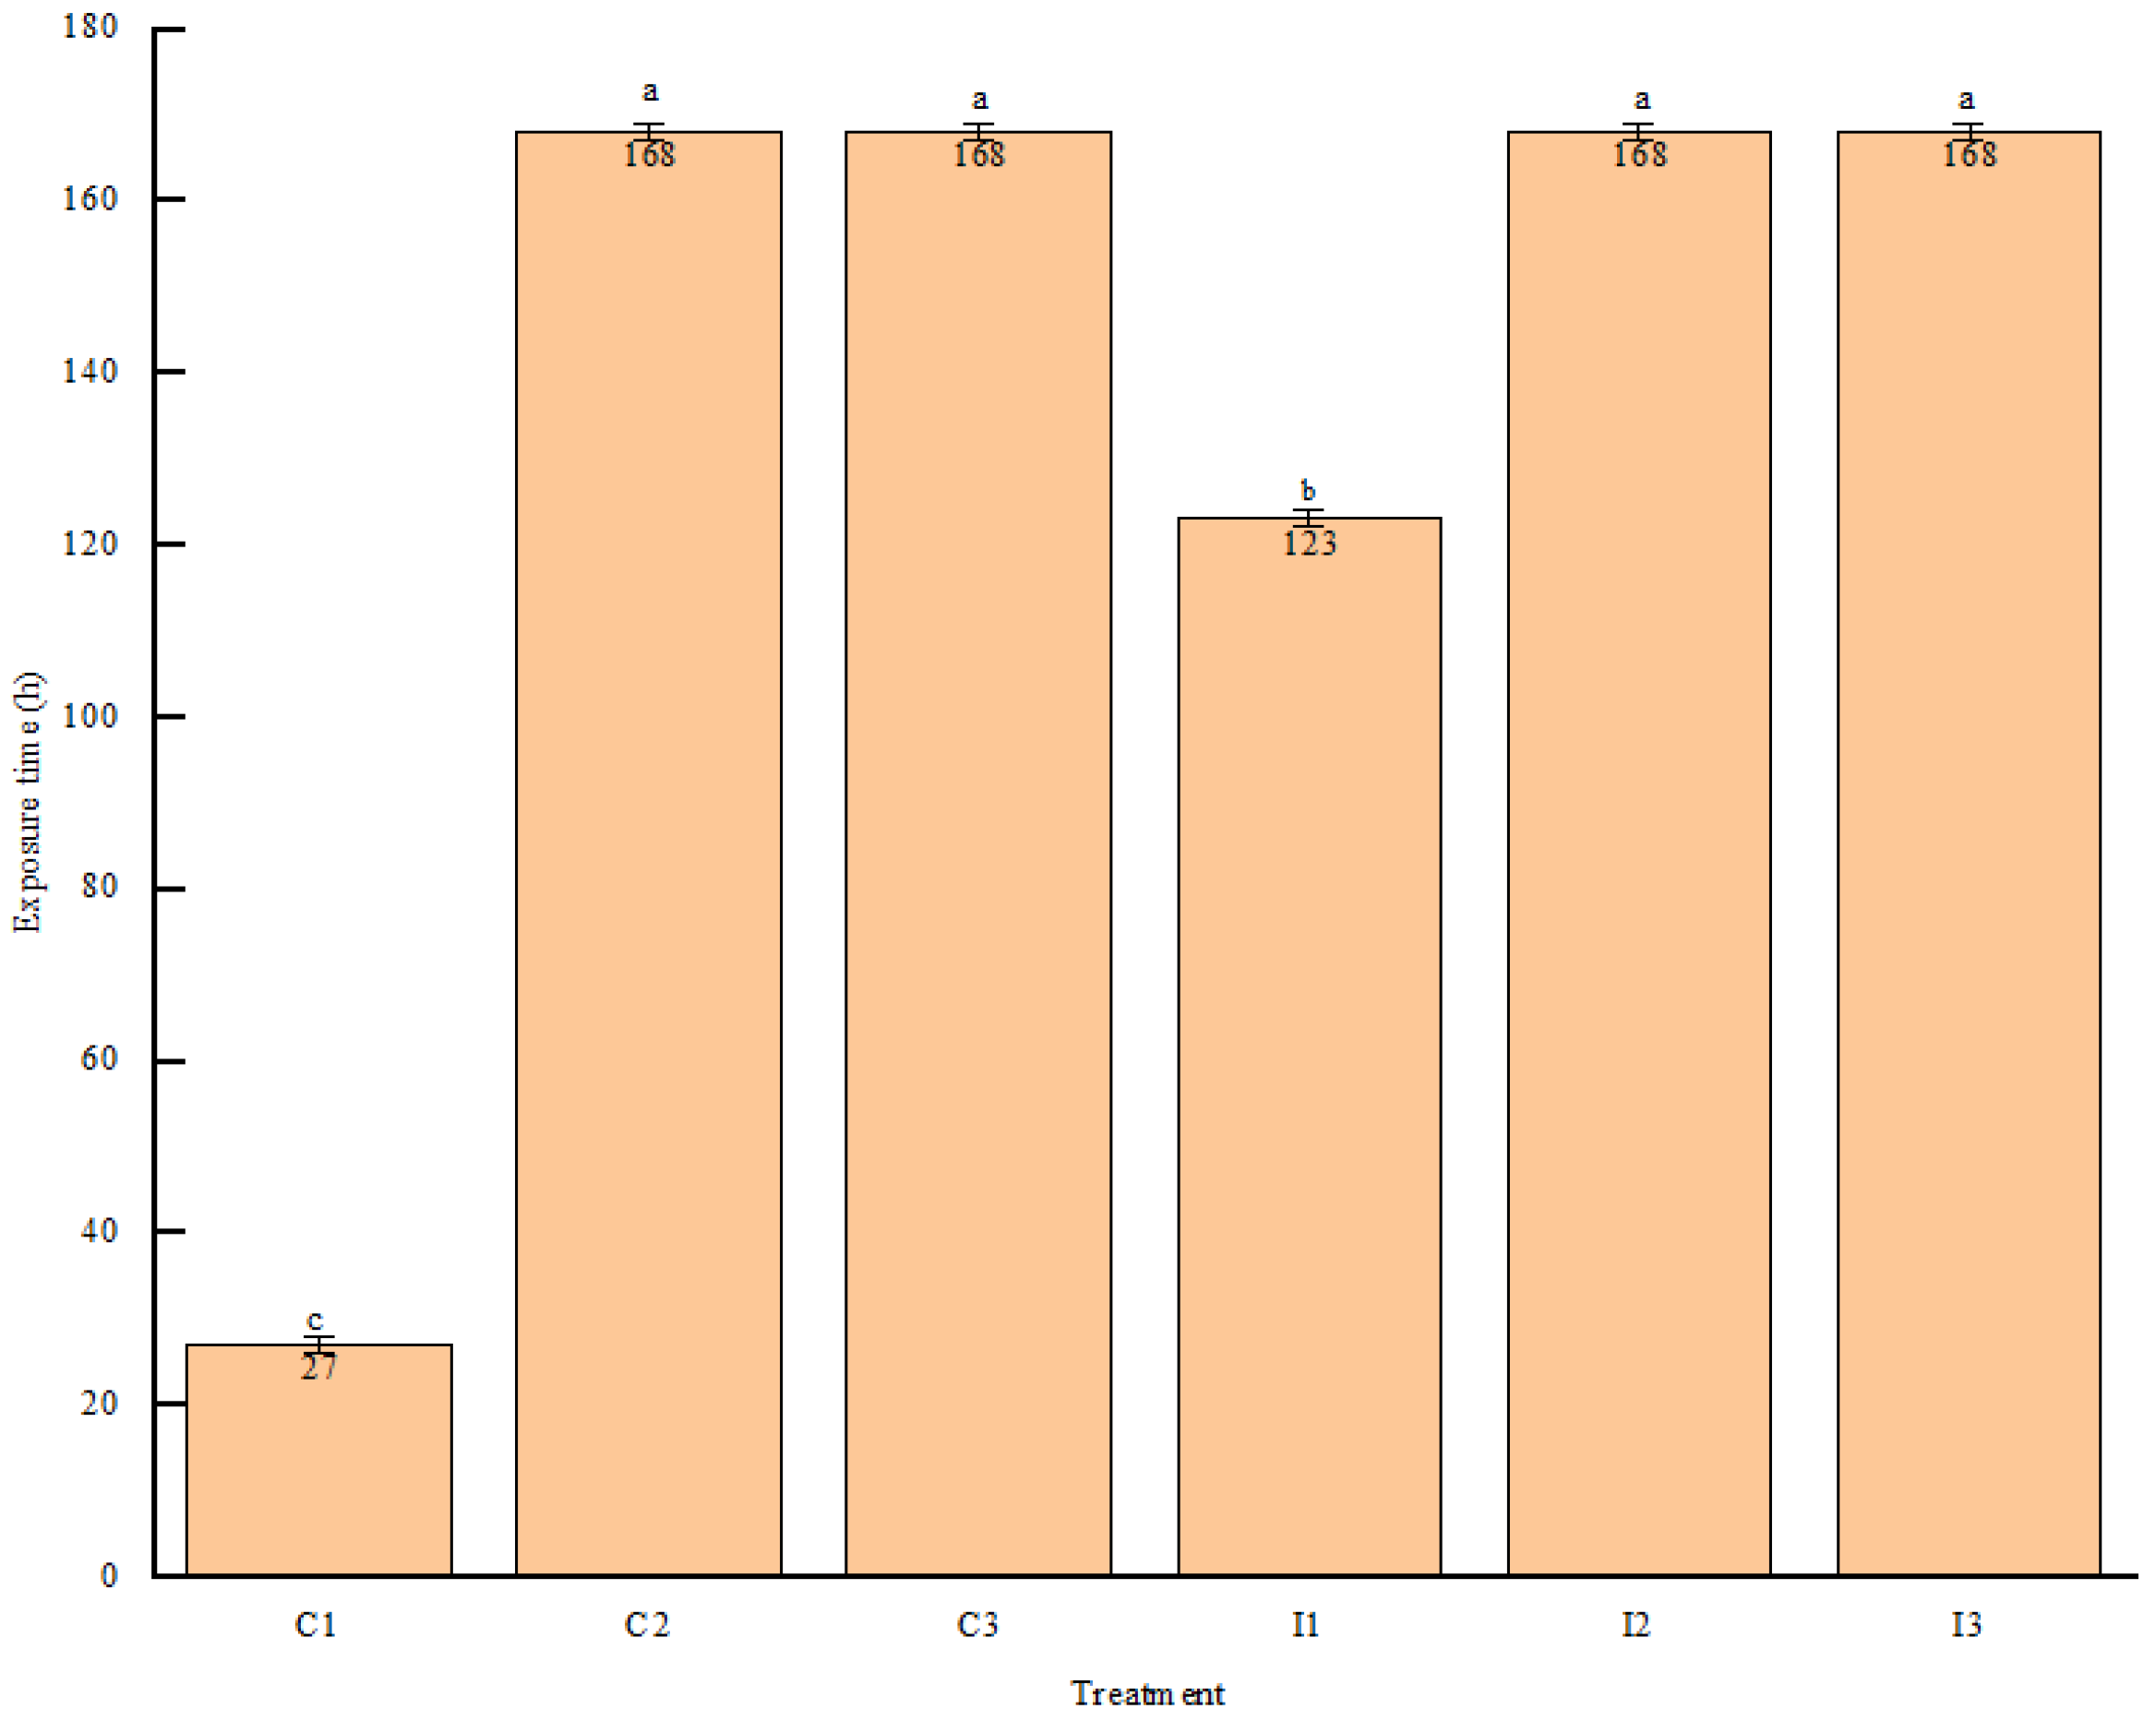
As shown in Figure 2, within the CK group, C1 exceeded the room temperature by 2 °C after 27 h of aerobic exposure, and its aerobic stability was significantly lower than that of the other groups, while the I1 group exceeded the room temperature by 2 °C after 123 h of aerobic exposure, which was effective in prolonging its aerobic stability in comparison with the CK group. None of the other groups exceeded the room temperature by 2 °C within 7 d. The other groups were more stable than the other groups.
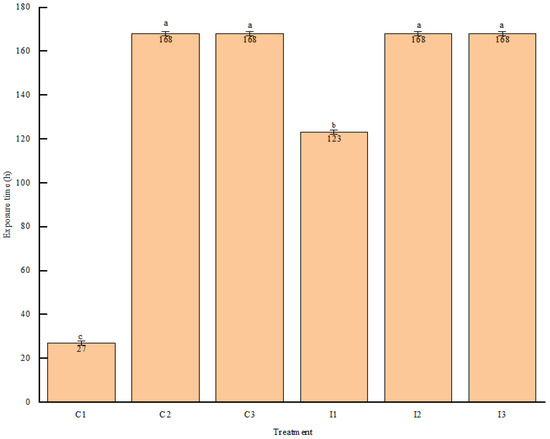
Figure 2.
Effect of roughage-to-concentrate ratio on aerobic stability of FTMR with or without inoculants. Note: C1 represents the control group with a ratio of 65:35, C2 represents the control group with a ratio of 70:30, C3 represents the control group with a ratio of 75:25, I1 represents the inoculant group with a ratio of 65:35, I2 represents the inoculant group with a ratio of 70:30, and I3 represents the inoculant group with a ratio of 75:25. Different lowercase letters above columns indicate significant difference between different groups (p < 0.05).
3.7. Fermentation Quality of Fermented TMR Exposed to Oxygen for 7 Days
As shown in Table 10, the contents of pH, NH3-N/TN, and AA were highly significantly correlated with inoculant (p < 0.01); the contents of LA were significantly correlated with ratio (p < 0.05), and pH and NH3-N/TN were highly significantly (p < 0.01) associated with their interaction. In the CK group, the highest levels of NH3-N/TN and LA were found in the C2 (roughage-to-concentrate ratio 70:30) group, and the lowest levels of acetic and propionic acid were found in the C3 (roughage-to-concentrate ratio 75:25) group (p < 0.05). In the IN group, the NH3-N/TN content decreased as the ratio of concentrate decreased.
Table 10.
Effect of roughage-to-concentrate ratio on fermentation quality of FTMR with or without inoculants exposed to oxygen for 7 days.
3.8. Microorganism Number of Fermented TMR Fermented by Silage Exposed to Oxygen for 7 Days
As shown in Table 11, yeast and mold counts were highly significantly correlated with inoculant, ratio, and interaction (p < 0.01). Within the CK group, the number of LAB was detected only within the C1 group, while yeast and mold counts were highest in the C1 group. Within the IN group, LAB was detected only in the I1 group, while the number of LAB was higher in the I1 group than in the C1 group, and the number of yeast and molds was also highest in the I1 group (p < 0.05).
Table 11.
Effect of roughage-to-concentrate ratio on microorganisms of FTMR with or without inoculants exposed to oxygen for 7 days.
4. Discussion
4.1. Fermentation Characteristics, Nutritional Quality, and Microbial Counts of Fermented TMR
Silage fermentation is a complex and dynamic system characterized by various material transformations, including both degradation and accumulation processes. According to McDonald et al. [30], a 5% to 6% loss in DM during forage silage fermentation is typically expected. In this study, the roughage-to-concentrate ratio significantly influenced DM loss, which increased proportionally with the concentrate percentage. Notably, when the concentrate ratio reached 35%, DM loss exceeded 6%, indicating that higher DM content in the FTMR poses challenges for achieving complete fermentation and stabilizing microbial activity, leading to increased DM consumption. However, the inoculation of Lactobacillus spp. in the FTMR with comparable DM content reduced DM loss to 4%, demonstrating that homofermentative Lactobacillus strains effectively promoted fermentation and inhibited microbial activity, thereby minimizing DM loss.
The pH of silage is a critical indicator of fermentation quality. In this study, an increase in the concentrate proportion corresponded to a higher pH, with the highest value reaching 4.65 in group C1. Typically, high-quality silage exhibits a pH range of 3.80 to 4.20 [20]. However, for the FTMR, an excessively low pH is undesirable as it can negatively impact palatability and potentially lead to sub-acute rumen acidosis (SARA) in ruminants [7]. Chen et al. reported that for TMR silage with high DM content (DM > 40%), a pH range of 4.0 to 5.0 is typical [31]. Conversely, an excessively high pH may fail to inhibit microbial growth, leading to increased DM loss and reduced storage stability. Therefore, further research is needed to identify the optimal pH range for the FTMR. Presently, a pH higher than 4.2 is considered acceptable for the FTMR, for it strikes a balance between effective fermentation, nutrient preservation, mold prevention, and rumen health [32]. In this study, DM in 50% FTMR inoculated with mixed Lactobacilli significantly decreased pH to 4.39, consistent with findings by Wang et al. [33]. The increase in NH3-N in silage during fermentation is typically an indicator of reduced silage quality, primarily due to the activity of Clostridium species. This increase often reflects a deviation from lactic acid fermentation, leading to enhanced proteolysis and the transformation of proteins and amino acids into compounds that are detrimental to animal health and result in greater nutrient losses [30]. However, Clostridium botulinum cannot tolerate low water activity, which is consistent with the view in grain FTMR studies that high dry matter content correlates with low Clostridium and Enterobacter activities [34]. This aligns with the undetectable BA levels observed in this study, suggesting that filamentous fungi may be the primary contributors to this protein hydrolysis [35]. Therefore, the NH3-N/TN ratio is an effective measure of protein degradation, with ammoniacal nitrogen content below 10% of total nitrogen generally indicating minimal protein degradation and better crude protein retention [36]. In this study, the roughage-to-concentrate ratio significantly impacted the NH3-N/TN content, with groups C1 and C2 exhibiting significantly higher levels compared to group C3. Similarly, group I1 had higher NH3-N/TN content than groups I2 and I3, suggesting that a higher concentrate percentage in fermented TMR led to increased crude protein content, while the elevated DM content prevented the pH from reaching a sufficiently low level, allowing for the activity of proteolytic microorganisms and subsequent protein degradation.
As anticipated, a higher concentrate percentage in fermented TMR resulted in a more nutritious composition, evidenced by elevated CP, EE, and starch levels, alongside lower NDF and ADF content.
The attachment of natural LAB to forage plays a crucial role in the fermentation process of silage [37]. In this experiment, it was observed that the number of yeasts and molds was significantly higher in group C1 compared to the other groups, indicating a positive correlation between DM content and the proliferation of yeasts and molds. This finding suggests that elevated DM content may hinder the colonization of LAB while facilitating the growth of yeasts and molds. LAB counts were significantly boosted in group I1, and yeast and mold counts were significantly decreased after inoculation with LAB, which is consistent with the results of the study conducted by Bai et al. [38].
4.2. Effect of Roughage-to-Concentrate Ratio and Lactic Acid Bacterial Agents on Carbohydrate Protein Fractions of Fermented TMR
CHO is the primary energy source for ruminants in plant-based feeds; however, the nutritional value of CHO is primarily determined by the content of CNSC, which comprises sugars rapidly fermented by rumen microorganisms [39]. CC represents the non-digestible fraction of CHO, with its content mainly linked to ADL. In this study, the CNSC contents ranged from 52% to 56%, indicating that the feeds were primarily carbohydrate-rich. Higher levels of CA, CB1, and CB2 and lower levels of CC indicate that fermented TMRs contain more carbohydrate fractions that are available in the rumen and possess higher nutritional value, positioning them as high-quality carbon sources. The significantly higher levels of CB1 and CB2 compared to CC further indicate that the fermented TMR is rich in soluble polysaccharides such as starch, pectin, and hemicellulose, as well as degradable structural CHO. The study also revealed that the ratio of roughage to concentrate significantly influenced the CHO content; specifically, a lower proportion of concentrate was associated with a higher CHO content. This is likely due to the lower CHO content in concentrates, which has a minimal impact on the fiber fraction, as reflected by the NDF content in the conventional nutrient composition. Additionally, the use of Lactobacillus agents did not have a significant effect on the carbohydrate fraction of the fermented TMR.
The primary component of PA is NPN, which can be utilized by rumen microorganisms in ruminants to synthesize microbial proteins from the ammonia produced during its rapid degradation, thereby providing significant nutritional value to the host animal [40]. In this study, the PA content in the fermented TMRs were consistently below 7%, indicating a low NPN level and suggesting a higher proportion of true protein. The ratio of roughage to concentrate significantly influenced PA content, with the group receiving the highest amount of concentrate exhibiting lower PA content, higher true protein content, and thus greater nutritional value. PB1 is easily and rapidly degraded in the rumen, with part of it being fermented and another part progressing to subsequent sections of the digestive tract. Feed proteins that are readily degraded in the rumen serve as a primary nitrogen source for microbial protein synthesis by rumen microorganisms, offering high nutritional value to ruminants. In this experiment, the content of PB1 was notably high, with its lowest value exceeding 40%. The ratio of roughage to concentrate significantly impacted the PB1 content of the fermented TMR, with the group receiving the most concentrate also showing higher PB1 levels. Therefore, adding more concentrate when preparing the fermented TMR may be beneficial. The content of PB2 is dependent on the relative rates of digestion and passage, while the PB3 content is related to cell wall structure; both PB2 and PB3 are soluble in acidic washing solutions and are slowly degraded in the rumen [41]. The PB2 and PB3 fractions can enter the small intestine and contribute to rumen protein formation, which positively influences livestock production performance. In this experiment, the content of PB2 and PB3 ranged from 20% to 40%, indicating that the rumen-undegraded proteins in the fermented TMR were lower than the rumen-degraded proteins. However, these proteins were eventually digested and utilized by the animals upon entry into the digestive tract. The PC fraction, mainly composed of ADIP, is indigestible and cannot be utilized by rumen microorganisms or ruminants, classifying it as an unavailable protein. A lower PC content corresponds to a higher biological potency of the protein. In this study, the content of PC was below 19%. The effects of the roughage-to-concentrate ratio and Lactobacillus agents on the PC content did not exhibit consistent patterns, necessitating further research to elucidate its variation and reduce the PC content in the fermented TMR.
4.3. In Vitro Digestive Properties of Fermented TMR
Ruminal fluid pH is a key indicator of rumen fermentation status, reflecting the overall condition of microorganisms, metabolites, and the production, absorption, and excretion of organic acids [42]. Studies have established that the optimal range of ruminal fluid pH in in vitro fermentation experiments is between 5.5 and 7.5 [43]. In this experiment, ruminal fluid pH ranged from 6.15 to 6.34, indicating that neither a 35% concentrate inclusion in the fermented TMR nor the addition of lactic acid bacteria had any adverse effects on the rumen environment. NH3-N is a product of rumen nitrogen metabolism and is influenced by several factors, including dietary protein degradation, microbial synthesis rates, uptake by rumen epithelial cells, endogenous nitrogen turnover, the rate of passage, and energy levels [44]. Grummer et al. reported that both excessively high and low concentrations of NH3-N in the rumen are detrimental to microbial growth and reproduction, with an optimal range of 6.3 mg/dL to 27.5 mg/dL [45]. In this study, the NH3-N levels ranged from 12.33 mg/dL to 17.7 mg/dL, which falls within the optimal range reported in the literature.
In vitro fermentation gas production is positively correlated with the content of fermentable carbohydrates in the feed and the activity of rumen bacteria. The fermentable carbohydrate content of feedstuffs is influenced by the intrinsic nutritional properties of the raw materials, while rumen microbial activity is determined by the energy–nitrogen balance within the rumen. This balance, specifically the degree of synchronization and coordination between the rates of carbohydrate fermentation and protein degradation, directly impacts microbial activity and, consequently, gas production [46]. Rodriguez et al. reported that the fermentation of dietary carbohydrates in the rumen generates significant amounts of gases, primarily hydrogen (H2), carbon dioxide (CO2), and methane (CH4) [47]. In this experiment, gas production in each treatment group increased with prolonged fermentation time, with the rate of gas production being most rapid between 12 and 36 h. Beyond 36 h, the rate of gas production began to decelerate, likely due to the substantial depletion of carbohydrates and proteins, the primary substrates for fermentation gas production, resulting in a decreased fermentation rate.
Although the group with a higher concentrate content exhibited greater gas production than the group with a lower concentrate content, the difference was not statistically significant. Previous studies have suggested that feeds with high NDF content, which is characterized by rapid fermentation and high gas production, include sugars, starch, pectin, lipids, and proteins. The higher the content of CNSC in the feed, the greater the gas production [48]. In this study, the CNSC content was higher in the group with a 65:35 roughage-to-concentrate ratio (on a dry matter basis), which corresponded to higher gas production, consistent with our experimental findings. Zhang demonstrated that gas production is strongly influenced by crude protein content, with gas production increasing as the crude protein content rises [49]. However, this finding contrasts with the results of the present experiment, which may be attributed to the specific characteristics of the raw materials used. It is speculated that the minimal change in the roughage-to-concentrate ratio (a 5% increase or decrease) and the small difference in the crude protein content (approximately 1% of dry matter) were insufficient to significantly impact rumen gas production. Wang et al. reported that the addition of Lactobacillus plantarum significantly increased the rate of gas production and total GP during the early stages of corn stover fermentation [50]. Conversely, Zhang et al. found no significant effect of lactic acid bacteria treatment on the rumen degradation characteristics of the pea–oat-fermented TMR. In this experiment, the total gas production in the bacteria-inoculated group was significantly lower than in the control (CK) group, although the gas production trends were similar, with both groups exhibiting a rapid increase followed by a decrease, and no signs of incomplete fermentation were observed [51]. This outcome may be related to the specific characteristics of the raw materials used. Na et al. demonstrated that treating corn stover with silage and increasing the proportion of dietary concentrates can enhance feed digestibility and reduce methane production [52]. It is possible that the addition of bacteria in the present study facilitated the early digestion of nutrients in the fermented TMR, leading to better absorption and a reduction in CH4 and other gases, thereby lowering post-fermentation gas production in the rumen. This reduction in excessive rumen gas could mitigate discomfort in cattle and contribute to environmental protection. However, further research is needed to verify these findings.
Ruminal digestion is the primary mechanism by which ruminants process feed nutrients, making the ruminal degradation rate a crucial parameter for evaluating the digestive characteristics of feeds in these animals [53]. Ruminal digestion is essentially the fermentative breakdown of carbohydrates into gases and volatile fatty acids by rumen microorganisms. DMD significantly influences dry matter intake in ruminants, while NDFD and ADFD are key indicators used to assess the extent of structural carbohydrate decomposition, which is mainly determined by the fiber composition of the feed. Both NDFD and ADFD are vital parameters reflecting the efficiency of feed utilization by the rumen [54]. Ma et al. observed that higher crude protein content in feed promotes the growth and reproduction of beneficial bacteria, thereby increasing the ruminal degradation rate of the feed [55]. However, this finding contrasts with the results of the present experiment, likely due to differences in the characteristics of the raw materials used. In this experiment, the CPD was higher with a roughage-to-concentrate ratio of 75:25 (dry matter basis). The CPD of the feeds appeared to be dependent on the solubility of the protein fractions, with the highest PA content observed in the C3 and I3 groups. It is hypothesized that PA content may be correlated with CPD, warranting further investigation.
Research has shown that lactic acid bacteria additives can enhance neutral detergent fiber degradation in corn stover and whole-plant corn silage [56]. Zhai et al. found that the 48 h ruminal degradation rates of neutral detergent fiber and acid detergent fiber were significantly higher in all compound bacterial preparation groups compared to the CK group [57]. In the present study, CPD was higher in all inoculated groups compared to the CK group, while NDFD and ADFD were significantly higher in the I2 and I3 groups compared to the C2 and C3 groups. Additionally, DMD was significantly higher in the I1 and I2 groups compared to the C1 and C2 groups. Although the degradation rates in other bacteria-inoculated groups were lower than in the CK group, the differences were not statistically significant. These results suggest that lactic acid bacterial agents can significantly enhance ruminal degradation rates. The underlying mechanism is likely related to the microbial action that disrupts the microstructure of the cell wall, loosening the fiber structure by breaking the carbon chains between cellulose molecules. This reduction in cell wall resistance facilitates the attachment of rumen microorganisms and the production of digestive enzymes. Furthermore, the use of lactic acid bacterial agents may alter the relative ratio of fiber components during TMR fermentation, making the nutrients more readily digestible by ruminants. This hypothesis aligns with the findings of Li et al. [58]. Therefore, inoculating specific doses of lactic acid bacterial agents during silage preparation appears to be an effective strategy to enhance the ruminal degradation rate of roughage.
4.4. Aerobic Stability of Fermented TMR
Under aerobic exposure, silage undergoes a rapid proliferation of aerobic microorganisms such as yeasts and molds, which utilize soluble sugars, proteins, and lactic acid as nutrient sources. The metabolic processes of these microorganisms generate substantial heat, leading to a rapid increase in the pH and temperature of the silage, ultimately causing spoilage and mold growth [59]. The aerobic stability of silage is generally assessed by measuring the time it takes for the internal temperature of the silage to rise more than 2 °C above room temperature.
In this experiment, as the duration of aerobic exposure increased, there was a decrease in the number of lactic acid bacteria, while the populations of yeasts and molds increased. Concurrently, both pH and NH3-N/TN content gradually rose, consistent with the findings of Drouin et al. [60]. It is important to note that not all aerobic microorganisms in silage originate from the external environment; the process of aerobic exposure creates favorable conditions for the proliferation of aerobic microorganisms already present in the fermentation system. At low pH levels, the growth and reproduction of yeasts are inhibited; however, under aerobic conditions, the pH tolerance range for yeasts expands, leading to an increase in their population [61]. The gradual decline in the number of lactic acid bacteria with extended aerobic exposure can be attributed to the multiplication of acid-tolerant aerobic microorganisms, which utilize LA and other substrates to raise the pH. This shift in pH allows acid-intolerant microorganisms to proliferate, ultimately leading to the dominance of harmful microorganisms and a corresponding decrease in lactic acid bacteria. The high WSC content in silage contributes to the decline in dominant lactic acid bacteria and the increase in yeasts, molds, and aerobic bacteria, resulting in reduced aerobic stability. These observations align with the findings of Qiu et al. [62].
In this study, the C1 group exceeded room temperature by 2 °C after 27 h of aerobic exposure, whereas the I1 group took 123 h to reach the same threshold, indicating a significant improvement in the aerobic stability of the fermented TMR. Li et al. demonstrated that Lactobacillus plantarum 160, Lactobacillus pentosus 260 [63], and Lactobacillus buchneri [64] can enhance the aerobic stability of silage, a finding consistent with the results of this experiment. In this experiment, the aerobic stability of the fermented TMR increased as the proportion of concentrate decreased. The C1 group exhibited the poorest aerobic stability, maintaining room temperature (25 °C) for only 27 h, whereas neither the C2 nor C3 groups exceeded room temperature by 2 °C during 168 h of storage. Additionally, a higher proportion of concentrate results in a lower forage content, thereby reducing the number of lactic acid bacteria introduced by the forage, which negatively impacts the aerobic stability of the fermented TMR. The soluble carbohydrate content in the C1 group was significantly higher than in the other groups even before aerobic exposure, likely due to the conversion of other fibers or starches into WSC by yeasts and molds, exacerbating the spoilage of the fermented TMR.
The large bale silage (approximately 800 kg) formulated according to this recipe has been applied in production, making full use of forage grown on winter fallow fields and local straw resources. It has contributed scientific evidence to the development of local agriculture and livestock industries.
5. Conclusions
In total mixed rations (TMRs) with varying roughage-to-concentrate ratios, a higher proportion of concentrate can enhance the nutritional quality of the fermented TMR and promote ruminal degradation. The addition of LAB inoculants improved fermentation quality and aerobic stability, thereby better preserving the nutritional components. Research indicates that when the roughage-to-concentrate ratio is 65:35, the nutritional quality and ruminal degradation rate of the fermented TMR are optimal; however, the addition of LAB inoculants is essential to ensure stable fermentation of the TMR feed.
Author Contributions
Conceptualization, R.B., S.W., and H.G.; data curation, R.B. and S.W.; formal analysis, R.B., S.W., and H.L.; funding acquisition, Y.C., S.C., Y.H., and H.G.; investigation, S.C. and H.G.; methodology, R.B., S.W., H.L., and H.G.; resources, S.C., Y.C., Y.H., and H.G.; software, R.B. and S.W.; supervision, H.G; validation, R.B. and H.L.; writing—original draft, R.B. and S.W.; writing—review and editing, H.G. All authors have read and agreed to the published version of the manuscript.
Funding
This work was supported by Youth Project of National Natural Science Foundation of China (32301507); Qinghai Province Key R&D and Transformation Plan: Research on Key Technologies for High-quality Oat Production and Yak Transformation and Utilization (2022-NK-130); Sichuan Province Merit-based Funding Project for Returned Overseas Students ([2023] No. 703); Talent Introduction Project (RQD2022032); Sichuan Province Beef Cattle Innovation Team Construction Special Fund (CXTD2019-13).
Institutional Review Board Statement
Not applicable.
Informed Consent Statement
Not applicable.
Data Availability Statement
All data are available on request to corresponding author.
Conflicts of Interest
The authors declare no conflicts of interest.
References
- Xiong, Y.; Guo, C.; Wang, L.; Chen, F.; Dong, X.; Li, X.; Ni, K.; Yang, F. Effects of paper mulberry silage on the growth performance, rumen microbiota and muscle fatty acid composition in hu lambs. Fermentation 2021, 7, 286. [Google Scholar] [CrossRef]
- Wang, G.G.; Wang, M.L.; Wang, J.M.; Yang, C.; Wang, W.J. Basis, Prospects and Suggestions for the Development of Pasture Industry in Southern China. Grassl. Sci. 2015, 32, 2114–2121. [Google Scholar]
- Xu, L.; Tang, G.; Wu, D.; Zhang, J. Yield and nutrient composition of forage crops and their effects on soil characteristics of winter fallow paddy in South China. Front. Plant Sci. 2024, 14, 1292114. [Google Scholar] [CrossRef] [PubMed]
- Zhao, M.; Feng, Y.; Shi, Y.; Shen, H.; Hu, H.; Luo, Y.; Xu, L.; Kang, J.; Xing, A.; Wang, S.; et al. Yield and quality properties of silage maize and their influencing factors in China. Sci. China Life Sci. 2022, 65, 1655–1666. [Google Scholar] [CrossRef]
- Vlachostergios, D.N.; Lithourgidis, A.S.; Dordas, C.A. Agronomic, forage quality and economic advantages of red pea (Lathyrus cicera L.) intercropping with wheat and oat under low-input farming. Grass Forage Sci. 2018, 73, 777–778. [Google Scholar] [CrossRef]
- Xu, C.C. Modern Silage Theory and Technology; Science Publishing House: Beijing, China, 2013; p. 50. [Google Scholar]
- Gao, R.; Luo, Y.; Xu, S.; Wang, M.; Sun, Z.; Wang, L.; Yu, Z. Effects of Replacing Ensiled-Alfalfa with Fresh-Alfalfa on Dynamic Fermentation Characteristics, Chemical Compositions, and Protein Fractions in Fermented Total Mixed Ration with Different Additives. Animals 2021, 11, 572. [Google Scholar] [CrossRef]
- Paradhipta, D.; Seo, M.; Jeong, S.; Joo, Y.; Lee, S.; Seong, P.; Lee, H.; Kim, S. Antifungal and carboxylesterase-producing bacteria applied into corn silage still affected the fermented total mixed ration. Anim. Biosci. 2023, 36, 720–730. [Google Scholar] [CrossRef]
- Bueno, A.V.I.; Lazzari, G.; Jobim, C.C.; Daniel, J.L.P. Ensiling total mixed ration for ruminants: A review. Agronomy 2020, 10, 879. [Google Scholar] [CrossRef]
- Ribeiro, G.O.; Gruinger, R.J.; Badhan, A.; McAllister, T.A. Mining the rumen for fibrolytic feed enzymes. Anim. Front. 2016, 6, 206. [Google Scholar] [CrossRef]
- Chen, H.; Wang, C.; Huasai, S.; Chen, A. Effects of dietary forage to concentrate ratio on nutrient digestibility, ruminal fermentation and rumen bacterial composition in Angus cows. Sci. Rep. 2021, 11, 17023. [Google Scholar] [CrossRef]
- Wang, F.J.; Nishino, N.; Wang, J.Y. Comparison of aerobic stability between normal and fermented total mixed diets. LVT 2011, 43, 27–30. [Google Scholar]
- Weinberg, Z.G.; Chen, Y.; Miron, D.; Raviv, Y.; Nahim, E.; Bloch, A.; Yosef, E.; Nikbahat, M.; Miron, J. Preservation of total mixed rations for dairy cows in bales wrapped with polyethylene stretch film—A commercial scale experiment. Anim. Feed Sci. Technol. 2011, 164, 125–129. [Google Scholar] [CrossRef]
- Dineen, M.; McCarthy, B.; Ross, D.; Ortega, A.; Dillon, B.; Van Amburgh, M.E. Characterization of the nutritive value of perennial ryegrass (Lolium perenne L.) dominated pastures using updated chemical methods with application for the Cornell Net Carbohydrate and Protein System. Anim. Feed Sci. Technol. 2021, 272, 114752. [Google Scholar] [CrossRef]
- Nie, H.; Wang, Z.; You, J.; Zhu, G.; Wang, H.; Wang, F. Comparison of in vitro digestibility and chemical composition among four crop straws treated by Pleurotus ostreatus. Asian Austral. J. Anim. 2020, 33, 24–34. [Google Scholar] [CrossRef]
- André, S.; Oliveira, Z.G.; Weinberg, I.M.; Ogunade, A.A.P.; Cervantes, K.G.; Arriola, Y.J.; Donghyeon, K.; Xujiao, L.; Mariana, C.M.; Gonçalves, D.V.; et al. Meta-analysis of effects of inoculation with homofermentative and facultative heterofermentative lactic acid bacteria on silage fermentation, aerobic stability, and the performance of dairy cows. J. Dairy Sci. 2017, 100, 4587–4603. [Google Scholar]
- Tahir, M.; Li, J.; Xin, Y.; Wang, T.; Chen, C.; Zhong, Y.; Zhang, L.; Liu, H.; He, Y.; Wen, X.; et al. Response of fermentation quality and microbial community of oat silage to homofermentative lactic acid bacteria inoculation. Front. Microbiol. 2023, 13, 1091394. [Google Scholar] [CrossRef]
- Yan, Y.; Li, X.; Guan, H.; Huang, L.; Ma, X.; Peng, Y.; Li, Z.; Nie, G.; Zhou, J.; Yang, W.; et al. Microbial community and fermentation characteristic of Italian ryegrass silage prepared with corn stover and lactic acid bacteria. Bioresour. Technol. 2019, 279, 166–173. [Google Scholar] [CrossRef]
- Ferrero, F.; Piano, S.; Tabacco, E.; Borreani, G. Effects of conservation period and Lactobacillus hilgardii inoculum on the fermentation profile and aerobic stability of whole corn and sorghum silages. J. Sci. Food Agr. 2019, 99, 2530–2540. [Google Scholar] [CrossRef]
- Silva, E.B.; Smith, M.L.; Savage, R.M.; Polukis, S.A.; Drouin, P.; Kung, L. Effects of Lactobacillus hilgardii 4785 and Lactobacillus buchneri 40788 on the bacterial community, fermentation and aerobic stability of high-moisture corn silage. J. Appl. Microbiol. 2021, 130, 1481–1493. [Google Scholar] [CrossRef]
- AOAC (Association of Official Analytical Chemists). Official Methods of Analysis, 15th ed.; Association of Official Analytical Chemists: Arlington, TX, USA, 1995. [Google Scholar]
- Li, F.; Ding, Z.; Ke, W.; Xu, D.; Zhang, P.; Bai, J.; Mudassar, S.; Muhammad, I.; Guo, X. Ferulic acid esterase-producing lactic acid bacteria and cellulase pretreatments of corn stalk silage at two different temperatures: Ensiling characteristics, carbohydrates composition and enzymatic saccharification. Bioresour. Technol. 2019, 282, 211–221. [Google Scholar] [CrossRef]
- Van Soest, P.J.; Robertson, J.B.; Lewis, B.A. Methods for dietary fiber, neutral detergent fiber, and nonstarch polysaccharides in relation to animal nutrtion. J. Dairy Sci. 1991, 74, 3583–3597. [Google Scholar] [CrossRef]
- Thomas, T.A. An automated procedure for the determination of soluble carbohydrates in herbage. J. Sci. Food Agric. 1977, 28, 639–642. [Google Scholar] [CrossRef]
- Zhao, Y.B.; Yu, J.D.; Liu, J.J.; Yang, H.Y.; Gao, L.J.; Yuan, X.F.; Cui, Z.J.; Wang, X.F. Material and microbial changes during corn stalk silage and their effects on methane fermentation. Bioresour. Technol. 2016, 222, 89–99. [Google Scholar] [CrossRef]
- Broderick, G.A.; Kang, J.H. Determination of ammonia and total amino acids in ruminal fluid and in vitro media. J. Dairy Sci. 1980, 63, 64–75. [Google Scholar] [CrossRef]
- Borreani, G.; Tabacco, E. The relationship of silage temperature with the microbiological status of the face of corn silage bunkers. J. Dairy Sci. 2010, 93, 2620–2629. [Google Scholar] [CrossRef]
- Ranjit, N.K.; Kung, L.J. The effect of Lactobacillus buchneri, Lactobacillus plantarum, or a chemical preservative on the fermentation and aerobic stability of corn silage. J. Dairy Sci. 2000, 83, 526–535. [Google Scholar] [CrossRef]
- Menci, R.; Coppa, M.; Torrent, A.; Natalello, A.; Valenti, B.; Luciano, G.; Priolo, A.; Niderkorn, V. Effects of two tannin extracts at different doses in interaction with a green or dry forage substrate on in vitro rumen fermentation and biohydrogenation. Anim. Feed Sci. Technol. 2021, 278, 114977. [Google Scholar] [CrossRef]
- McDonald, P.; Henderson, A.R.; Heron, S.J.E. The Biochemistry of Silage; Chalcombe Publications: Marlow, UK, 1991. [Google Scholar]
- Chen, L.; Guo, G.; Yu, C.; Zhang, J.; Shimojo, M.; Shao, T. The effects of replacement of whole-plant corn with oat and common vetch on the fermentation quality, chemical composition and aerobic stability of total mixed ration silage in Tibet. Anim. Sci. J. 2015, 86, 69–76. [Google Scholar] [CrossRef]
- Kung, L.; Shaver, R.D.; Grant, R.J.; Schmidt, R.J. Silage review: Interpretation of chemical, microbial, and organoleptic components of silages. J. Dairy Sci. 2018, 101, 4020–4033. [Google Scholar] [CrossRef]
- Wang, Z.H.; Wei, X.J. Rumen degradation rate of corn stover silage with different additives and the effect of feeding fattened frame cattle. CJAH 2002, 38, 25–26. [Google Scholar]
- Cao, Y.; Cai, Y.; Hirakubo, T.; Fukui, H.; Matsuyama, H. Fermentation characteristics and microorganism composition of total mixed ration silage with local food by-products in different seasons. Anim. Sci. J. 2011, 82, 259–266. [Google Scholar] [CrossRef] [PubMed]
- Zhang, M.; Wang, Y.; Tan, Z.; Li, Z.; Li, Y.; Lv, H.; Zhang, B.; Jin, Q. Microorganism profile, fermentation quality and rumen digestibility in vitro of maize-stalk silages produced at different maturity stages. Crop. Pasture Sci. 2017, 68, 225–233. [Google Scholar] [CrossRef]
- Haigh, P.M.; Parker, J.W.G. Effect of silage additives and wilting on silage fermentation, digestibility and intake, and on liveweight change of young cattle. Grass Forage Sci. 2010, 40, 429–436. [Google Scholar] [CrossRef]
- Chen, L.; Wang, Y.; Li, X.; Macadam, J.W.; Zhang, Y. Interaction between plants and epiphytic lactic acid bacteria that affect plant silage fermentation. Front. Microbiol. 2023, 14, 1164904. [Google Scholar] [CrossRef]
- Bai, J.; Ding, Z.; Ke, W.; Xu, D.; Wang, M.; Huang, W.; Zhang, Y.X.; Fang, L.; Guo, X.S. Different lactic acid bacteria and their combinations regulated the fermentation process of ensiled alfalfa: Ensiling characteristics, dynamics of bacterial community and their functional shifts. Microb. Biotechnol. 2021, 14, 1171–1182. [Google Scholar] [CrossRef]
- Gholizadeh, H.; Naserian, A.A.; Yari, M.; Jonker, A.; Yu, P. Crude protein fractionation, in situ ruminal degradability and FTIR protein molecular structures of different cultivars within barley, corn and sorghum cereal grains. Anim. Feed Sci. Technol. 2021, 275, 114855. [Google Scholar] [CrossRef]
- Damiran, D.; Yu, P.Q. Metabolic characteristics in ruminants of the proteins in newly developed hull-less barley varieties with altered starch traits. J. Cereal Sci. 2012, 55, 351–360. [Google Scholar] [CrossRef]
- Zheng, Y.H.; Du, W.; Huang, W.M.; Li, S.L. The rumen degradation characteristics of whole sugarcane for dairy cows and its application in substituting alfalfa, oat hay and concentrate in dairy cows’ diets. AVZS 2020, 51, 2743–2756. [Google Scholar]
- Liu, C.L.; Jiang, W.B.; Fu, Q.; Liu, D.; Fu, X.K.; Li, Z.Q. Effects of soybean flavones and genistein on rument fermentation in cows. Czech J. Anim. Sci. 2011, 47, 60–63. [Google Scholar]
- Calsamiglia, S.; Ferret, A.; Devant, M. Effects of pH and pH fluctuations on microbial fermentation and nutrient flow from a dual flow continuous culture system. J. Dairy Sci. 2002, 85, 574–579. [Google Scholar] [CrossRef]
- Kennelly, J.J.; Robinson, B.; Khorasani, G.R. Influence of carbohydrate source and buffer on rumen fermentation characteristics, milk yield, and milk composition early-lactation Holstein cows. J. Dairy Sci. 1999, 82, 2486–2496. [Google Scholar] [CrossRef]
- Grummer, R.R.; Clark, J.H.; Davis, C.L.; Murphy, M.R. Effect of ruminal ammonia-nitrogen concentration on protein degradation in situ. J. Dairy Sci. 1984, 67, 2294–2301. [Google Scholar] [CrossRef]
- Hu, L.Q.; Guo, W.T.; Zhao, X.J.; Li, Y.; Shen, Y.Z.; Cao, Y.F. Effect of different stubble heights on in vitro fermentation indexes of whole-plant corn silage as assessed by in vitro gas production. FR 2022, 45, 61–66. [Google Scholar]
- Rodriguez, M.P.; Mariezcurrena, M.D.; Mariezcurrena, M.A.; Lagunas, B.C.; Elghandour, M.M.M.Y.; Kholif, A.M.; Kholif, A.E.; Almaráz, E.M.; Salem, A.Z.M. Influence of live cells or cells extract of Saccharomyces cerevisiae on in vitro gas production of a total mixed ration. Ital. J. Anim. Sci. 2015, 14, 3713. [Google Scholar] [CrossRef]
- Wang, Y.Q.; Gou, C.L.; Chen, L.M.; Liao, Y.C.; Zhang, H.; Luo, L.L.; Ji, J.H.; Qi, Y. Solid-state fermentation with white rot fungi (Pleurotus species) improves the chemical composition of highland barley straw as a ruminant feed and enhances in vitro rumen digestibility. J. Fungi 2023, 9, 1156. [Google Scholar] [CrossRef]
- Zhang, W.J. Study on the Production of Ruminant Feed by Mixed Solid-State Fermentation of Soybean Dregs with Prion Yeast and White Ground Mold. Master’s Thesis, Northeast Agricultural University, Harbin, China, 2015. [Google Scholar]
- Wang, L.; Wang, J.; Wang, P.; Liu, C.; Li, X.; Chang, J.; Jin, S.; Yin, Q.; Zhu, Q. Effect of Corn Straw Treated with Lactobacillus plantarum and Cellulase on Ruminal Fermentation and Microbiota of Hu Sheep. Fermentation 2024, 10, 402. [Google Scholar] [CrossRef]
- Zhang, J.M.; Guan, H.; Li, H.P.; Jia, Z.F.; Ma, X.; Liu, W.H.; Chen, Y.J.; Chen, S.Y.; Jiang, Y.M.; Gan, L.; et al. Effects of mixing ratio and lactic acid bacterial agent on the quality and rumen degradation characteristics of oat-fed pea fermented TMR. J. Grass Industry 2024, 33, 169–181. [Google Scholar]
- Na, R.H.; Dong, H.M.; Tao, X.P.; Ma, R.J.; Xi, J.L. Comparison of in vitro digestive performance and methane production in dairy cows on different types of diets. JAES 2010, 29, 1576–1581. [Google Scholar]
- King, K.J.; Bergen, W.G.; Sniffen, C.J.; Grant, A.L.; Grieve, D.B.; King, V.L.; Ames, N.K. An assessment of absorbable lysine requirements in lactating cows. J. Dairy Sci. 1991, 74, 2530–2539. [Google Scholar] [CrossRef]
- Zhang, X.; Jiao, T.; Ma, S.; Chen, X.; Wang, Z.; Zhao, S.; Ren, Y. Effects of different proportions of stevia stalk on nutrient utilization and rumen fermentation in ruminal fluid derived from sheep. PeerJ 2023, 11, e14689. [Google Scholar] [CrossRef]
- Ma, J.; Sun, G.Q.; Shah, A.M.; Fan, X.; Li, S.L.; Yu, X. Effects of different growth stages of amaranth silage on the rumen degradation of dairy cows. Animals 2019, 9, 793. [Google Scholar] [CrossRef] [PubMed]
- Liu, X.; Wang, A.; Zhu, L.; Guo, W.; Guo, X.; Zhu, B.; Yang, M. Effect of additive cellulase on fermentation quality of whole-plant corn silage ensiling by a Bacillus inoculant and dynamic microbial community analysis. Front. Microbiol. 2024, 14, 1330538. [Google Scholar] [CrossRef] [PubMed]
- Zhai, J.J.; Cao, W.R. Effects of complex microbial preparations on fermentation quality of sorghum straw and its rumen degradation characteristics. Feed. Res. 2023, 46, 109–113. [Google Scholar]
- Li, M.; Zhou, H.L.; Zi, X.J.; Cai, Y.M. Silage fermentation and ruminal degradation of stylo prepared with lactic acid bacteria and cellulase. Anim. Sci. J. 2017, 88, 1531–1537. [Google Scholar] [CrossRef]
- Guan, H.; Shuai, Y.; Ran, Q.; Hong, Y.Y.; Wang, X.; Li, D.D.; Cai, Y.M.; Zhang, X.Q. The microbiome and metabolome of Napier grass silages prepared with screened lactic acid bacteria during ensiling and aerobic exposure. Anim. Feed Sci. Technol. 2020, 269, 114673. [Google Scholar] [CrossRef]
- Drouin, P.; Tremblay, J.; Renaud, J.; Apper, E. Microbiota succession during aerobic stability of maize silage inoculated with Lentilactobacillus buchneri NCIMB 40788 and Lentilactobacillus hilgardii CNCM-I-4785. Microbiol. Open 2021, 10, e1153. [Google Scholar] [CrossRef]
- Li, D.X.; Ni, K.K.; Zhang, Y.C.; Lin, Y.L.; Yang, F.Y. Influence of lactic acid bacteria, cellulase, cellulase-producing Bacillus pumilus and their combinations on alfalfa silage quality. J. Integr. Agr. 2018, 17, 2768–2782. [Google Scholar] [CrossRef]
- Qiu, C.; Yang, K.; Diao, X.; Zhang, W.; Lv, R.; He, L. Effects of kinds of additives on fermentation quality, nutrient content, aerobic stability, and microbial community of the mixed silage of king grass and rice straw. Front. Microbiol. 2024, 15, 1420022. [Google Scholar] [CrossRef]
- Li, H.; Guan, H.; Jia, Z.; Liu, W.; Ma, X.; Liu, Y.; Wang, H.; Ma, L.; Zhou, Q. Screening of freeze-thaw resistant lactic acid bacteria and their effects on silage quality and aerobic stability of oats. J. Grass Industry 2022, 31, 158–170. [Google Scholar]
- Gallo, A.; Bernardes, T.F.; Copani, G.; Fortunati, P.; Giuberti, G.; Bruschi, S.; Bryan, K.A.; Nielsen, N.G.; Witt, K.L.; Masoero, F. Effect of inoculation with Lactobacillus buchneri LB1819 and Lactococcus lactis O224 on fermentation and mycotoxin production in maize silage compacted at different densities. Anim. Feed Sci. Technol. 2018, 246, 36–45. [Google Scholar] [CrossRef]
Disclaimer/Publisher’s Note: The statements, opinions and data contained in all publications are solely those of the individual author(s) and contributor(s) and not of MDPI and/or the editor(s). MDPI and/or the editor(s) disclaim responsibility for any injury to people or property resulting from any ideas, methods, instructions or products referred to in the content. |
© 2024 by the authors. Licensee MDPI, Basel, Switzerland. This article is an open access article distributed under the terms and conditions of the Creative Commons Attribution (CC BY) license (https://creativecommons.org/licenses/by/4.0/).