Article

Simulation and Experiment of Optimal Conditions for Apple Harvesting with High Fruit Stalk Retention Rate

1
College of Metrology Measurement and Instrument, China Jiliang University, Hangzhou 310018, China
2
Engineering Training Center, China Jiliang University, Hangzhou 310018, China
*
Author to whom correspondence should be addressed.
Agriculture 2024, 14(12), 2280; https://doi.org/10.3390/agriculture14122280
Submission received: 6 November 2024 / Revised: 9 December 2024 / Accepted: 10 December 2024 / Published: 12 December 2024
(This article belongs to the Section Agricultural Technology)

Abstract

:
Apples are widely cultivated primarily for fresh consumption. During mechanized harvesting, the extraction of fruit stalks can significantly impact the storage duration of fresh apples. The tensile force applied to the abscission layers is a critical factor in retaining the stalks; yet, few researchers have focused on preventing stalk pull-out during picking. In this research, we studied the phenomenon of missing stalks during mechanical picking by analyzing the tensile force exerted on the abscission layer during picking and optimizing the attitude of the end effector to achieve the highest stalk retention rate. Firstly, the tangential and normal energy release rates of the abscission layer were used as key parameters to model the cohesive zone of the abscission layer, a finite element model of the fruit–stalk–branch system was developed, based on which the actual fruit picking process using direct-pulling and twisting was simulated. Subsequently, the data obtained from the simulation were analyzed using response surface analysis, and the maximum tensile force at the time of fracture of the delamination and the time of its fracture were used as optimization parameters to find the optimal solution of the angle, direct-pulling speed, and twisting speed d to achieve the highest stalk retention rate. Finally, through field experiments, it was demonstrated that the optimal picking conditions could effectively improve the picking success rate and stalk retention rate. The results show that, when the end effector picks close to the fruit at about 58°, the stalk retention rate can reach 94.0%.

1. Introduction

Apple harvesting is strictly regulated; a high-quality apple should have a stalk to increase fruit storage time, and the stalks need to be trimmed before placing the apples in the frame to prevent them from poking each other on the fruit surface, resulting in surface bruising. Robotic apple-harvesting robots have been in development for over thirty years and some business prototypes have been successfully built by the two dominant apple-harvesting robotics companies in the US, Abundant Robotics and FFRobotic [1]. Although there is an urgent need for mechanized harvesting technology in the fruit industry, there is still no mature robotic apple-harvesting system on the market because mechanical harvesting must be carried out in such a way that the fruit stalks are left on the fruits and the fruit surfaces cannot be damaged to take advantage of labor savings and high efficiency as a mechanized harvesting method [2,3]. The existing mechanical harvesting technology is unsuitable due to high manufacturing costs, low abscission efficiency, and the environmental problems of orchard planting. Existing mechanical picking technologies cannot be widely used due to high manufacturing costs, low abscission efficiency, and the complexity of the orchard-growing environment [4,5]. Abundant Robotics utilized a vacuum suction picking method, which offered a fast picking speed as its main advantage. However, the end effector had a limited range of motion, resulting in a higher rate of extracted apple stalks. This system is primarily suited for V-shaped fruit tree planting arrangements and struggles to pick fruits inside the canopy [6]. FFRobotics used a multi-arm collaboration system that featured a three-jawed rotary mechanism designed for apple picking. The picked apples can be placed directly onto a conveyor belt for collection, significantly enhancing picking efficiency. However, this method can easily damage the fruit, especially when picking apples attached to branches or clusters. Consequently, this system is generally more suitable for environments with structured fruit wall planting rather than unstructured plantation orchards [7]. The rising demand for harvesting and labor costs has created an urgent need to develop efficient and low-damage mechanized harvesting technologies for fresh apples to reduce labor costs and improve harvesting efficiency and fruit quality.
The apple-picking robot is mainly composed of a robotic arm and an end effector. The end effector is a component of apple picking, due to the picking process of apple clamping through the pulling and twisting picking action leading to the fruit stalk producing damage, or even simply the fact that the consequences of the fruit stalk being pulled out are difficult to avoid [8]. In past research, the end effector has been divided into four structures: the shear type, rocking suction type, vacuum suction type, and claw type. The shear method has specific requirements for the visual system and the length of the fruit stalks and is less suitable for situations with many obstacles, such as branches and leaves [9]. In the case of the shaker harvester [10] and the vacuum suction system [11,12], bruising of the fruit surface during picking was reduced. Nevertheless, the fruit stalks can be damaged or even pulled out during loading, creating a pathway for bacteria to enter the fruit [13]. In addition, the vacuum suction system may cause frequent clogging of the suction tube due to branches and leaves brought in by the fruit [6]. Bulanon and Kataoka et al. used a combination of machine vision and laser range sensors to locate apple fruits and a two-finger end effector to grasp the fruit stalk for twisting to complete the picking [14], which results in low damage to the fruit surface but has high requirements on the picking environment and the growth attitude of the fruits, due to the need to identify the position of the fruit stalk. Silwal et al. designed a three-finger automated apple-picking robot that mimics human fingers [15]. Fadiji, He et al. demonstrated that using an elastic material for the end effector in contact with the fruit can reduce the discoloration on the fruit surface [16,17]. Based on previous studies, Hohimer et al. designed and tested an end effector with a soft pneumatic end effector [18]. This improved three-finger grasping structure uses a pneumatic soft claw instead of a wire-driven end effector to avoid the surface bruising of the apple samples as well as to reduce significantly the risk of the fruit stalk being pulled out, and this claw-type end effector can be regarded as a more suitable end-effector structure for the mechanized picking of apples in the unstructured cultivation environment in China [19].
The action of fruit picking will directly affect the quality and efficiency of picking [20]. The end effector uses pulling, twisting, breaking, and shearing to separate fruits and branches. The shear method is not suitable for an unstructured growing environment in China. For the typical simulation of human picking action, scholars discuss the impact on the picking effect by simulating it and analyzing the magnitude and direction of the loads applied to the apples. Beyaz used a harvesting glove with a force-resistance sensor and image analysis technology to determine the mechanical damage to the apples [21]. Bu et al. established a mechanical system model for apple picking and investigated four basic harvesting modes, horizontal stretching, vertical stretching, bending, and twisting, for apple abscission [22]. The simulation and experimental results showed that tension parameters, including horizontal and vertical tension, were the main factors in the abscission process, and vertical tension may lead to the pulling out of the fruit stalk, and suggested that movements with bending and twisting were the optimal combination for harvesting. In addition, the picking effect under the picking method using a three-finger claw end effector is primarily related to the picking mode. Li et al. analyzed four different gripping positions for manual three-finger apple picking [23], obtaining the relationship between the torque exerted by the fingers, the pulling force, and the bending angle produced by the fruit stalk during the picking process; the action ‘pull’ was identified as the optimal action for the robotic picking maneuver. It was concluded that twist-and-pull picking requires less energy than direct picking in the direction of stem growth. Torregrosa et al. analyzed the motion of citrus fruits during shaking using a high-speed camera and image processing algorithms and concluded that the abscission force required for picking with bending–pulling is much lower than that required for purely pulling motions [24]. In conclusion, combining direct-pulling and twist picking with a claw end effector improves the picking efficiency of fresh apples and ensures a high stalk retention rate.
The current performance of apple-harvesting robots is not yet at a commercial level. However, numerous theoretical studies have been carried out on improving end-effector design and optimizing visual recognition algorithms [25]. Some proposed end-effector structures aim to enhance fruit harvesting quality and reduce bruising on the fruit surface. Most studies focus on avoiding mechanical damage or assessing the dynamic response of fruits to vibration. Fewer studies have explored the ‘optimal picking mode’ to improve the retention rate of fruit stalks. The approach angle and speed of the end-effector execution under the ‘optimal picking mode’ are areas that require further exploration. In this study, by controlling the angle of approach of the end effector and the picking action during fruit picking, the angle of the end effector to the fruit axis and the speed of mechanism actuation were searched for at the time of the minimum tensile force on the abscission layer during the picking process, while successfully picking apples, thus ensuring maximum stalk retention. The structural and mechanical parameters of the fruit stalk and branches were tested, the Cohesive Zone Model [26] was used to obtain mechanical parameters of the abscission layer, and the finite element method was used to simulate the dynamic response to the basic picking mode. Based on this, the response surface analysis method [27,28,29] was used to investigate the angle and speed of the end effector during the picking action to minimize apple damage. The simulation data were verified through field experiments to establish optimal picking methods, providing a theoretical basis for developing apple-picking robots.

2. Materials and Methods

The fruit–stalk–branch system is complex and unified, capable of adapting to changes in the growth cycle and resisting external disturbances. Its various components have different mechanical characteristics, thus requiring experimental acquisition of parameters to deeply understand the microstructure and macroscopic mechanical properties, and then establish a finite element model of the fruit–stalk–branch system [30].

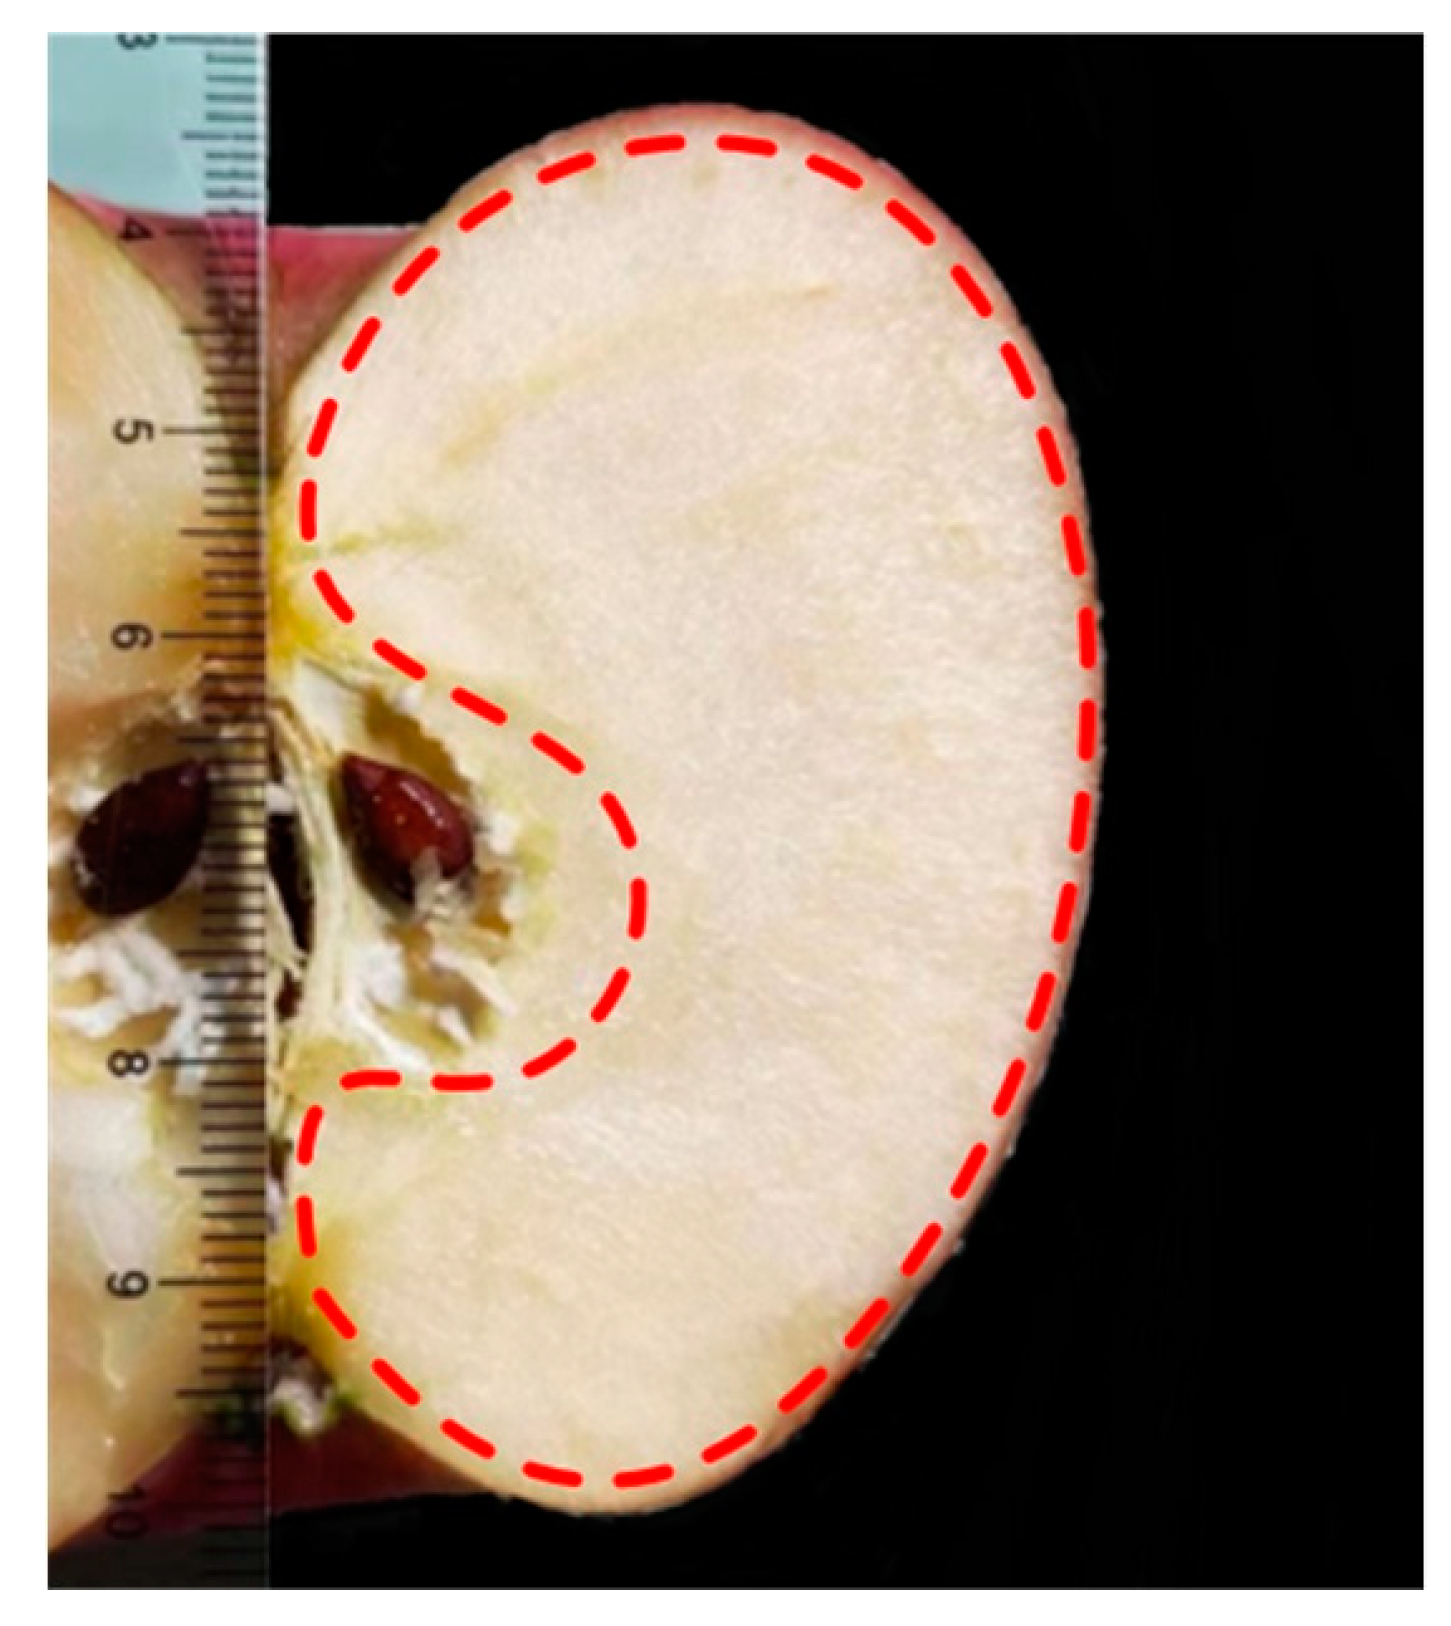
2.1. Apple Fruit Modeling

2.1.1. Geometric Feature Measurement of the Fruit

Measuring the geometric features of the apple is the basis for modeling and testing. In October 2023, field measurements were conducted on Red Fuji apples in the apple-planting base of Weihai City, Shandong Province. One hundred samples were tested: 10 apples were randomly selected from each of the 10 apple trees in the orchard. The basic geometric shape parameters of the apples are shown in Figure 1, including the radial diameter D, the axial diameter H, and the fruit stalk length L (referring to the vertical distance from the connection point of the fruit stalk to the branch). The method of parameter measurement is shown in Figure 2.
Through the measurement and calculation of 100 apple samples, the axial and radial diameters, fruit stalk length, fruit weight, and fruit shape index are shown in Table 1.
According to the data analysis, there is significant variation in apple stalk lengths, with the longest measuring 30.4 mm and the shortest at 10.1 mm. Different stalk lengths correspond to various harvesting methods. Figure 3 illustrates these data, showing that stalks shorter than 15 mm account for 29%, those between 15 mm and 25 mm account for 51%, and stalks longer than 25 mm make up 20%. The average length of the stalks is 19.3 mm. When a tool was used to cut the stalk for harvesting, precise positioning of the stalk was essential, and a larger working space for the end effector was necessary. This requirement can be challenging to meet in a non-structured environment. Additionally, vacuum adsorption harvesting can damage the fruit, making grasping harvesting the preferred method in such environments.

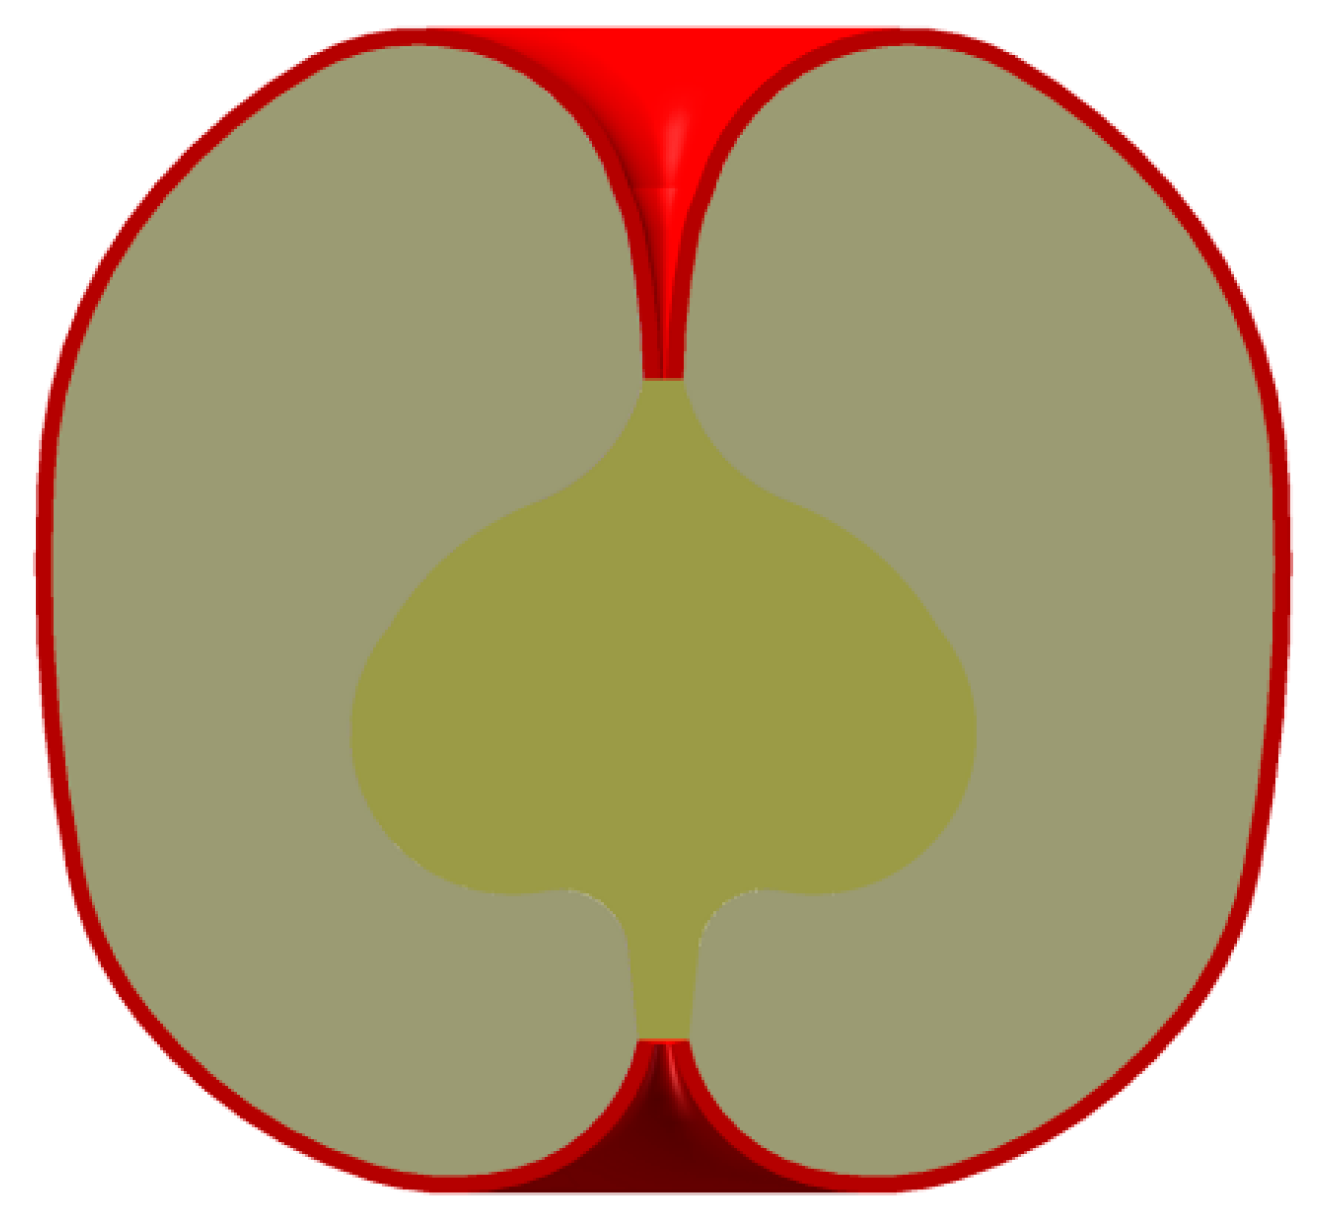
2.1.2. Apple Fruit Mode

A sample with geometric feature values near the average was selected to obtain a representative apple sample. When cut in half, the fruit can be divided into the core, flesh, and peel. By plotting the points of the cut apple fruit, the corresponding fruit outline can be obtained, as shown in Figure 4.
Using Origin 2023 software, the data points measured from the apple fruit contour were transferred to the Cartesian coordinate system to obtain the planar coordinate information of the feature points. MATLAB R2023a was used to perform curve fitting on these feature points to obtain smoother and continuous contour line data. Finally, the fitting results were imported into Solidworks 2022 software to complete the three-dimensional modeling of the apple flesh, peel, and core, and the complete apple three-dimensional model was obtained through assembly, as shown in Figure 5.

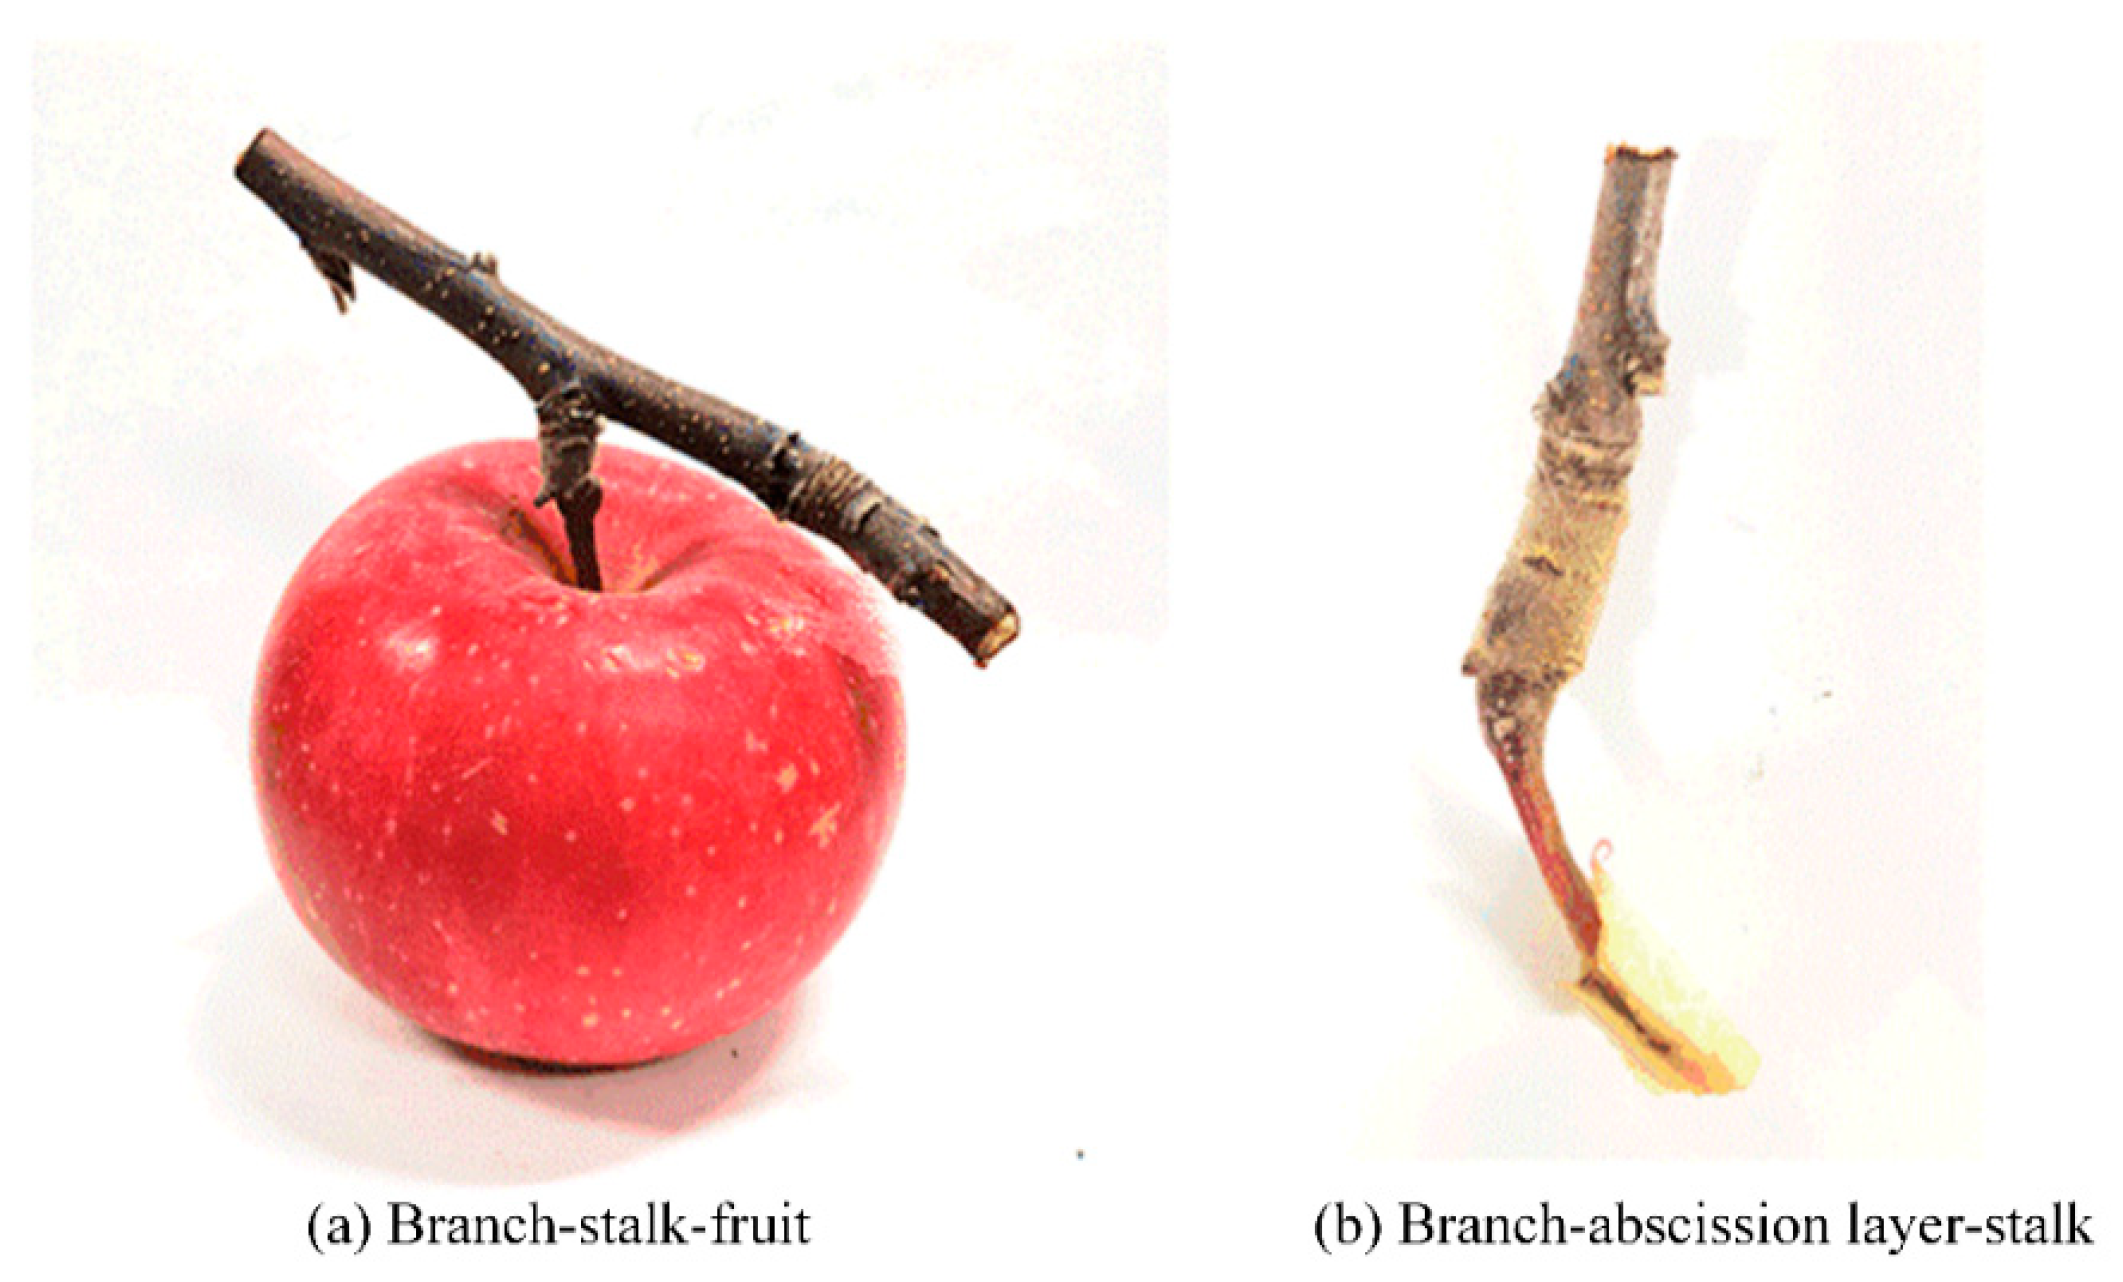
2.2. Apple Branch and Stalk Modeling

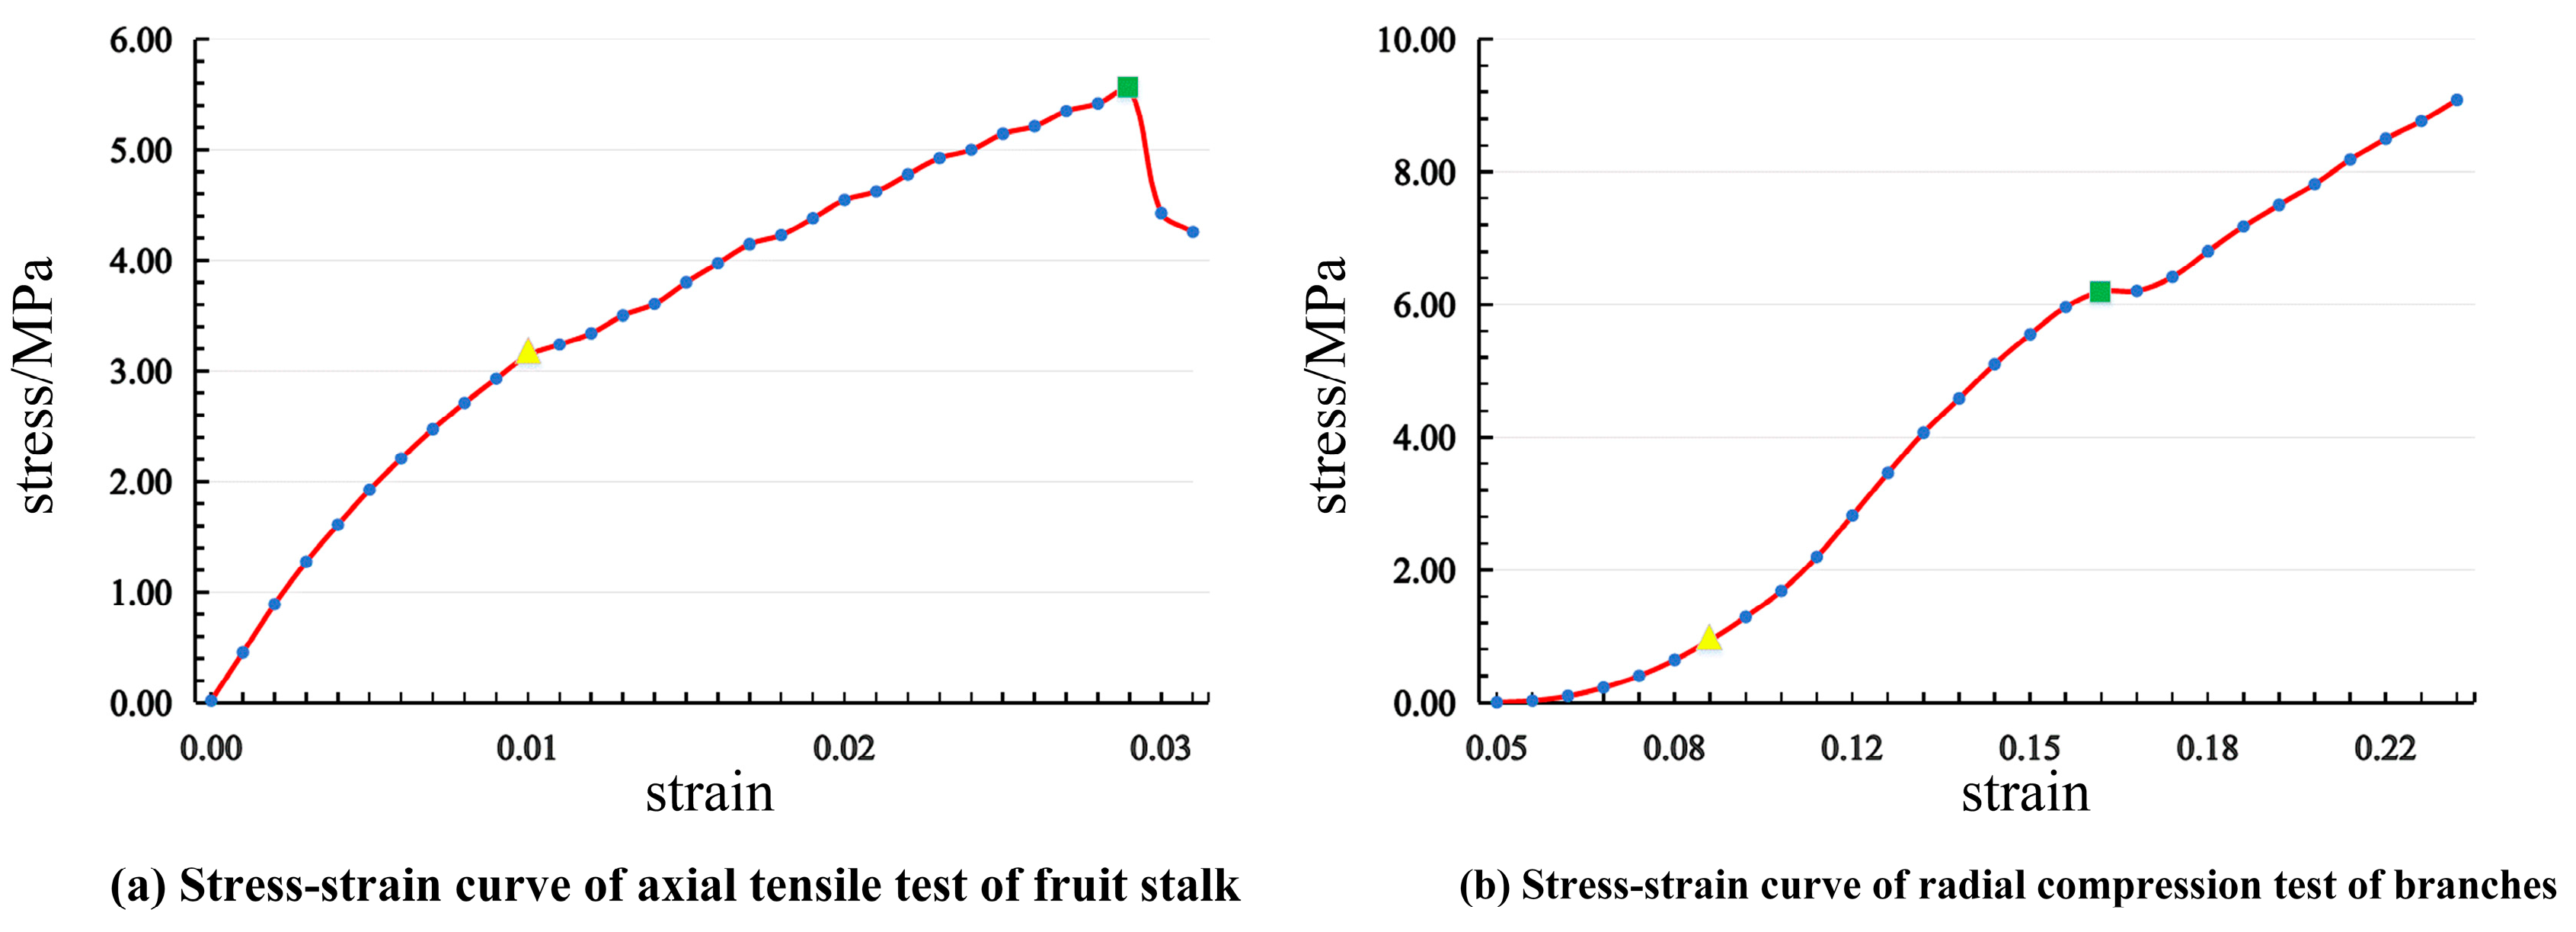
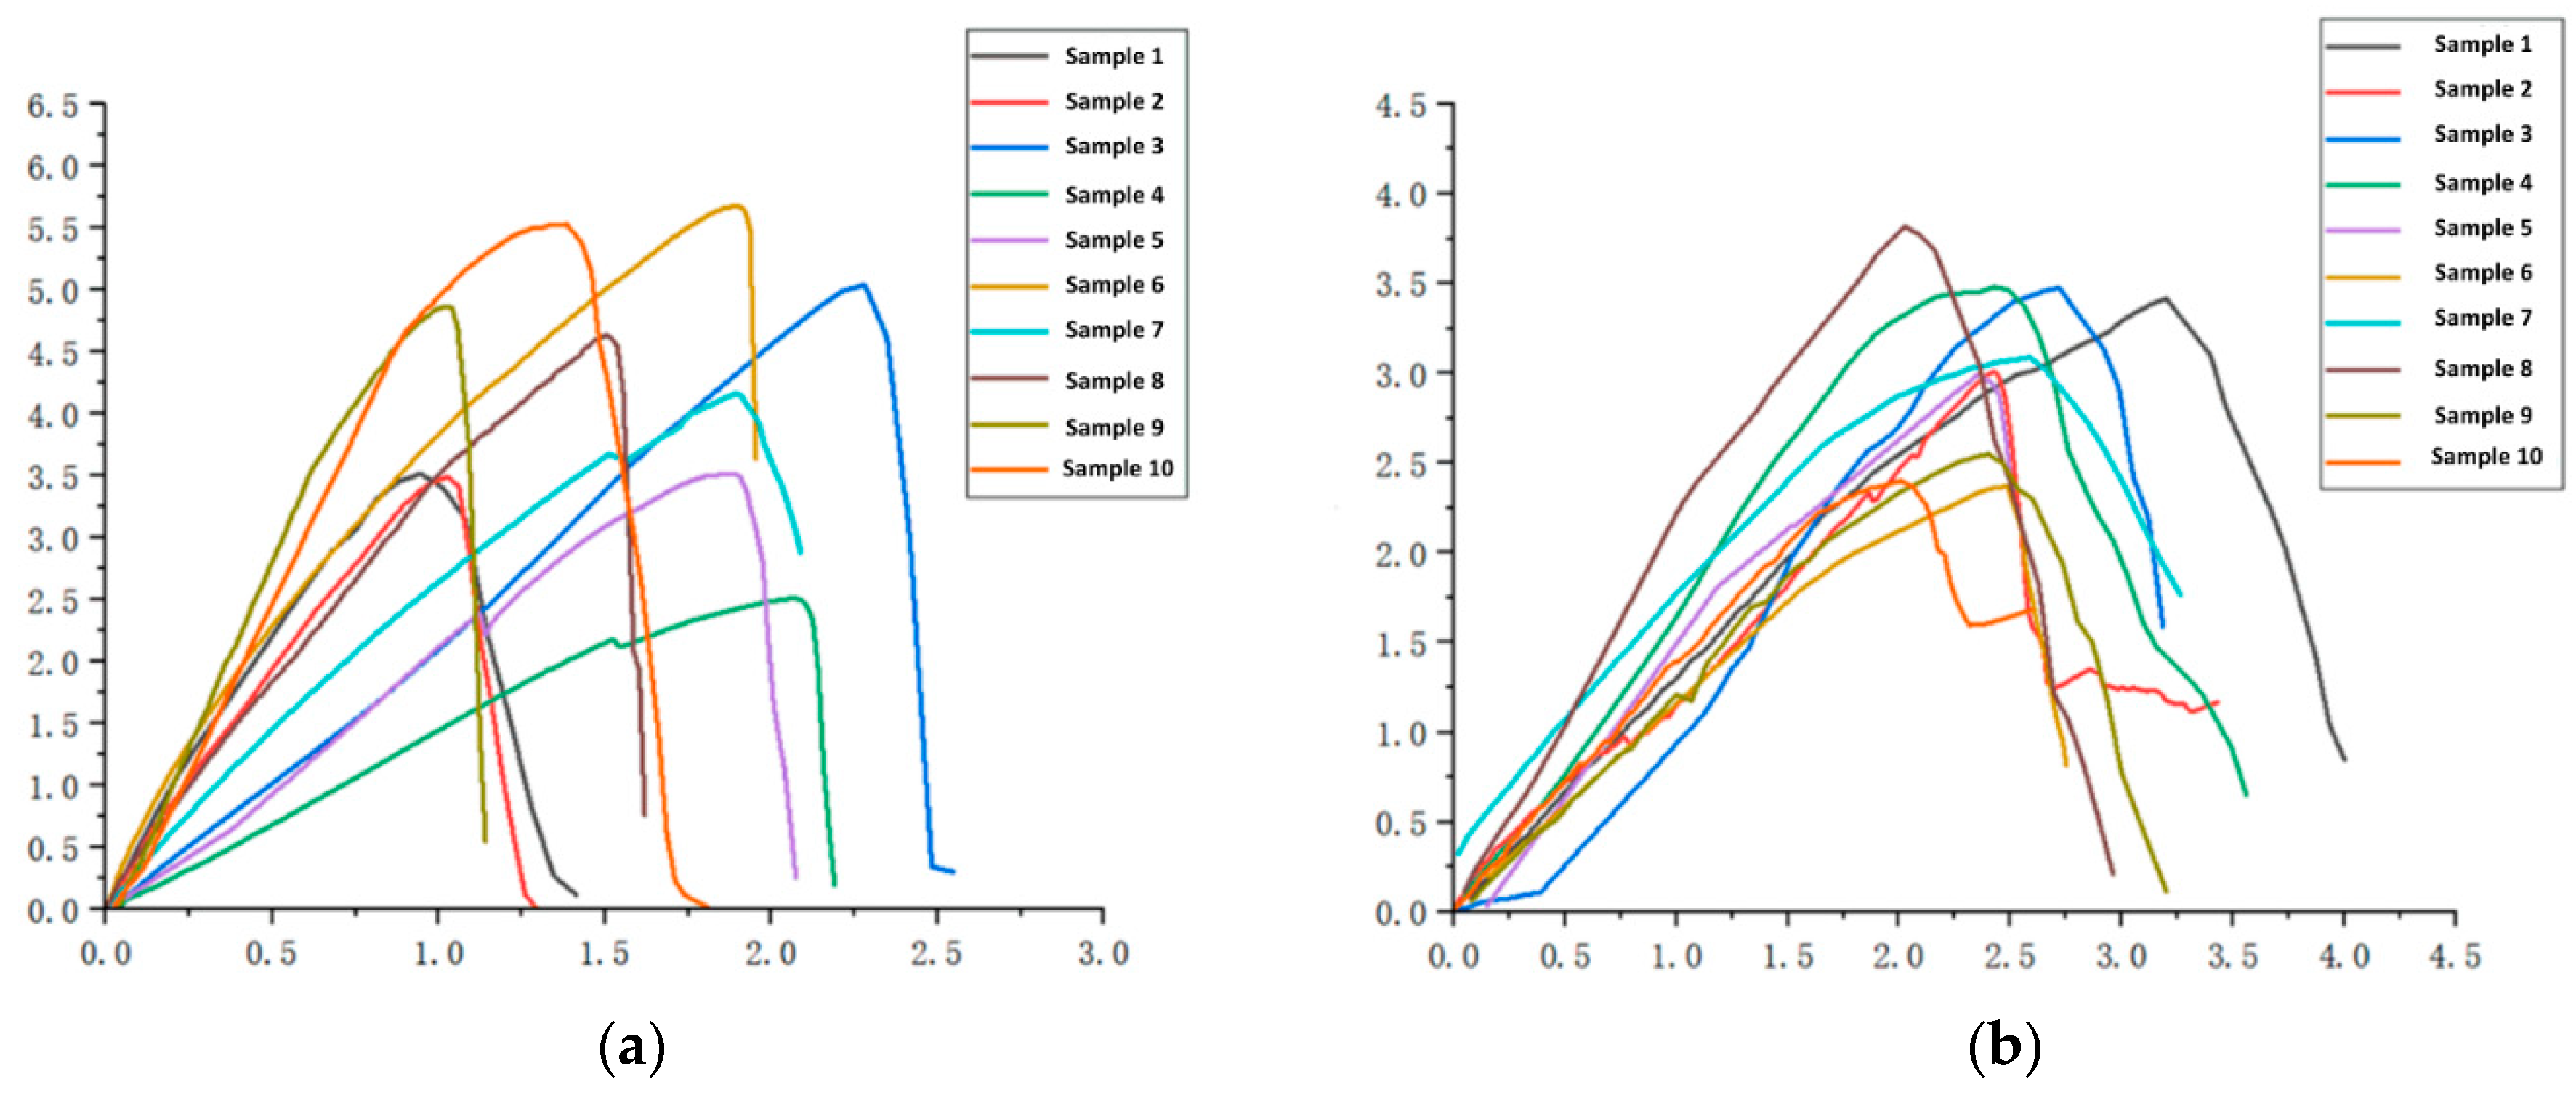
2.2.1. Mechanical Property Measurement of Branches and Stalks

Abscission experiments were conducted on the stalk and branches to obtain accurate mechanical parameters, measuring their density, elastic modulus, Poisson’s ratio, bulk modulus, shear modulus, and other relevant properties [31]. The branches primarily experienced radial forces during apple picking, while the stalks were subjected to axial forces. To simplify calculations and enhance simulation efficiency, the main parameters for the branches were designated in the radial direction, while those for the stalks were defined in the axial direction.
The samples of branches and fruit stalks used for testing were taken from the Jingxiang Fruit and Vegetable Orchard in Weihai, Shandong Province, and the varieties were Red Fuji fruit trees. The samples were at fruit maturity (harvest time for the farmers) and all samples were picked within one day. The test branches were 30 mm before and after the fruiting branches, and the test samples were wrapped in cling film and placed in a portable preservation box to ensure that the change in wet-base moisture content of the branches and fruit stalks was less than 5%, and all the tests were completed within one day after the samples were picked.
Universal testing machines were utilized to conduct tensile experiments on stalks measuring 25.7 ± 3.9 mm in length and 2.7 ± 0.3 mm in diameter and compression experiments on branches with a length of 10 mm and a diameter of 6.2 ± 2.3 mm, as illustrated in Figure 6. This process aimed to measure the axial elastic modulus of the stalks and the radial elastic modulus of the branches. The testing machine operated at a velocity of 10 mm/min. Through these experiments, the load–displacement curves for both the branches and the stalks were obtained. Both components exhibited elastic deformation during the initial stages of compression and tensile testing. The stress–strain curves demonstrated a clear linear trend, with the slope of this line representing the elastic modulus [32]. The corresponding stress, strain, and elastic modulus can be calculated using Equations (1)–(3).
σ n = 4 F n / π d s 2
ε n = l / l 0
E = σ n / ε n
In the equations, σ n is the stress (MPa), F n represents the experimental load (N), d s is the diameter of the test specimen (mm), ε n is the strain, Δ l is the change in length of the specimen (mm), l o is the length of the specimen before testing (mm), and E is the elastic modulus (MPa).
The Poisson’s ratio of wood generally ranges between 0.3–0.5 [33,34], and this paper selects the intermediate value of 0.4 as the Poisson’s ratio for branches and stalks. The bulk modulus and shear modulus are related to the elastic modulus and Poisson’s ratio, and the bulk modulus and shear modulus were calculated by Equations (4) and (5), respectively.
K = E / 3 1 2 μ
G = E / 2 1 + μ
In the equations, K is the bulk modulus (MPa), E is the elastic modulus (MPa), and μ is the Poisson’s ratio.

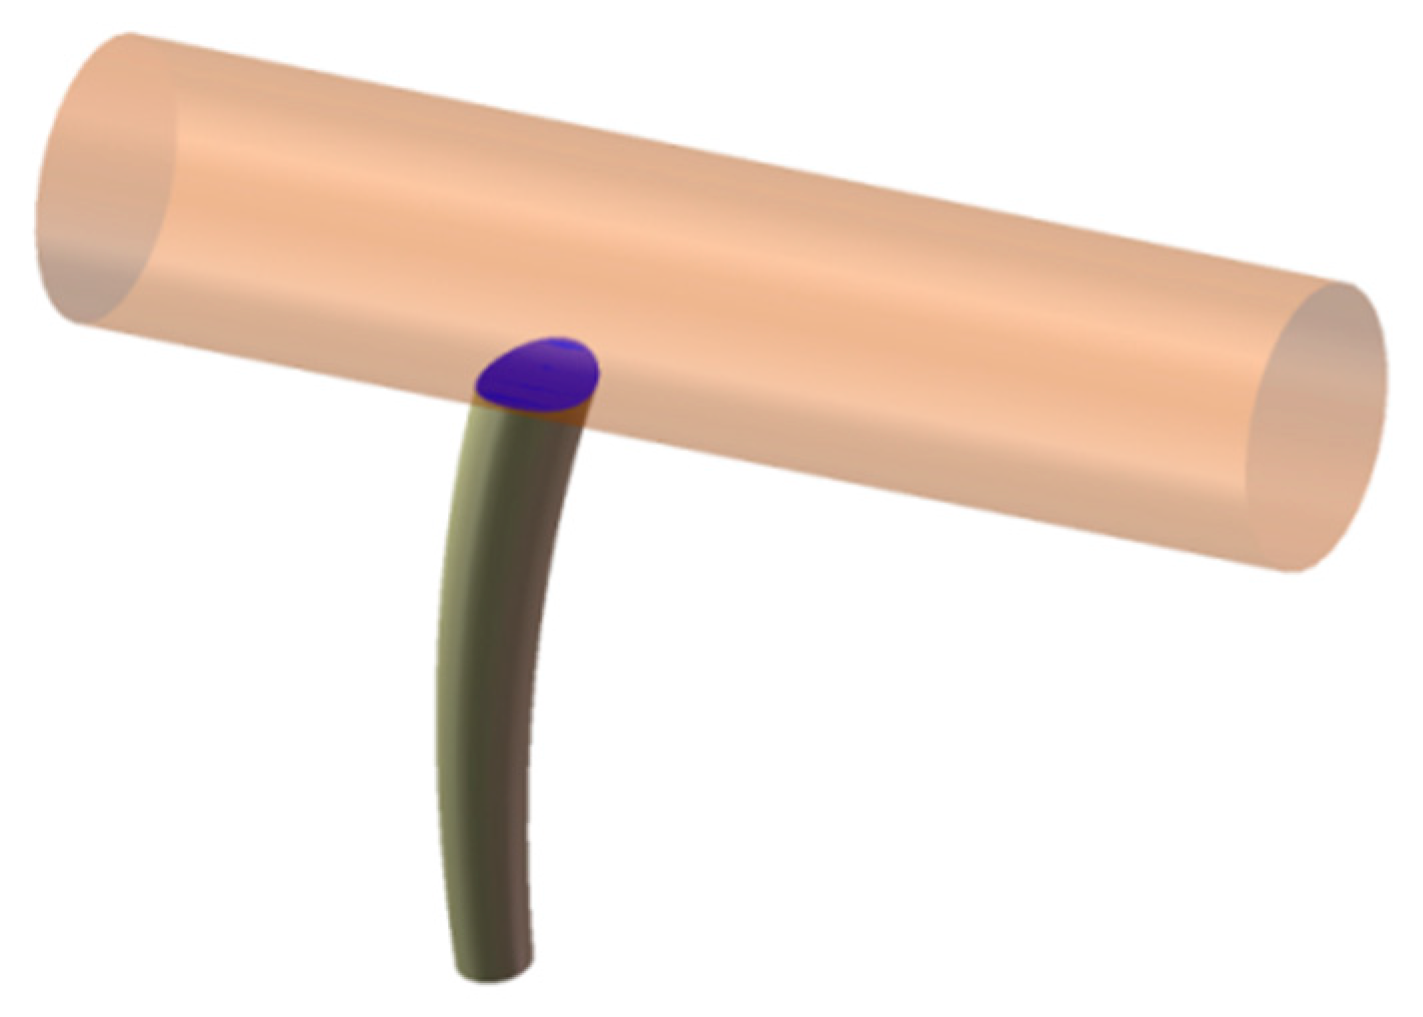
2.2.2. Branch and Fruit Stalk Mode

Due to fibers that grow longitudinally in wood, which enhances the tensile strength, and the tracheids that grow longitudinally and separate more easily when subjected to radial forces, the longitudinal strength is significantly greater than the radial strength. In the experiments, the stress–strain curves for a set of fruit stalks under axial tension and branches under radial compression are shown in Figure 7.
Based on the measured data of 20 groups, the mechanical parameters of the stalk and branch were calculated, and the data of each parameter were analyzed and averaged, and the mechanical parameters of the stalk and branch are shown in Table 2.
Results show that the average axial elastic modulus E s of the stalk and the average radial elastic modulus E b of the branch are 141.37 MPa and 58.94 MPa, respectively. For the stalk tensile experiment, the stress increases with strain, then yields, and then completely fractures, with the average yield stress and failure stress being 3.14 MPa and 5.56 MPa, respectively. As the branch was in the radial compression process, the stress increased rapidly with strain after the linear elastic stage. However, there is no obvious failure stage, with the average yield stress and failure stress being 0.65 MPa and 6.21 MPa, respectively.
Through the measurement of the geometric parameters and mechanical parameters of the branches and stalks, according to the growth situation of most fruits, a section of the branch and stalk was taken for 3D modeling, as shown in Figure 8.

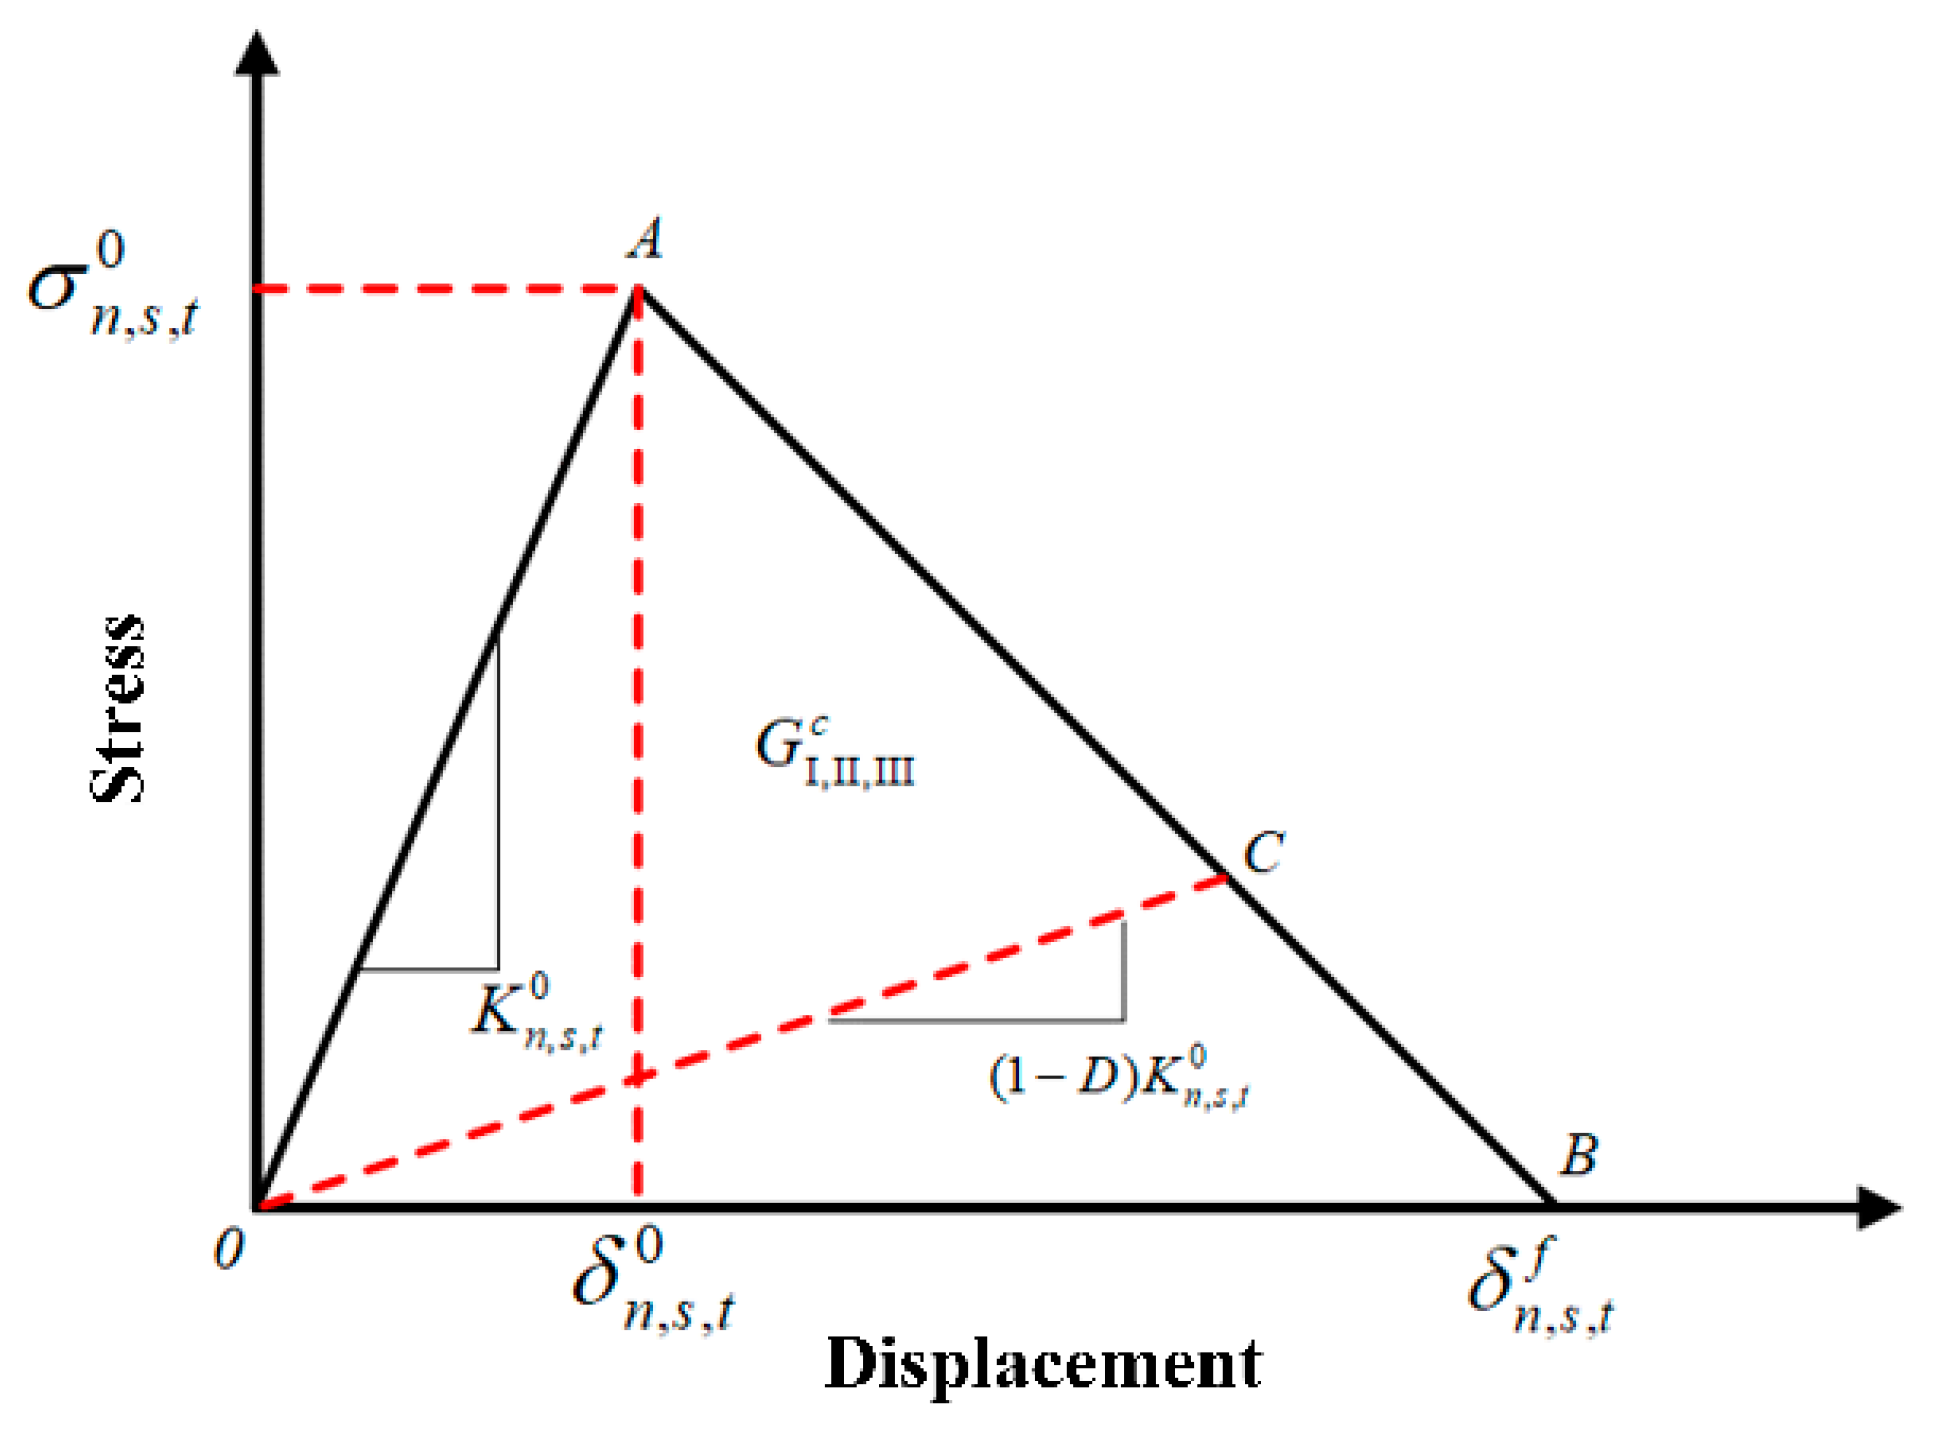
2.3. Modelling of the Abscission Layer

Apple fruits have a unique abscission layer between the fruit and the branch, which has structural and mechanical properties different from the branch and the stalk. During the fruit growth, the abscission layer ensures a tight connection between the fruit and the branch. However, during the ripening period, the abscission layer becomes weaker, promoting the natural shedding of the fruit. Since the abscission layer is tiny and difficult to measure directly, the Cohesive Zone Model (CZM) was used to describe its mechanical properties and the fruit abscission phenomenon. This model simulates the abscission process of two bonded objects through minor fractures or gradual failure under external forces.
The constitutive response of the cohesive zone model was described by a bilinear stress–displacement relationship [35,36,37,38,39,40], as shown in Figure 9. It can be seen from the figure that the process of interface damage and cracking in the bilinear CZM consists of two stages. In the first stage (OA section), the cohesive zone interface is in the elastic stage; as the displacement of the cohesive zone interface increases, the stress it receives increases linearly until it reaches the critical damage stress; the cohesive zone interface will start to be damaged, and the displacement at this time is the damage initiation displacement.
In the elastic stage, the initial stiffness of the interface can be represented by the slope of segment OA:
K n , s , t 0 = σ n , s , t 0 / δ n , s , t 0
In the equation, K n 0 , K s 0 , and K t 0 represent the initial stiffness (N/m) of the cohesive zone interface in the normal, first tangential, and second tangential directions, respectively; σ n 0 , σ s 0 , and σ t 0 represent the critical damage stress of the cohesive zone interface in the corresponding directions (MPa); δ n 0 , δ s 0 , and δ t 0 represent the initial damage displacement of the interface in the corresponding directions (mm).
The second stage (AB section) involves the increase in interface displacement, with the damage gradually increasing and the interface stress decreasing until it reaches zero. At this point, the interface displacement is the failure displacement, and the interface is entirely ineffective. This stage is called the linear softening stage of the cohesive zone interface [41], and its stiffness degrades due to the increasing damage, which can be represented by the slope of segment OC:
K n , s , t i = 1 D K n , s , t 0
In the equation, D is the damage coefficient, indicating the degree of stiffness degradation of the cohesive zone interface, varying between 0 and 1. When D = 0, it indicates that the interface is undamaged; when D = 1, the interface stiffness becomes zero, indicating that the cohesive zone interface is entirely ineffective.
According to the constitutive equation of the cohesion zone model based on the bilinear mixed mode, the calculation of the damage coefficient is shown in Equation (8).
D n , s , t i = δ n . s . t f δ n , s , t i δ n , s , t 0 / δ n . s . t i ( δ n , s , t f δ n , s , t 0 )
In the equation, D n , D s , and D t represent the damage coefficients for the interface mode I, mode II, and mode III fracture modes, respectively, corresponding to the normal, first tangential, and second tangential directions of the cohesive interface; δ n 0 , δ s 0 , δ t 0 are the displacements at the cohesive interface in the linear softening phase in the corresponding directions (mm); and δ n f , δ s f , δ t f are the damage failure displacements in the corresponding directions (mm).
In the cohesive zone model, the stress–displacement curve and the enclosed area with the coordinate axis represent the total energy released during the damage and cracking process of the cohesive zone interface, defined as the fracture energy release rate:
G Ι ,   I I , I I I c = 1 2 σ n , s , t 0 δ n , s , t f
In the equation: G Ι c , G Ι Ι c , and G Ι Ι Ι c represent the fracture energy release rates (KJ/m2) for Mode I, Mode II, and Mode III fracture patterns, respectively.
After the analysis, the constitutive model clearly defines the relationship between the critical stress required for interface debonding and the displacement associated with this debonding. It also describes the process through the critical fracture energy. When the external energy exceeds this critical threshold, debonding occurs at the interface. To accurately represent the growth situation of the branch–stalk abscission layer, a cohesive zone model was constructed that differentiates between normal and tangential fracture energies. This approach captures the biomechanical characteristics effectively and simplifies the model’s complexity, thereby reducing the amount of simulation calculations needed. It offers a practical solution for the actual measurement of the constitutive parameters of the abscission layer.

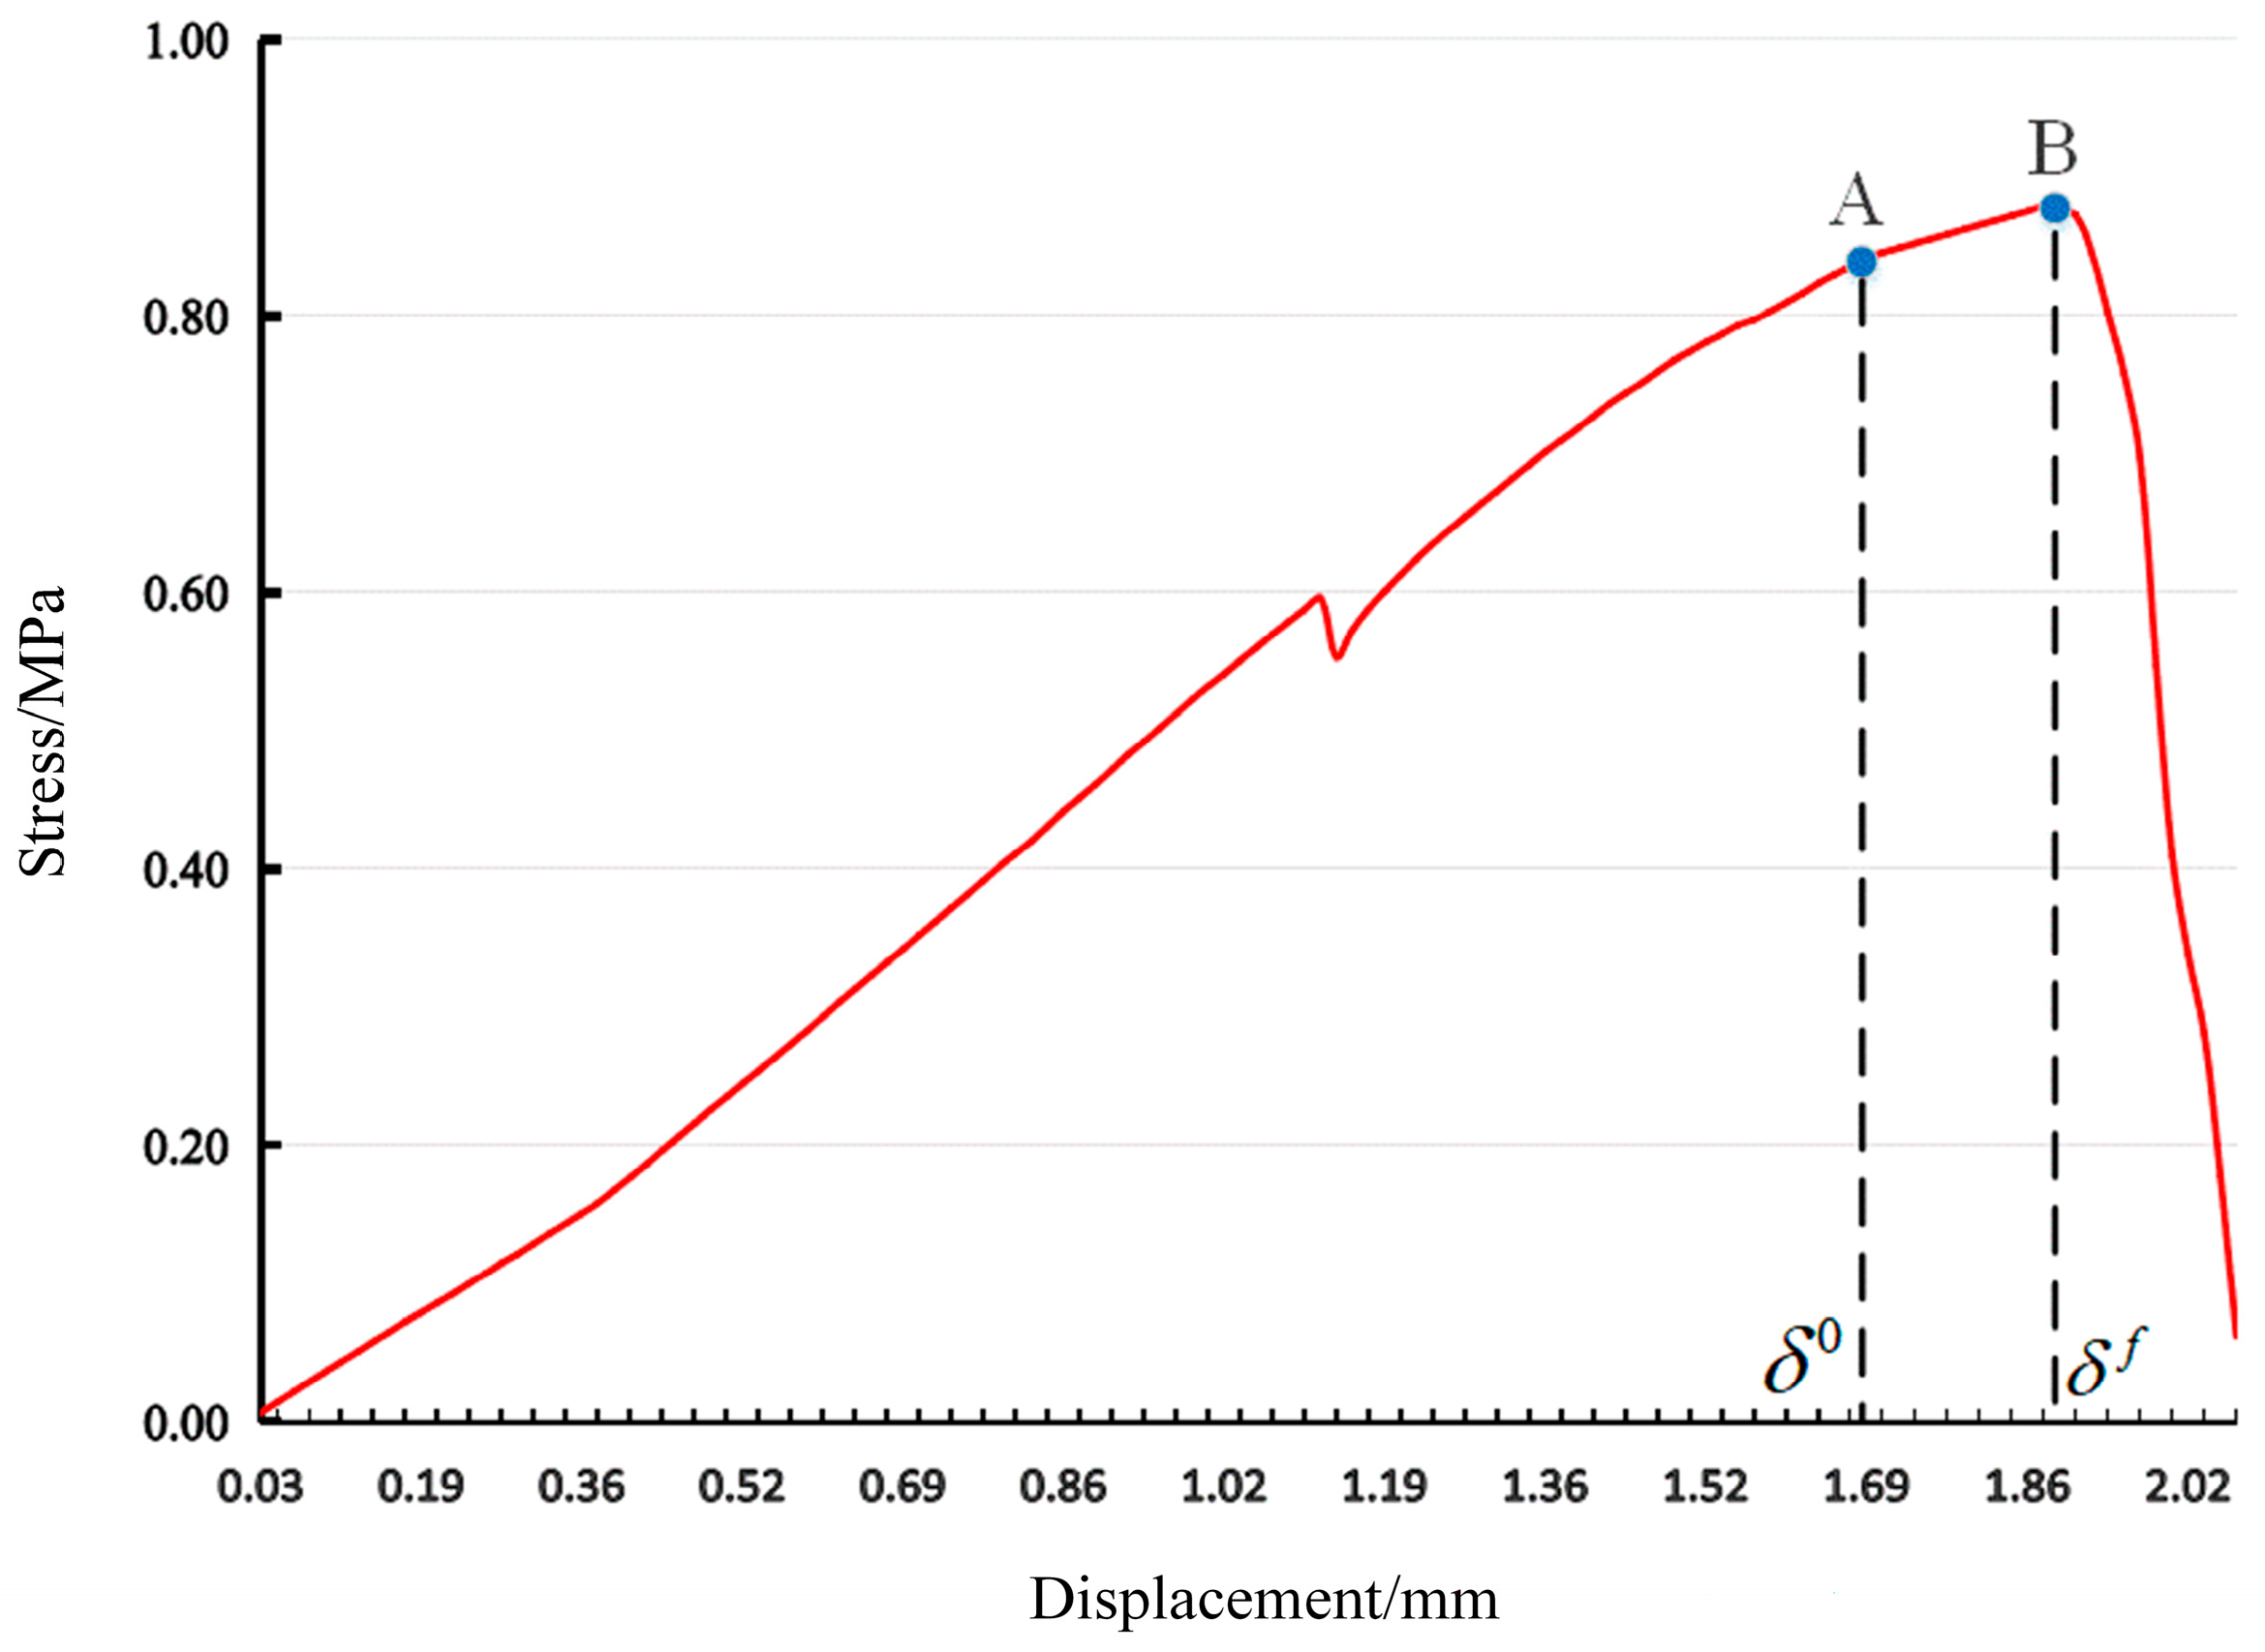
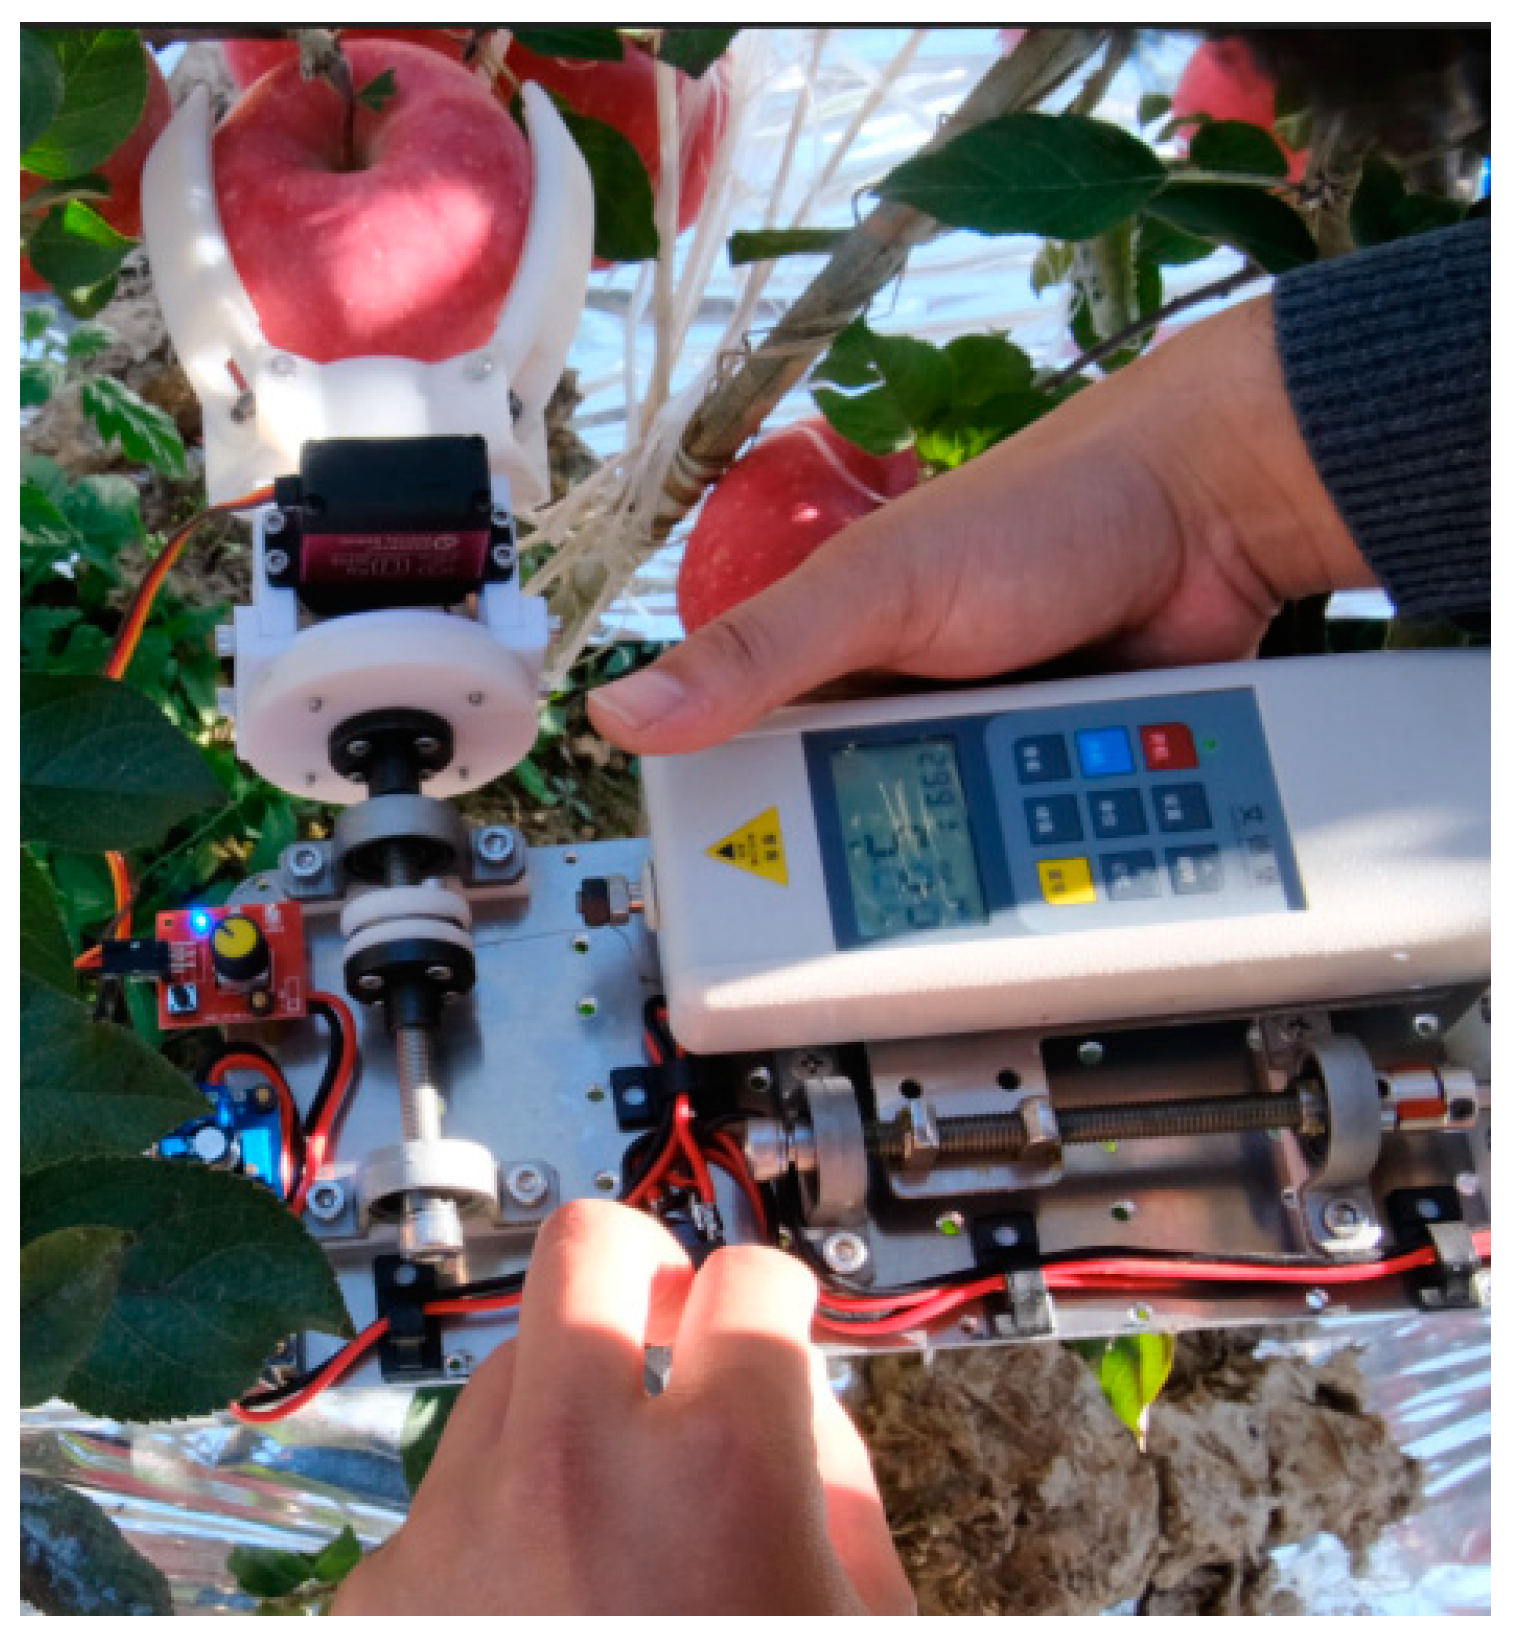
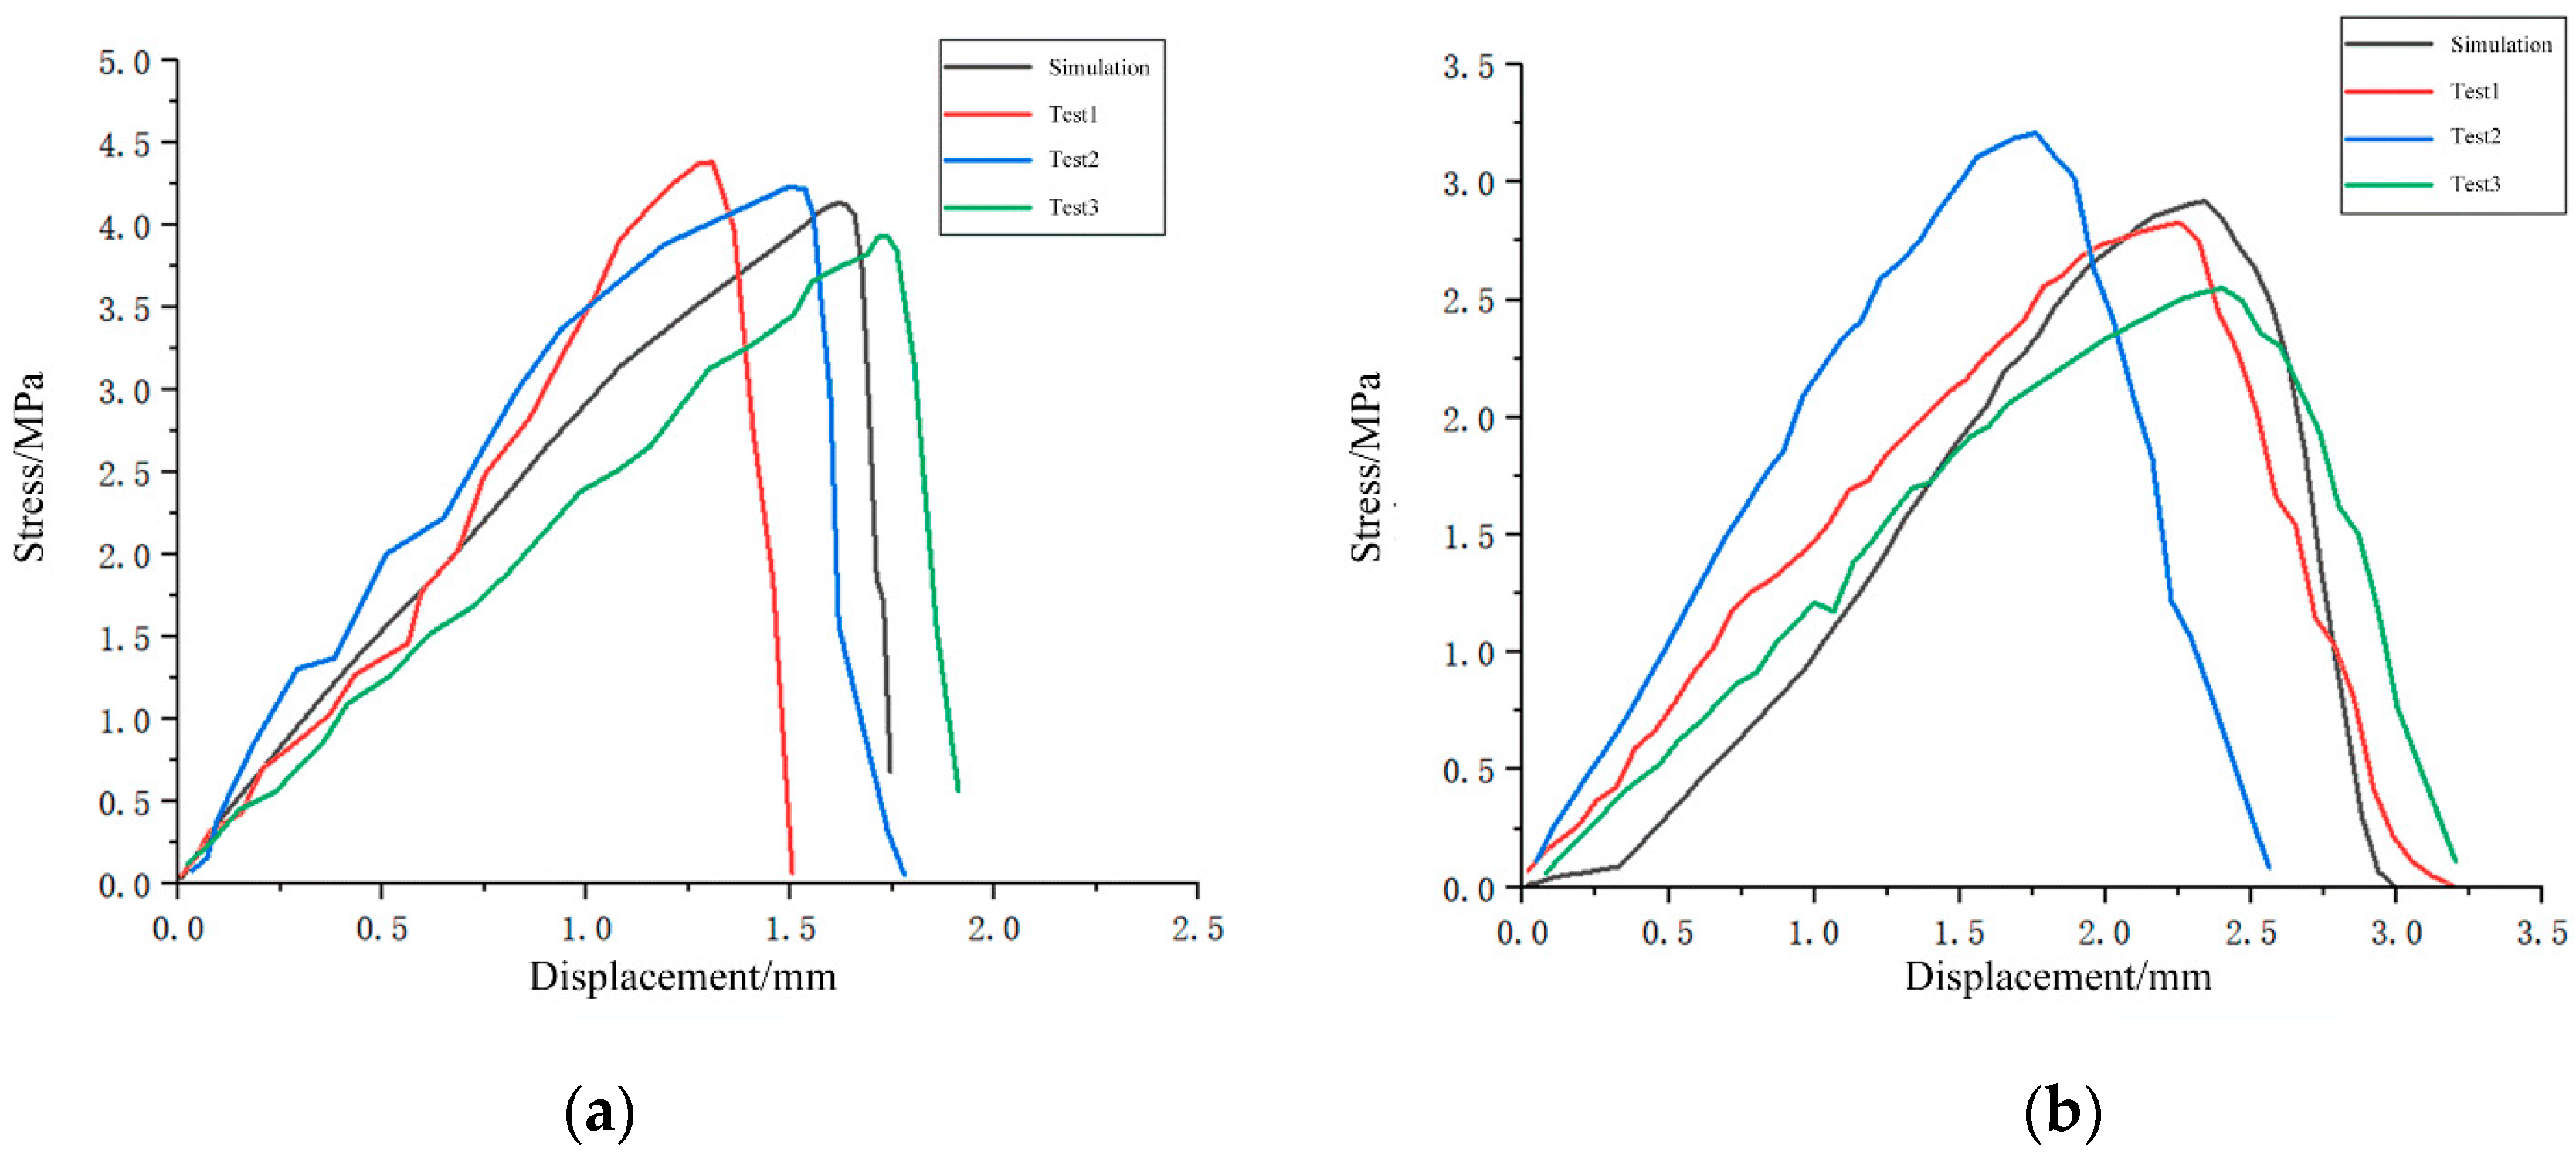
2.3.1. Measurement of Abscission Layer Mechanical Properties

To accurately measure the mechanical properties of the abscission layer, fresh mature apples need to be harvested, and the branch–abscission layer–fruit stalk part must be completely retained, as shown in Figure 10.
The normal and tangential fracture energy release rates need to be obtained to model the abscission layer. By analyzing the displacement and stress curve of a typical apple branch–stalk tensile experiment, as shown in Figure 11, the yield point A and the maximum stress point B can be found in the curve diagram.
Combined with the definition of fracture energy release rate in the CZM, the stress σ at the yield point A can be defined as the critical damage stress σ 0 for the failure of the cohesive zone unit, and the corresponding displacement is defined as the damage initiation displacement. When the cohesive zone unit reaches the maximum stress point B, the cohesive zone unit is completely ineffective, and the branch and fruit stalk are abscissed, with this displacement defined as the failure displacement δ f .
Before the cohesive zone unit reaches critical damage, the initial stiffness value is tremendous, making the branch and fruit stalk a rigid connection, and the cohesive zone unit hardly undergoes displacement, ensuring that the overall stiffness remains unchanged. Therefore, the fracture energy release rate of the abscission layer can be approximated as the area of a right-angled triangle when calculating, with the base length being the displacement of the cohesive zone unit under stress, δ = δ f δ 0 , and the height being the maximum stress value at point B.
Therefore, to measure the fracture energy release rate of the apple abscission layer, tensile experiments were conducted on the normal and tangential directions of the abscission layer, with 10 experiments for each, reflecting the comprehensive mechanical properties of the abscission layer. The experiment samples are shown in Figure 12, divided into normal and tangential experiment samples, including the branch, abscission layer, and fruit stalk parts.
The tensile experiment of the abscission layer was conducted using a universal testing machine. Ten branch samples with a cross-sectional area of 22.41 ± 4.19 mm2 were selected for the normal experiment of the abscission layer, and ten branch samples with a cross-sectional area of 25.49 ± 3.12 mm2 for the tangential experiment of the abscission layer. The experiment sampling frequency was 20 Hz, and the velocity was 5 mm/min, as shown in Figure 13.

2.3.2. Abscission Layer Model Parameters

In ANSYS Workbench 18 analysis software, the CZM was used to establish the abscission layer. This model involves five key parameters: maximum normal stress, maximum tangential stress, normal fracture energy release rate, tangential fracture energy release rate, and an artificial damping coefficient. Based on data obtained from the experiments, ten sets of stress–displacement relationship curves for both the normal and tangential directions of the abscission layer were generated, as illustrated in Figure 14. These curves demonstrate the behavior of the abscission layer: in both the normal and tangential directions, the stiffness of the abscission layer begins to decrease at the yield point. Damage occurs when the layer experiences stress that reaches its maximum value, leading to fracture until the abscission layer interface is completely abscissed.
From the experimental data and curve analysis, the average maximum normal and tangential stress of the abscission layer could be directly obtained. Combined with the description and definition of the fracture energy release rate in the CZM, the average normal and tangential fracture energy release rate of the abscission layer can be calculated, as shown in Table 3.
In the finite element simulation of debonding using the CZM, the Newton–Raphson iterative solution often experiences convergence difficulties [42]. The application of artificial damping can effectively address this issue. When damping was activated, the debonding parameter calculated the contact traction. The artificial damping coefficient was measured in time units and should be less than the minimum time step. This ensures that the maximum traction force and maximum abscission (or critical fracture energy) values are not exceeded during the debonding calculations. The iterative calculation for the debonding parameter is as follows:
d v = d o l d + Δ t Δ d / ( Δ t + η )
In the equation: Δt represents the time increment (s); d o l d is the debonding parameter from the previous calculation process (KJ/m2); Δ d is the increment of the debonding parameter in the current step (KJ/m2); and η is the artificial damping coefficient.

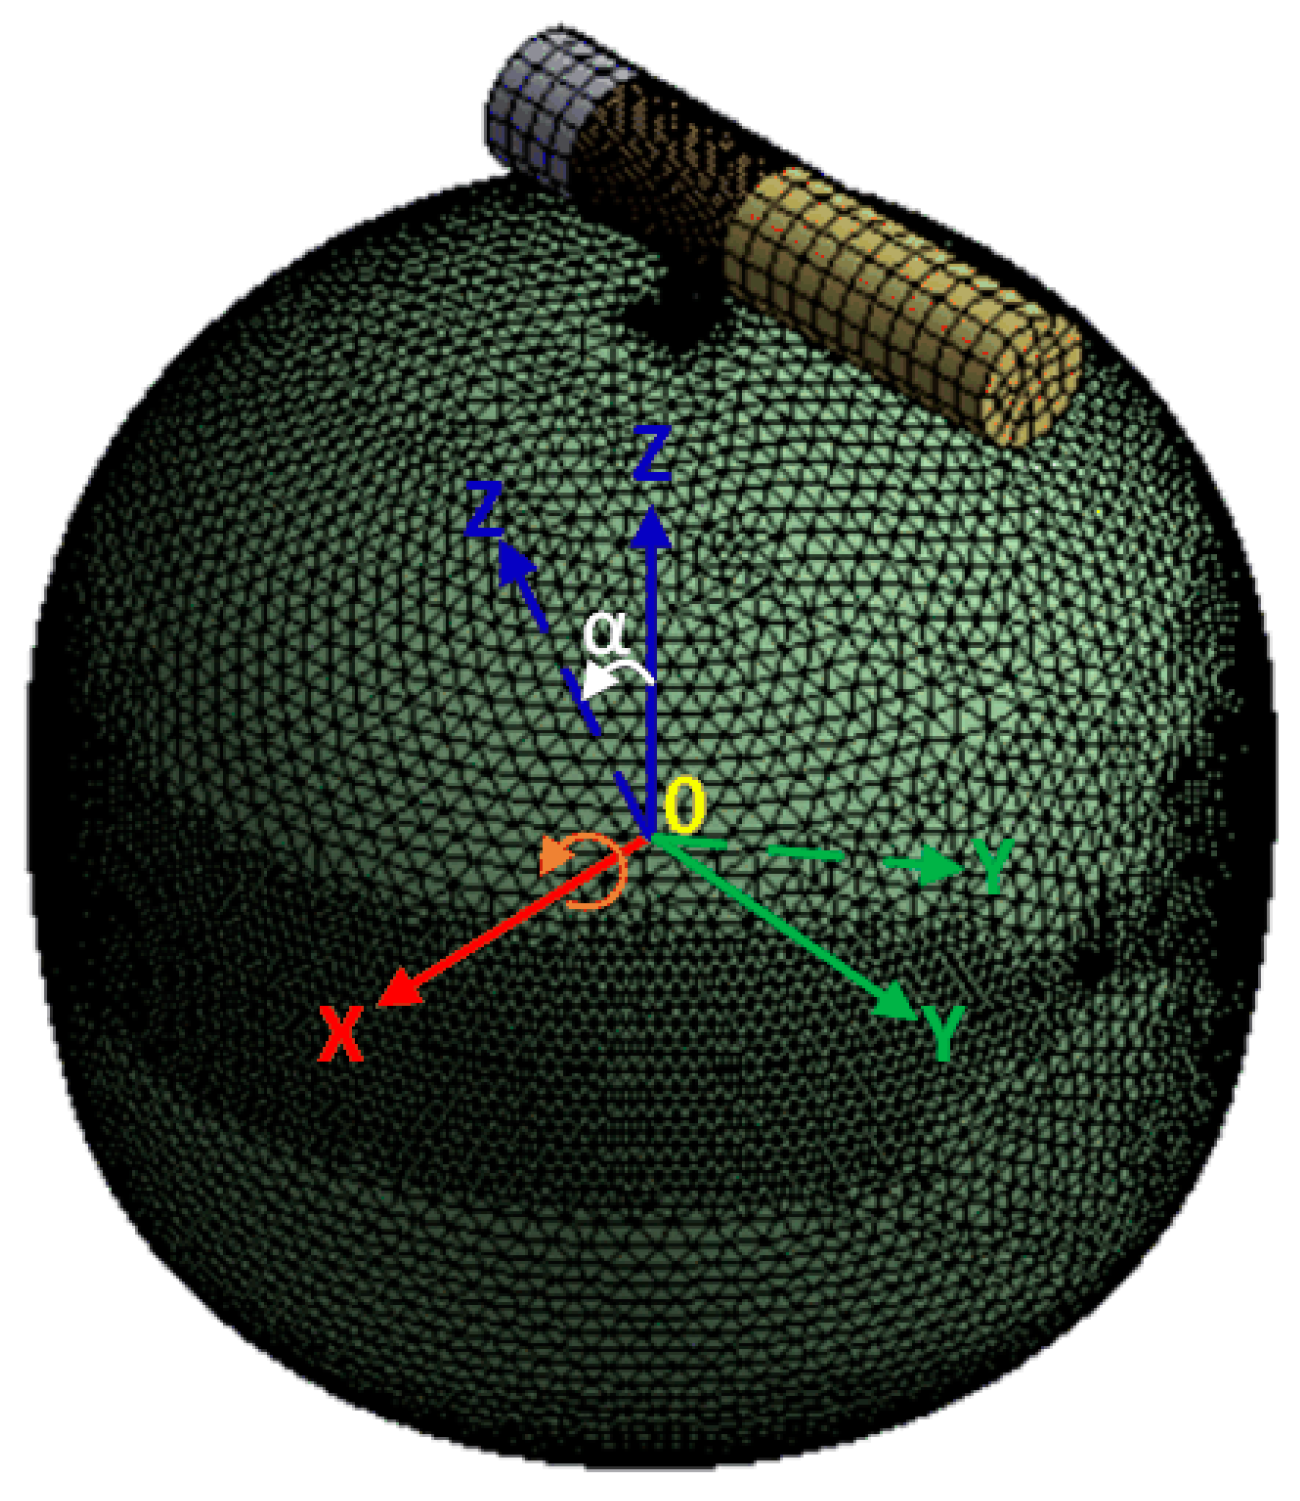
2.4. Branch–Stalk–Fruit Finite Element Model

Parameters for branches and fruit stalks have been derived in previous experiments. For the apple fruit model, it can be divided into three parts: peel, flesh, and core. The material properties of these parts have been well-studied and can be directly obtained from previous research [43], as shown in Table 4.
For the abscission layer’s finite element model, first, establish the CZM material parameters based on the data obtained from the abscission layer experiments. Then, a local coordinate system was established to define the contact surface between the branch and the stalk. Change the contact algorithm to a penalty function or augment Lagrangian to calculate contact abscission. Finally, the fracture properties were defined, and the corresponding CZM materials and contact pairs were set. After completing all the settings, mesh all the materials that have been assigned properties, as shown in Figure 15.

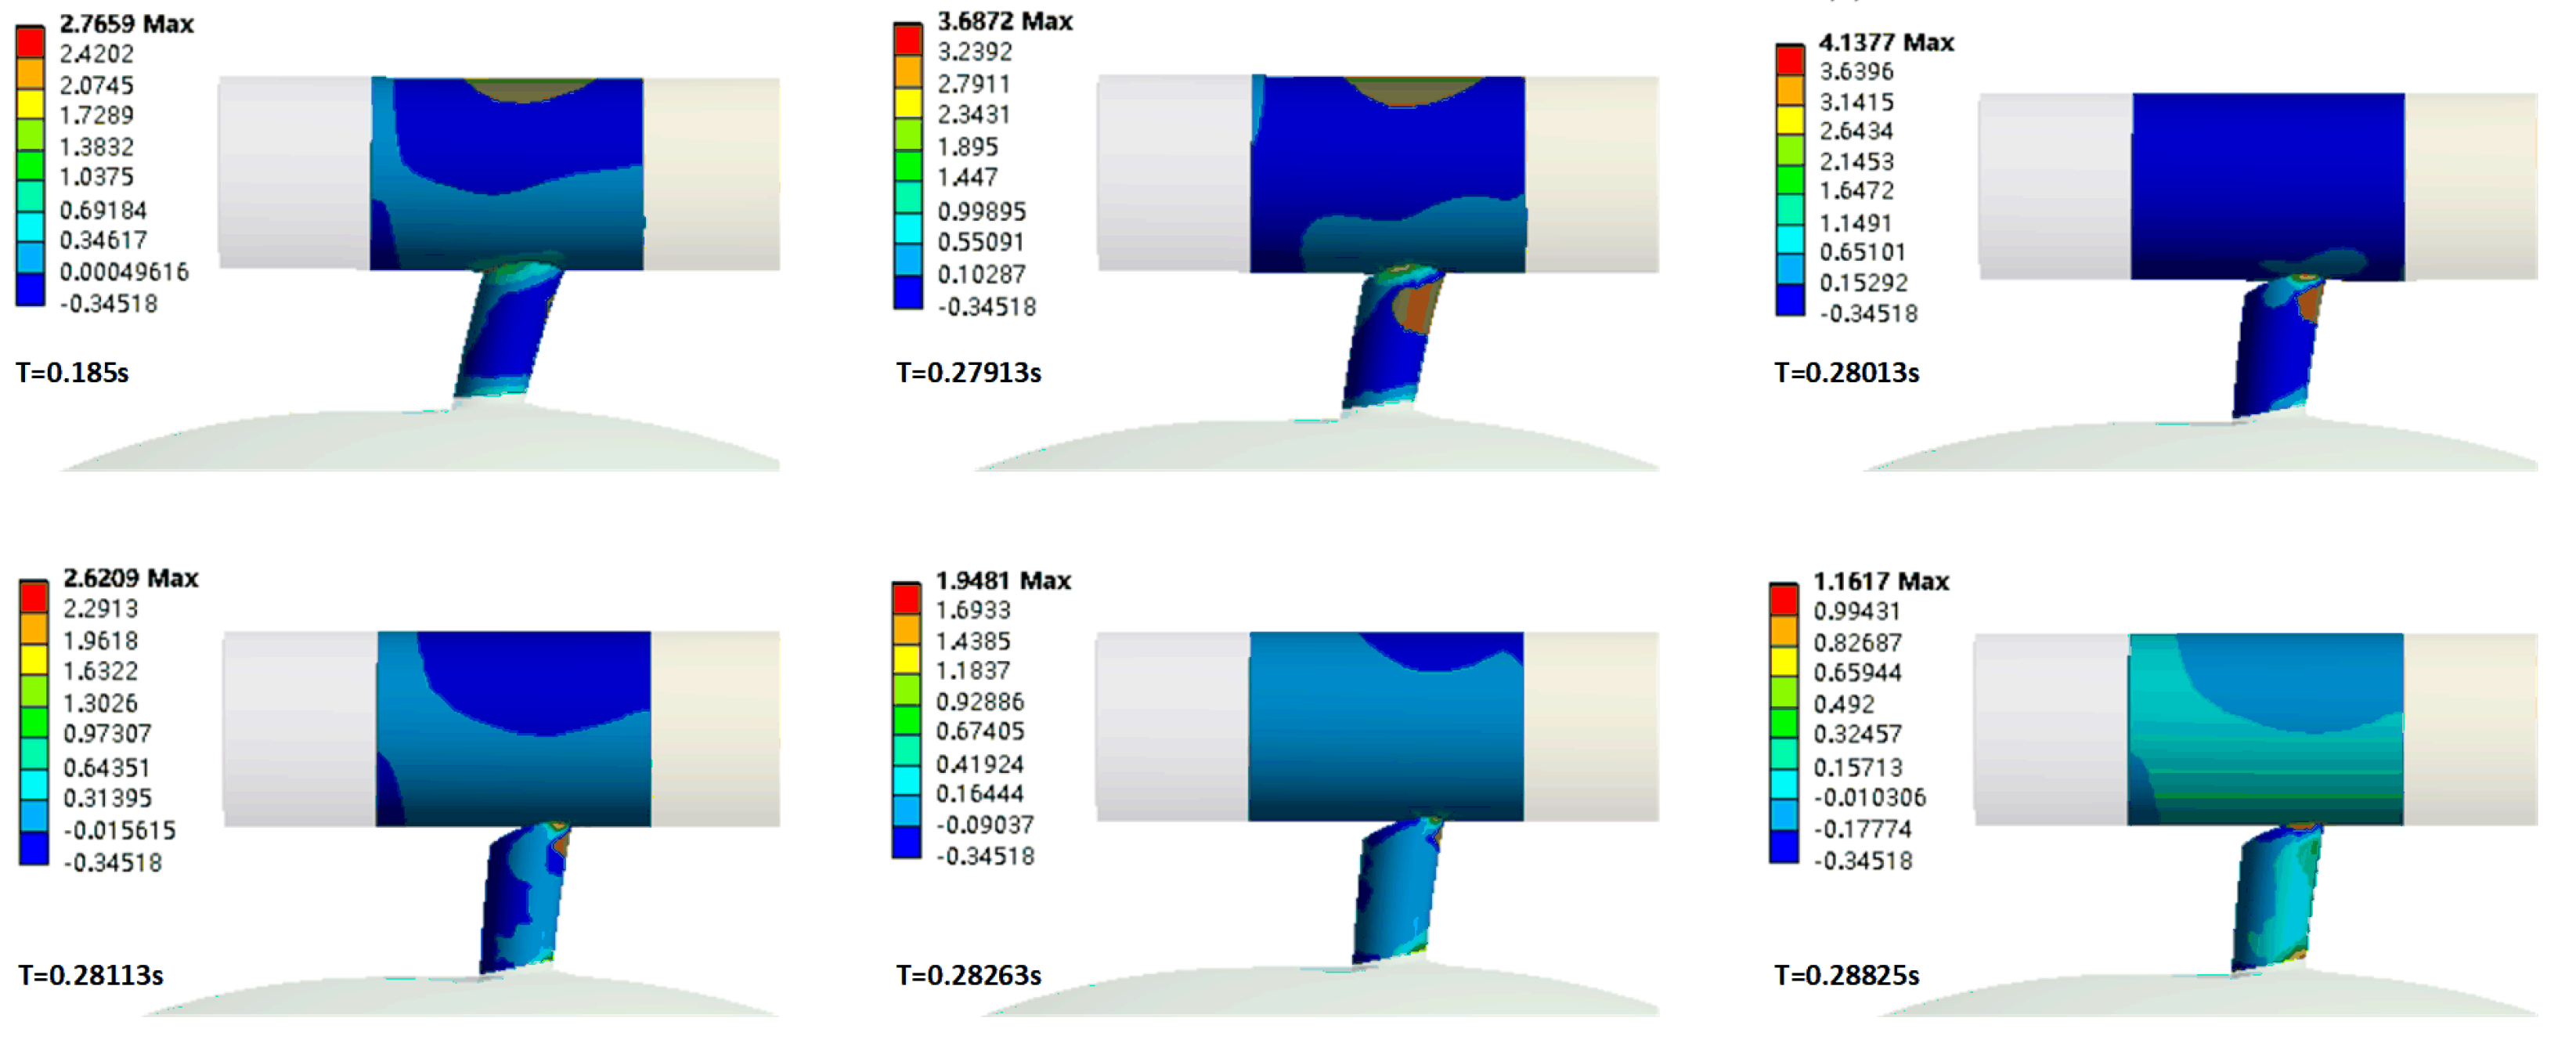
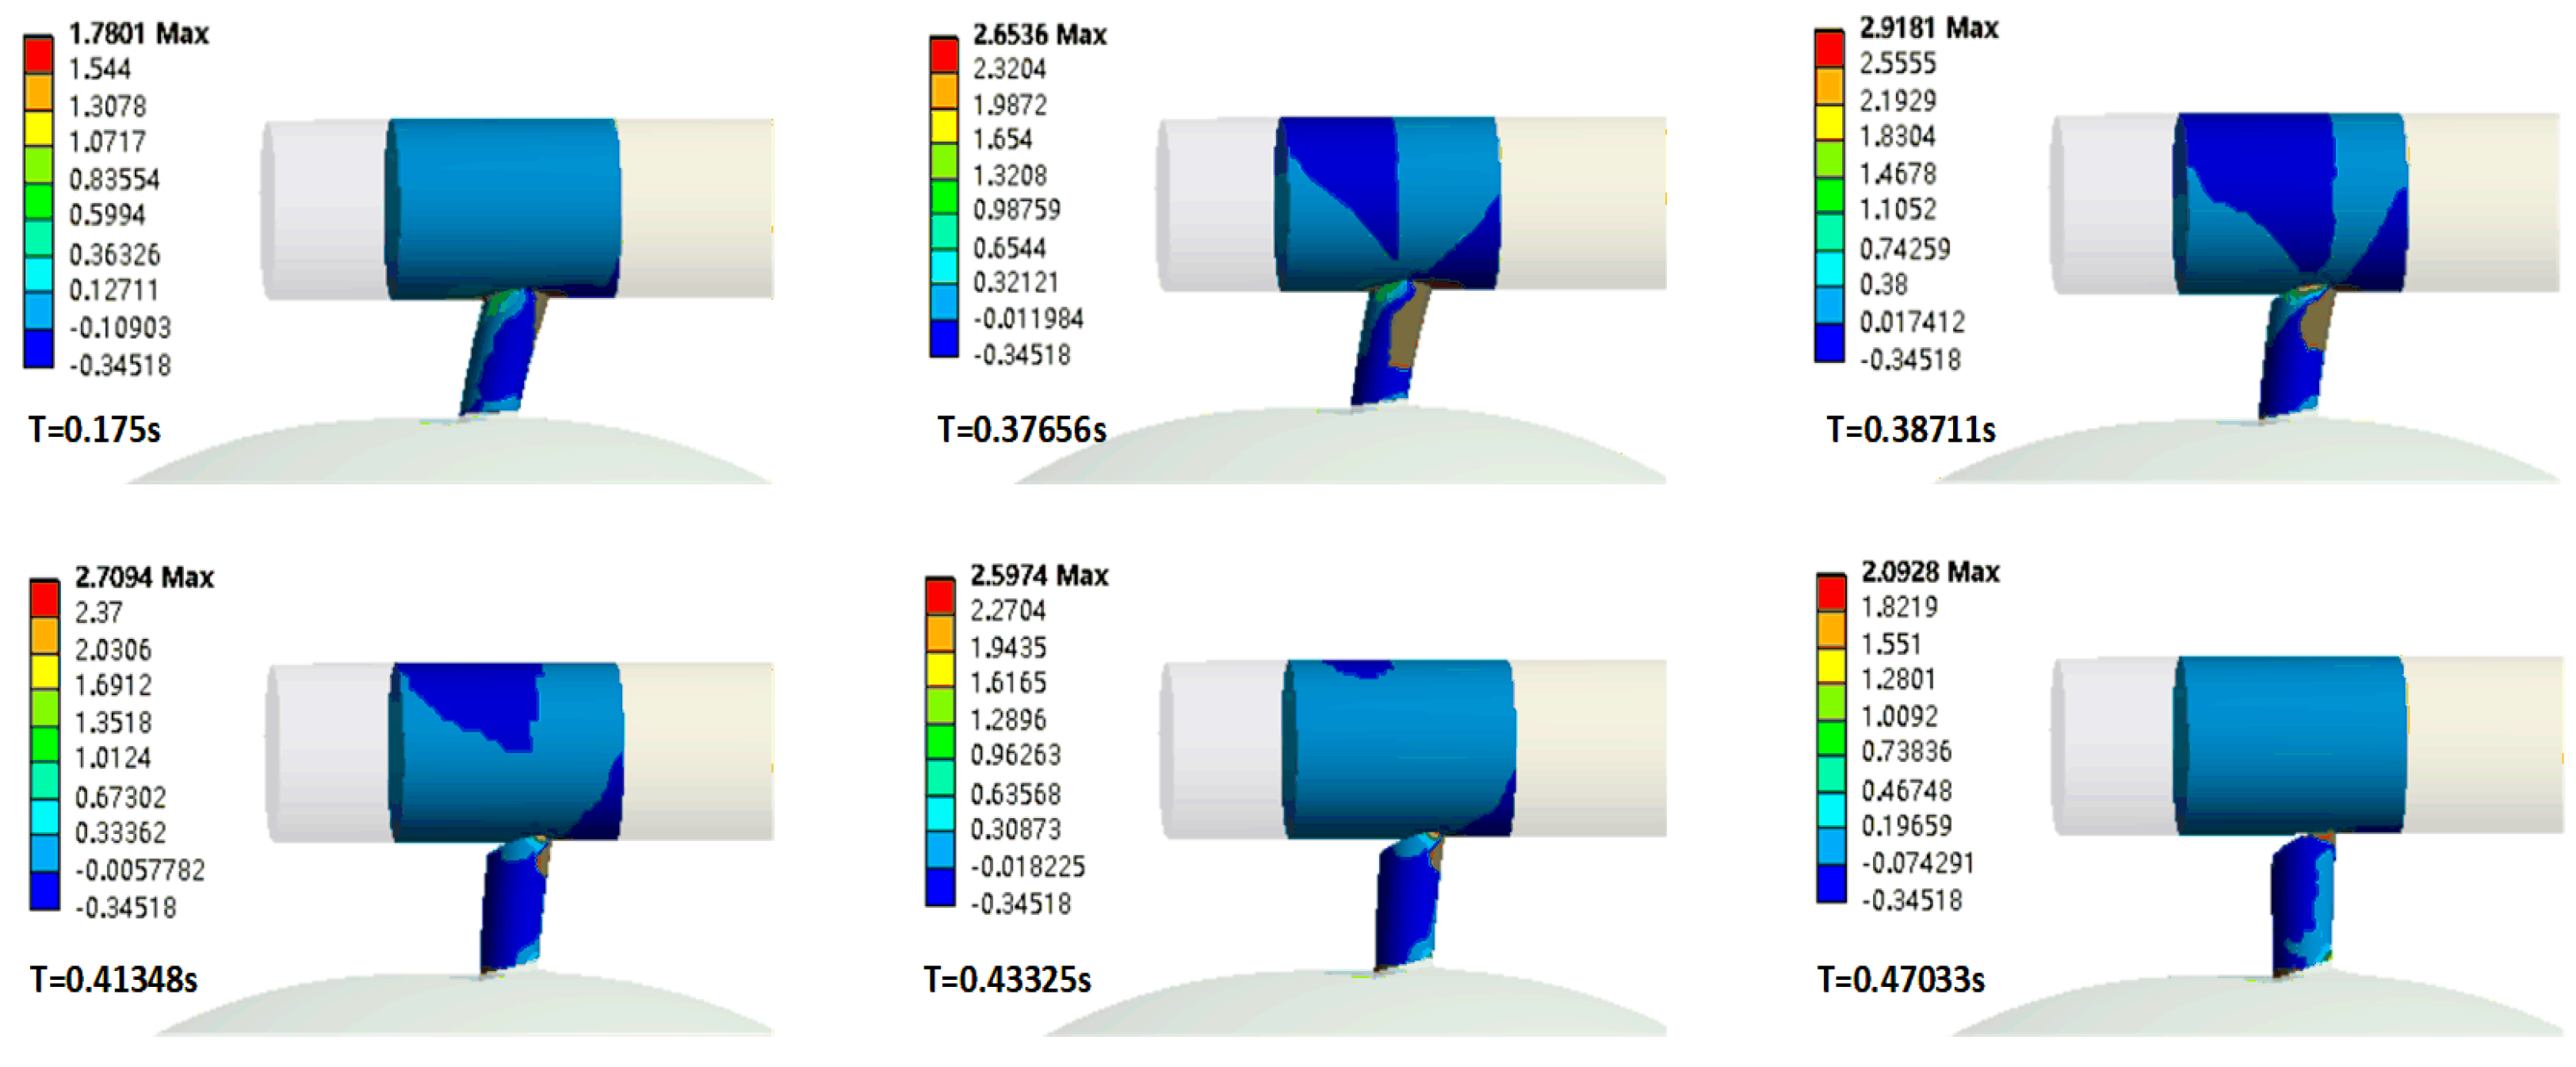
2.5. Fruit Abscission Process Simulation

To verify the model’s accuracy, a fruit abscission experiment was conducted using ANSYS Workbench 18 software with the established branch–stalk–fruit finite element model. Fixed constraints were applied at both ends of the branch, while vertical, downward, or horizontal displacements were applied to the fruit to observe the response behavior of the branch–stalk–fruit system.
In accordance with the experiment setup described above, the entire branch–stalk–fruit system was simulated for abscission. The analysis revealed that the stress on the branch–stalk system was highest, with the load transmitted through the fruit stalk to the fruit peel, flesh, and core, as illustrated in Figure 16.
The simulation shows that the fruit peel and flesh stress do not exceed 0.12 MPa (less than 0.34 MPa). Due to the pulling force on the fruit stalk, the stress at the connection point of the fruit stalk and the core was relatively large, reaching 0.51 MPa. The contact stress on the fruit peel increased and rapidly decreased before the abscission process was completed. This indicates that the stress on the fruit peel and flesh is minimal, and no damage occurred. Therefore, the apple can be considered a rigid body during analysis to improve the simulation efficiency.
The stress analysis of the abscission layer is essential for understanding the fruit abscission process. Stress on the abscission layer was simulated in both normal and tangential directions. Figure 17 illustrates the stress distribution over time during the normal abscission of the layer. The simulation results indicate that the maximum stress and failure displacement of the abscission layer in the normal direction are 4.14 MPa and 1.62 mm, respectively. In an actual normal tensile experiment of the abscission layer, the average maximum stress and failure displacement were recorded at 4.28 MPa and 1.59 mm, with relative deviations of 3.27% and 1.85%. Additionally, the maximum force observed in the simulation was 25.05 N, which is comparable to the average maximum direct-pulling force of 23.42 N obtained from the experiments in Section 2.3.1.
Figure 18 illustrates the distribution of stress over time during the tangential abscission of the abscission layer. As the fruit was abscissed horizontally, the fruit stalk became tightened. This action applies a tensile load to the abscission layer, resulting in damage within approximately 0.377 s. The simulation indicates that the maximum stress experienced by the abscission layer is 2.92 MPa, with a failure displacement of 2.34 mm. In contrast, experimental data reveal an average maximum stress of 2.98 MPa and a failure displacement of 2.46 mm, which corresponds to deviations of 2.01% and 4.88% from the simulation results. Additionally, the simulation predicts a maximum force of 13.19 N, while the experimental measurement shows a maximum force of 11.28 N.
The simulation experiment reveals that the dynamic response of the abscission layer varies significantly between normal and tangential stretching. During tangential stretching, one side of the abscission layer experiences damage due to tensile forces, while the opposite side is subjected to compression. Once the tensile stress reaches the yield limit, damage and fractures occur, leading to a reduction in overall stiffness and an acceleration of fracture propagation. In contrast, the cohesive zone units yield and fracture simultaneously during normal stretching. Furthermore, the maximum tensile force observed during tangential stretching is only 52.65% of the normal force, which is 25.05 N. This indicates that the abscission layer is more prone to damage and fracture when subjected to tangential stretching.

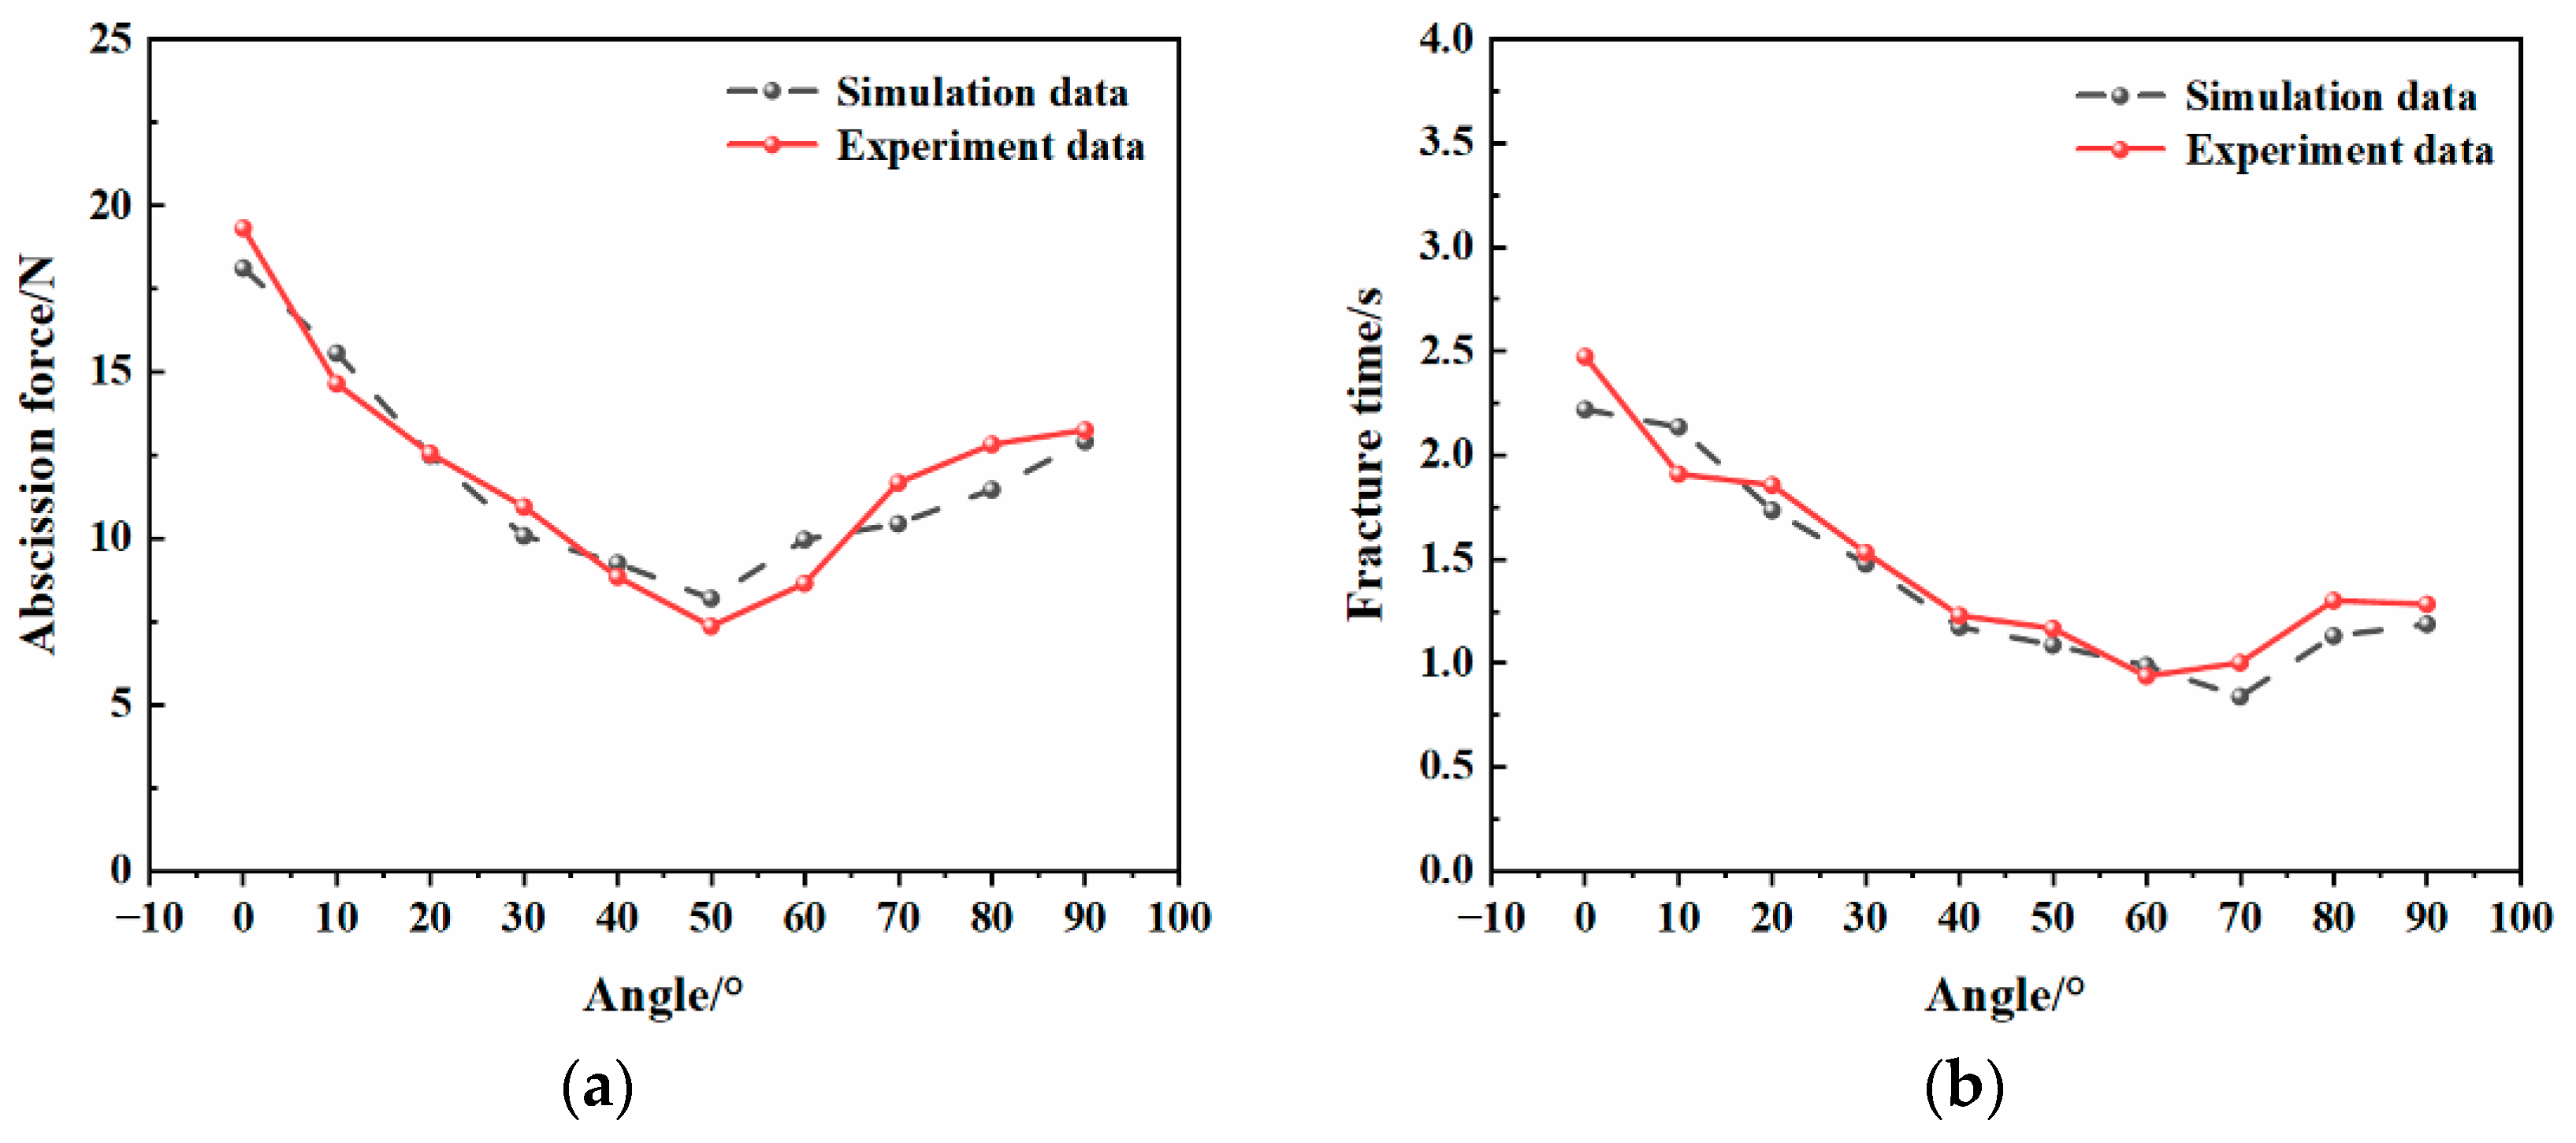
2.6. Model Abscission Process Accuracy Verification

An experimental device for fruit abscission was made to verify the model’s accuracy, as shown in Figure 19. The device mainly converts the torque in the rotation direction into tensile force in a straight line, as the straight tensile force is easier to measure with instruments such as a force gauge. Its working principle is as follows: First, apply pre-tension to the thin steel wire rope to ensure stability. Then, when the device is positioned at the apple-picking point, use the angle adjustment knob to precisely control the end gripper to firmly close and firmly grasp the apple. Next, the lead screw nut mechanism converts the rotational movement into linear motion, thereby driving the Edberg SH-200 LCD digital push–pull force gauge to apply force downward, ultimately helping the end gripper to complete the fruit picking and abscission.
In the orchard, three repeated experiments were conducted on apples of the same variety and maturity period; the branches and stalks of the selected experiment samples were as consistent as possible with the tensile experiment in the laboratory, as shown in Figure 20.
As shown in Figure 21, the results from the orchard field experiments and simulation analyses show strong consistency in mechanical response. The maximum pulling forces recorded in the three normal pulling experiments were 26.14 N, 25.79 N, and 23.86 N, respectively. This compares to a simulation value of 25.05 N, resulting in relative deviations of 4.35%, 2.96%, and 4.75%. These slight deviations indicate a good match between the experiments and simulations. In the three tangential pulling experiments, the maximum pulling forces were 12.63 N, 14.31 N, and 12.28 N, while the simulation yielded a maximum tangential pulling force of 13.19 N. The relative deviations for these experiments were 4.25%, 8.49%, and 6.90%, which also fall within an acceptable range. Overall, these findings suggest that the model can accurately predict the branch–stalk’s response behavior under different loads.

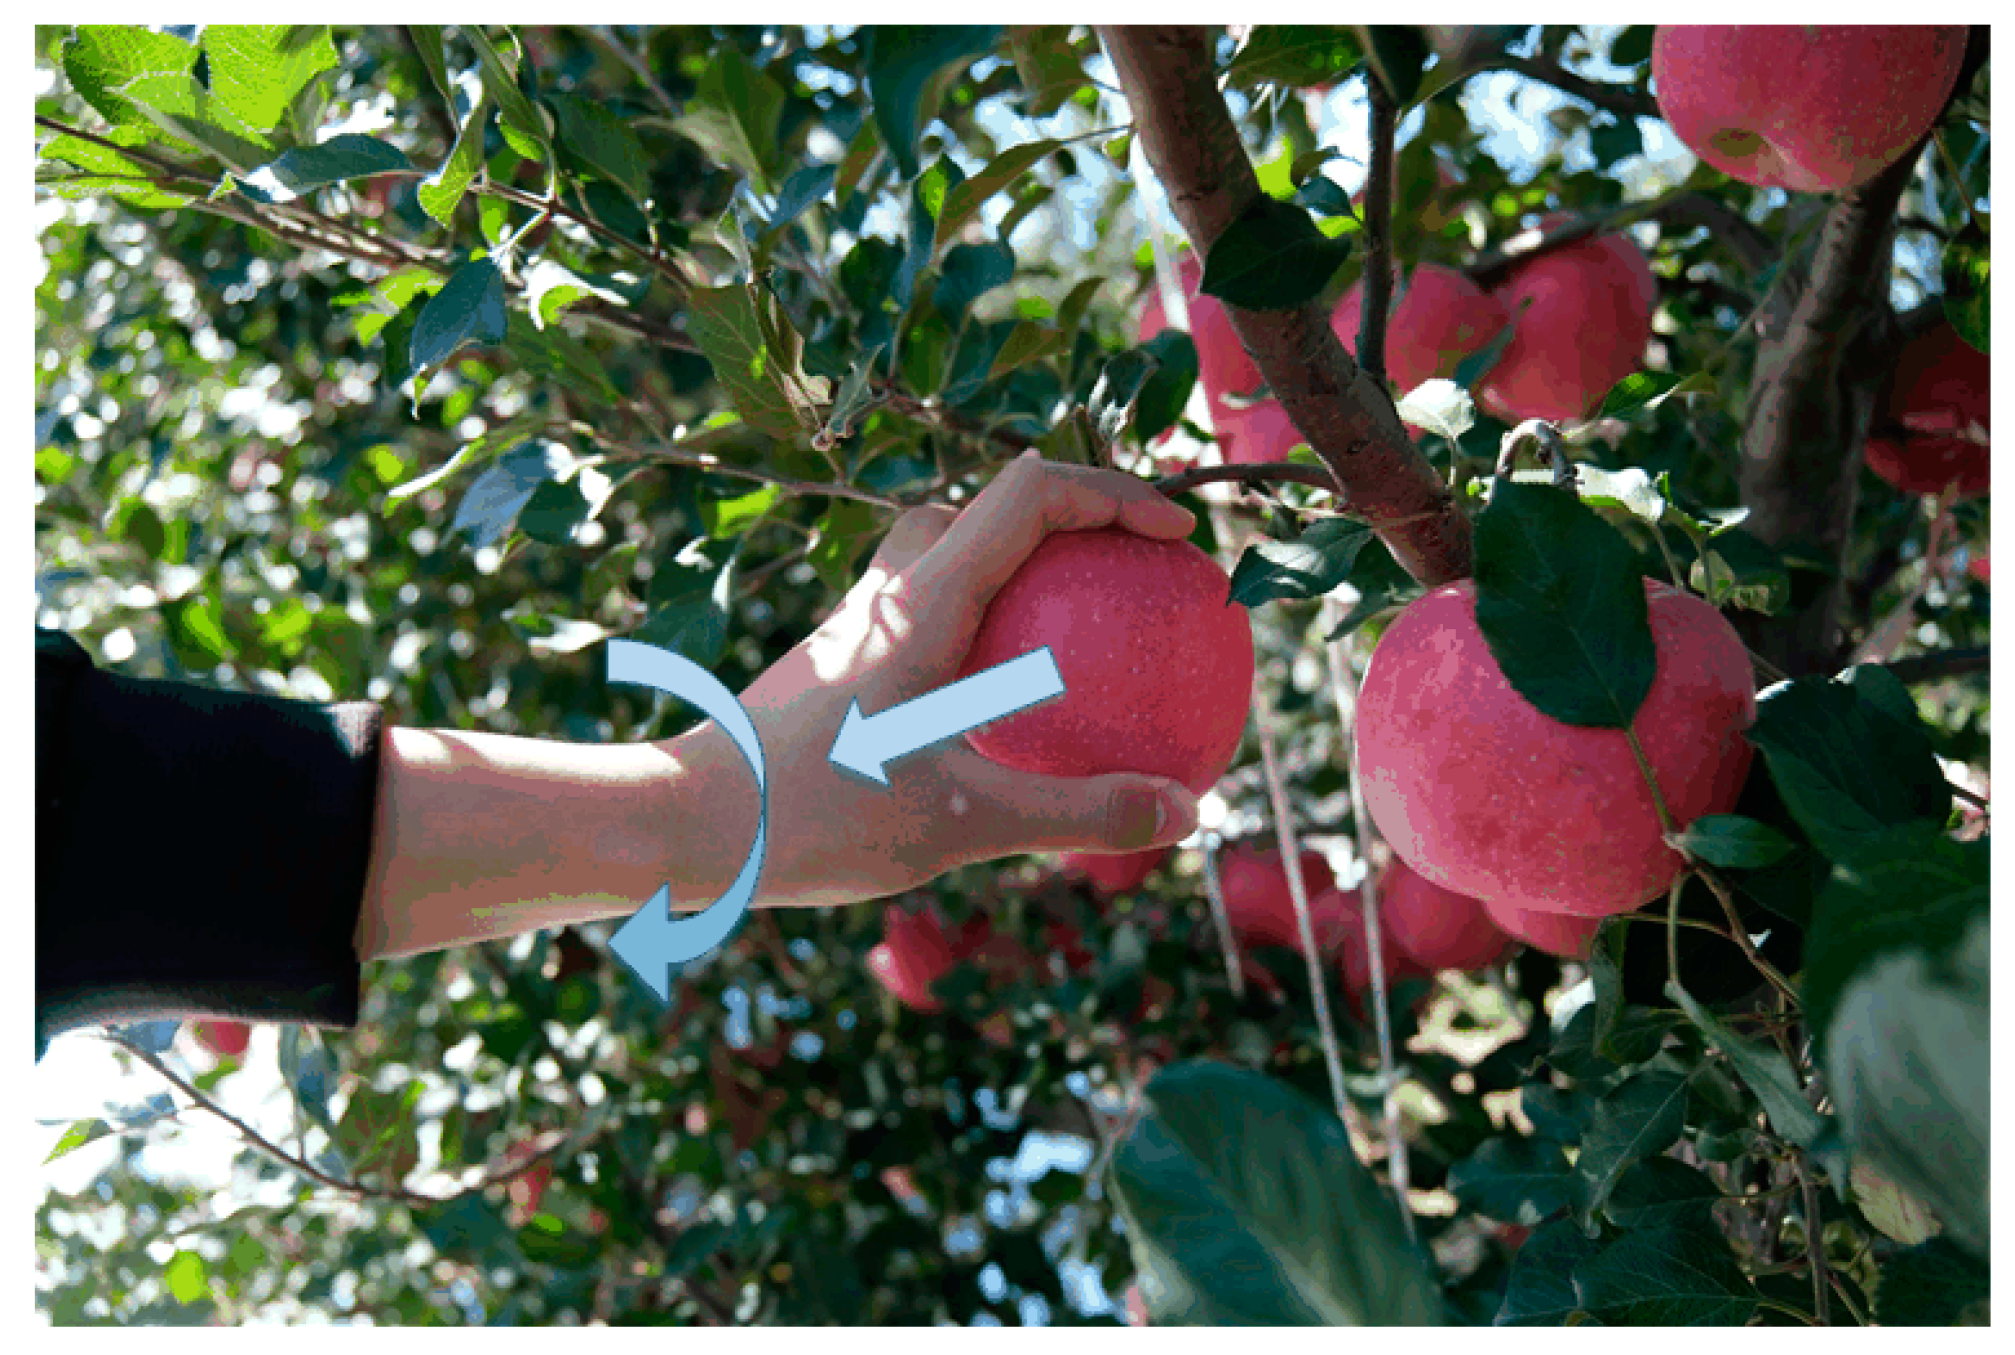
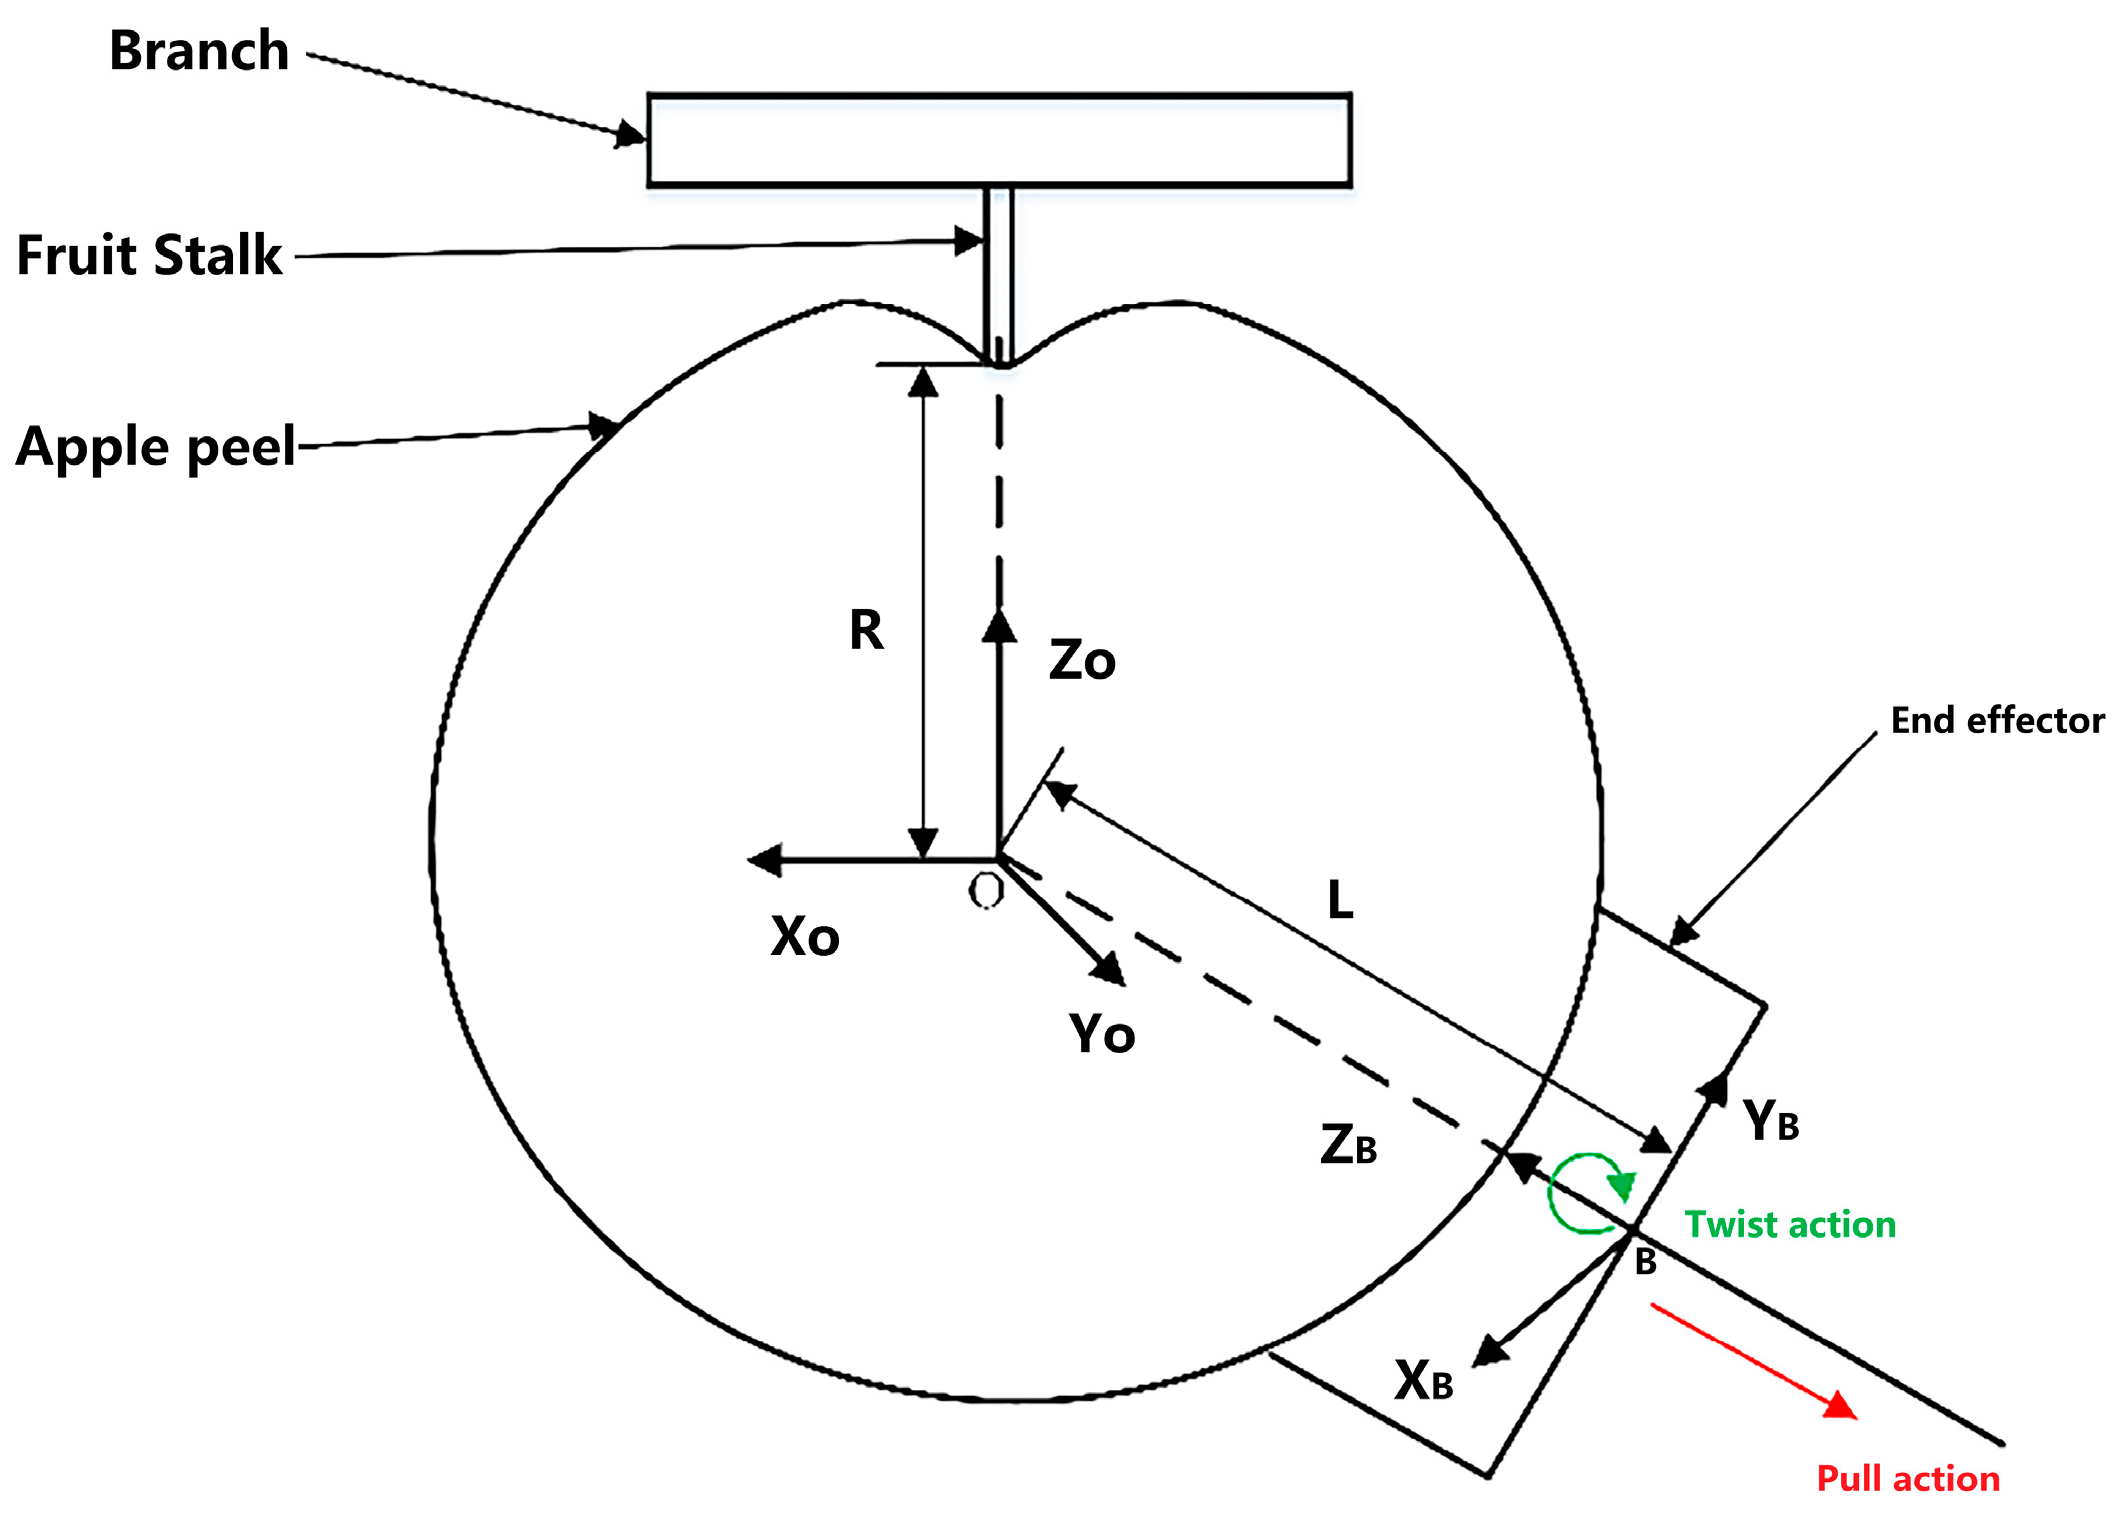
2.7. Optimal Harvesting Mode Study

According to the previous analysis, the claw-type end effector was suitable for the non-structured environment of Chinese orchards. The success rate, damage rate, and stalk retention rate of apple picking, which are key issues in the research of apple-picking robots, are closely related to the picking action. It is necessary to study and optimize the apple-picking mode based on the fruit abscission mechanism, and to construct an efficient, simple, and low-damage picking strategy.

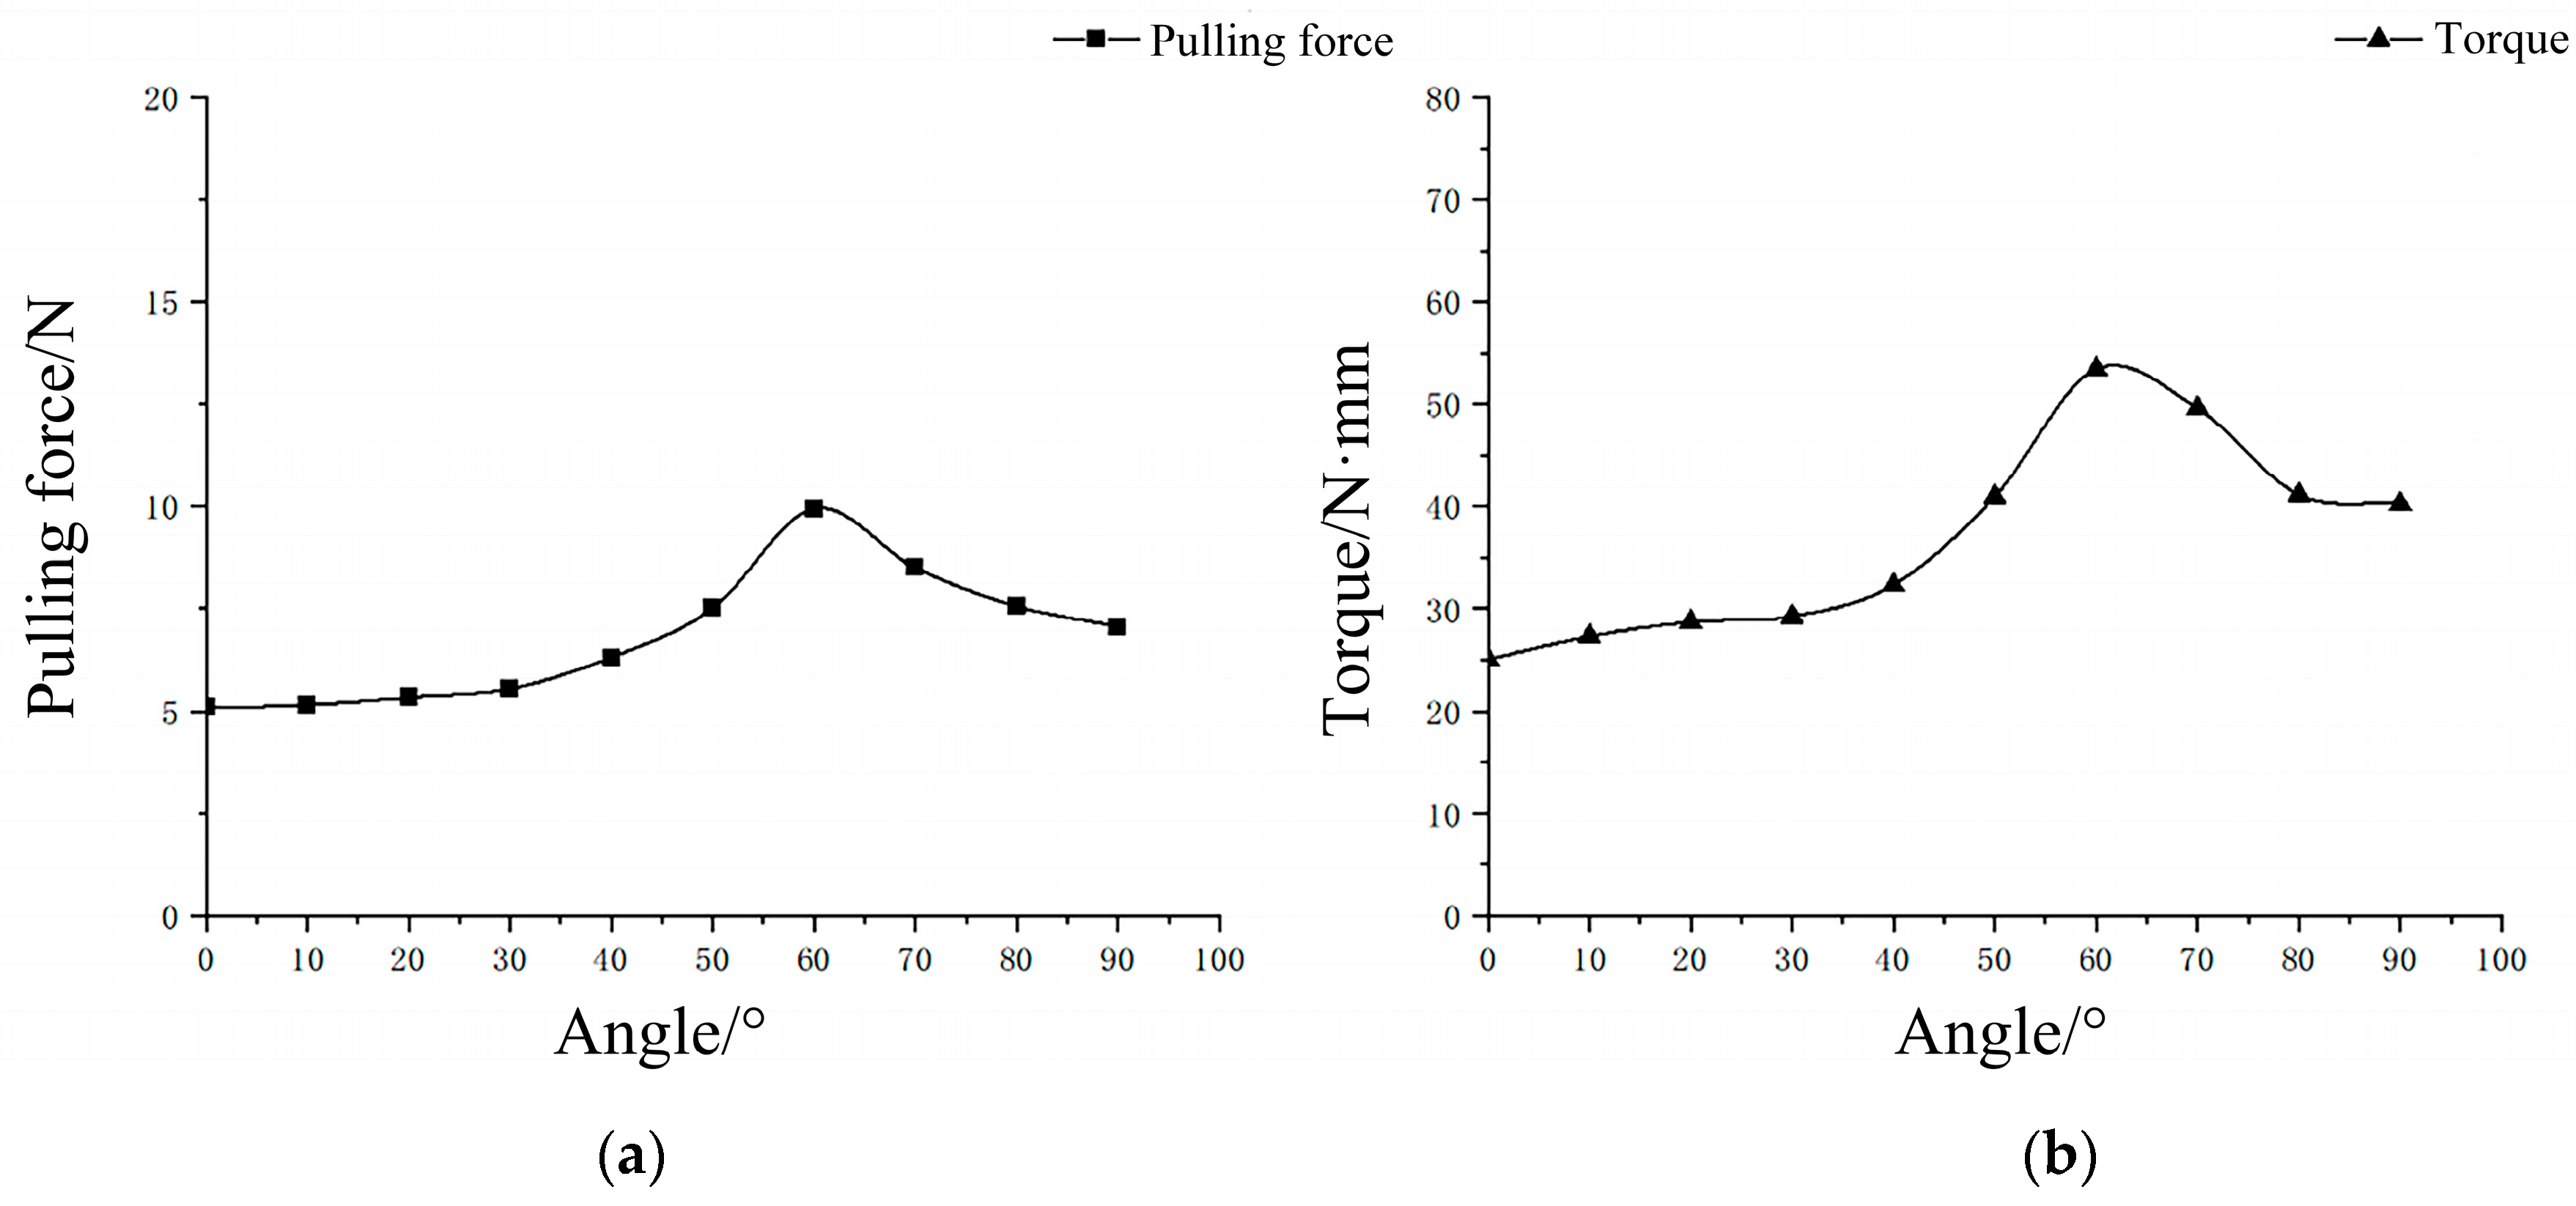
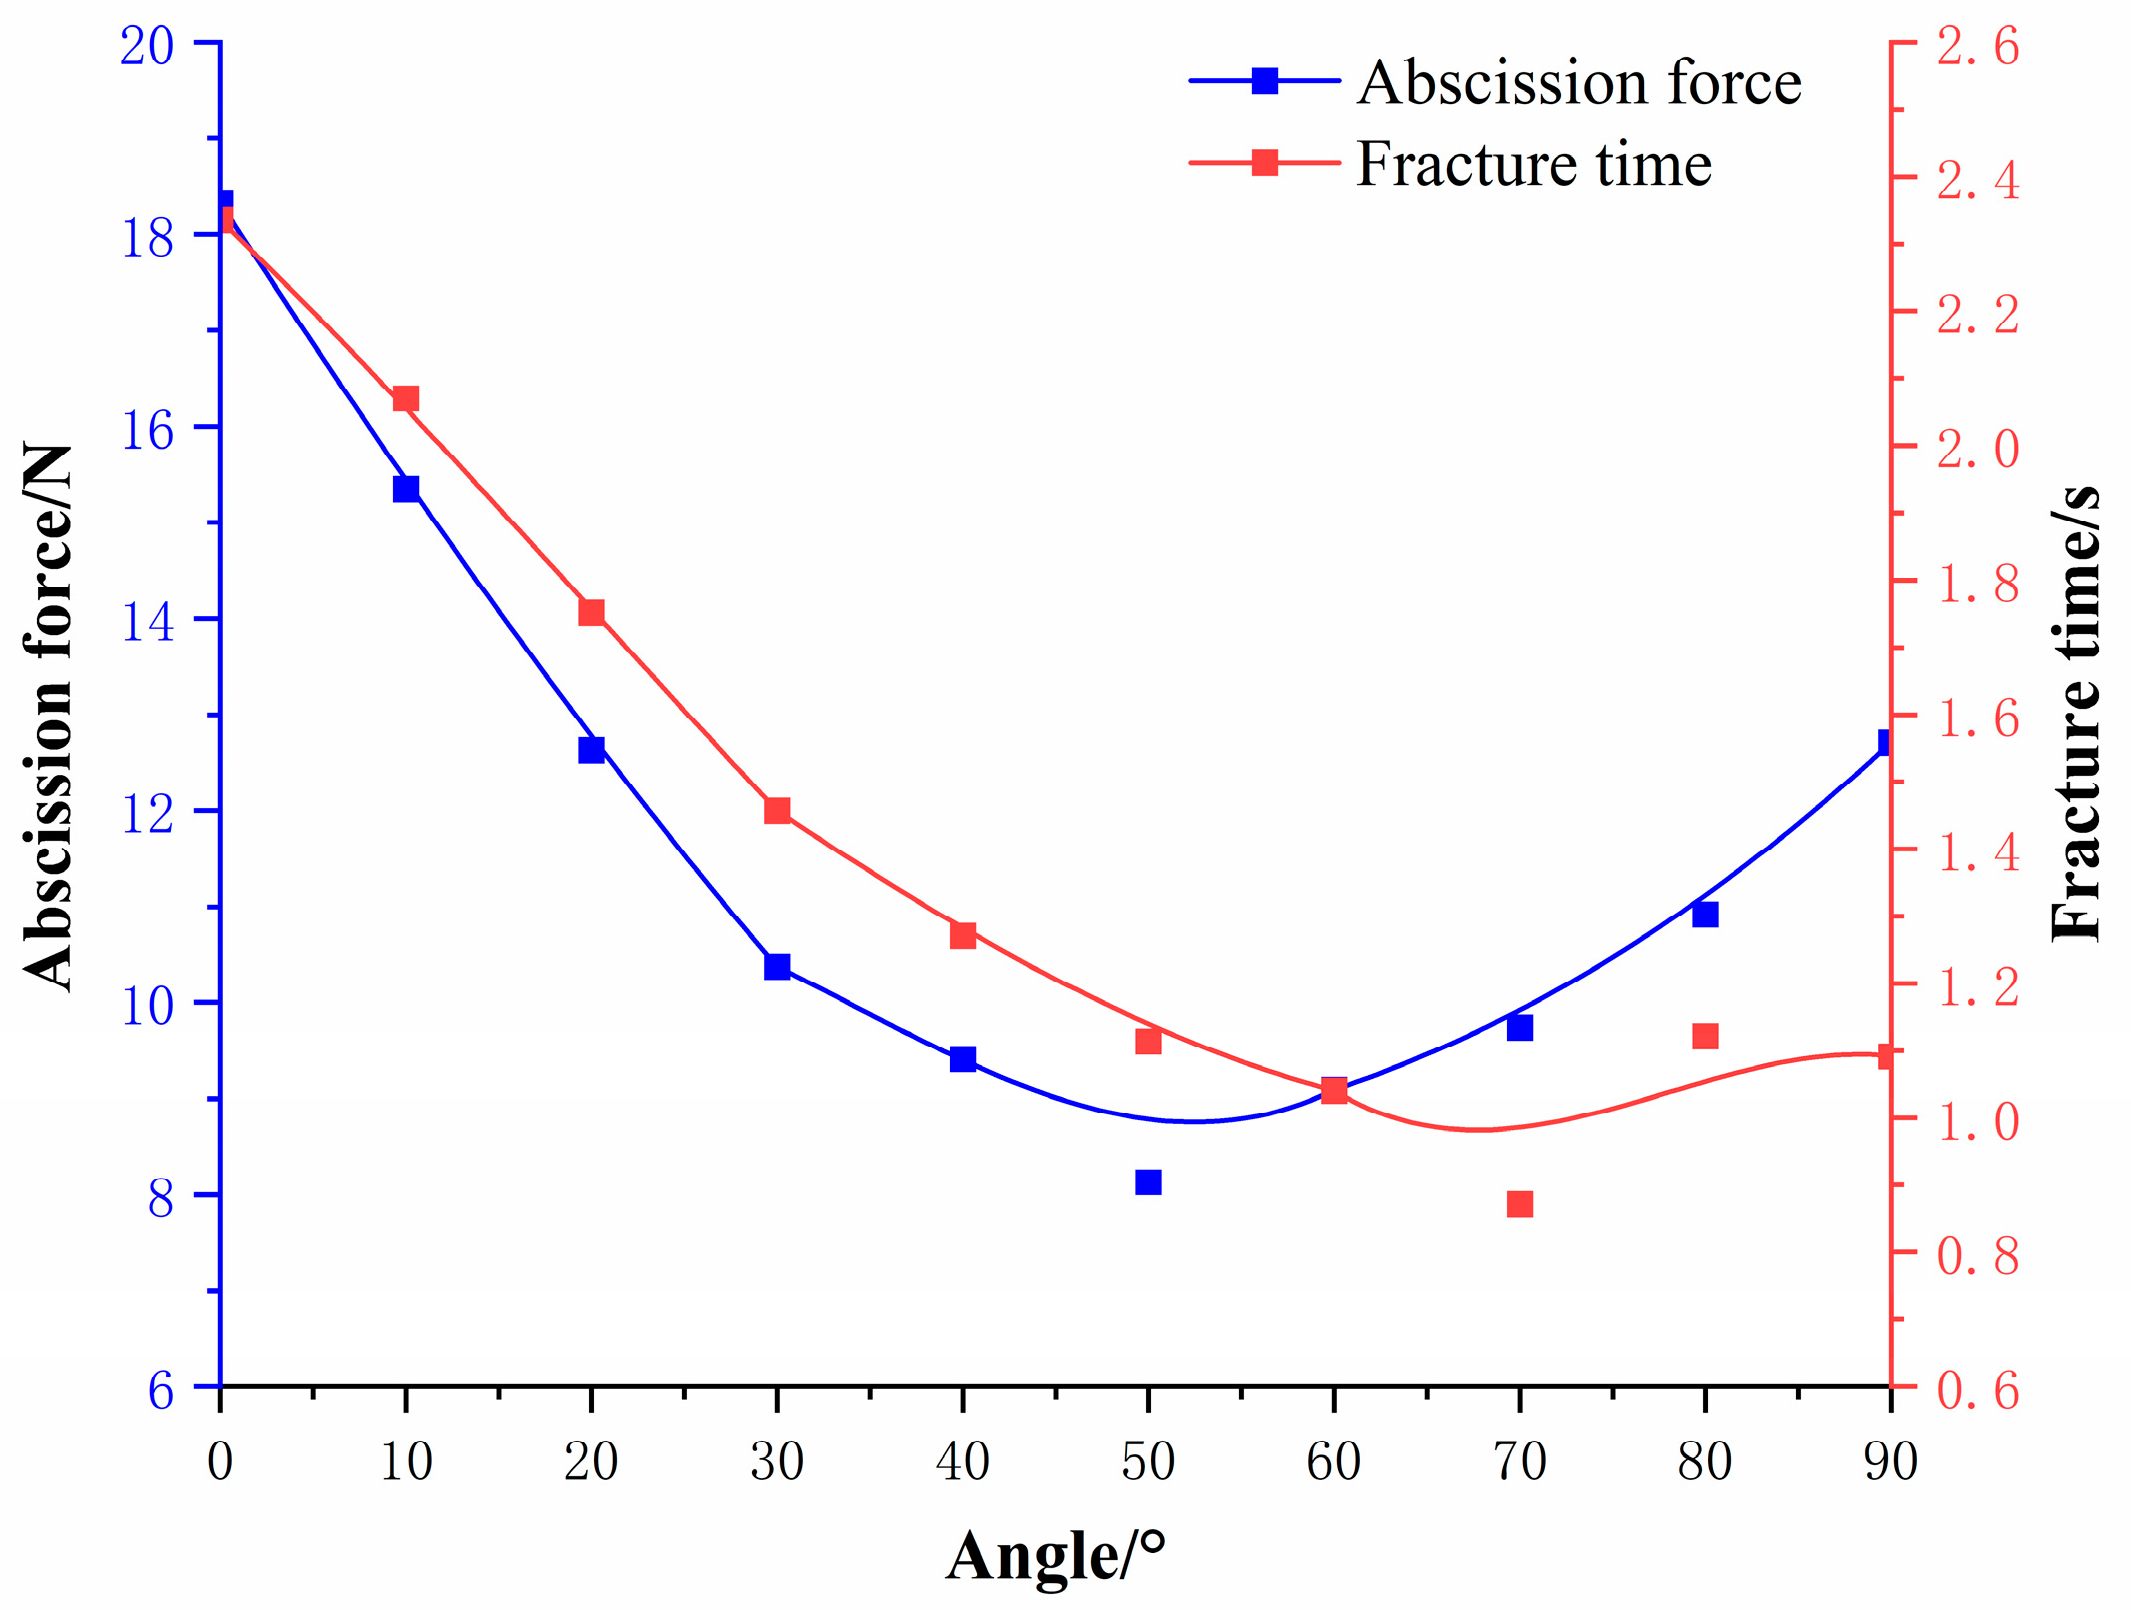
2.7.1. Estimation of the Best Harvesting Angle Based on Finite Element Simulation

In the non-structured orchard environment, the ‘pulling first, then twisting’ method, which mimics manual picking, has been identified as the most effective for the cooperation between the mechanical arm and the end claw [44]. This technique began by using the mechanical arm to pull the target apple away from surrounding fruits, thus preventing damage to adjacent fruits. Once the apple has been abscissed, the end claw twists at a specific angle to accurately pick the apple from the branch. The success of the picking process and the extent of fruit stalk loss primarily depend on the structure of the branch–stalk–fruit system and the load applied to the fruit. When the picking action exerts a load on the fruit, this force is transmitted to the fruit stalk. As a result, the abscission layer at the junction of the fruit stalk and branch experiences stress. If the force and torque exceed the tolerance limit of the abscission layer, the fruit will separate smoothly from the branch, completing the picking process, as shown in Figure 22.
In order to accurately evaluate the impact of picking actions on the success of fruit abscission and damage, a coordinate system {O} was established with the center of the fruit as the origin. A coordinate system {B} was established at the connection point between the end effector and the manipulator, with the center axis of the manipulator as the Z-axis, as shown in Figure 23.
In the figure, R represents the distance from the center of the fruit to the fruit stalk, and L is the distance from the center of the fruit to the end of the manipulator. Rotating around the Z-axis of the {B} coordinate system was called ‘the twist action’, and moving along the Z-axis towards the manipulator was called ‘the pull action’.
By analyzing the impact of picking methods on fruit abscission, both basic picking actions promote abscission, and the pulling force, including horizontal and direct-pulling force, is the main factor causing fruit abscission. Therefore, by using the established finite element model of the branch–stalk–fruit system, simulating the response behavior of the load at different angles θ, and analyzing the stress and torque on the abscission layer, the optimal grip angle of the end effector can be determined, which can effectively reduce the fruit damage rate and improve the picking success rate.

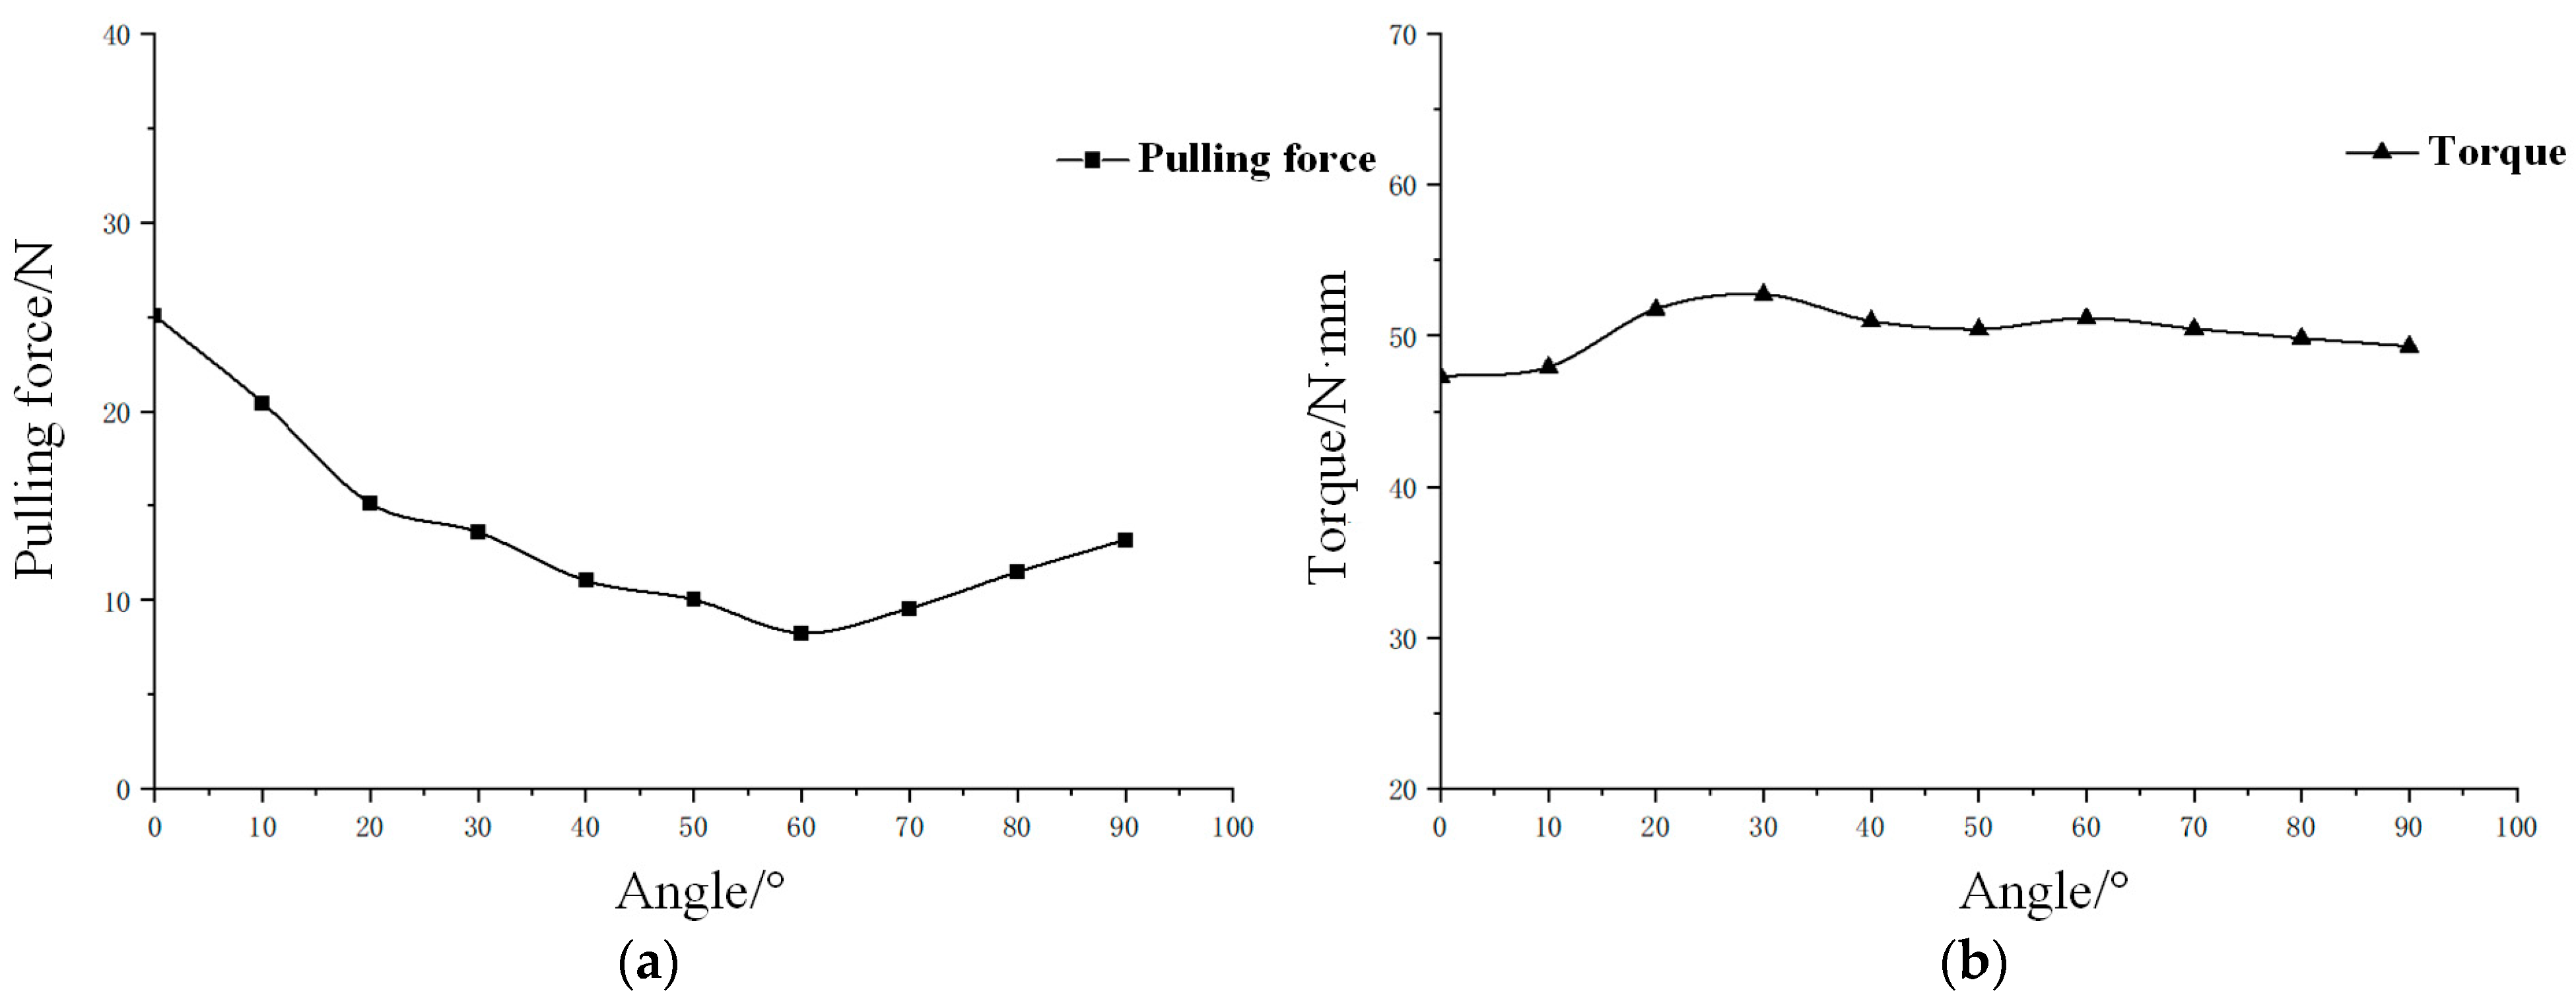
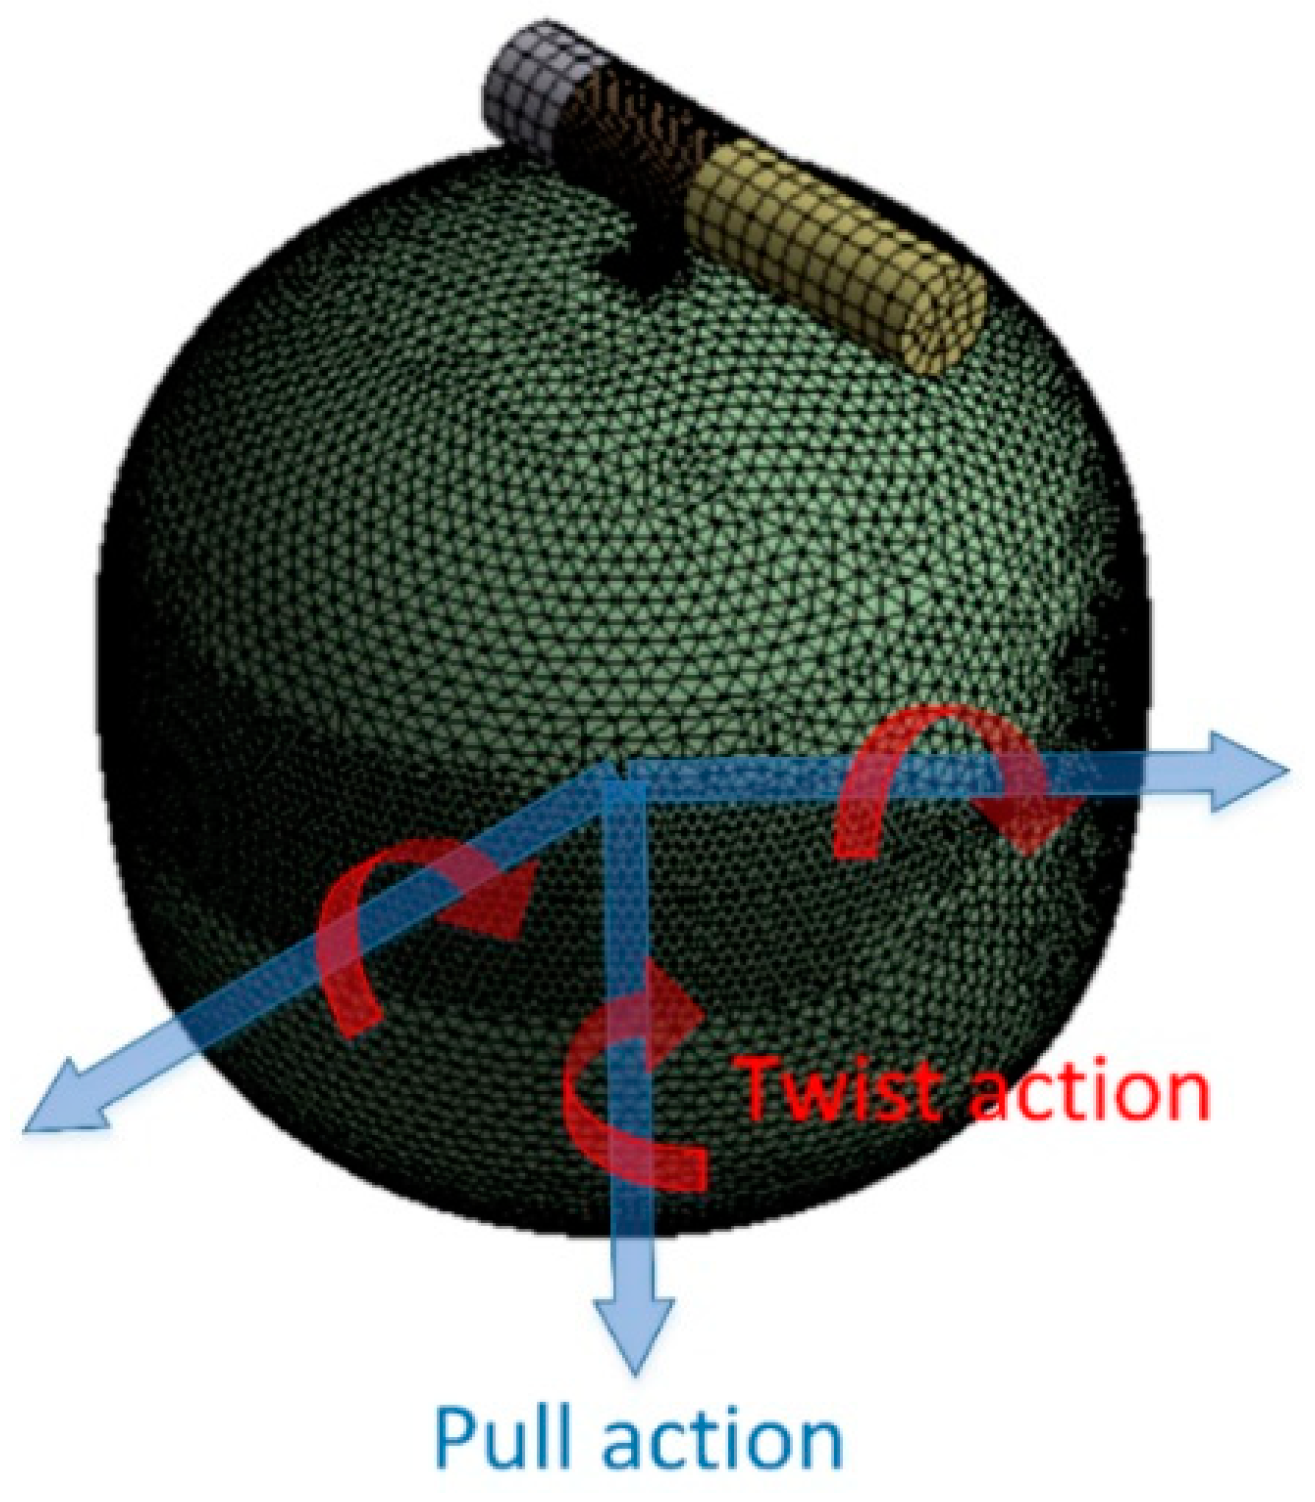
2.7.2. Simulation of Pulling Action at Different Angles

As Figure 24 shows, the branches were fixed at both ends, and a local coordinate system was established with the fruit center as the origin, with the initial direction of the Z-axis along the fruit axis. By rotating the ZOY plane at different angles around the X-axis (equivalent to θ), and applying a displacement along the negative Z-axis, the response of the branch–stalk–fruit system to direct-pulling load at different angles was simulated, and the force and torque on the abscission layer were analyzed.
To more intuitively analyze the impact of pulling action on apple picking at different angles, a displacement of 5 mm/s was set in the negative Z direction, taking every 10° from 0° to 90° for simulation experiments, with an experiment setting time of 2 s. Through simulation, the maximum pulling force and torque on the abscission layer when it fractures are analyzed, and the specific simulation results are shown in Figure 25.
The analysis of the data in the figure indicates that, as the angle increases, the maximum pulling force exerted on the abscission layer decreases until it reaches a minimum of around 60°. Beyond this point, the pulling force gradually increases. Regarding torque, at smaller angles, the torque values are relatively low. However, once the angle exceeds 20°, the torque values stabilize, with maximum and minimum values of 52.74 N·mm and 47.29 N·mm, respectively. Notably, the simulation results for angles of 0°and 90° align with the experiment results from normal and tangential tensile experiments of the abscission layer.
From the experimental results, it is evident that, during fruit picking, the pulling force is transmitted to the abscission layer via the fruit stalk. If the pulling force exceeds the limit, it can cause the fruit stalk to fracture or damage the fruit. The change in torque during the direct-pulling process is minimal and does not significantly impact the efficiency or integrity of the picking. Therefore, the variation in pulling force directly reflects the load on the abscission layer. It is crucial that we use the minimum pulling force necessary to break the abscission layer during the picking process.

2.7.3. Simulation of Twisting Action at Different Angles

During the simulation of the twisting action, the local cylindrical coordinate system is shown in Figure 26, where the X-axis is the direction of rotation. Similarly, by deflecting the coordinate system at different angles and applying a certain velocity displacement in the X-axis direction, the load response behavior of the branch–stalk–fruit system under twisting action at different angles can be simulated, and the force and torque on the abscission layer were analyzed.
A displacement of 5 mm/s was set in the X-axis direction, taking every 10° from 0° to 90° for simulation experiments, with an experiment setting time of 2 s. Through simulation, the maximum pulling force and torque on the abscission layer when it fractures were analyzed, and the specific simulation results are shown in Figure 27.
The data analysis in the figure reveals that, as the α angle increases, the maximum pulling force on the abscission layer during fracture initially rises, reaching a peak of 9.95 N at 60°. After this point, the force decreases to 5.09 N as the angle continues to increase. Compared to the pattern observed with direct-pulling, the variation in pulling force is relatively stable and lower. Likewise, the trend in torque change follows a similar pattern, peaking at 53.44 N·mm at 60° before gradually declining.
The effects of twisting and direct-pulling actions at different angles were compared in the apple-picking simulation experiment. The twisting action generates a small pulling force but takes a long time, resulting in low efficiency and making it unsuitable as the primary method for robotic apple picking. The pulling force is crucial for promoting fruit abscission.

3. Results and Discussion

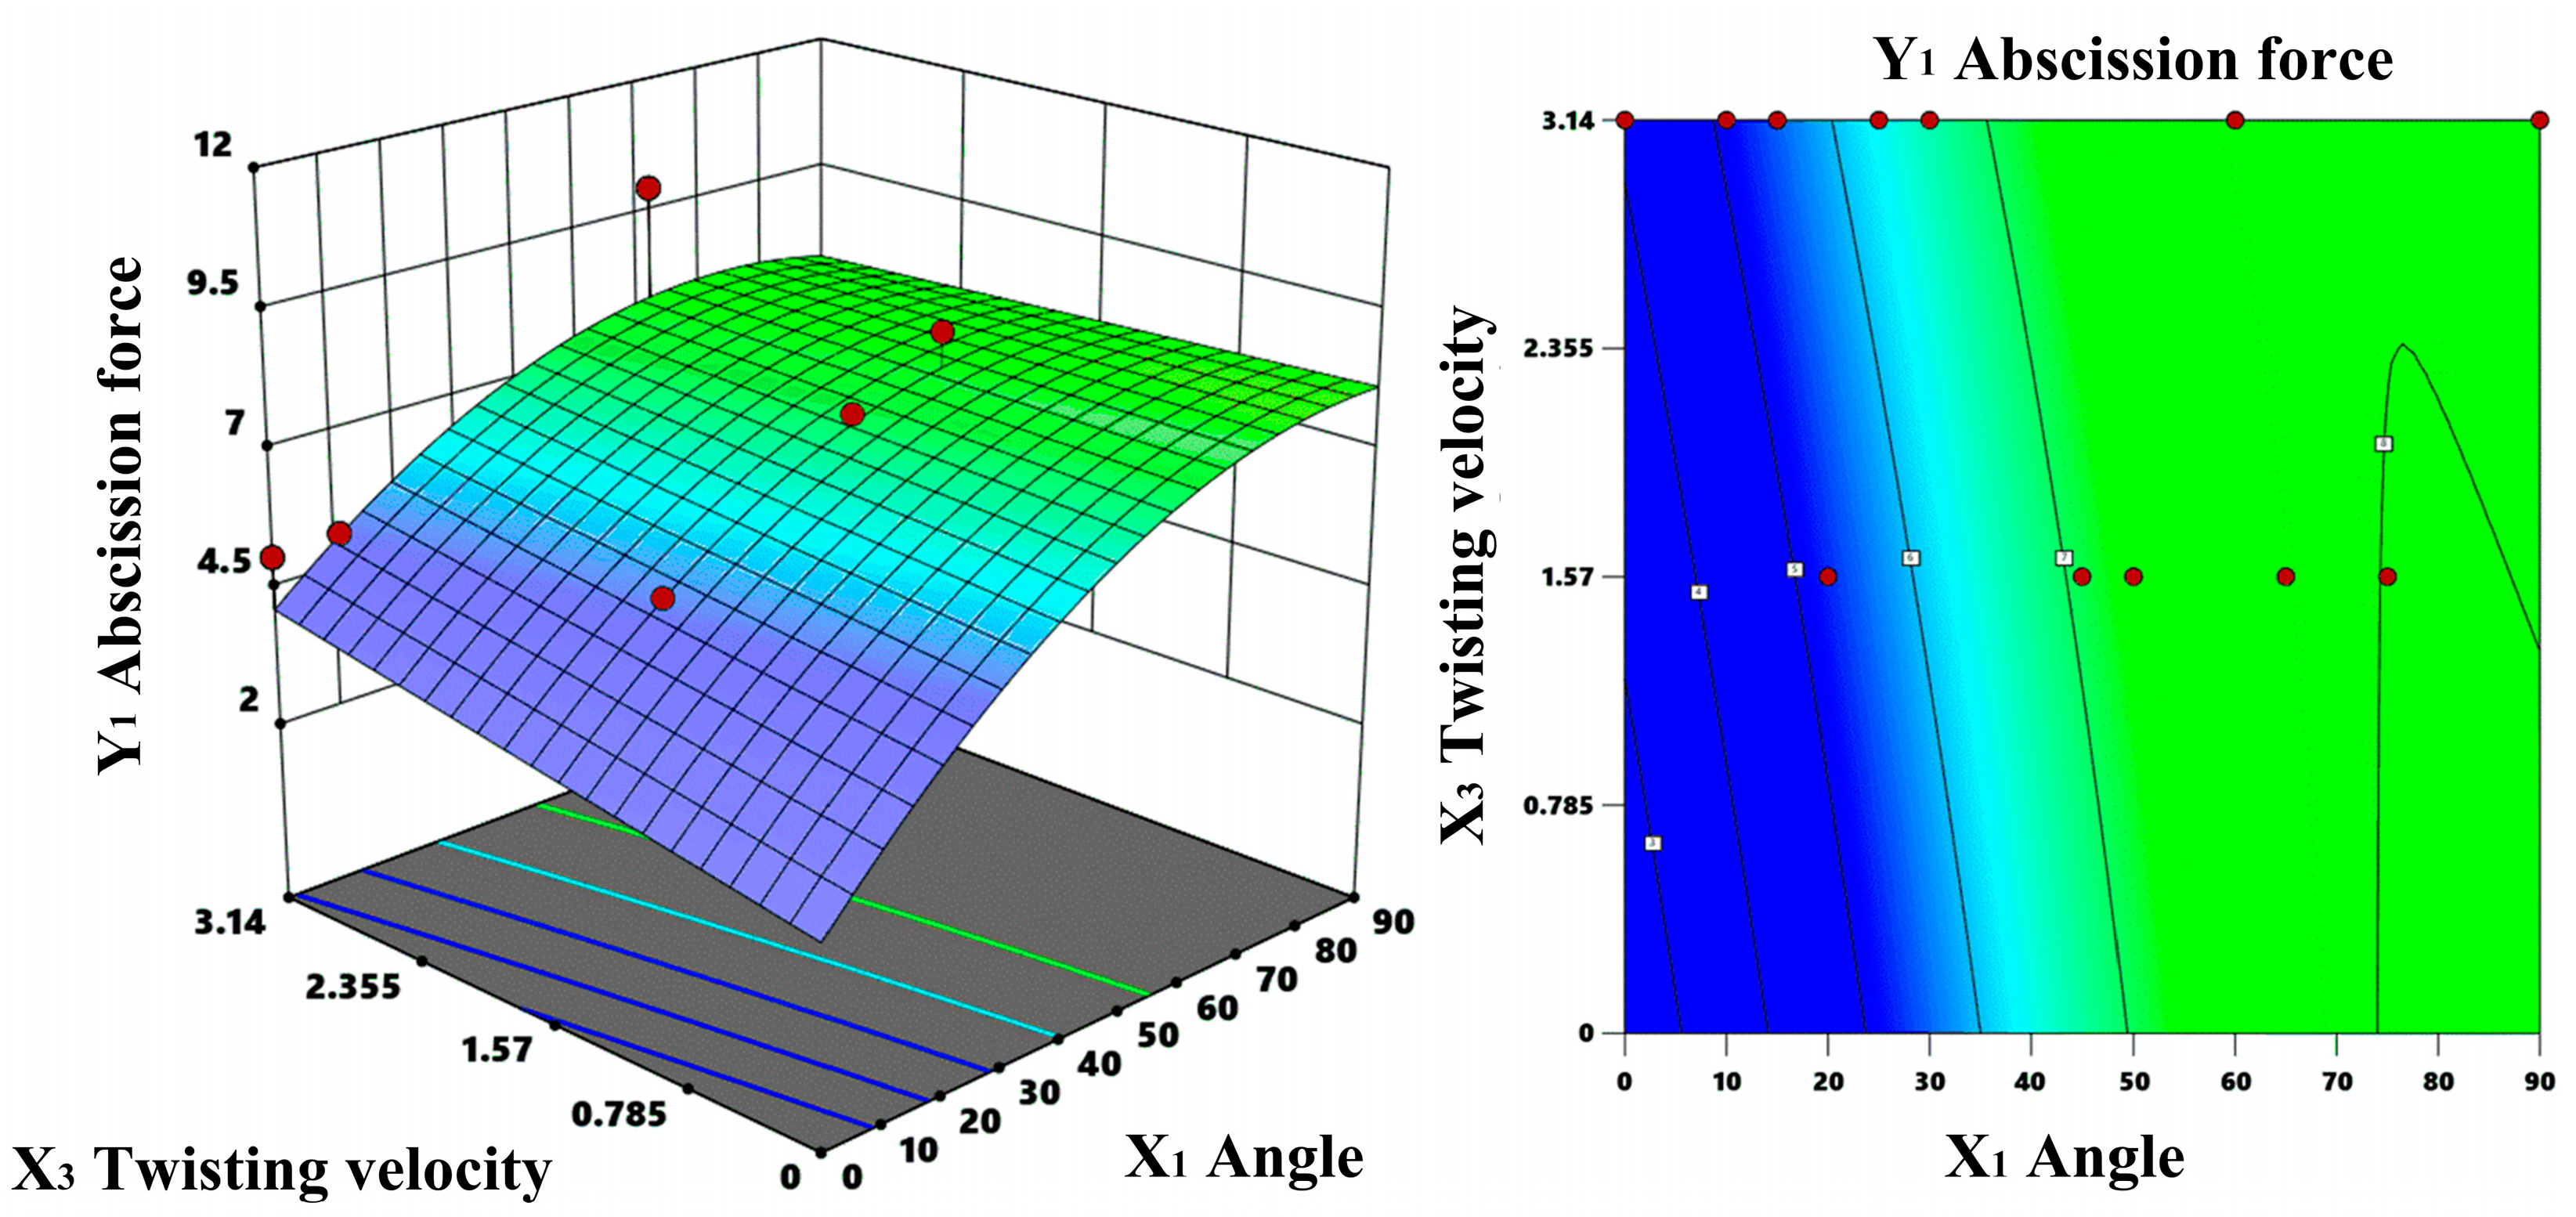
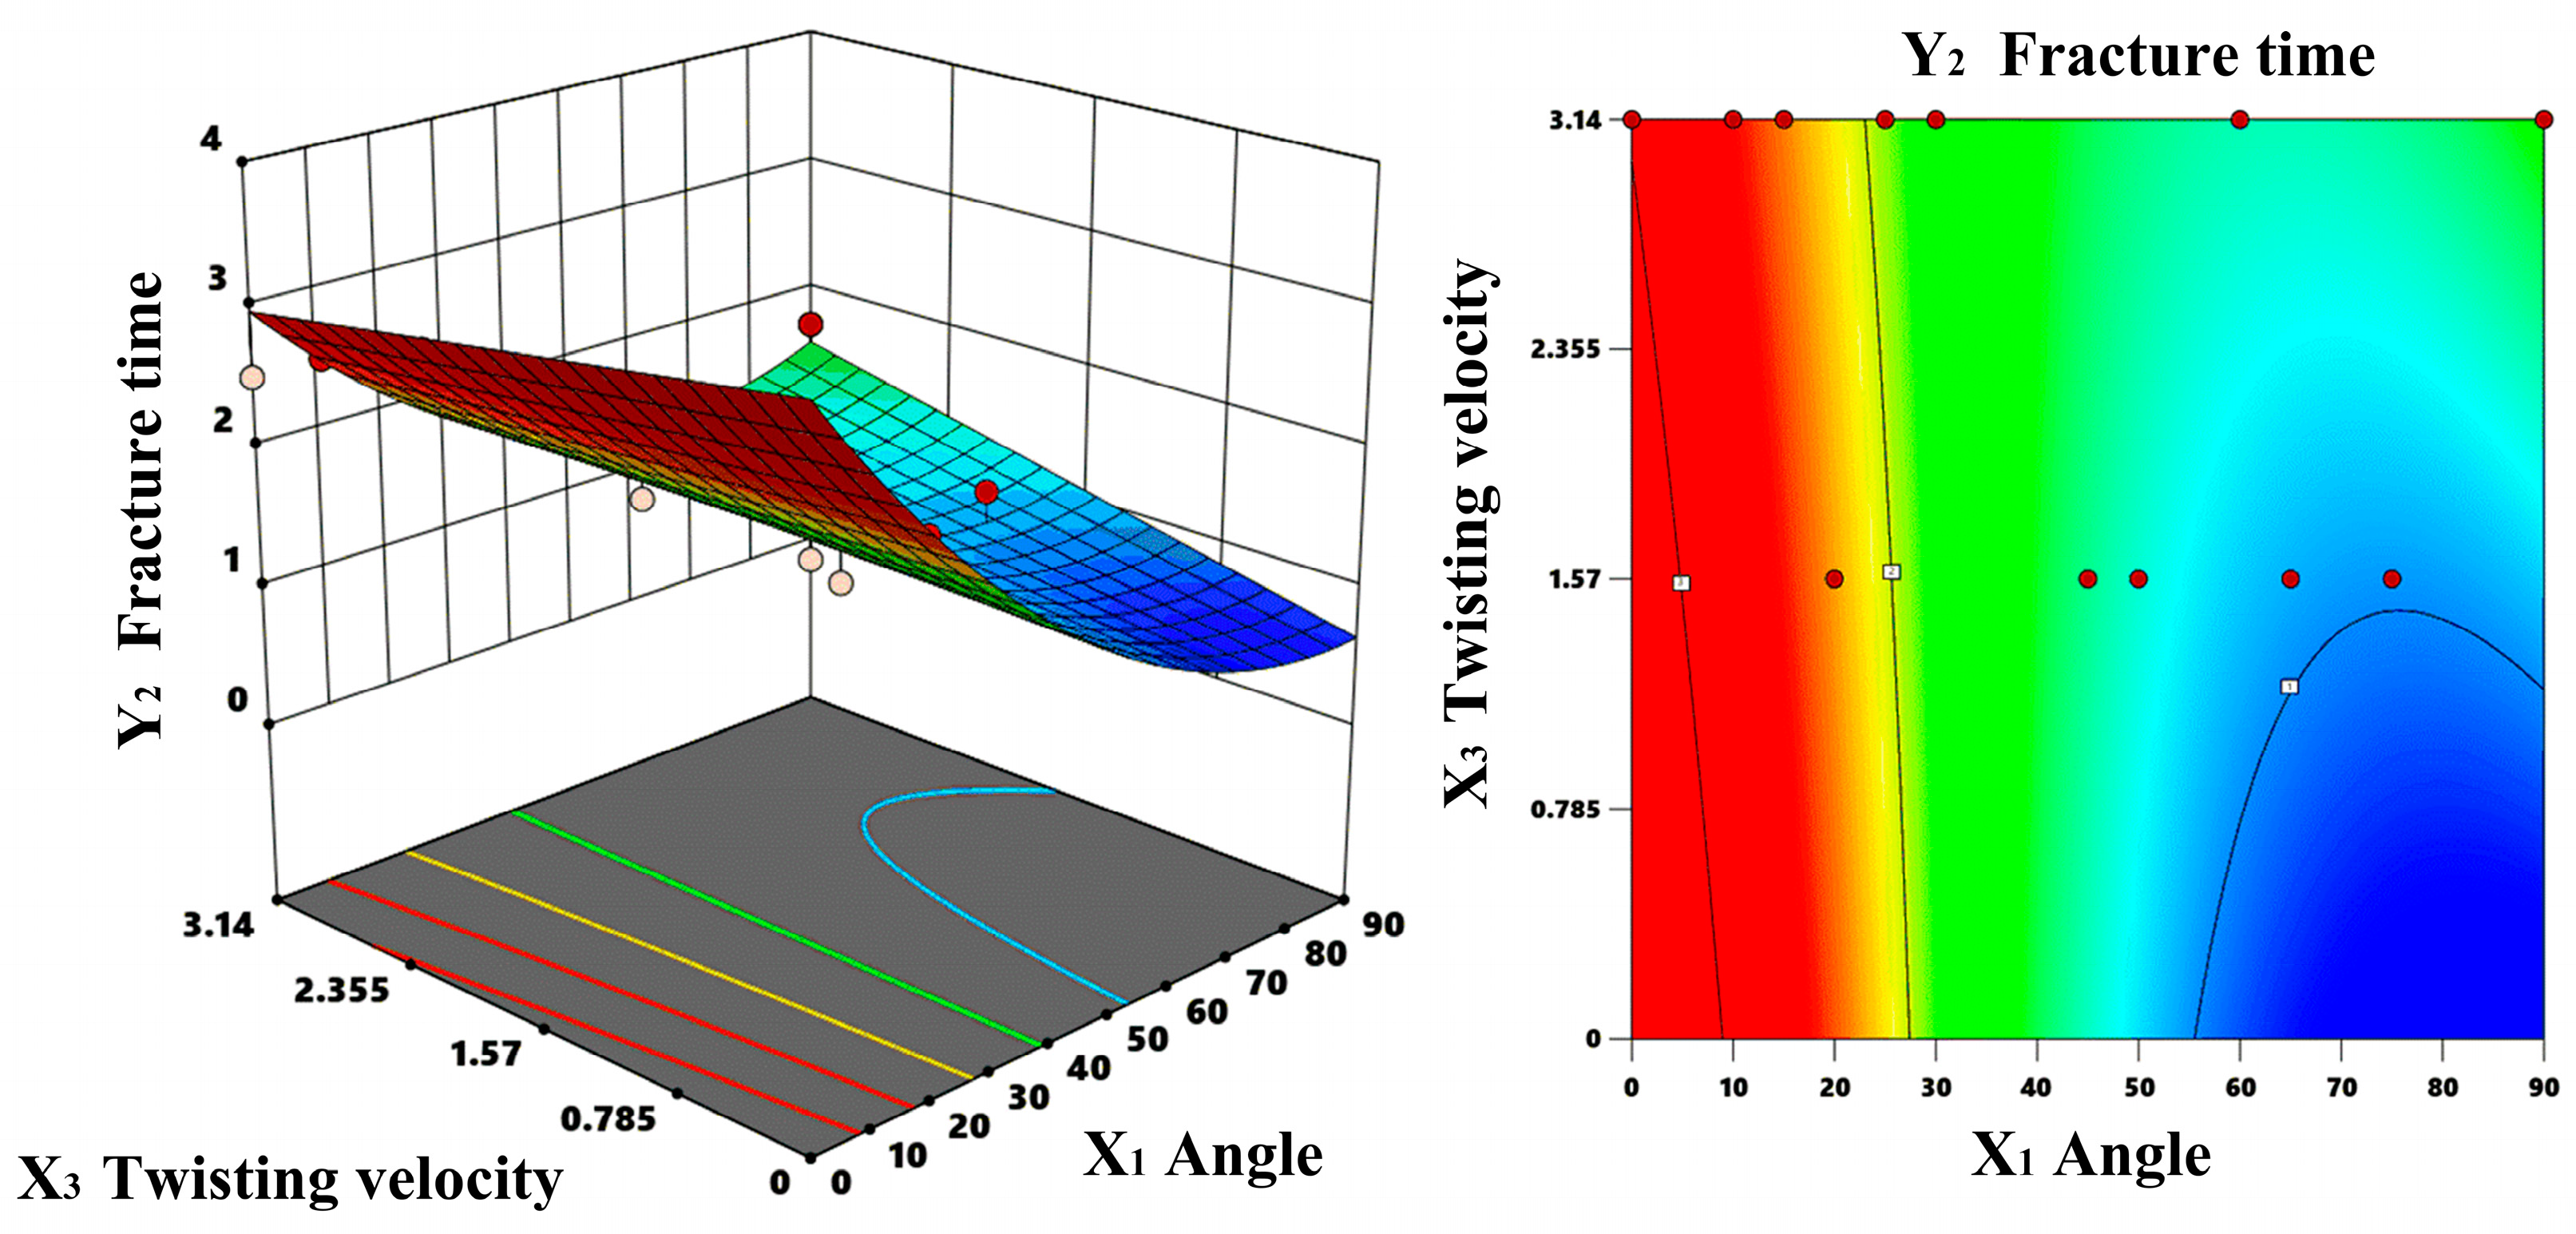
3.1. Response Surface Analysis of Optimal Picking Angle

To clarify the optimal picking angle, based on the previously established model of the branch–stalk–fruit system, the combination of pulling and twisting was used as the action of the mechanical hand-picking apples. The apple falling off the branch with the fruit stalk completely retained on the apple was considered a successful picking, as shown in Figure 28.

3.1.1. Multivariate Regression Analysis

Response surface methodology (RSM) is a statistical technique used to determine the relationship between multiple variables and one or more responses. It simulates the interaction between experimental variables and response variables by constructing a mathematical model, usually a polynomial. For this experiment, the angle between the mechanical arm end and the fruit axis, the direct-pulling speed, and the twisting speed were set as independent variables, and the effects of the independent variables on the two dependent variables, abscission force and fracture time, were investigated.
Based on the previously established finite element model of the branch–stalk–fruit system, the response surface analysis experiment was designed using Design-Expert 8.0 software. The experiment factors and responses are shown in Table 5.
Adopting the response surface analysis to examine the correlation between the dependent variable and independent variables, the dependent variable can be fitted into the general form of a quadratic polynomial model [45], as shown in Equation (11):
Y i = β 0 + i = 1 3 β i X i + i = 1 3 β i i X i 2 + i = 1 2 j = i + 1 3 β i j X i X j
In the equation, Y i (i = 1, 2) represents the dependent variable, that is, the tensile force or fracture time; X i (i = 1, 2, 3) represents the independent variables, that is, the angle between the end of the robotic arm and the fruit’s central axis, the direct-pulling velocity, and the torsional velocity; β 0 ,   β i   ,   β i , i , and β i , j are the intercept, linear coefficient, quadratic coefficient, and interaction coefficient, respectively.
In the simulation experiment process, the apple branches were constrained at both ends, recording the maximum pulling force on the abscission layer during the fruit abscission process. Among them, the angle X 1 between the end-effector center axis and the fruit axis varied from 0 to 90°. The direct-pulling velocity X 2 took 0 mm/s, 5 mm/s, and 10 mm/s; the twisting velocity X 2 took 0 rad/s, 1.57 rad/s, and 3.14 rad/s; a total of 36 simulation experiments were conducted, and the results are shown in Table 6.
Table 7 shows the variance analysis results for the abscission force as a response. In the variance analysis table of the regression equation, the larger the F value and the smaller the p value, the more significant the element in the response surface model, indicating a good fit and the ability to use the response surface model for subsequent optimization design.
Through analysis, it is found that the significant factors P for X 1 , X 2 , X 1 X 2 , and X 1 2 are all less than 0.005, among which X 1 and X 2 are extremely significant influencing factors. The multiple correlation coefficient R 2 is 0.9000, indicating good correlation. The values of Adj . R 2 and   Pred . R 2 are 0.8654 and 0.6667, respectively; these two values are large and close to each other, indicating that the regression model can fully reflect the process and ensure the accuracy of the predictions. Adequacy Precision is the ratio of effective signal to noise; a value greater than 4 is considered reasonable.
The response surface regression equation for the abscission force obtained from the fit is as follows:
Y 1 = 12.095 0.226 X 1 + 1.573 X 2 1.096 X 3 0.0166 X 1 X 2 + 0.00252 X 1 X 3 + 0.0934 X 2 X 3 + 0.00278 X 1 2 0.0429 X 2 2 0.0679 X 3 2
The variance analysis result with the fracture time as the response is shown in Table 8. It can be concluded that the significant factors for X 1 and X 3 have p-values of less than 0.005, while the significant factor X 2 has a p-value of 0.0188. This indicates that X 1 and X 3 are extremely significant influencing factors, and X 2 has a certain degree of influence, but, compared to X 1 and X 3 , its impact is relatively smaller. The multiple correlation coefficient R 2 is 0.8320, indicating good correlation. The Adj . R 2 and   Pred . R 2 values are 0.7738 and 0.5664, respectively, suggesting that the regression model can predict effectively and accurately. The Adequacy Precision is 14.4491, indicating a high level of credibility and precision in the experiment.
The response surface regression equation for the fracture time obtained from the fit is as follows:
Y 2 = 1.722 0.026 X 1 0.103 X 2 + 0.492 X 3 + 0.000698 X 1 X 2 0.00391 X 1 X 3 + 0.00195 X 2 X 3 + 0.00214 X 1 2 + 0.00188 X 2 2 0.0373 X 3 2

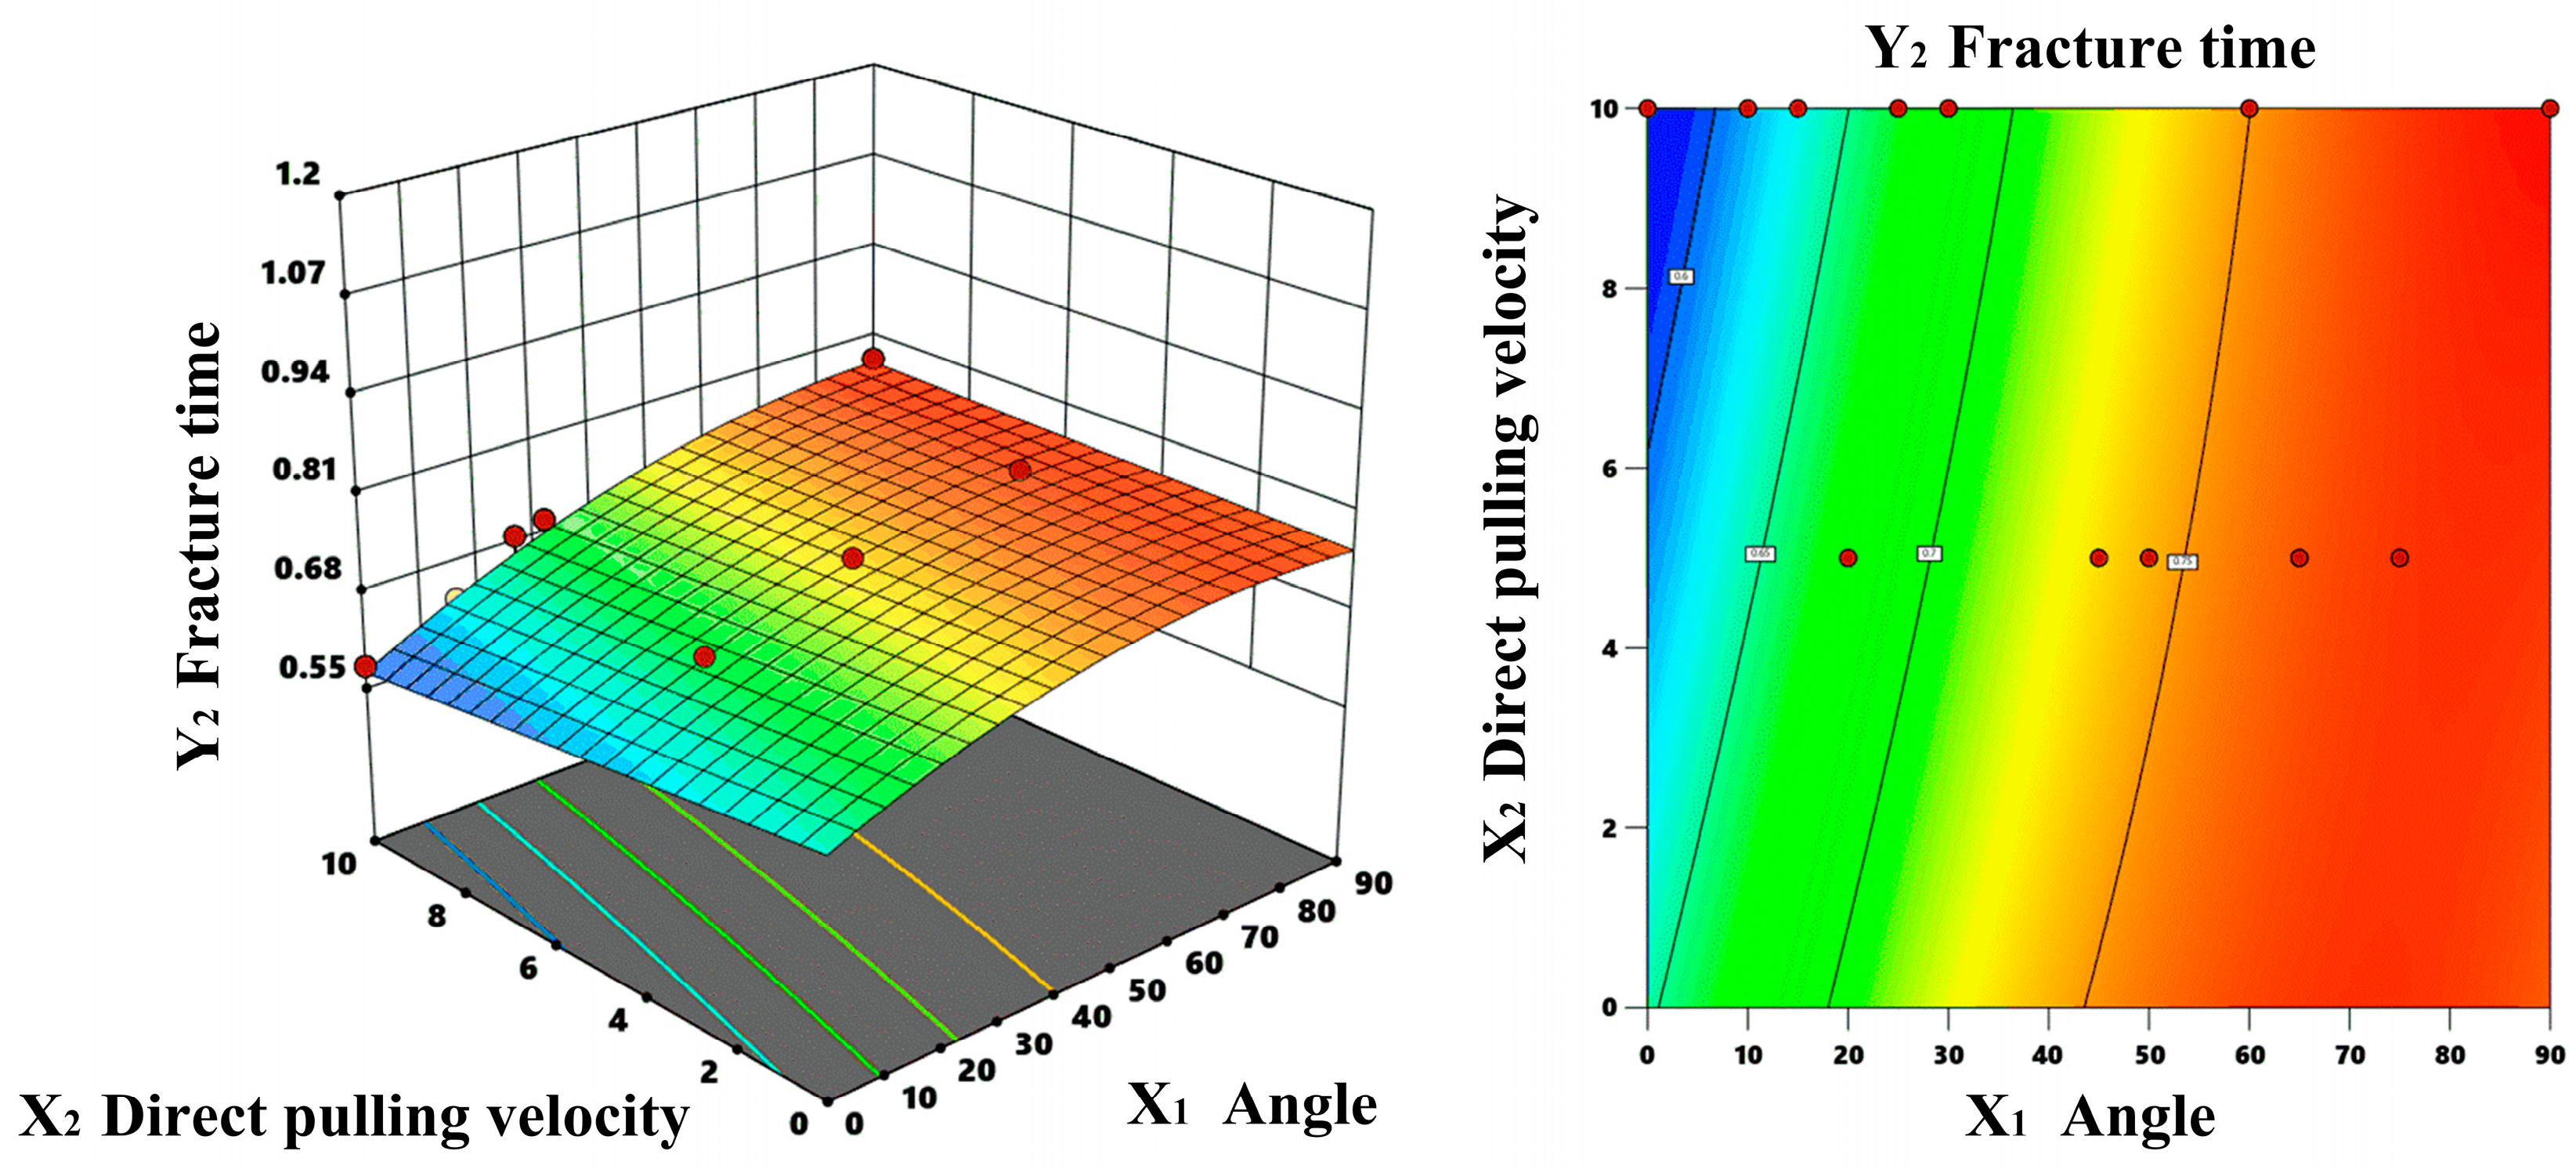
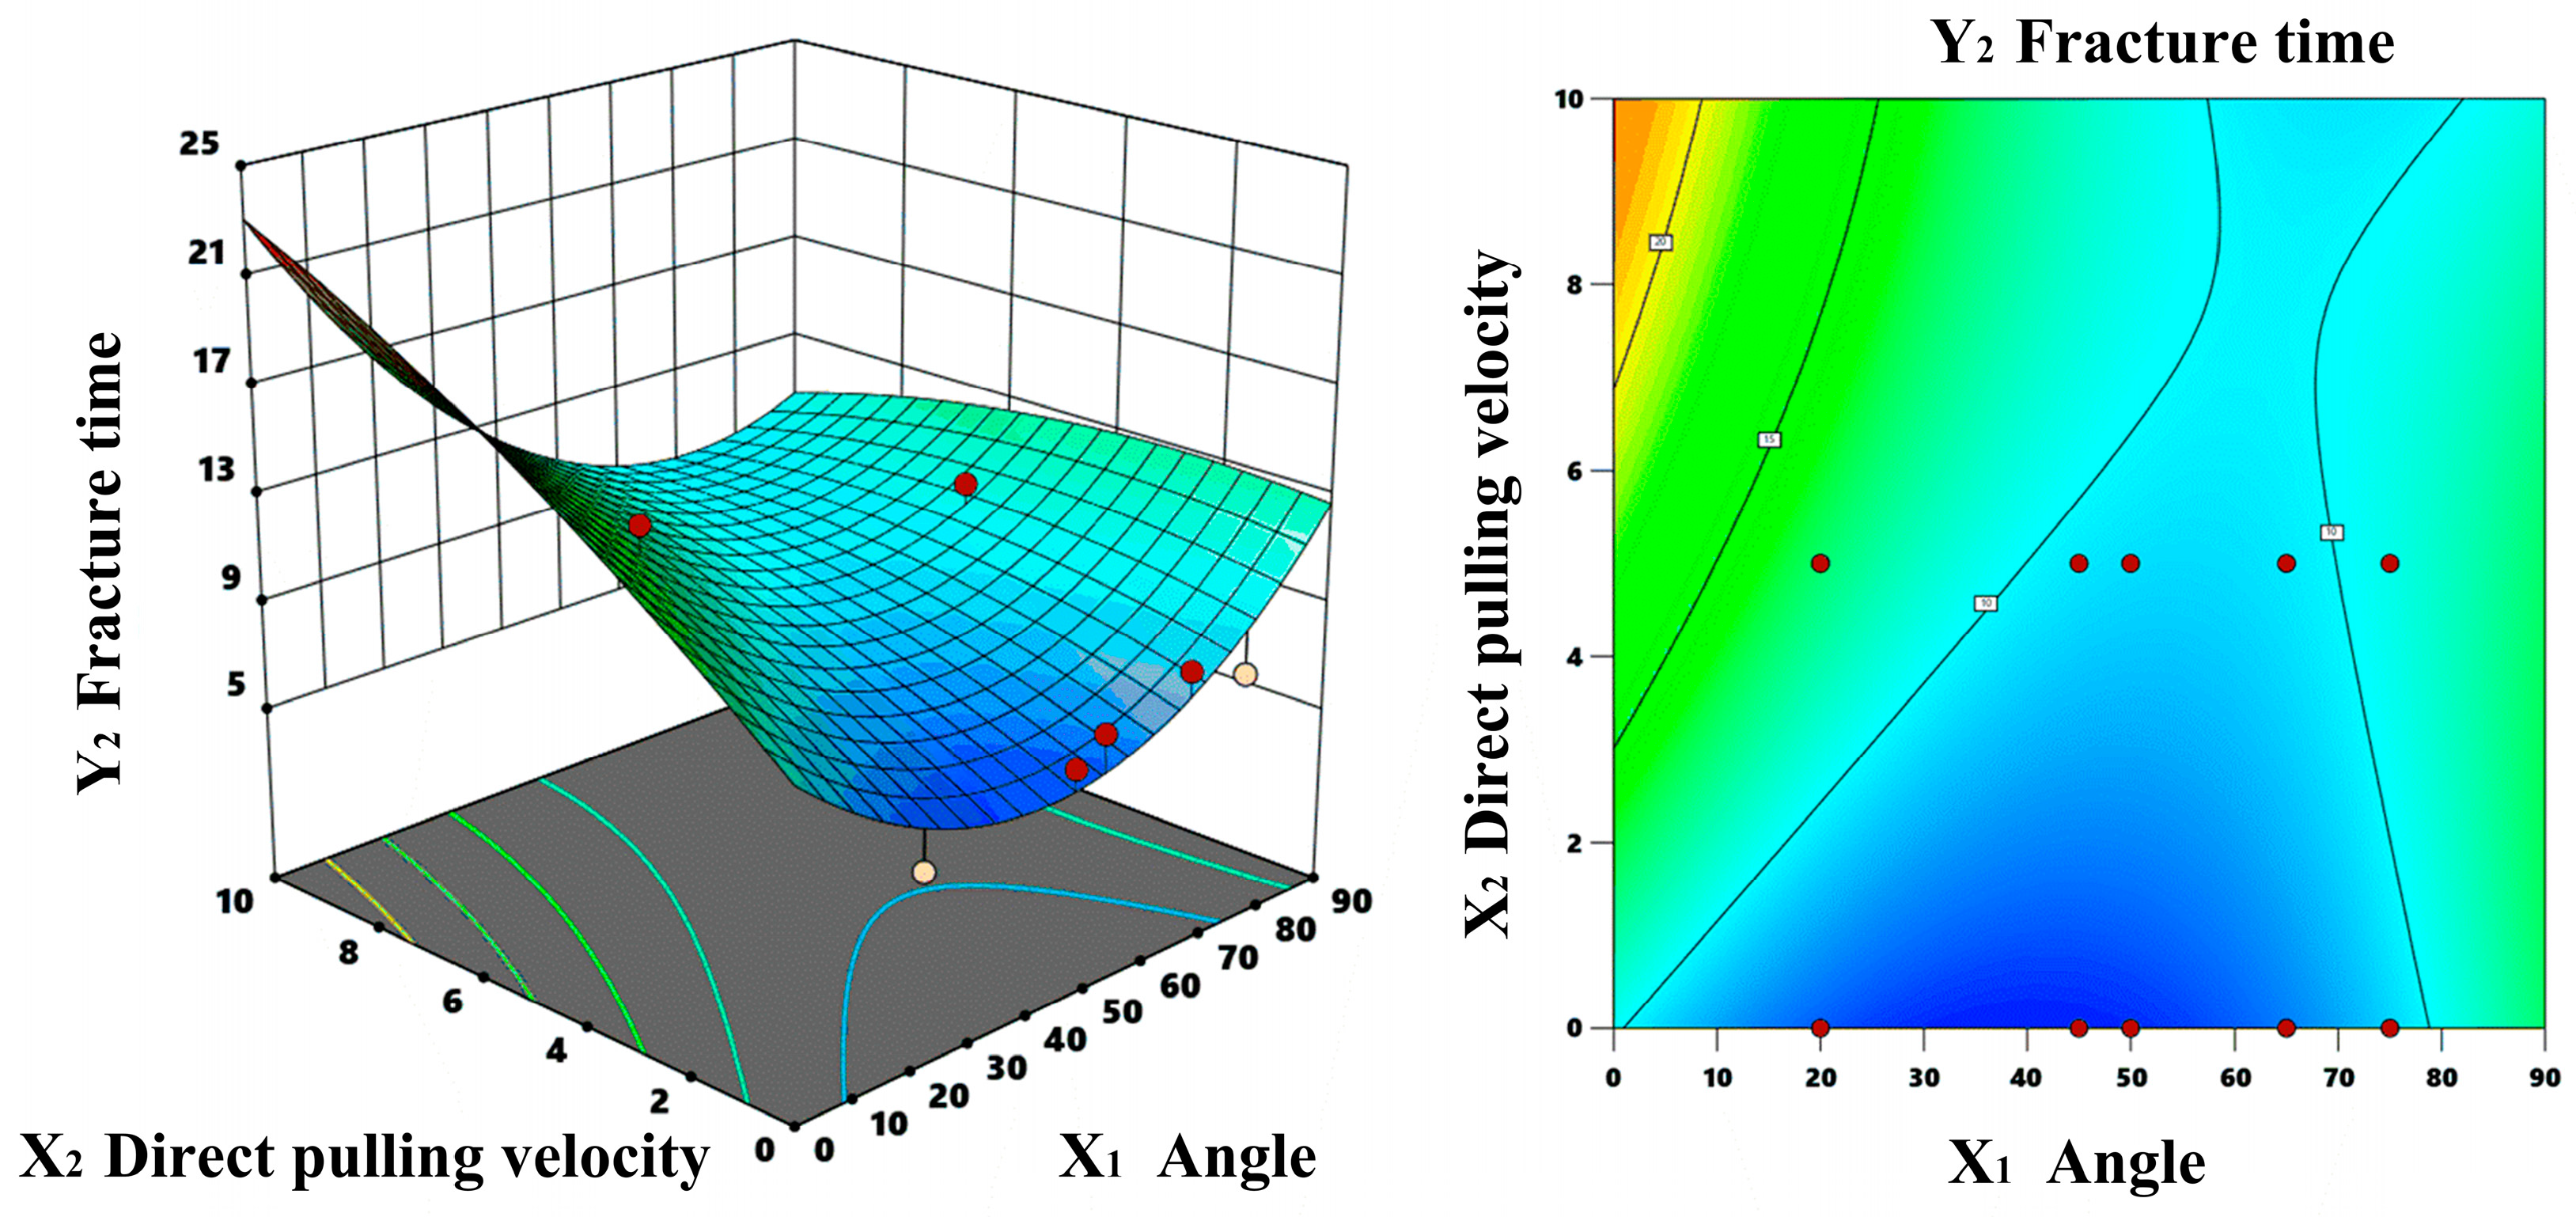
3.1.2. Response Surface Methodology

Through regression equations and the analysis of variance for the quadratic model, X 1 (the angle) and X 2 (the direct-pulling velocity) are significant factors affecting the abscission force. As shown in Figure 29, it illustrates the response of Y 1 (the abscission force) to the variation of X 1 and X 2 when X 3 is not in effect.
The figure illustrates that both the angle and the direct-pulling velocity interactively affect the abscission force. The abscission force peaks when the angle is slight, and the pulling velocity is high. When the angle is either very small or substantial, changes in the pulling velocity have a more significant impact on the abscission force, which will either increase or decrease accordingly. As the angle increases, the abscission force initially decreases before rising again, reaching its lowest point between 40° and 60°. Within this range, the influence of the angle on the abscission force was particularly pronounced.
Figure 30 shows how the abscission force responds to different angles and twisting velocities when direct-pulling velocity was not applied. It is clear that, at any angle, changes in abscission force due to variations in twisting velocity are limited to less than 4 N. The abscission force reaches its maximum around 60°. As the angle increases, the abscission force gradually declines. Overall, the influence of twisting velocity on the abscission force is minimal at different angles, indicating that twisting velocity is not a significant factor affecting the abscission force.
X 1 (the angle) and X 3 (the twisting velocity) are significant factors affecting fracture time when X 2 (the direct-pulling velocity) is not in effect. The response surface curve illustrating fracture time as a function of angle and twisting velocity is displayed in Figure 31. An analysis of this curve reveals that fracture time decreases with an increasing angle, reaching a minimum near 60°. Beyond this point, the effect of twisting velocity on fracture time diminishes. As the angle continues to increase, the fracture time gradually increases. When the angle remains constant, the fracture time varies with changes in twisting velocity; however, the angle’s influence is more significant. At smaller angles, twisting velocity substantially affects fracture time: the lower the twisting velocity, the longer the fracture time required, eventually reaching a peak value.
Figure 32 shows the response surface curve of Y 2 (the fracture time) as a function of X 1 (the angle) and X 2 (the direct-pulling velocity) when   X 3 (the twisting velocity) is not in effect. It is evident from the figure that fracture time does not change significantly with direct-pulling velocity. The overall response surface shows a trend of increasing fracture time with increasing angles, stabilizing at larger angles.

3.1.3. Parameter Optimization and Optimal Solution

With the objectives of minimizing the abscission force and fracture time, the three factors of the picking process were optimized under the following constraints (Table 9):
When the three factors X 1 (angle), X 2 (direct-pulling velocity), and X 3 (twisting velocity) act together, the response surface curves of abscission force and fracture time, with X 1 and X 2 as significant factors for the abscission force, and X 1 and X 3 as significant factors for the fracture time, are shown in Figure 33 and Figure 34, respectively.
Thereby, using the optimal solution toolbox of Design-Expert, the optimal solutions relative to the responses of the abscission force and fracture time were obtained, as shown in Table 10.
According to the optimal solution results, when the mechanical arm’s end is positioned at approximately 58° relative to the fruit’s axis, the fruit can be successfully picked with a direct-pulling velocity of 3 mm/s and a twisting angular velocity of 2.115 rad/s. Under these conditions, the maximum pulling force exerted on the fruit at the moment of abscission is 8.1 N, and the fracture time is 0.942 s. This approach effectively reduces the risk of fruit damage, fruit stalk fractures, and the risk of pulling the fruit out prematurely. Additionally, it maintains a good picking efficiency, suggesting that this combination represents an optimal picking action and can serve as a valuable reference for path planning.

3.2. Fruit Abscission Process Validation Experiment

In order to verify that the abscission force applied to the abscission layer during the separation process at each angle and the time of the abscission-layer breakage in the model simulation were consistent with the actual picking process, an empirical experiment was conducted in the laboratory. The samples used for testing were taken from the Jingxiang Fruit and Vegetable Orchard in Weihai, Shandong Province, and the variety was Red Fuji fruit trees. The samples were all at fruit maturity, requiring more than 180 days from the time of blossom fall to the time of picking. The test samples were wrapped in cling film and placed in a portable crisper to ensure that the wet basis moisture content of the branches and fruit stalks varied by less than 5%, and all testing was completed within one day of picking.
The equipment used is shown in Figure 35 and Figure 36, which can mimic a robotic arm’s direct-pulling and twisting actions during picking, and, in order to minimize the bruising of the fruit surface by the end effector, a cushioning material was attached to the end of the three-jawed clamp. In the experiment, apples were attached to a three-jaw chuck. A translational servomotor drove an electric cylinder to apply force to the apples along the axis of the end effector, simulating the direct stretch picking process. Simultaneously, a rotary servomotor drove the spindle and rotated the three-jaw gripper to simulate twist picking.
In 30 sample experiments for apple picking, all samples successfully achieved abscission. Three repetitive experiments were conducted at the same angle, and the apples’ maximum tensile force and fracture time were recorded from force to abscission. The comparison of the experiment results with the simulation results is shown in Figure 37. Obviously, there is an extremely high degree of overlap between the experimental data and the simulation data: with the increase in the picking angle, the abscission force in both the experimental and simulation results shows a trend of decreasing and then increasing, and reaching the minimum value around 50°, while the fracture time decreases with the increase of the angle, and reaches the minimum at around 70°. This indicates that the experimental results are similar to the model simulation results, and the optimal picking conditions predicted by the model simulation can be used in actual picking operations.
The mean values of abscission force and fracture time at each angle were curve-fitted for the analysis of optimal picking conditions, as shown in Figure 38. Through the analysis of the test results, it can be obtained that, when the angle is 60°, the mean value of the maximum abscission force is 8.92 N, and the mean value of the fracture time is 1.04 s, which is similar to the value of the optimal solution. Considering the complexity of the environment and the calculation error in the actual picking process, it can be considered that, when the angle is between 55 and 65°, the combination of the direct pulling and twisting picking manoeuvre can be used as a potential optimal picking manoeuvre, which can use a smaller abscission force to complete the picking of fruits in a shorter period of time at the same time.

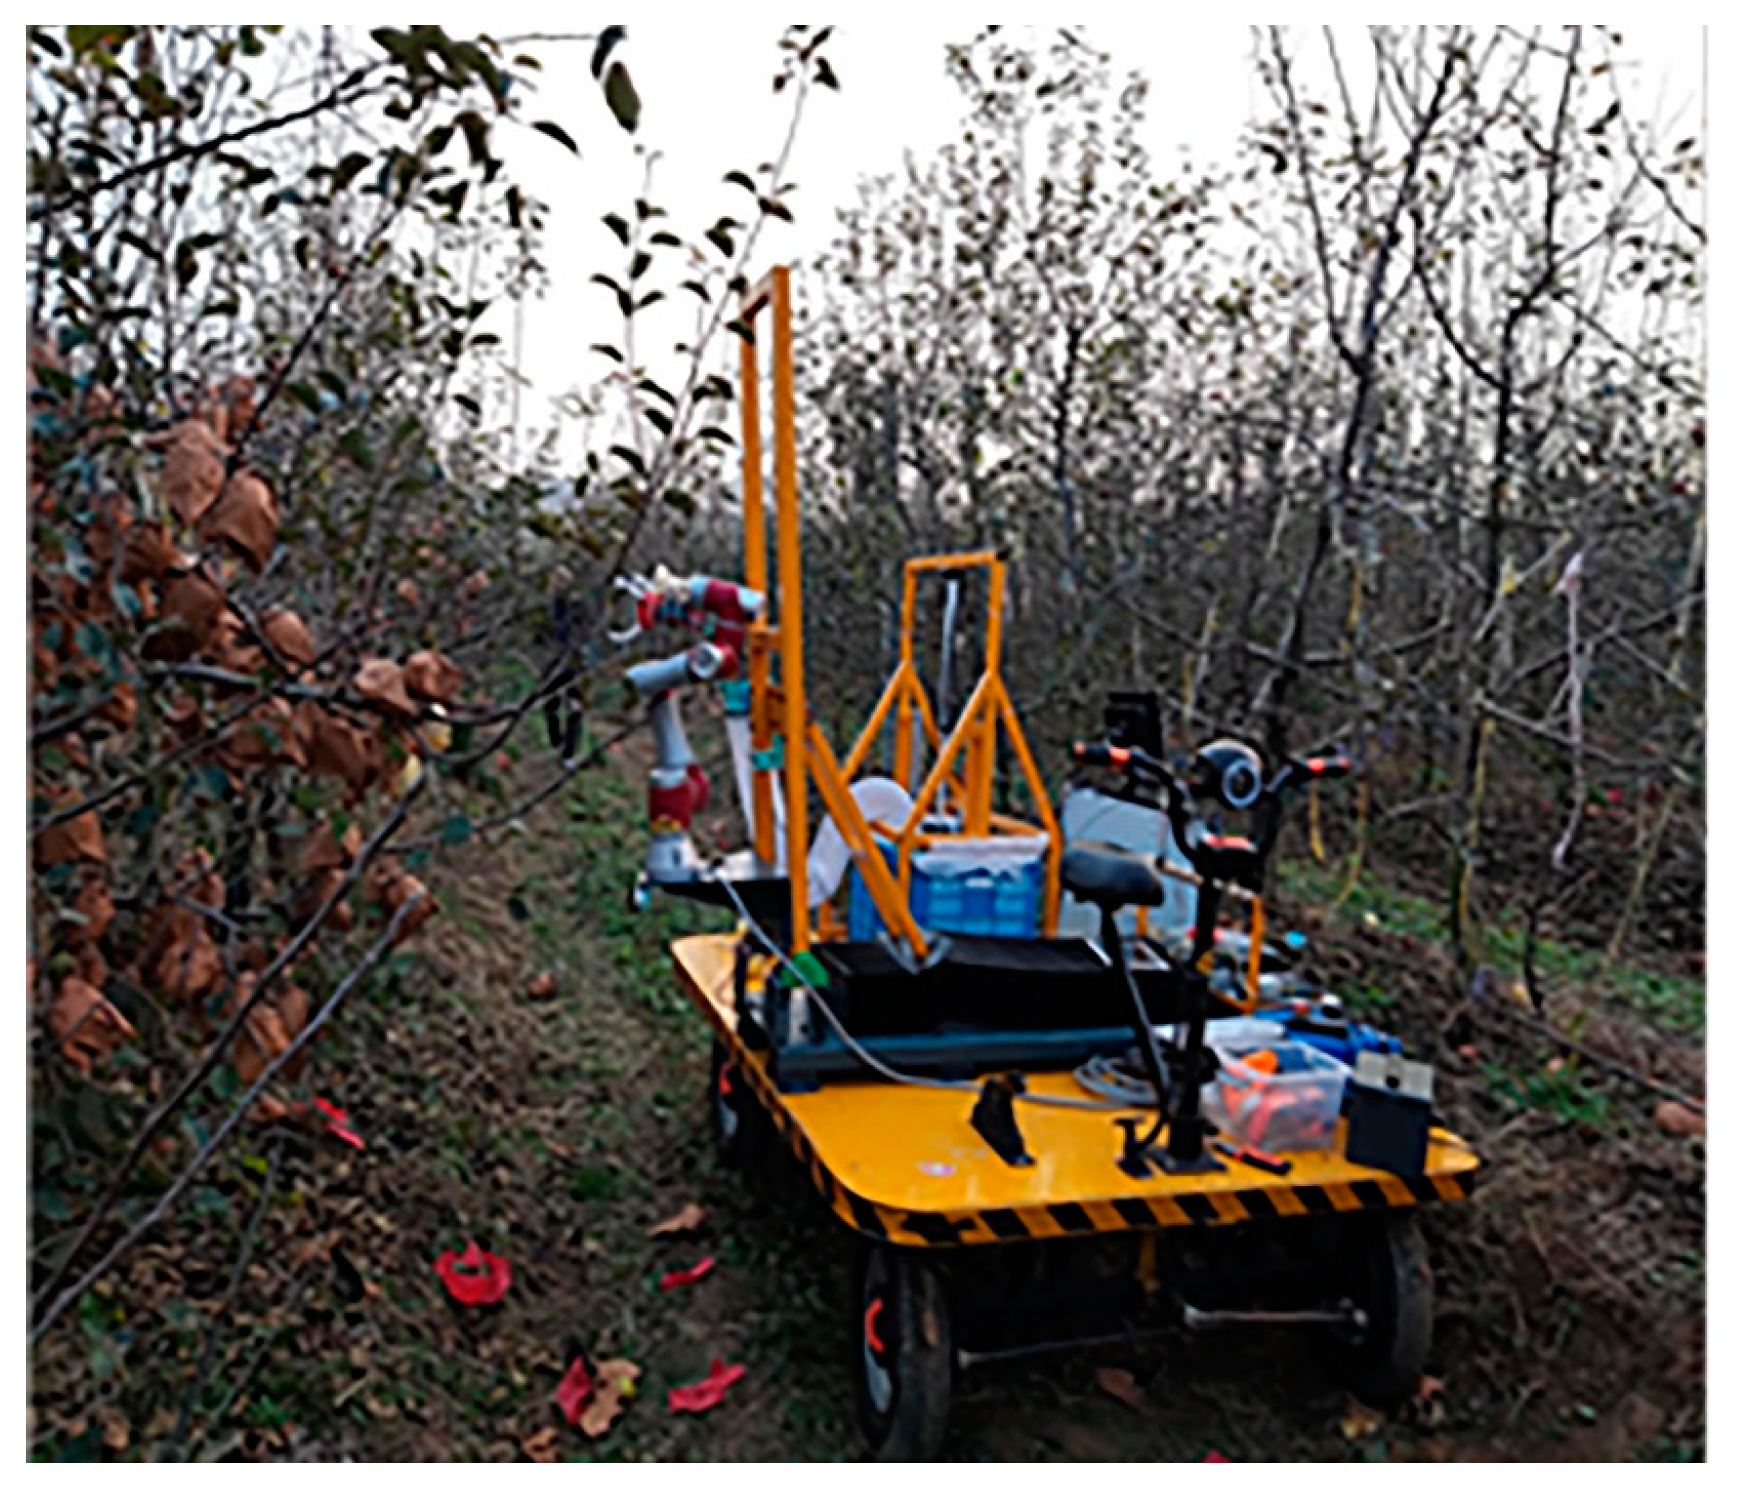
3.3. Apple-Picking Robot Orchard Picking Experiment and Result Analysis

To assess the effectiveness of optimal picking methods derived from the response surface methodology, field picking experiments were carried out in an apple orchard in Wendeng District, Weihai, Shandong Province, China. The apple varieties grown in the orchard were Mingyue and Red Fuji. During the experiment, fruit trees were randomly chosen, and an apple-picking robot was positioned about 1 m directly in front of the trees. To maintain the original natural environment of the orchard, only the bags were removed and some branches that seriously affected apple picking were pruned. The field is depicted in Figure 39.
Two varieties, Red Fuji and Bright Moon, were planted in the orchard to investigate whether the optimal method derived from modelling using Red Fuji apples is valid for other varieties of apples. Ten trees of each species with basically the same branch growth and apple-fruiting conditions were selected and 20 picking experiments were conducted on each tree. For the first five fruit trees, fruit picking, using the vision system on the picking robot to estimate the direction of the apple attitude, and using the optimal picking methods obtained from Table 10 for picking, after the five fruit trees do not take into account the attitude of the fruit and the influence of the surrounding obstacles, to the starting point of the robotic arm to the target point of the fruit of the ‘point-to-point’ direct picking mode. Record the number of successful pickings, picking cycles, picking path lengths, other parameters, and specific data, as shown in Table 11.
The comparison between the two picking methods shows a clear difference in results. When using the optimal picking direction and path planning picking method, the success rate is 83% (87% for Mingyue), the average total picking time for a single apple is 11.2 s (10.9 s for Mingyue), and the stalk retention rate for successful apples is 93.9% (92.0% for Mingyue). On the other hand, when using the point-to-point direct picking method, the success rate is 74% (72% for Mingyue), the average total picking time for a single apple is 8.4 s (7.6 s for Mingyue), and the stalk retention rate for successful apples is only 75.7% (72.2% for Mingyue). The analysis of the field experiment results indicates that, despite the increase in picking time, the use of optimal picking direction and motion planning results in a 9% (15% for Mingyue) increase in the fruit picking success rate and an 18.3% (19.8 for Mingyue) increase in the stalk retention rate. The results show that the ‘optimal method’ is effective in improving the stalk retention rate for both Red Fuji and Mingyue apples, which suggests that this ‘optimal method’ is promising for the application of Red Fuji and Mingyue apple picking in unstructured environments.

4. Conclusions

In this study, the picking effects of two picking manoeuvres, direct-pulling and twisting, were investigated at different angles and speeds to find the picking condition with the highest fruit stalk retention rate. Firstly, the mechanical characteristic parameters of the Red Fuji apple fruit–stalk–branch were tested, and a Cohesive Zone Model was constructed based on the tangential and normal energy release rate, proposed to simulate the stress response behavior of the abscissed layer in fruit picking to construct a finite element model of the fruit–stalk–branch system. The model analyzes the abscission mechanism of apple picking, simulates the response behavior of the fruit–stalk–branch system to direct-pulling and twisting actions at different angles, and obtains the optimal picking conditions, which provides a basis for designing automated apple picking in non-structural environments. It was noted that, for the straight-pull picking action alone, the abscission force of the fruit reaches a maximum of 25.05 N at an angle of 0° between the end of the robotic arm and the fruit axis, which may lead to the breakage of the stalk or pulling out from the pulp. The abscission force decreases as the angle between the end of the mechanical arm and the fruit axis becomes more extensive, and the value of the pulling force reaches a minimum of 8.26 N when the angle is increased to about 60° and then becomes larger again as the angle increases. For the twisting picking action, the abscission force of the fruit gradually increases with the increase in the angle between the end of the arm and the fruit axis. When the angle increases to about 60°, the tension value reaches a maximum of 9.95 N and slowly decreases with the angle increase. The overall change fluctuation of the tension value in the twisting picking action is not as drastic as that in the direct-pulling action, and it is kept at a relatively low level. However, the time consumption of the picking is increased, and the efficiency is low. Afterwards, the parameters of the picking process were optimized based on variance and response surface analyses, resulting in picking postures and movements with 58° as the optimal picking angle, 3 mm/s as the optimal direct-pulling speed, and 2.1 rad/s as the optimal twisting speed. The validity of the simulation results was verified in the laboratory by conducting picking experiments with the combination of direct-pulling and twisting motions. Considering the complexity of the actual picking environment, it can be assumed that, when the angle is between 55–65°, the combination of the direct pulling and twisting picking action is potentially the optimal combination of picking actions, which can complete the apple picking in a shorter time with a smaller abscission force at the same time, which can effectively prevent the phenomenon of damage to the fruit and the fruit stalk breaking and pulling out, and, at the same time, take into account the picking efficiency. Finally, field experiments were conducted in orchards on Red Fuji and Mingyue apples. For Red Fuji, the picking success rate was 83.0%. The stalk retention rate was 93.9% using the optimal picking direction and motion planning, 9% and 18.3% higher than the traditional ‘point-to-point’ direct picking with a robotic arm; for the Mingyue apple, the picking success rate increased by 15%, and the stalk retention rate increased by 19.8%. The results show that the use of the optimal picking attitude and action combination can effectively prevent the phenomena of fruit damage and stem breakage and extraction while taking into account the picking efficiency, which can provide a reference for the path planning of the robotic arm of the picking robot in the unstructured planting environment of apples in China.

Author Contributions

Conceptualization, Q.Z.; methodology, M.B. and Q.Z.; investigation, B.H. and Q.Z.; data curation, Q.Z. and M.B.; formal analysis, B.H. and Q.Z.; writing—original draft, M.B.; writing—review and editing, M.B. and Q.Z.; software, B.H.; project administration, Z.X.; funding acquisition, Z.X.; visualization, Z.X. All authors have read and agreed to the published version of the manuscript.

Funding

This work was funded by the Leading Goose Program of Zhejiang Province, grant number 2022C02052 and Zhejiang Provincial Natural Science Foundation of China, grant number LQ24E060007.

Institutional Review Board Statement

Not applicable.

Data Availability Statement

The original contributions presented in this study are included in the article. Further inquiries can be directed to the corresponding author.

Acknowledgments

The authors would like to thank the Key Laboratory of Transplanting Equipment and Technology of Zhejiang Province for its support.

Conflicts of Interest

The authors declare no conflicts of interest.

References

  1. Yuan, J. Research progress analysis of robotics selective harvesting technologies. Trans. Chin. Soc. Agric. Mach. 2020, 51, 1–17. [Google Scholar] [CrossRef]
  2. Baeten, J.; Donné, K.; Boedrij, S.; Beckers, W.; Claesen, E. Autonomous fruit picking machine: A robotic apple harvester. In Field and Service Robotics: Results of the 6th International Conference; Springer: Berlin/Heidelberg, Germany, 2008. [Google Scholar]
  3. Gu, B.; Ji, C.; Wang, H.; Tian, G.; Zhang, G.; Wang, L. Design and experiment of intelligent mobile fruit picking robot. Trans. Chin. Soc. Agric. Mach. 2012, 43, 153–160. [Google Scholar] [CrossRef]
  4. Aljanobi, A.A.; Al-Hamed, S.A.; Al-Suhaibani, S.A. A setup of mobile robotic unit for fruit harvesting. In Proceedings of the 19th International Workshop on Robotics in Alpe-Adria-Danube Region (RAAD 2010), Budapest, Hungary, 24–26 June 2010. [Google Scholar]
  5. Bac, C.W.; van Henten, E.J.; Hemming, J.; Edan, Y. Harvesting robots for high-value crops: State-of-the-art review and challenges ahead. J. Field Robot. 2014, 31, 888–911. [Google Scholar] [CrossRef]
  6. Zhang, Z.; Igathinathane, C.; Li, J.; Cen, H.; Lu, Y.; Flores, P. Technology progress in mechanical harvest of fresh market apples. Comput. Electron. Agric. 2020, 175, 105606. [Google Scholar] [CrossRef]
  7. Liu, J.; Liu, Z. The Vision-Based Target Recognition, Localization, and Control for Harvesting Robots: A Review. Int. J. Precis. Eng. Manuf. 2024, 25, 409–428. [Google Scholar] [CrossRef]
  8. Yuri, J.A.; Moggia, C.; Sepulveda, A.; Poblete-Echeverría, C.; Valdés-Gómez, H.; Torres, C.A. Effect of cultivar, rootstock, and growing conditions on fruit maturity and postharvest quality as part of a six-year apple trial in Chile. Sci. Hortic. 2019, 253, 70–79. [Google Scholar] [CrossRef]
  9. Sun, C.Y.; Yan, J.; Fugui, Z.; Yuanmin, G.; Yong, X. Research progress of vegetable picking robot and its key technologies. J. Chin. Agric. Mech. 2023, 44, 63. [Google Scholar] [CrossRef]
  10. De Kleine, M.E.; Karkee, M. A semi-automated harvesting prototype for shaking fruit tree limbs. Trans. ASABE 2015, 58, 1461–1470. [Google Scholar] [CrossRef]
  11. Fruit, F.D. World Markets and Trade (Apples, Grapes, & Pears); Foreign Agricultural Service: Washington, DC, USA, 2018; pp. 1–30. [Google Scholar]
  12. Zhang, K.; Lammers, K.; Chu, P.; Li, Z.; Lu, R. An automated apple harvesting robot—From system design to field evaluation. J. Field Robot. 2024, 41, 2384–2400. [Google Scholar] [CrossRef]
  13. Janisiewicz, W.J.; Peterson, D.L. Susceptibility of the stem pull area of mechanically harvested apples to blue mold decay and its control with a biocontrol agent. Plant Dis. 2004, 88, 662–664. [Google Scholar] [CrossRef]
  14. Bulanon, D.M.; Kataoka, T. Fruit detection system and an end effector for robotic harvesting of Fuji apples. Agric. Eng. Int. CIGR J. 2010, 12, 203–210. [Google Scholar]
  15. Silwal, A.; Davidson, J.R.; Karkee, M.; Mo, C.; Zhang, Q.; Lewis, K. Design, integration, and field evaluation of a robotic apple harvester. J. Field Robot. 2017, 34, 1140–1159. [Google Scholar] [CrossRef]
  16. Fadiji, T.; Coetzee, C.; Chen, L.; Chukwu, O.; Opara, U.L. Susceptibility of apples to bruising inside ventilated corrugated paperboard packages during simulated transport damage. Postharvest Biol. Technol. 2016, 118, 111–119. [Google Scholar] [CrossRef]
  17. He, L.; Fu, H.; Sun, D.; Karkee, M.; Zhang, Q. Shake-and-Catch Harvesting for Fresh Market Apples in Trellis-Trained Trees. Trans. ASABE 2017, 60, 353–360. [Google Scholar] [CrossRef]
  18. Hohimer, C.J.; Wang, H.; Bhusal, S.; Miller, J.; Mo, C.; Karkee, M. Design and Field Evaluation of a Robotic Apple Harvesting System with a 3D-Printed Soft-Robotic End-Effector. Trans. ASABE 2019, 62, 405–414. [Google Scholar] [CrossRef]
  19. Wang, Z.; Xun, Y.; Wang, Y.; Yang, Q. Review of smart robots for fruit and vegetable picking in agriculture. Int. J. Agric. Biol. Eng. 2022, 15, 33–54. [Google Scholar] [CrossRef]
  20. Bu, L.; Hu, G.; Chen, C.; Sugirbay, A.; Chen, J. Experimental and simulation analysis of optimum picking patterns for robotic apple harvesting. Sci. Hortic. 2020, 261, 108937. [Google Scholar] [CrossRef]
  21. Beyaz, A. Harvest glove and LabView based mechanical damage determination on apples. Sci. Hortic. 2018, 228, 49–55. [Google Scholar] [CrossRef]
  22. Bu, L.; Chen, C.; Hu, G.; Zhou, J.; Sugirbay, A.; Chen, J. Investigating the dynamic behavior of an apple branch-stem-fruit model using experimental and simulation analysis. Comput. Electron. Agric. 2021, 186, 106224. [Google Scholar] [CrossRef]
  23. Guoli, L.; Changying, J.; Baoxing, G.; Weiyue, X.; Mang, D. Kinematics analysis and experiment of apple harvesting robot manipulator with multiple end-effectors. Nongye Jixie Xuebao/Trans. Chin. Soc. Agric. Mach. 2016, 47, 14–21. [Google Scholar] [CrossRef]
  24. Torregrosa, A.; Albert, F.; Aleixos, N.; Ortiz, C.; Blasco, J. Analysis of the detachment of citrus fruits by vibration using artificial vision. Biosyst. Eng. 2014, 119, 1–12. [Google Scholar] [CrossRef]
  25. Gongal, A.; Amatya, S.; Karkee, M.; Zhang, Q.; Lewis, K. Sensors and systems for fruit detection and localization: A review. Comput. Electron. Agric. 2015, 116, 8–19. [Google Scholar] [CrossRef]
  26. Dugdale, D.S. Yielding of steel sheets containing slits. J. Mech. Phys. Solids 1960, 8, 100–104. [Google Scholar] [CrossRef]
  27. Singh, K.; Pardeshi, I.; Kumar, M.; Srinivas, K.; Srivastva, A. Optimisation of machine parameters of a pedal-operated paddy thresher using RSM. Biosyst. Eng. 2008, 100, 591–600. [Google Scholar] [CrossRef]
  28. Stagnari, F.; Galieni, A.; Pisante, M. Shading and nitrogen management affect quality, safety and yield of greenhouse-grown leaf lettuce. Sci. Hortic. 2015, 192, 70–79. [Google Scholar] [CrossRef]
  29. Zhao, J.; Sugirbay, A.; Zhang, S.; Liu, F.; Bu, L.; Chen, Y.; Wang, Z.; Chen, J. FEM explicit dynamics simulation and NIR hyperspectral reflectance imaging for determination of impact bruises of Lycium barbarum L. Postharvest Biol. Technol. 2019, 155, 102–110. [Google Scholar] [CrossRef]
  30. Zulkifli, N.; Hashim, N.; Harith, H.H.; Shukery, M.F.M. Finite element modelling for fruit stress analysis—A review. Trends Food Sci. Technol. 2020, 97, 29–37. [Google Scholar] [CrossRef]
  31. Shen, C.; Li, X.; Tian, K.; Zhang, B.; Huang, J.; Chen, Q. Experimental analysis on mechanical model of ramie stalk. Trans. Chin. Soc. Agric. Eng. 2015, 31, 26–33. [Google Scholar] [CrossRef]
  32. Yamada, T.; Kobayashi, T.; Tabuchi, T. Anatomical and histochemical studies of separation process on the juncture tissues between peduncle and bourse on apple fruit. Acta Hortic. 2018, 1206, 129–136. [Google Scholar] [CrossRef]
  33. Horbens, M.; Branke, D.; Gärtner, R.; Voigt, A.; Stenger, F.; Neinhuis, C. Multi-scale simulation of plant stem reinforcement by brachysclereids: A case study in apple fruit peduncles. J. Struct. Biol. 2015, 192, 116–126. [Google Scholar] [CrossRef]
  34. Qiu, L.P.; Zhu, E.C.; van de Kuilen, J.W.G. Modeling crack propagation in wood by extended finite element method. Eur. J. Wood Wood Prod. 2013, 72, 273–283. [Google Scholar] [CrossRef]
  35. Camanho, P.P.; Dávila, C.G. Mixed-Mode Decohesion Finite Elements for the Simulation of Delamination in Composite Materials. NASA/TM-2002-211737. 2002. Available online: https://ntrs.nasa.gov/citations/20020053651 (accessed on 9 December 2024).
  36. Camanho, P.P.; Davila, C.G.; de Moura, M.F. Numerical Simulation of Mixed-Mode Progressive Delamination in Composite Materials. J. Compos. Mater. 2003, 37, 1415–1438. [Google Scholar] [CrossRef]
  37. Liu, P.; Islam, M. A nonlinear cohesive model for mixed-mode delamination of composite laminates. Compos. Struct. 2013, 106, 47–56. [Google Scholar] [CrossRef]
  38. Mi, Y.; Crisfield, M.A.; Davies, G.A.O.; Hellweg, H.B. Progressive Delamination Using Interface Elements. J. Compos. Mater. 1998, 32, 1246–1272. [Google Scholar] [CrossRef]
  39. Turon, A.; Camanho, P.P.; Costa, J.; Dávila, C.G. An interface damage model for the simulation of delamination under variable-mode ratio in composite materials. Int. J. Adv. Robot. Syst. 2004. [Google Scholar] [CrossRef]
  40. Turon, A.; Camanho, P.P.; Costa, J.; Dávila, C.G. A damage model for the simulation of delamination in advanced composites under variable-mode loading. Mech. Mater. 2006, 38, 1072–1089. [Google Scholar] [CrossRef]
  41. Ezzine, M.C.; Amiri, A.; Tarfaoui, M. Experimental and numerical investigation of the fracture behavior of adhesive shear tests single lap joints. J. Braz. Soc. Mech. Sci. Eng. 2018, 40, 382. [Google Scholar] [CrossRef]
  42. Applications of the Newton-Raphson Method in Decision Sciences and Education. Adv. Decis. Sci. 2019, 23, 52–80. [CrossRef]
  43. Ji, W.; Li, J.; Yang, J.; Ding, S.; Zhao, D. Analysis and validation for mechanical damage of apple by gripper in harvesting robot based on finite element method. Trans. Chin. Soc. Agric. Mach. 2015, 31, 17–22. [Google Scholar] [CrossRef]
  44. Tien Thanh Nguyen, T.T.; Eessen, D.V.; Baerdemaeker, J.D.; Saeys, W. Optimum detaching movement for apples-harvesting robot. In Proceedings of the International Conference of Agricultural Engineering—CIGR-AgEng 2012: Agriculture and Engineering for a Healthier Life, Valencia, Spain, 8–12 July 2012. [Google Scholar]
  45. Daily, J.W. Design and analysis of experiments. Exp. Therm. Fluid Sci. 1988, 1, 105. [Google Scholar] [CrossRef]
Figure 1. Diagram of the geometric shape parameter of the fruit.
Agriculture 14 02280 g001
Figure 2. Measurement of geometric shape parameters of fruit.
Agriculture 14 02280 g002
Figure 3. Fruit stalk length distribution histogram.
Agriculture 14 02280 g003
Figure 4. Apple fruit outline.
Agriculture 14 02280 g004
Figure 5. Apple fruit model.
Agriculture 14 02280 g005
Figure 6. Mechanical testing of branch and stalk samples: (a) axial tensile test of fruit stalk; (b) radical compression test of branches.
Agriculture 14 02280 g006
Figure 7. Stress–strain curve of stalk tensile-branch compression experiment.
Agriculture 14 02280 g007
Figure 8. Three-dimensional model of branch and stalk.
Agriculture 14 02280 g008
Figure 9. Bilinear cohesive zone stress–displacement relationship model.
Agriculture 14 02280 g009
Figure 10. Apple branch–abscission layer–fruit stalk physical object.
Agriculture 14 02280 g010
Figure 11. Typical apple branch–stalk tensile experiment stress–displacement curve diagram.
Agriculture 14 02280 g011
Figure 12. Abscission layer mechanical parameter experiment samples: (a) abscission layer normal tensile test sample; (b) abscission layer tangential tensile test sample.
Agriculture 14 02280 g012
Figure 13. Abscission layer normal–tangential tensile experiment.
Agriculture 14 02280 g013
Figure 14. Abscission layer normal–tangential tensile experiment curve: (a) the normal tensile test curve of the abscission layer; (b) the tangential tensile test curve of the abscission layer.
Agriculture 14 02280 g014
Figure 15. Branch–stalk–fruit finite element model.
Agriculture 14 02280 g015
Figure 16. Branch–stalk–fruit abscission simulation.
Agriculture 14 02280 g016
Figure 17. Abscission layer normal abscission simulation.
Agriculture 14 02280 g017
Figure 18. Abscission layer tangential abscission simulation.
Agriculture 14 02280 g018
Figure 19. Fruit abscission experimental device: (1) control panel; (2) lead screw and nut machanism; (3) angle adjustment knob; (4) tendon-pulley mechanism; (5) end effector; (6) LCD digital push-pull gauge.
Agriculture 14 02280 g019
Figure 20. Fruit abscission verification experiment.
Agriculture 14 02280 g020
Figure 21. Fruit abscission simulation comparison verification: (a) verification of simulation for normal tension in abscission layer by comparison with experiments; and (b) verification of simulation for tangential tension in abscission layer by comparison with experiments.
Agriculture 14 02280 g021
Figure 22. Manual pulling–twisting picking action.
Agriculture 14 02280 g022
Figure 23. Schematic diagram of picking action.
Agriculture 14 02280 g023
Figure 24. Simulation of local Cartesian coordinate system.
Agriculture 14 02280 g024
Figure 25. (a) Analysis of the tensile force on the abscission layer under pulling action at different angles; and (b) analysis of the torque on the abscission layer under pulling action at different angles.
Agriculture 14 02280 g025
Figure 26. Schematic diagram of simulation of the local cylindrical coordinate system.
Agriculture 14 02280 g026
Figure 27. (a) Analysis of the tensile force on the abscission layer under twisting action at different angles; and (b) analysis of the torque on the abscission layer under twisting action at different angles.
Agriculture 14 02280 g027
Figure 28. Schematic diagram of twist–pull action at different angles.
Agriculture 14 02280 g028
Figure 29. Response surface of abscission force with angle and direct-pulling velocity.
Agriculture 14 02280 g029
Figure 30. Response surface of abscission force with angle and twisting velocity.
Agriculture 14 02280 g030
Figure 31. Response surface of fracture time with angle and twisting velocity.
Agriculture 14 02280 g031
Figure 32. Response surface of fracture time with angle and direct-pulling velocity.
Agriculture 14 02280 g032
Figure 33. Response surface of abscission force with three factors.
Agriculture 14 02280 g033
Figure 34. Response surface of fracture time with three factors.
Agriculture 14 02280 g034
Figure 35. Structure diagram of direct-pulling-twisting device.
Agriculture 14 02280 g035
Figure 36. Direct-pulling and twisting experiment at different angles.
Agriculture 14 02280 g036
Figure 37. Comparison of actual experiments and simulation results of abscission force and fracture time at different angles: (a) abscission force comparison; and (b) fracture time comparison.
Agriculture 14 02280 g037
Figure 38. Analysis of optimal harvesting conditions.
Agriculture 14 02280 g038
Figure 39. Apple-picking robot field experiment site.
Agriculture 14 02280 g039
Table 1. Measurement results of geometric characteristics of Red Fuji apples.
Geometric FeatureMinimum ValueMaximum ValueAverage Value
Axial diameter (mm)59.692.872.3
Radial diameter (mm)69.7107.585.2
Fruit stalk length (mm)10.130.419.3
Fruit weight (g)175.2389.1287.6
Table 2. Results of stalk-tensile and branch-compression experiment.
MaterialElastic Modulus
E/MPa
Yield Stress
σ e /MPa
Failure Stress
σ r / M P a
Bulk Modulus
K / MPa
Shear Modulus
G / MPa
Poisson’s Ratio
μ
Stalk141.373.145.56235.6250.490.4
Branch58.940.656.2198.2321.050.4
Table 3. Cohesive zone unit model parameters for abscission layer.
Maximum Normal Stress
(Mpa)
Normal Fracture Energy Release Rate
(KJ/m2)
Maximum Tangential Stress (Mpa)Tangential Fracture Energy Release Rate
(KJ/m2)
4.2830.5162.9761.083
Table 4. Apple fruit model parameters.
MaterialDensity
Kg/m3
Elastic Modulus
Mpa
Poisson’s Ratio
μ
Apple peel840120.35
Apple flesh84050.35
Apple core95070.35
Table 5. Response surface experiment factors and responses.
Factors/ResponsesUnit
The angle between the center axis of the robotic arm’s end and the fruit axis,
referred   to   simply   as   the   angle   ( X 1 )
°
Direct-pulling velocity ( X 2 )mm/s
Twisting   velocity   ( X 3 )rad/s
The maximum pulling force experienced when the abscission layer fractures,
referred   to   simply   as   the   abscission   force   ( Y 1 )
N
The time from when the abscission layer begins to experience the load until it fractures,
referred   to   simply   as   fracture   time   ( Y 2 )
s
Table 6. Simulation results designed by Design-Expert.
Order X 1 (°) X 2 (mm/s) X 3 (rad/s) Y 1 (N) Y 2 (s)
1010025.050.58
2003.145.0882.51
30103.1424.281.86
41010020.450.58
51003.145.1472.51
610103.1419.781.86
71510017.220.63
81503.145.2312.48
915103.1416.4741.99
10205015.120.68
112001.575.3292.47
122051.5713.8472.01
132510014.480.69
142503.145.4432.38
1525103.1413.0311.66
163010013.590.7
173003.145.5432.03
1830103.1412.8561.45
19455010.580.74
204501.576.6621.21
214551.579.1780.89
22505010.020.74
235001.577.5120.96
245051.578.9540.82
25601008.260.73
266003.149.9540.76
2760103.147.4230.62
2865509.570.75
296501.578.5041.08
306551.578.720.85
31755011.480.78
327501.577.5631.26
337551.5711.3041.04
349010013.190.78
359003.147.0621.73
3690103.1411.9641.11
Table 7. ANOVA for abscission force.
SourceSum of SquaresdfMean SquaresF-Valuep-Value
Model864.67996.0726<0.0001 ***
X 1 61.21161.2116.56<0.0004 ***
X 2 74.41174.4120.14<0.0001 ***
X 3 13.26113.263.590.0693
X 1 X 2 114.271114.2730.92<0.0001 ***
X 1 X 3 0.259210.25920.07010.7932
X 2 X 3 4.1914.191.320.2966
X 1 2 99.40199.4026.90<0.0001 ***
X 2 2 4.8914.891.320.2606
X 3 2 0.118810.11880.03220.38591
Residual96.07263.70
Cor Total960.7535
Fit Statistics
Std. Dev.1.92 R 2 0.9000
Mean11.27 Adj . R 2 0.8654
C.V.%14.68 Pred . R 2 0.6667
PRESS144.08 Adeq Precision19.3187
Note: The ‘***’, ‘**’ and ‘*’ after the p-value indicates that the effect of the model or independent variable on the outcome is significant, with significance increasing as the number of ‘*’ signs increases, and ‘***’ indicates that it is a highly significant factor.
Table 8. ANOVA for fracture time.
SourceSum of SquaresdfMean SquaresF-Valuep-Value
Model12.7691.4214.31<0.0001 ***
X 1 1.8111.8118.24<0.0002 ***
X 2 0.622310.62236.280.0188 **
X 3 1.0911.0911.040.0026 **
X 1 X 2 0.201510.20152.030.1659
X 1 X 3 0.621710.62176.270.0189 *
X 2 X 3 0.001810.00180.01840.8931
X 1 2 0.591110.59115.960.0217 **
X 2 2 0.009410.00940.09430.7612
X 3 2 0.035810.03580.36090.5532
Residual2.58260.0991
Cor Total0.035835
Fit Statistics
Std. Dev.0.3149 R 2 0.8320
Mean1.28 Adj . R 2 0.7738
C.V.%14.68 Pred . R 2 0.5664
PRESS1137.99 Adeq Precision14.4491
Note: The ‘***’, ‘**’ and ‘*’ after the p-value indicates that the effect of the model or independent variable on the outcome is significant, with significance increasing as the number of ‘*’ signs increases, and ‘***’ indicates that it is a highly significant factor.
Table 9. Response optimization conditions.
ItemGoalLower LimitUpper Limit
Angle (°)Within range090
Direct-pulling velocity (mm/s)Within range010
Twisting velocity (rad/s)Within range01.57
Abscission force (N)Minimum value515
Fracture time (s)Minimum value0.71.3
Table 10. Optimal solutions for response.
Angle
(°)
Direct-Pulling Velocity (mm/s)Twisting Velocity (rad/s)Abscission Force
(N)
Fracture Time (s)
58.4023.0002.1158.1000.942
Table 11. Comparative statistics of results of apple-picking methods.
VarietyPicking MethodsNumber of PickingsNumber of Successful PickingsAverage Picking PeriodNumber of Stalks RetainedStalk Retention Rate
Red Fujioptimal picking methods1008311.2 s7894.0%
point-to-point100748.4 s5675.7%
Mingyueoptimal picking methods1008710.9 s8092.0%
point-to-point100727.6 s5272.2%
Disclaimer/Publisher’s Note: The statements, opinions and data contained in all publications are solely those of the individual author(s) and contributor(s) and not of MDPI and/or the editor(s). MDPI and/or the editor(s) disclaim responsibility for any injury to people or property resulting from any ideas, methods, instructions or products referred to in the content.

