Abstract
Harvesting operations in agriculture are labour-intensive tasks. Automated solutions can help alleviate some of the pressure faced by rising costs and labour shortage. Yet, these solutions are often difficult and expensive to develop. To enable the use of harvesting robots, machine vision must be able to detect and localize target objects in a cluttered scene. In this work, we focus on a subset of harvesting operations, namely, tomato harvesting in greenhouses, and investigate the impact that variations in dataset size, data collection process and other environmental conditions may have on the generalization ability of a Mask-RCNN model in detecting two objects critical to the harvesting task: tomatoes and stems. Our results show that when detecting stems from a perpendicular perspective, models trained using data from the same perspective are similar to one that combines both perpendicular and angled data. We also show larger changes in detection performance across different dataset sizes when evaluating images collected from an angled camera perspective, and overall larger differences in performance when illumination is the primary source of variation in the data. These findings can be used to help practitioners prioritize data collection and evaluation efforts, and lead to larger-scale harvesting dataset construction efforts.
1. Introduction
Harvesting is one of the most labour-intensive tasks in commercial vegetable greenhouses. Finding labour to carry out these tasks, however, continues to be a challenging problem. In many developed countries, both an aging population and restrictions on immigration have contributed to problems in labour shortage. Other events such as the COVID-19 pandemic have also led to restrictions on labour movement and shed light on the impact of labour shortage on food security. As such, there is currently significant interest in deploying robotics systems for harvesting tasks.
A robotic system capable of performing harvesting relies on the success of many different components. The vision system is one such critical component, which enables capabilities such as the detection and localization of objects within a scene or classification of images. Vision systems based on deep learning have become highly popularized in recent years [1,2,3,4,5], and while they can often achieve a high level of success in these tasks, they are known to require a tremendous amount of data in order to be trained from scratch. In situations where data may be sparse, including uncommon tasks such as greenhouse crop harvesting, or situations where a robot is initially deployed to new or different environments, it can be difficult to anticipate how the vision system will perform.
In this work, we explore these questions as part of a vision system which will be used for a robotic harvesting operation in a commercial greenhouse environment. We collect data under a diverse set of real-world conditions and experiment with how differences in dataset size, as well as how changes in camera pose, illumination, and task (i.e., front-facing detection vs. an eye-in-hand configuration for path planning) affect a model’s generalization ability for detecting classes of tomato and stem objects.
2. Related Work
2.1. Greenhouse Operations
As tomato plants grow, they begin to bear flowers, fruit, and foliage. Workers typically attach string to the individual plants to encourage vertical growth. To control the growth rate of tomatoes, workers selectively perform de-leafing, which removes a layer of leaves above the tomatoes and allows them to absorb light and continue to ripen (e.g., causing the visibility of tomatoes in Figure 1, Figure 2 and Figure 3). During harvesting, tomatoes are separated from their peduncle (individually or in clusters) and placed into baskets for future processing. During the harvesting and de-leafing processes, care must be taken to (a) not damage the main stem of the plant and (b) only harvest tomatoes which are sufficiently ripe and ready to be harvested. Objects such as tomatoes and stems are critical to the success of the operation in both cases and, as such, form the two object classes studied in this paper.
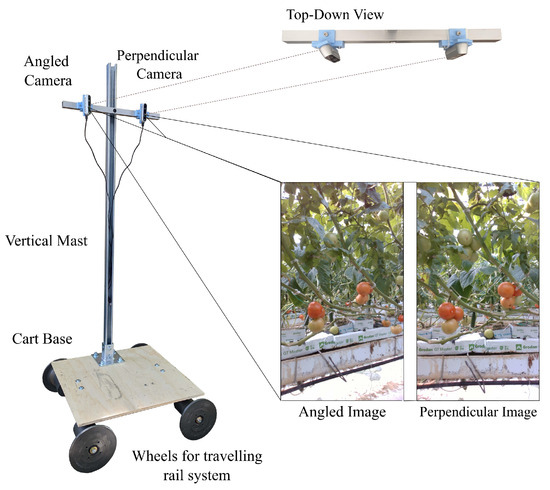
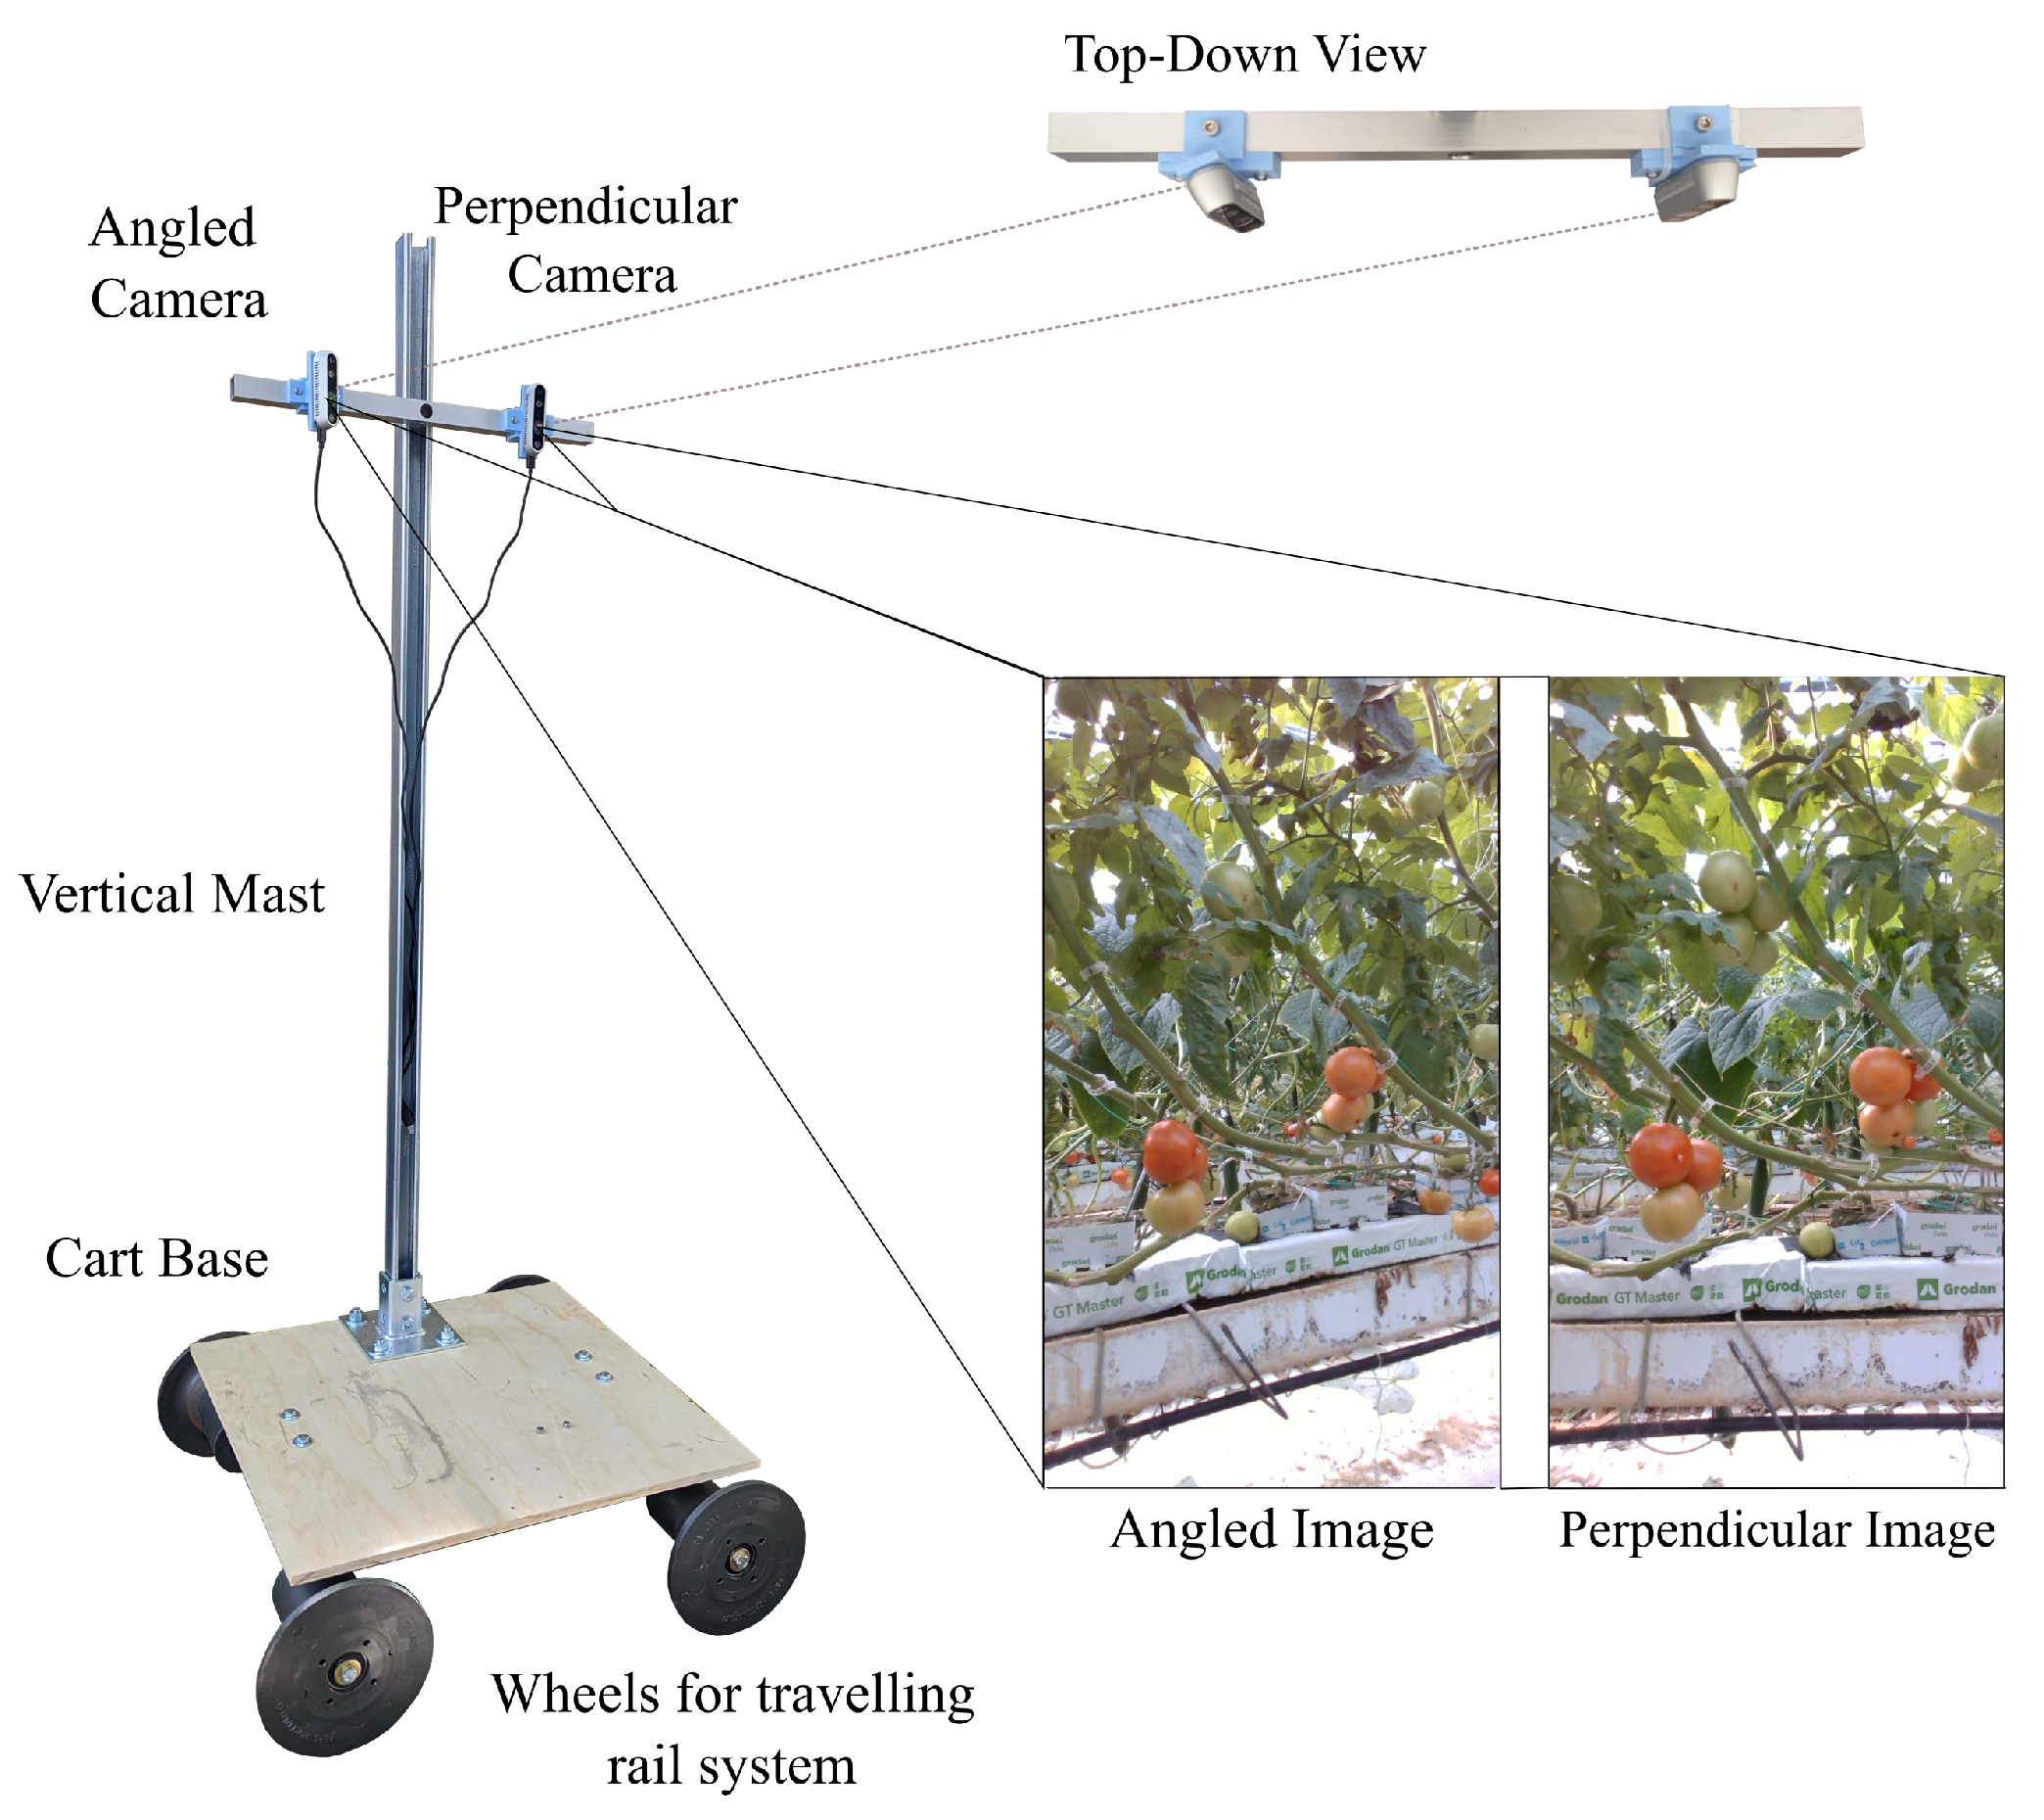
Figure 1.
Cart system. Two cameras collect different views of the same scene.
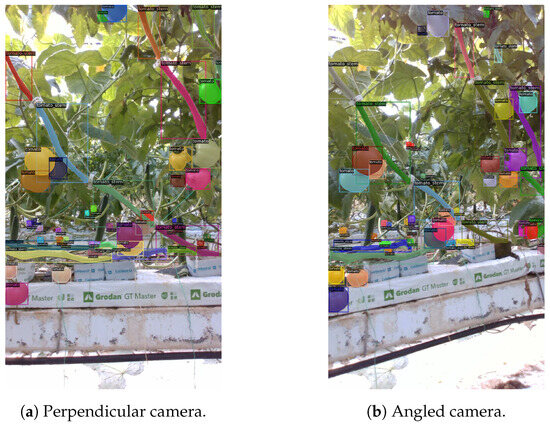
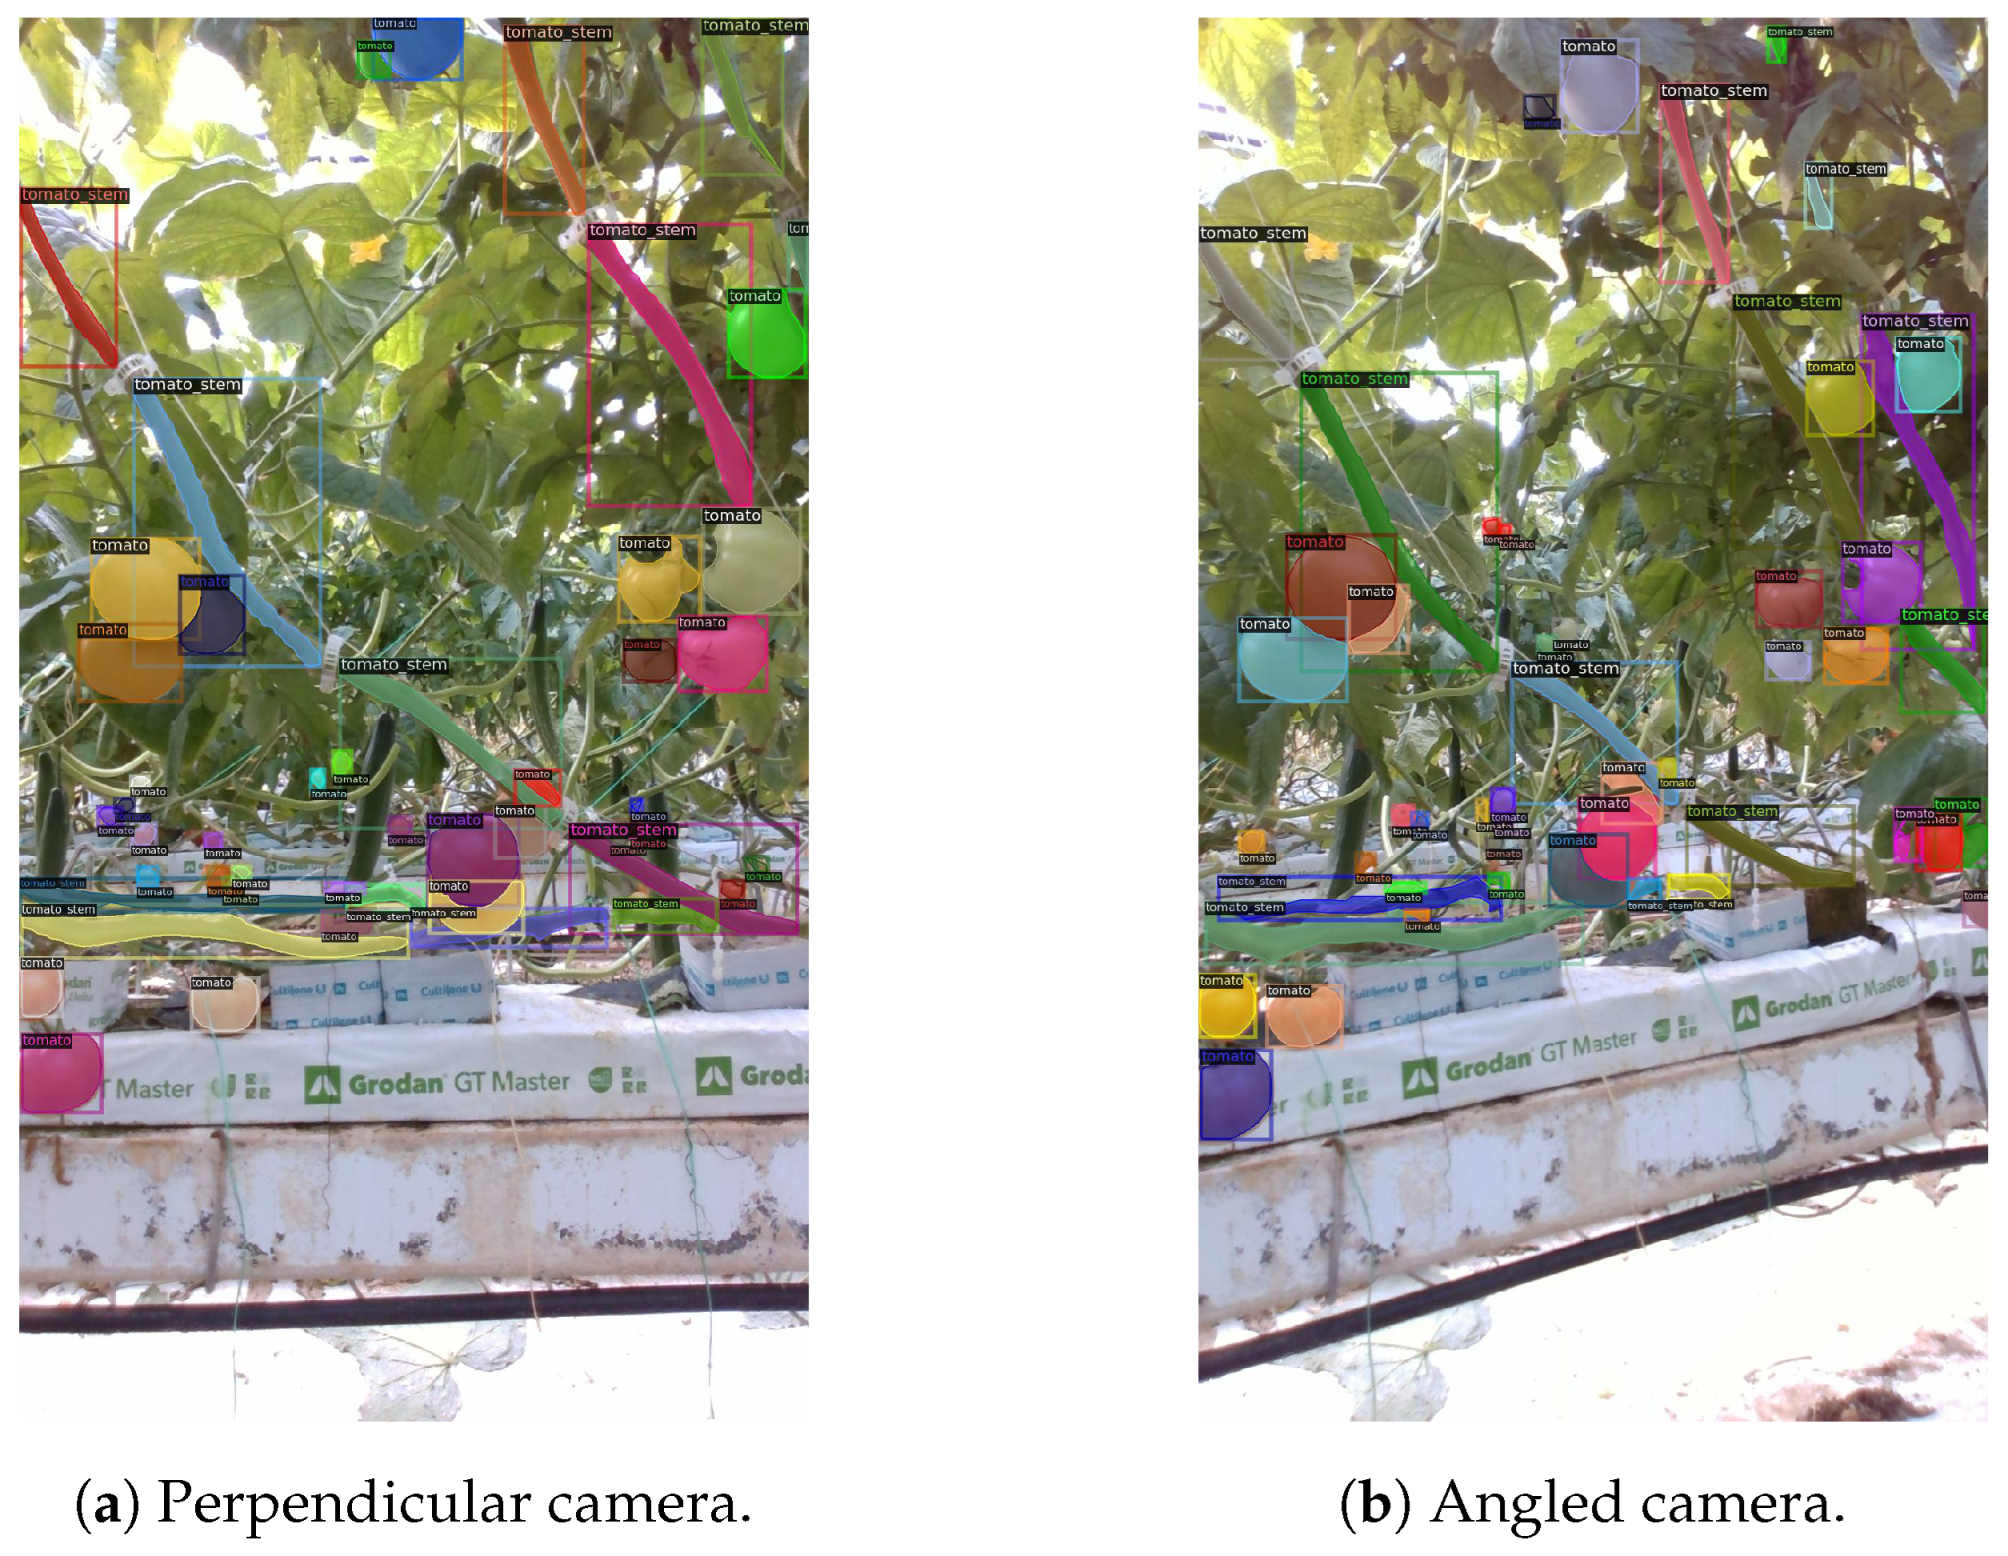
Figure 2.
Instance-level labelling for tomato and stem segment instances from both cameras. Colours are used to differentiate different labeled instances only.
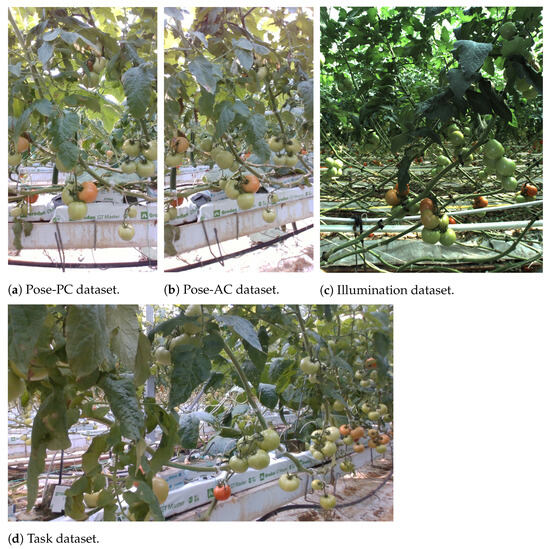
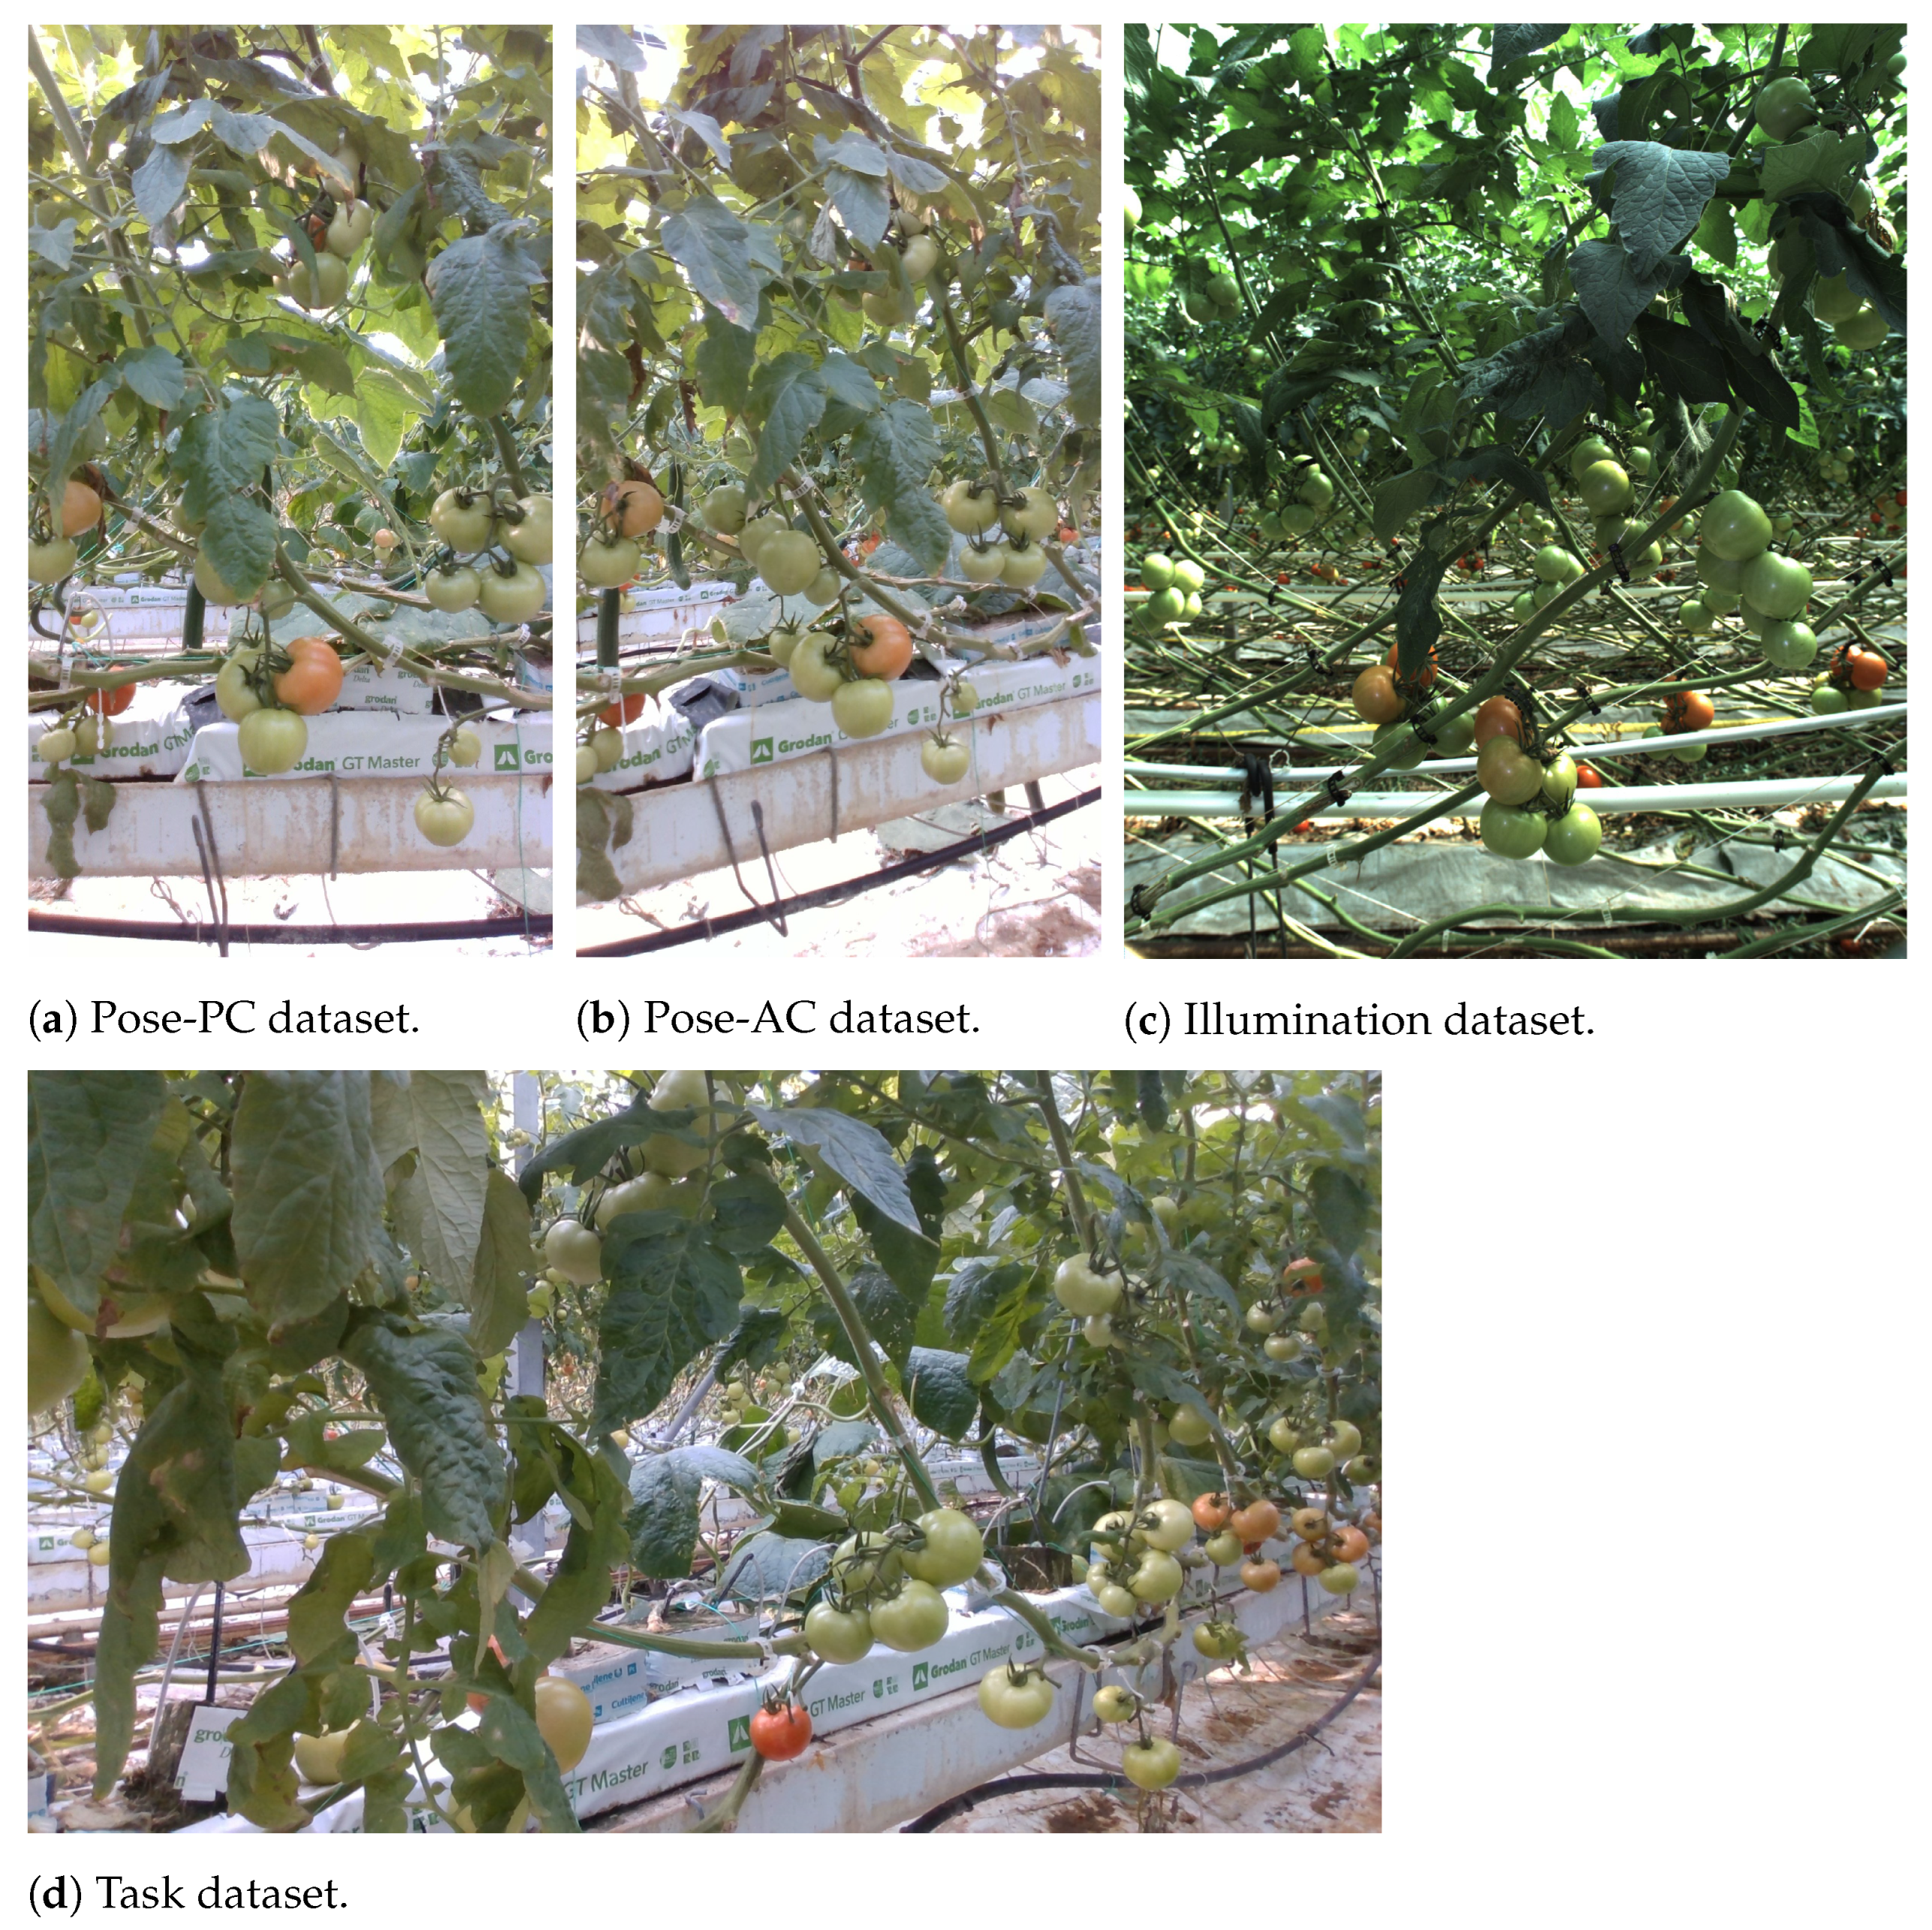
Figure 3.
Variations of the same tomato harvesting operation under different conditions. Pose: perpendicular camera (PC, (a)) and angled camera (AC, (b)). Illumination: (c) data collected in a previous year when the weather impacted the imaging conditions. Task: (d) data collected by a camera mounted on a robotic arm, in the process of calculating an approach plan for harvesting a tomato.
2.2. Object Detection for Greenhouse Processes
An important first step in any harvesting pipeline is to detect and localize the target vegetables or fruit. Traditional approaches based on computer vision and domain knowledge may opt to target the detection of specific features of the objects, including the shape and colour [6,7,8,9]. These approaches, however, can be brittle when applied to different environments. In recent years, data-driven approaches based on learning features from the data, including those based on object detection architectures, such as Mask-RCNN [10] or the YOLO family of object detectors [11], have become prominent. These applications are diverse and have included objects such as tomatoes [12,13,14,15,16,17,18,19], peppers [20], and peduncles [16,21], as well as branches and stems [22,23,24].
One of the challenges in designing vision systems and, in particular, object detection models for greenhouse applications is the variety and complexity of the tasks the robot needs to solve. Different tasks may require the use of different labelling methodologies (e.g., bounding boxes versus polygons), may deal with different object classes (e.g., stems, tomatoes, peppers, and leaves), may be used for different applications (such as counting [25] or tracking the main stem [22]), or may have different performance constraints, such as accuracy versus inference speed. While there are many different datasets which may be suitable for training models on general fruit and vegetable detection tasks, including CropDeep [26] (containing 30 categories of fruit and vegetables at different growing stages) and Laboro Tomato [27] which can be used for tomato segmentation and ripening classification, there is no one-size-fits-all dataset available for greenhouse harvesting.
2.3. Learning as a Domain Generalization Perspective
Feature representation models leverage data to directly learn which types of features are necessary for solving a particular problem. As such, the composition of a dataset has a direct impact on what a model will learn and how it will perform. A robot trained using data from a greenhouse illuminated by sunlight will learn different representations than one trained in indoor lighting alone. The problem we are interested in studying in this work is one of domain generalization [28] applied to greenhouse environments. By controlling for many of these factors individually (including the choice of model), we can, in part, control the gap between datasets and study how a robot’s performance may generalize to novel situations. While some works have proposed ways to efficiently leverage data for bridging the dataset gap or detecting new classes, such as that by Riou et al. [29], our current investigation is solely focused on understanding how input data affect the models generalization ability.
With respect to vision systems, it is not uncommon for these systems to be designed to specifically handle different parts of the harvesting process. For example, Rong et al. [16] first performs an initial tomato cluster detection and then subsequent eye-in-hand tomato and peduncle segmentation. Many vision systems may also propose strategies for trying to control different factors of variation. For example, the Flash-No-Flash technique was developed by Arad et al. [20] for controlling lighting, and in [12], Afonso et al. selectively collect data at night without illumination. As there will always be differences in environmental conditions within greenhouses, understanding how these differences may affect a vision system’s performance is a vital step in automating harvesting applications and is one of the primary reasons for our current investigation.
2.4. Contributions
In this paper, we investigate the robustness of a vision model based on deep learning, given different variations observed in the greenhouse environment and how data may be collected. We investigate three factors:
- When a robot approaches a plant for a harvesting operation, it is expected that multiple images will be taken from different angles to mitigate any occlusion or clutter in the scene. We investigate the impact of camera angle on the detection accuracy of a Mask-RCNN model in detecting two target objects: tomatoes and stems.
- Labelling large amounts of data used in deep learning applications is often a significant challenge. We investigate the impact of dataset size on a model’s generalization by training a model on similar conditions but through different camera views.
- Imaging within and across different greenhouses is not expected to be consistent. For example, different cameras might be used with different resolutions under different lighting conditions. We investigate the impact on generalization of training a model using different datasets and evaluate the performance across different sensors and different environmental conditions.
3. Methodology
Our study is primarily an investigation on how different sources of variation within the input data affect a model’s ability to generalize to different greenhouse environments. We require input data which have been labelled in a consistent way (i.e., polygons) and include tomato and stem classes, and we require samples from within a dataset to have been collected under similar conditions. Throughout all learning experiments, we standardize on a single object detection architecture (Mask-RCNN [10]). We introduce our data and experiments below.
3.1. Data Collection and Processing
All of the datasets in this work were collected from real-world commercial vegetable greenhouses. These datasets include different variations in sensor type, environmental conditions, and the camera angle that images were taken at.
3.1.1. Camera Angle Dataset Collection
To isolate the effects of camera angle on model learning and generalization, a custom cart system was developed to collect images systematically. The cart was able to travel smoothly along rails installed within commercial greenhouse rows and could collect images at a consistent height and camera pose. The cart consists of the following components: (a) a vertical and horizontal mast, (b) two fixed-pose cameras (Intel RealSense d435, Intel, Santa Clara, Calif.) and (c) a base and set of four wheels. An image of the system can be seen in Figure 1.
The two cameras were installed on the horizontal mast at a distance of 30 cm apart from each other. One camera was chosen to be a perpendicular camera (PC) and face the tomato plants directly, while the second was chosen as an angled camera (AC) and was angled 25 towards the other. During data collection, an encoder was used to trigger image capture every 10 cm travelled by cart. During image capture, images from both cameras were collected simultaneously and are referred to as an “image pair" in this work. Cameras were set to a fixed resolution of pixels throughout data collection.
3.1.2. Perpendicular and Angled Camera Dataset Processing
A total of 100 sequential image pairs were selected for labelling from the collected data. We refer to these as “Pose-PC” and “Pose-AC”, and they reflect which source camera was used to capture the image (perpendicular or angled, respectively). In this work, we target the detection of tomatoes in the foreground and background and stems occurring in the foreground only. As the stems represent long, continuous objects which would often span across the entire image, we chose to further standardize this class and break the problem into detecting “parts” of a stem rather than the full stem itself. To obtain these different parts, we used natural breakpoints in the stem, which included locations where bands were attached to wires (controlling the plant’s height), or by tomato clusters. A sample pair of labelled images can be seen in Figure 2. Labelling was performed using polygon-level annotations via Label Studio [30], and a previously trained Mask RCNN model was used to help facilitate labelling by proposing the initial object masks. These masks were then refined by our team, and any missing masks were added as necessary.
3.1.3. Additional Datasets
In addition to the perpendicular and angled-camera datasets, two additional datasets collected prior to this date and under different conditions will also be used in this work. The first dataset, “Illumination”, was collected during a field visit to a commercial greenhouse in 2017 (Figure 3c). This dataset contains a total of 175 images, each with a size of 2048 × 2448 pixels. One of the key differences between this and the Pose-PC/AC datasets is in the higher contrast and poor illumination, due to originally being collected during an overcast day. The fourth dataset, referred to as “Task” (Figure 3d), was collected with a camera attached to a robot’s arm, angled 54 towards the row. Images were collected with an Intel RealSense d435 camera (Intel, Santa Clara, CA, USA) This dataset was collected to help facilitate path planning for the robot arm to move towards a detected fruit during the harvesting operation. In contrast to the other datasets, it is a wide-perspective dataset from a different vantage point, where many more tomatoes and stems are visible. It contains a total of 184 labelled images.
3.2. Experiments Performed
To control for variations in the learning dynamics and model behaviour, a single type of deep learning model architecture was used in this work. Mask-RCNN [10] was selected due to its ability to handle polygon-level annotations for instance segmentation, and ease of availability and extension via the Detectron2 [31] library. Each model was built on top of models pre-trained on the COCO dataset, and were fine-tuned to each of our tasks. For each experiment, we began with the same pre-trained model and fine-tuned it for 5000 iterations. We used a learning rate of 0.005, a batch size of two images, and the SGD optimizer. The same hyper-parameters were used across all training settings.
3.2.1. Evaluation Metrics
In object detection and instance segmentation tasks, choices in parameters such as the intersection over union (IoU; a threshold monitoring the overlap between ground-truth labels and predictions) as well as the confidence threshold are used in measuring the model’s performance. These metrics include the mean average precision (the mean of the area under the precision–recall curve for each object class), as well as the recall. In this work, we used a fixed IoU threshold of 0.50 and calculated the metrics independently for each object class to help understand how the performance of the models changes under different conditions. Thus, we report the Average Precision (AP50) and recall at this threshold level.
3.2.2. Experiment 1: Generalization across Camera Angles
To understand how the camera angle impacts the detection of tomato and stem object classes, a 5-fold cross-validation strategy was employed to partition data from the Pose-PC and Pose-AC datasets into training and testing sets. As these data were originally collected in pairs (a parallel image and angled image), we create the 5 folds for both perpendicular and angled datasets at the same time, and assign each pair of images to be a part of the train set or test set, respectively. To evaluate the performance of the models across both datasets (e.g., a camera perspective of the greenhouse that the model has seen and a perspective it has not), we used the test corresponding to the specific fold. For example, when a model was trained on fold i for the perpendicular dataset, it was then evaluated against fold i belonging to both the perpendicular and the angled datasets. We also created a combined “Pose-Both” dataset, which combines the training data from both source datasets.
3.2.3. Experiment 2: Generalization across Dataset Sizes
Collecting millions of labelled data of greenhouse scenes for training a robot vision system is prohibitive. In this experiment, we evaluated how the dataset size used for training a Mask-RCNN model had an effect on its ability to generalize across different camera views. In order to control for effects stemming from the dataset size only, we first randomly selected 30% of both the Pose-PC and Pose-AC datasets to be used as a test dataset, and then randomly selected 25%, 50%, 75%, and 100% of the remaining images to be used as a training set. Keeping the test set fixed across all evaluations, we repeated this sampling procedure for the training set a total of 5 times for each dataset and training data fraction, trained the models, and recorded the average results.
3.2.4. Experiment 3: Generalization across Different Datasets
While experiments 1 and 2 focused on the evaluation of data collected from the same process and from the same camera model, for a robot operating in a new environment, there is also a need to understand how performance will change under new conditions. Using the models trained on the combined datasets (Pose-Both) from Section 3.2.3, we evaluated the performance on the two additional “Task” and “Illumination” datasets. The pose model was chosen, as it represents the most typical set of characteristics expected in a greenhouse environment (e.g., consistent lighting and roughly eye-level with crops). We recorded their results along with the performance from the two previous pose datasets.
4. Results
4.1. Experiment 1: Generalization across Camera Angles
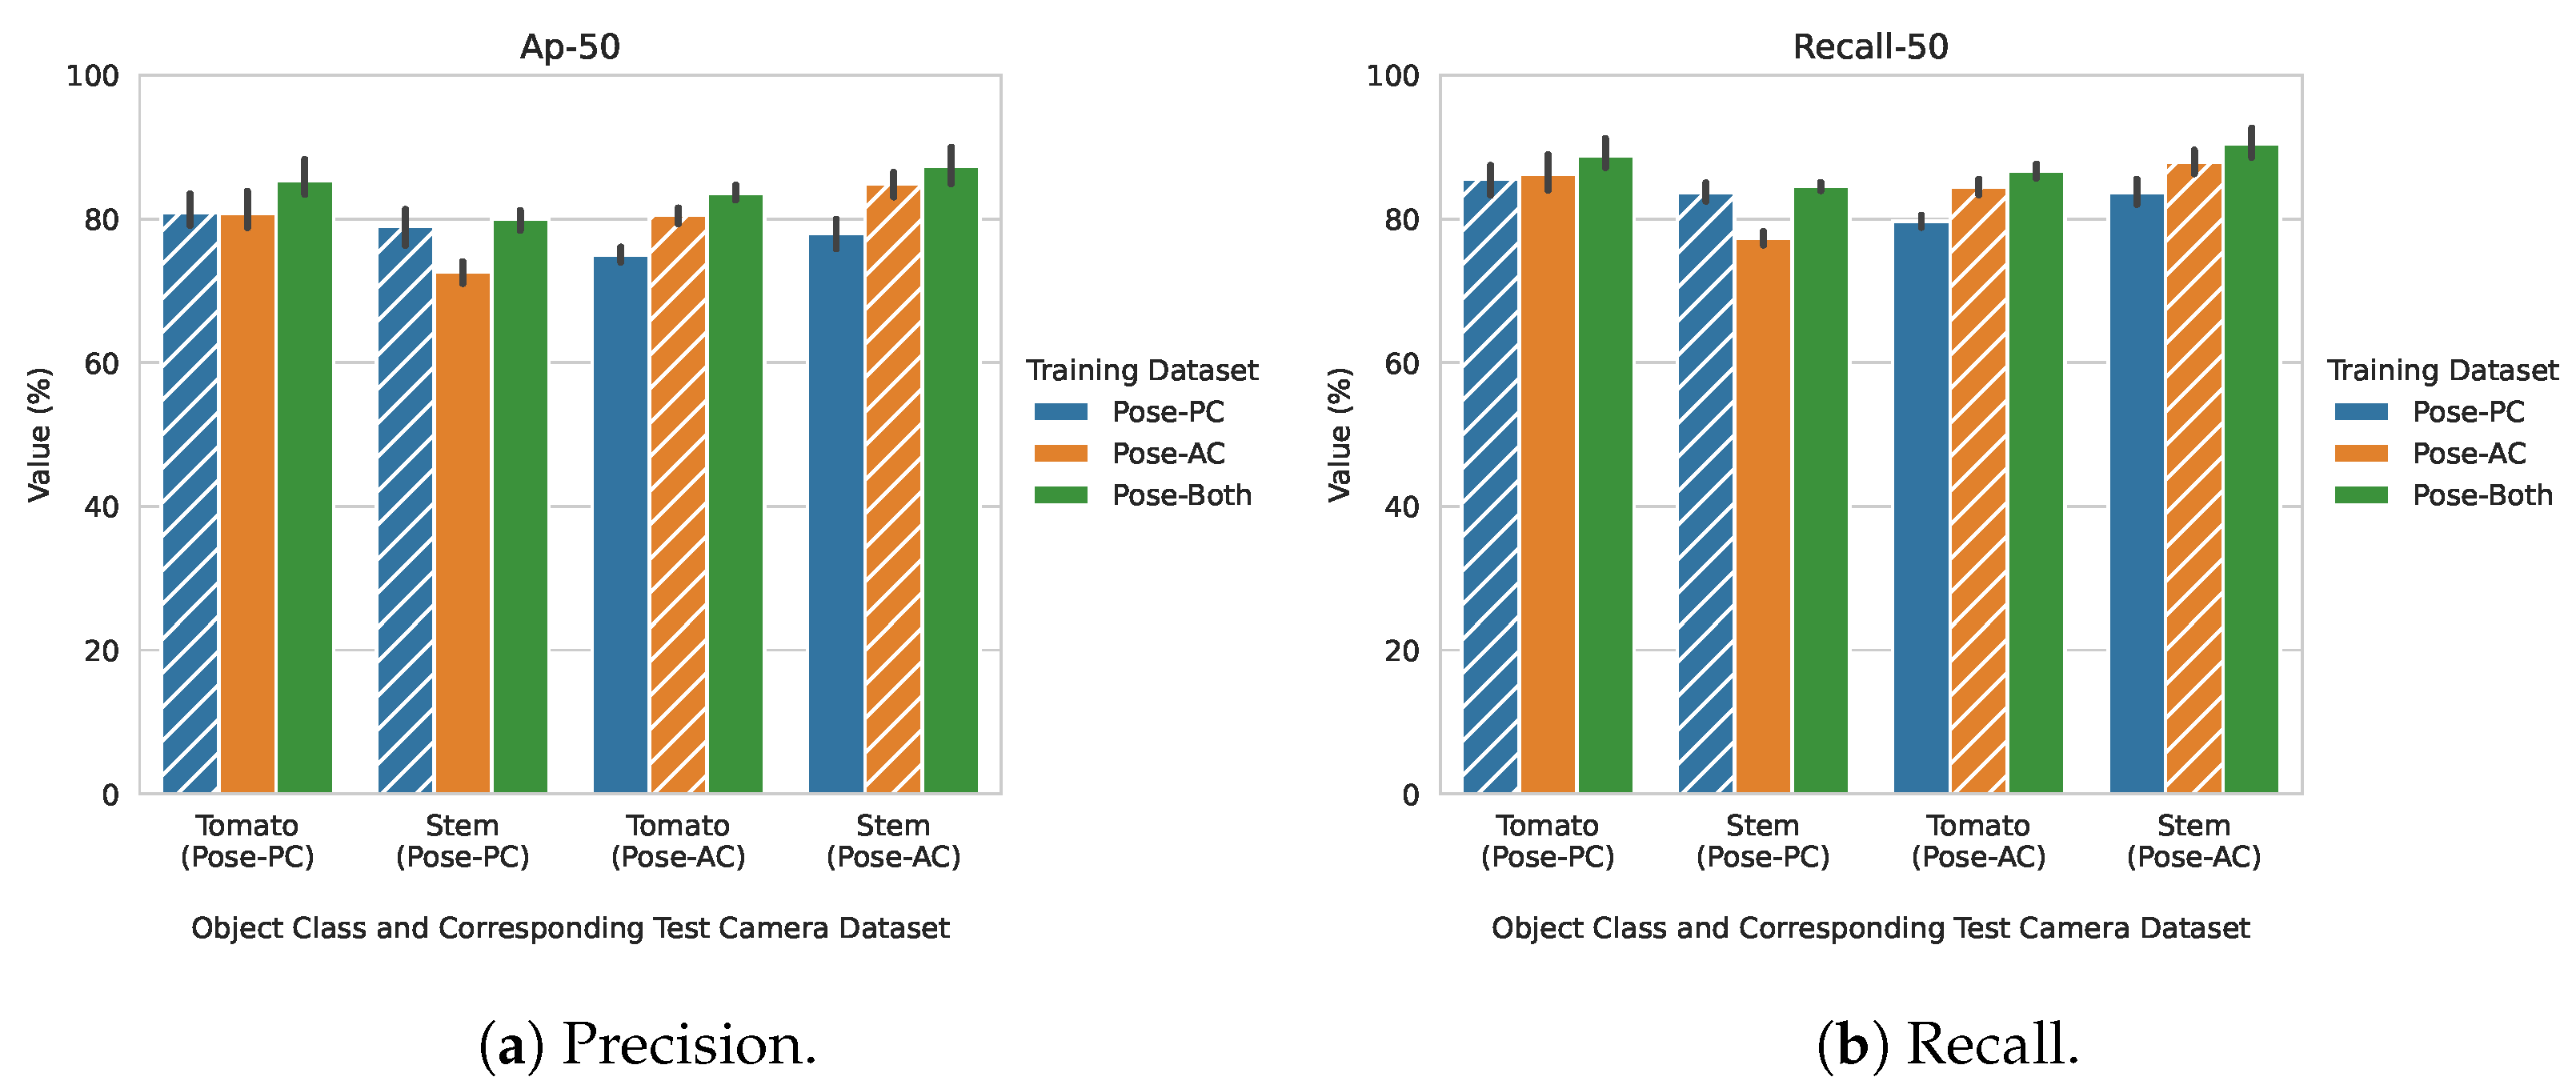
Figure 4 shows the results from training and testing the model on the camera angle datasets. In both figures, the results are organized by which dataset was used to train the model (bar colours), and which target object class and dataset it was evaluated against. The dashed bars represent the cases where both the training and testing sets came from the same dataset. For example, in the left set of bars in Figure 4a, the testing set was selected from the Pose-PC dataset. When the training set was also picked from the Pose-PC set, the bar was dashed.
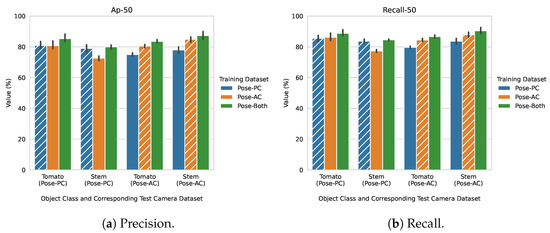
Figure 4.
AP50 score and recall using 5-fold cross validation. Dashed lines on the bars represent the same source training and testing scenario.
In all cases, training a model on the combined Pose-PC and Pose-AC datasets improved the models AP (Figure 4a). For stem detection, however, there is a large discrepancy between the performance of the Pose-PC and Pose-AC trained models. When the models were evaluated on the stem class belonging to the Pose-PC camera, there was a minimal change in performance when considering a model trained on Pose-PC data only and the model trained using both available datasets. When considering stem detection on the Pose-AC camera (far right group of bars), the best performance of the models was achieved when data from both datasets were available. This discrepancy could indicate that representations of the stem class are not as important when training on angled data and transferring it to perpendicular data, as it is when training on perpendicular data and transferring it to the angled case. The recall graphs (Figure 4b) closely resemble those of the AP graphs, and the greatest performance is obtained when considering data from both datasets. For reference, differences in stem features can be seen in Figure 3.
4.2. Experiment 2: Generalization across Dataset Sizes
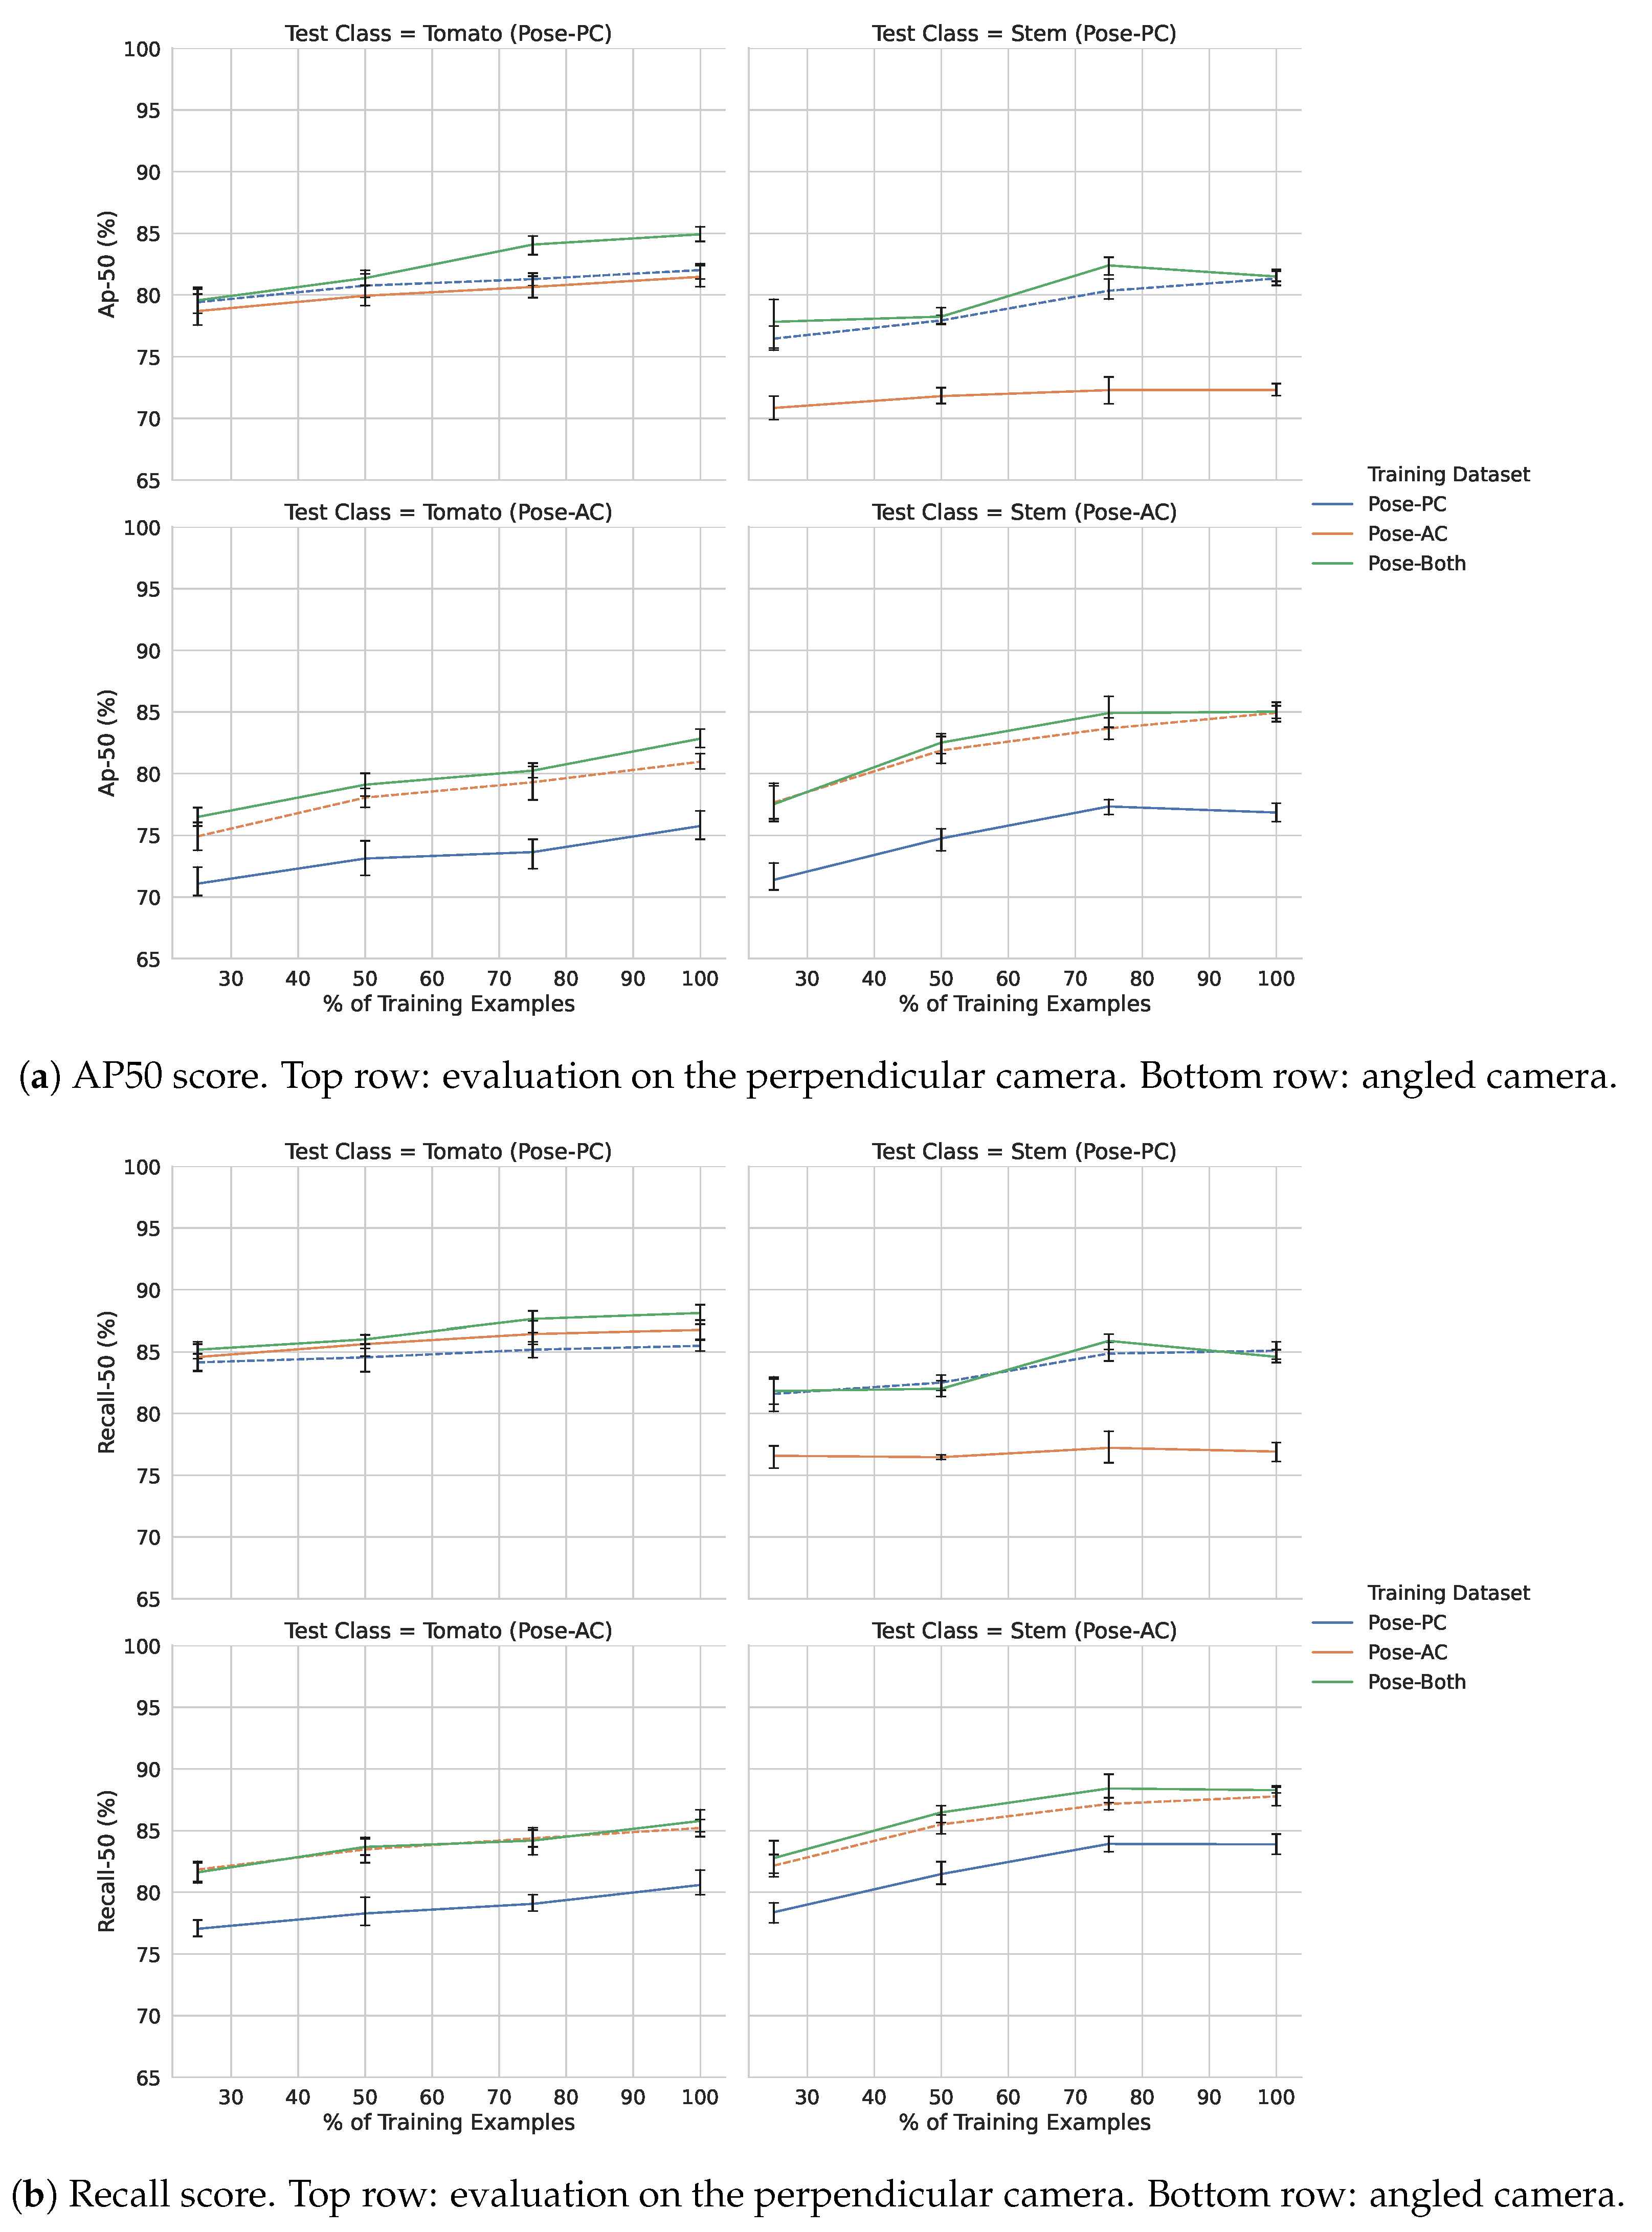
Figure 5 shows the effects of using various sizes of training data on the model ability to detect stem and tomato objects. Models which were trained and tested on data from the same source camera are highlighted using dashes. In Figure 5a, adding more data and testing on the perpendicular camera (Pose-PC) dataset has a relatively muted gain in performance. This trend is also reflected in the corresponding recall graphs in Figure 5b. The more noticeable improvements can be seen when testing on the angled camera (Pose-AC) datasets (bottom two sets of graphs).
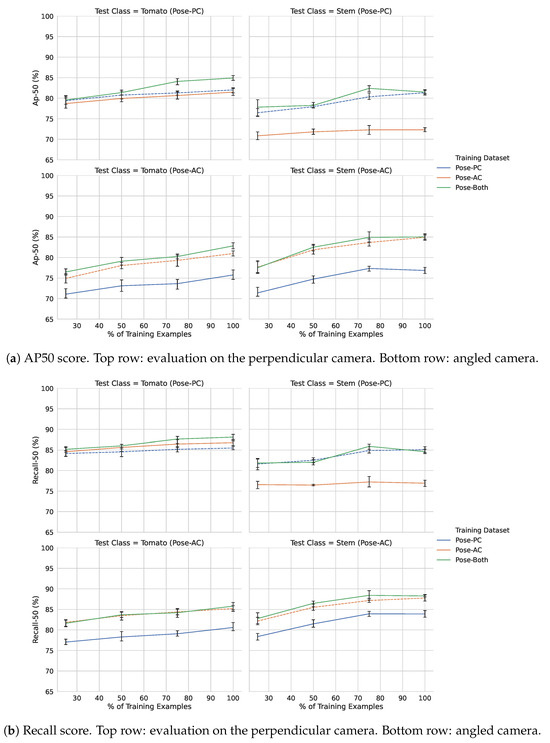
Figure 5.
Precision and recall of models trained across different dataset sizes and views. Data trained and evaluated using the same source camera view are highlighted using dashed lines.
With respect to the two Pose-AC graphs, there is also a noticeable gap in performance across all dataset sizes when comparing the performance of the Pose-PC model to the Pose-AC and Pose-Both counterparts. The effects on model recall (Figure 5b) generally show similar ranking performance to those shown in Figure 5b, with a slight exception when evaluating on the tomato class from the Pose-PC dataset. We discuss the performance within the context of using pre-trained object detection models for objects in greenhouses further in the discussion.
4.3. Experiment 3: Generalization across Different Datasets
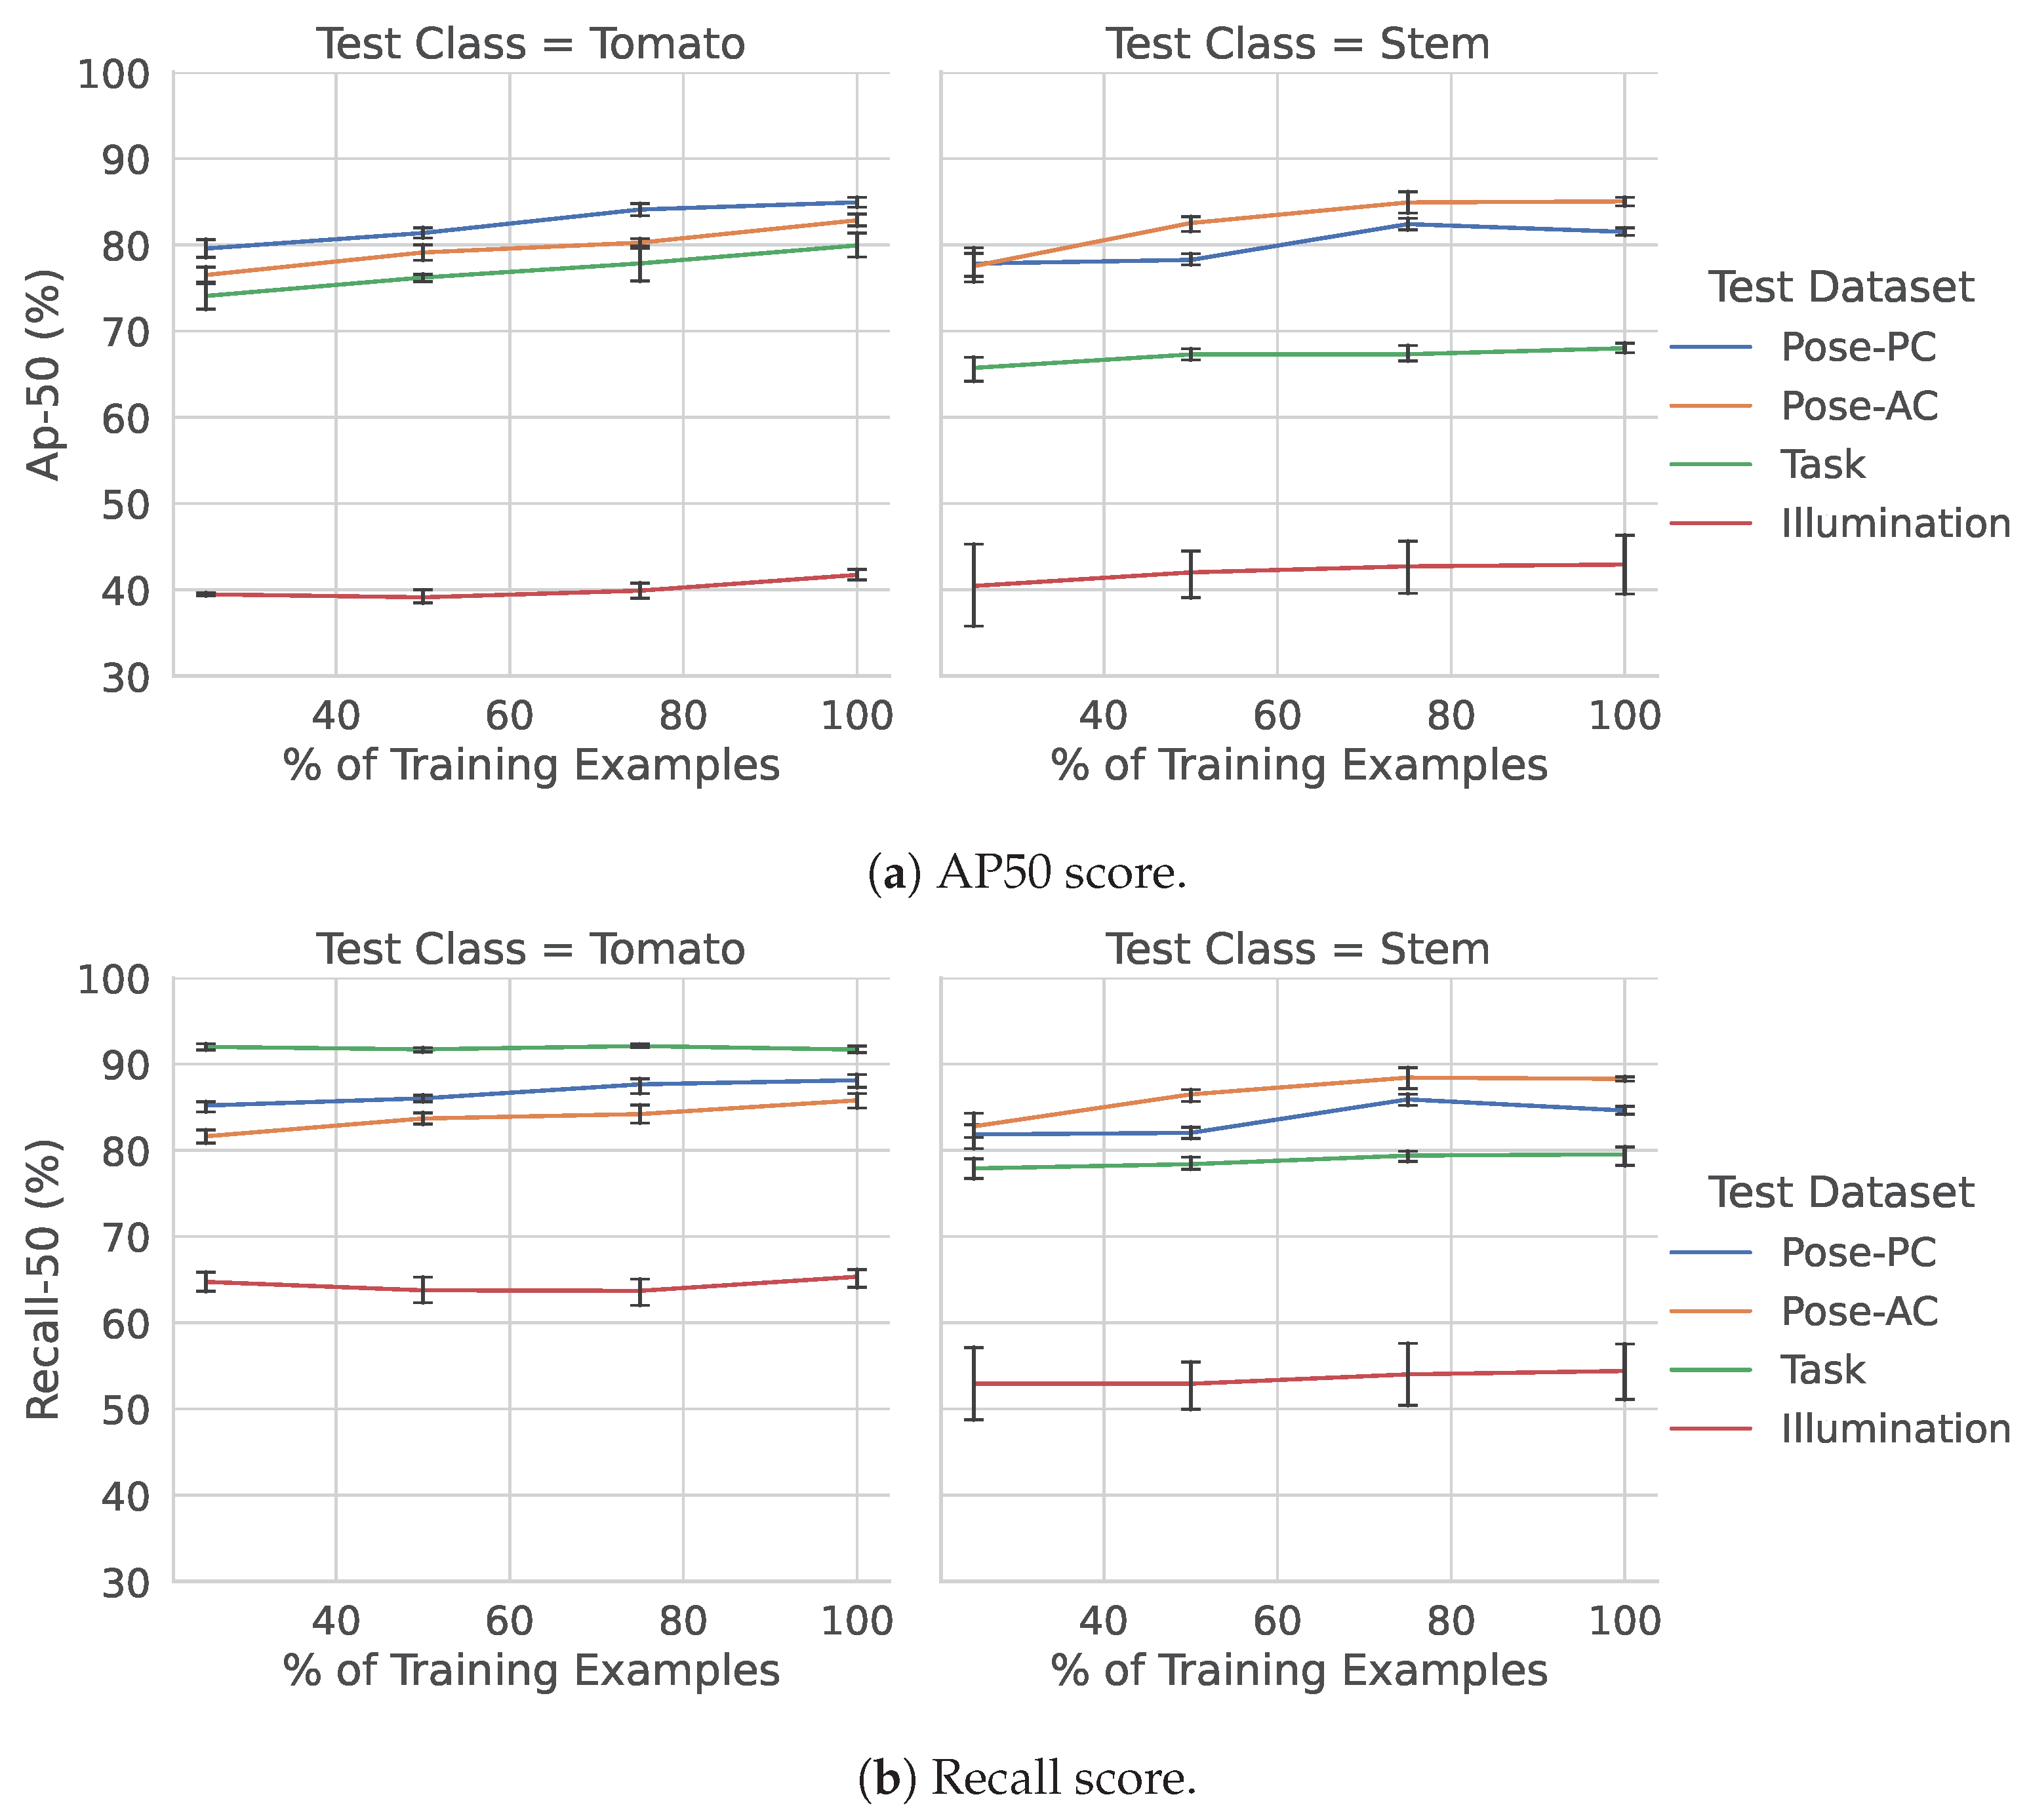
Detection results using different training set sizes, across each of the four different greenhouse environments, can be seen in Figure 6. As seen in the figure, the Illumination dataset (which has highly different illumination and contrast characteristics from the Pose datasets) was consistently one of the most difficult cases for the trained models.
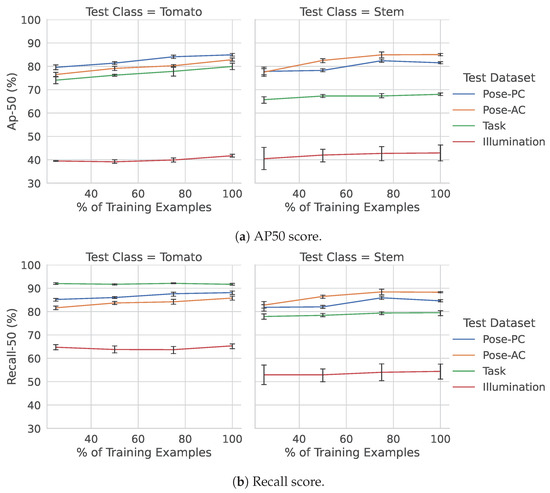
Figure 6.
Precision and recall for the Pose-Both model, evaluated across the various datasets explored in this work.
In terms of precision (Figure 6a), all datasets improved only fractionally when more data were added to the Pose-Both model, with the illumination dataset having the flattest improvement. The stem class on this dataset, however, also showed the largest uncertainty in terms of error bars. The performance when generalizing to the Task dataset was considerably better than the illumination dataset. This dataset has many similar characteristics to the Pose-PC and Pose-AC datasets but offers a wider perspective of the scene (i.e., can see further down the greenhouse row), with often many more tomatoes and stems being visible. The relative overall drops in performance of these two datasets—datasets we are trying to generalize to without additional training data—highlight which conditions may be easier than others and which sensors should be used when considering generalization.
5. Discussion
When evaluating the effects of camera angle on the models detection performance, training and testing on data from the same camera view generally exhibited stronger performance than when compared to the model which had not seen the specific view. This result follows the expectations that when the training and testing conditions are more similar, the model is expected to perform better. If only one camera view is available for training, however, for stems, the results from these figures suggest that training on data from the perpendicular camera may be more beneficial than training on those from the angled one. These results also give insight into a slightly different situation as well: if the performance differences between the different views are not significantly large, how should you choose which one works best? As a hypothetical answer, we could possibly pick one that maximizes insight into other parts of the process—for example, one that offers better views of the tomato peduncle for cutting, or one that optimizes harvesting and path-planning efforts.
When evaluating the effects of dataset size on the model’s generalization ability, the detection performance can be seen to generally be better in the cases of (a) evaluating on stems (compared to tomatoes) and (b) evaluating on data from the angled camera (compared to the perpendicular). This kind of result could suggest that if someone wished to prioritize data-labelling efforts, tomatoes may not be as important as other classes (such as stems). One of the reasons for this could also be the artifact of using models which have been pre-trained. For example, classes in COCO, such as stop signs, apples and oranges, have many similar features to tomatoes which may generalize well. We leave this as an open question for future work.
Finally, when considering the performance of models trained on the pose set of variations to all greenhouse variations studied in this work, there is again a clear difference between cases where it has seen similar types of variations (angled and pose) versus the variations it has not seen (task and illumination). While the illumination data were arguably the hardest for the models to generalize, the task dataset yielded good performance out of the box while showing improvements with increasing training set sizes. Particularly for the illumination dataset, this result suggests that for tasks such as harvesting (where stems and tomatoes are critical to identify correctly), it may be beneficial to collect and re-train models on more similar data before deployment, while there may be more flexibility with respect to the task dataset.
There are several limitations to this study. First, our experiments only evaluate a single type of model architecture (Mask-RCNN), which was to control for variations in the learning dynamics. While this is a popular model used in greenhouse automation works, there are also a variety of other architectures, extensions to this architecture, or different tasks leveraging similar object classes for which the models are optimized, which have not been covered in this work. In addition, all of our models have been fine-tuned from pre-trained models due to the lack of sufficient labelled data. While using pre-trained models is common, it would be interesting to see the effects of training using greenhouse data only. Lastly, while we presented data with respect to, for example, a specific task (data collected from an eye-in-hand camera getting ready for a harvesting operation, “Task” dataset), our current study does not evaluate the effect on the downstream harvesting task and success rate. We leave this for future work.
6. Conclusions
In this work, we trained and evaluated object detection models for stems and tomato classes under three very different conditions: (1) when labelled data are available and the camera views are different; (2) when labelled data are scarce and the camera views are different; and (3) when faced with entirely different environmental conditions and sensors. Our results indicate that for stems, learning from data collected perpendicular to tomato plants is more advantageous than learning from an angled camera. In addition, when considering generalization across datasets, some sources of variation in the input data (such as the “task” dataset, where images of tomato plants were collected by an eye-in-hand camera) may be easier to generalize to than others (such as the “illumination” dataset, where large changes in the brightness and contrast are present). As mentioned, greenhouse environments are not expected to always be consistent. Understanding how a robot’s vision system will perform under different conditions can help practitioners in deploying such systems in the real world, including understanding the kind of performance to expect, and can be used to help prioritize further data collection and evaluation efforts.
Author Contributions
Conceptualization, M.M. and M.V.; methodology, M.V. and M.M.; software, S.H. and M.V.; validation, S.H. and M.V.; formal analysis, S.H., M.M. and M.V.; investigation, S.H. and M.V.; resources, C.T.; data curation, S.H. and C.T.; writing—original draft preparation, M.V., S.H. and M.M.; writing—review and editing, M.V., M.M. and S.H.; visualization, M.V. and S.H; supervision, M.M. and M.V.; project administration, M.M.; funding acquisition, M.M. All authors have read and agreed to the published version of the manuscript.
Funding
This work was supported by Agriculture and Agri-food Canada, as well as the Natural Sciences and Engineering Research Council of Canada (NSERC).
Institutional Review Board Statement
Not applicable.
Data Availability Statement
The data presented in this study are available on request from the corresponding author.
Conflicts of Interest
The authors declare no conflicts of interest.
References
- Bargoti, S.; Underwood, J.P. Image segmentation for fruit detection and yield estimation in apple orchards. J. Field Robot. 2017, 34, 1039–1060. [Google Scholar] [CrossRef]
- Chen, S.W.; Shivakumar, S.S.; Dcunha, S.; Das, J.; Okon, E.; Qu, C.; Taylor, C.J.; Kumar, V. Counting apples and oranges with deep learning: A data-driven approach. IEEE Robot. Autom. Lett. 2017, 2, 781–788. [Google Scholar] [CrossRef]
- Rahnemoonfar, M.; Sheppard, C. Deep count: Fruit counting based on deep simulated learning. Sensors 2017, 17, 905. [Google Scholar] [CrossRef]
- Zhang, L.; Jia, J.; Gui, G.; Hao, X.; Gao, W.; Wang, M. Deep learning based improved classification system for designing tomato harvesting robot. IEEE Access 2018, 6, 67940–67950. [Google Scholar] [CrossRef]
- Lu, T.; Han, B.; Chen, L.; Yu, F.; Xue, C. A generic intelligent tomato classification system for practical applications using DenseNet-201 with transfer learning. Sci. Rep. 2021, 11, 15824. [Google Scholar] [CrossRef]
- Monavar, H.M.; Alimardani, R.; Omid, M. Detection of red ripe tomatoes on stem using Image Processing Techniques. J. Am. Sci. 2011, 7, 376–379. [Google Scholar]
- Chiu, Y.C.; Chen, S.; Lin, J.F. Study of an autonomous fruit picking robot system in greenhouses. Eng. Agric. Environ. Food 2013, 6, 92–98. [Google Scholar] [CrossRef]
- Chen, X.; Yang, S.X. A practical solution for ripe tomato recognition and localisation. J. Real-Time Image Process. 2013, 8, 35–51. [Google Scholar] [CrossRef]
- Khoshroo, A.; Arefi, A.; Khodaei, J. Detection of red tomato on plants using image processing techniques. Agric. Commun. 2014, 2, 9–15. [Google Scholar]
- He, K.; Gkioxari, G.; Dollár, P.; Girshick, R. Mask r-cnn. In Proceedings of the IEEE International Conference on Computer Vision, Venice, Italy, 22–29 October 2017; pp. 2961–2969. [Google Scholar]
- Redmon, J.; Divvala, S.; Girshick, R.; Farhadi, A. You only look once: Unified, real-time object detection. In Proceedings of the IEEE Conference on Computer Vision and Pattern Recognition, Las Vegas, NV, USA, 27–30 June 2016; pp. 779–788. [Google Scholar]
- Afonso, M.; Fonteijn, H.; Fiorentin, F.S.; Lensink, D.; Mooij, M.; Faber, N.; Polder, G.; Wehrens, R. Tomato fruit detection and counting in greenhouses using deep learning. Front. Plant Sci. 2020, 11, 571299. [Google Scholar] [CrossRef]
- Magalhães, S.A.; Castro, L.; Moreira, G.; Dos Santos, F.N.; Cunha, M.; Dias, J.; Moreira, A.P. Evaluating the single-shot multibox detector and YOLO deep learning models for the detection of tomatoes in a greenhouse. Sensors 2021, 21, 3569. [Google Scholar] [CrossRef] [PubMed]
- Liu, G.; Nouaze, J.C.; Touko Mbouembe, P.L.; Kim, J.H. YOLO-tomato: A robust algorithm for tomato detection based on YOLOv3. Sensors 2020, 20, 2145. [Google Scholar] [CrossRef] [PubMed]
- Wspanialy, P. A Robotics System for Large-scale Plant Monitoring in Tomato Greenhouses. Ph.D. Thesis, University of Guelph, Guelph, ON, Canada, 2020. [Google Scholar]
- Rong, J.; Dai, G.; Wang, P. A peduncle detection method of tomato for autonomous harvesting. Complex Intell. Syst. 2021, 8, 2955–2969. [Google Scholar] [CrossRef]
- Liu, S.; Zhai, B.; Zhang, J.; Yang, L.; Wang, J.; Huang, K.; Liu, M. Tomato detection based on convolutional neural network for robotic application. J. Food Process. Eng. 2023, 46, e14239. [Google Scholar] [CrossRef]
- Song, C.; Wang, K.; Wang, C.; Tian, Y.; Wei, X.; Li, C.; An, Q.; Song, J. TDPPL-Net: A lightweight real-time tomato detection and picking point localization model for harvesting robots. IEEE Access 2023, 11, 37650–37664. [Google Scholar] [CrossRef]
- Zhang, J.; Xie, J.; Zhang, F.; Gao, J.; Yang, C.; Song, C.; Rao, W.; Zhang, Y. Greenhouse tomato detection and pose classification algorithm based on improved YOLOv5. Comput. Electron. Agric. 2024, 216, 108519. [Google Scholar] [CrossRef]
- Arad, B.; Kurtser, P.; Barnea, E.; Harel, B.; Edan, Y.; Ben-Shahar, O. Controlled lighting and illumination-independent target detection for real-time cost-efficient applications. the case study of sweet pepper robotic harvesting. Sensors 2019, 19, 1390. [Google Scholar] [CrossRef]
- Sun, T.; Zhang, W.; Miao, Z.; Zhang, Z.; Li, N. Object localization methodology in occluded agricultural environments through deep learning and active sensing. Comput. Electron. Agric. 2023, 212, 108141. [Google Scholar] [CrossRef]
- Feng, Q.; Cheng, W.; Zhang, W.; Wang, B. Visual Tracking Method of Tomato Plant Main-Stems for Robotic Harvesting. In Proceedings of the 2021 IEEE 11th Annual International Conference on CYBER Technology in Automation, Control, and Intelligent Systems (CYBER), Jiaxian, China, 27–31 July 2021; IEEE: Piscataway, NJ, USA, 2021; pp. 886–890. [Google Scholar]
- Wan, H.; Fan, Z.; Yu, X.; Kang, M.; Wang, P.; Zeng, X. A real-time branch detection and reconstruction mechanism for harvesting robot via convolutional neural network and image segmentation. Comput. Electron. Agric. 2022, 192, 106609. [Google Scholar] [CrossRef]
- Miao, Z.; Yu, X.; Li, N.; Zhang, Z.; He, C.; Li, Z.; Deng, C.; Sun, T. Efficient tomato harvesting robot based on image processing and deep learning. Precis. Agric. 2023, 24, 254–287. [Google Scholar] [CrossRef]
- Hemming, J.; Ruizendaal, J.; Hofstee, J.W.; Van Henten, E.J. Fruit detectability analysis for different camera positions in sweet-pepper. Sensors 2014, 14, 6032–6044. [Google Scholar] [CrossRef] [PubMed]
- Zheng, Y.Y.; Kong, J.L.; Jin, X.B.; Wang, X.Y.; Su, T.L.; Zuo, M. CropDeep: The crop vision dataset for deep-learning-based classification and detection in precision agriculture. Sensors 2019, 19, 1058. [Google Scholar] [CrossRef] [PubMed]
- Laboro Tomato: Instance Segmentation Dataset. 2020. Available online: https://github.com/laboroai/LaboroTomato (accessed on 1 January 2024).
- Zhou, K.; Liu, Z.; Qiao, Y.; Xiang, T.; Loy, C.C. Domain generalization: A survey. IEEE Trans. Pattern Anal. Mach. Intell. 2022, 45, 4396–4415. [Google Scholar] [CrossRef] [PubMed]
- Riou, K.; Zhu, J.; Ling, S.; Piquet, M.; Truffault, V.; Le Callet, P. Few-Shot Object Detection in Real Life: Case Study on Auto-Harvest. In Proceedings of the 2020 IEEE 22nd International Workshop on Multimedia Signal Processing (MMSP), Tampere, Finland, 21–24 September 2020; IEEE: Piscataway, NJ, USA, 2020; pp. 1–6. [Google Scholar]
- Tkachenko, M.; Malyuk, M.; Holmanyuk, A.; Liubimov, N. Label Studio: Data Labeling Software, 2020–2022. Open Source Software. Available online: https://github.com/heartexlabs/label-studio (accessed on 3 February 2023).
- Wu, Y.; Kirillov, A.; Massa, F.; Lo, W.Y.; Girshick, R. Detectron2. 2019. Available online: https://github.com/facebookresearch/detectron2 (accessed on 3 February 2023).
Disclaimer/Publisher’s Note: The statements, opinions and data contained in all publications are solely those of the individual author(s) and contributor(s) and not of MDPI and/or the editor(s). MDPI and/or the editor(s) disclaim responsibility for any injury to people or property resulting from any ideas, methods, instructions or products referred to in the content. |
© 2024 by the authors. Licensee MDPI, Basel, Switzerland. This article is an open access article distributed under the terms and conditions of the Creative Commons Attribution (CC BY) license (https://creativecommons.org/licenses/by/4.0/).

