Article

Analysis of Multiangle Wheat Density Effects Based on Drill Single-Seed Seeding

1
College of Intelligent Engineering, Jinzhong College of Information, Jinzhong 030801, China
2
College of Engineering, Nanjing Agricultural University, Nanjing 210031, China
3
College of Agricultural Engineering, Shanxi Agricultural University, Jinzhong 030801, China
4
Dryland Farm Machinery Key Technology and Equipment Key Laboratory of Shanxi Province, Jinzhong 030801, China
*
Author to whom correspondence should be addressed.
Agriculture 2024, 14(2), 176; https://doi.org/10.3390/agriculture14020176
Submission received: 14 December 2023 / Revised: 14 January 2024 / Accepted: 22 January 2024 / Published: 24 January 2024
(This article belongs to the Section Crop Production)

Abstract

:
Explaining the physiological and ecological effects of wheat population density can provide new research methods for field crop production. A three-year field trial under drill single-seed seeding was conducted, which used three different intra-row seed-seedling spacings to quantitatively analyze the density effect from three perspectives—population, individual plant, and single-stem panicle—at the winter wheat harvest. The results showed that year and density had significant effects on both the population and individual plant yield (p < 0.05), as well as on some yield components and biomass indicators. The interaction between planting density and annual climate was found only in the number of grains for both the entire population and individual plants. With the increase in planting density, the CI gradually increased, inhibiting the growth of individual plants and leading to a negative impact on monoculture wheat yield. The drill single-seed seeding method can provide a basic experiment condition for analyzing the density effect. The density effect of wheat populations originates from intraspecific competition, which mainly affects the growth of individual plants. Research based on the analysis of density effects from the perspectives of population, individual plants, and single-stem panicles can provide a methodological reference for precision agriculture.

1. Introduction

Wheat is one of the most important and widely grown cash crops [1]. The potential yield of wheat is stimulated when optimum agronomic conditions are obtained. Tillage systems are widely used in crop yield studies because they can create beneficial conditions for high yields by altering the physical, chemical, and biological properties of the soil [2,3]. In wheat production, it has been reported that seeding techniques such as broadcasting, line sowing, and bed planting affect final grain efficiency and yield [4,5]. Among the sowing modes adopted by farmers around the world for wheat cultivation, drill sowing has demonstrated the best results in terms of seedling density, 1000-kernel weight, and the number of grains per ear [6,7,8]. Other sowing techniques that have recently been studied include line spacing, seedling belt width [9], and punch seeding [10]. Korohou [11] proposed a drill single-seed seeding method to realize equal spacing of seeds in rows, while the germination rate at the emergence stage was higher compared to conventional methods. In this paper, we will use this method to study the late growth of the crop.
The variety of factors influencing crop growth, including annual climatic conditions, cultivation practices, and genotypes, makes it difficult to achieve the optimum population prediction for plants. At the same time, this is a huge obstacle to assessing variety or site-specific seeding rates and leads to harvested yield lagging behind the highest possible yield [12]. Suitable planting techniques and density can rationalize the distribution of growth resources to each plant, improve plant canopy structure, and ultimately influence grain yield [13,14]. At the same time, the influence of annual climate on the growing conditions of crops deserves to be considered [15].
Previous studies regarding planting density have focused on crop photosynthetic characteristics [16], canopy climate [17], canopy structure [18], above-ground and root growth conditions [19], and yield and yield components [20]. Among them, the link between reasonable planting density and yield components cannot be overemphasized [21]. Walsh [22] studied the effect of seeding rate and nitrogen fertilization on wheat population yield. The findings suggested that proper plant population and nitrogen management are important for optimizing wheat yield and quality through enhanced nitrogen uptake and improved nitrogen use efficiency (NUE). Twizerimana [23] analyzed the combined effects of different seeding methods and seeding rates on the quality and yield characteristics of winter wheat. Most research has found that grain yields decline with excessively increasing seeding rates [23]. The reason behind this is increased competition between plants, starting from germination and continuing throughout their growth. Ultimately, intraspecific competition affects the individual performance of plants at the maturity stage [24]. Excessive increases in planting densities can result in limited resources for growth at the plant level, affecting the crop’s growing conditions and leading to a reduction in population yields [25].
Meanwhile, the biomass of above-ground organs, including leaves, stems, and ears, is an important indicator of plant growth and development and is closely related to crop yield [26,27,28]. Optimum control of these different indicators of biomass is one of the guaranteed ways to obtain high yields in a stable manner over time [29]. Therefore, it is necessary to apply a combination of biomass and yield indicators in the study of crop population quality. Current research on sowing density effects has focused on crop growth and yield composition based on population and individual aspects, with less emphasis on the more subtle aspects of single-stem panicles.
It is important for wheat production to conduct an analysis of the specific phenotype, starting from organs, individuals, and groups at different development stages [19]. Analysis of the actual performance in different ecological environments can reveal the laws governing plant biology. Precision planting techniques for wheat are the key to analyzing the physiological and ecological effects of population density at the different scales of “population-individual-organ”. In this study, yield and biomass indicators were obtained based on three levels: population, single plant, and single-stem panicle. In this paper, three different planting densities were designed under the drill single-seed seeding mode in a three-year field experiment. These were combined with yield and biomass indicators to quantify the physiological and ecological effects of population density on wheat harvest.

2. Materials and Methods

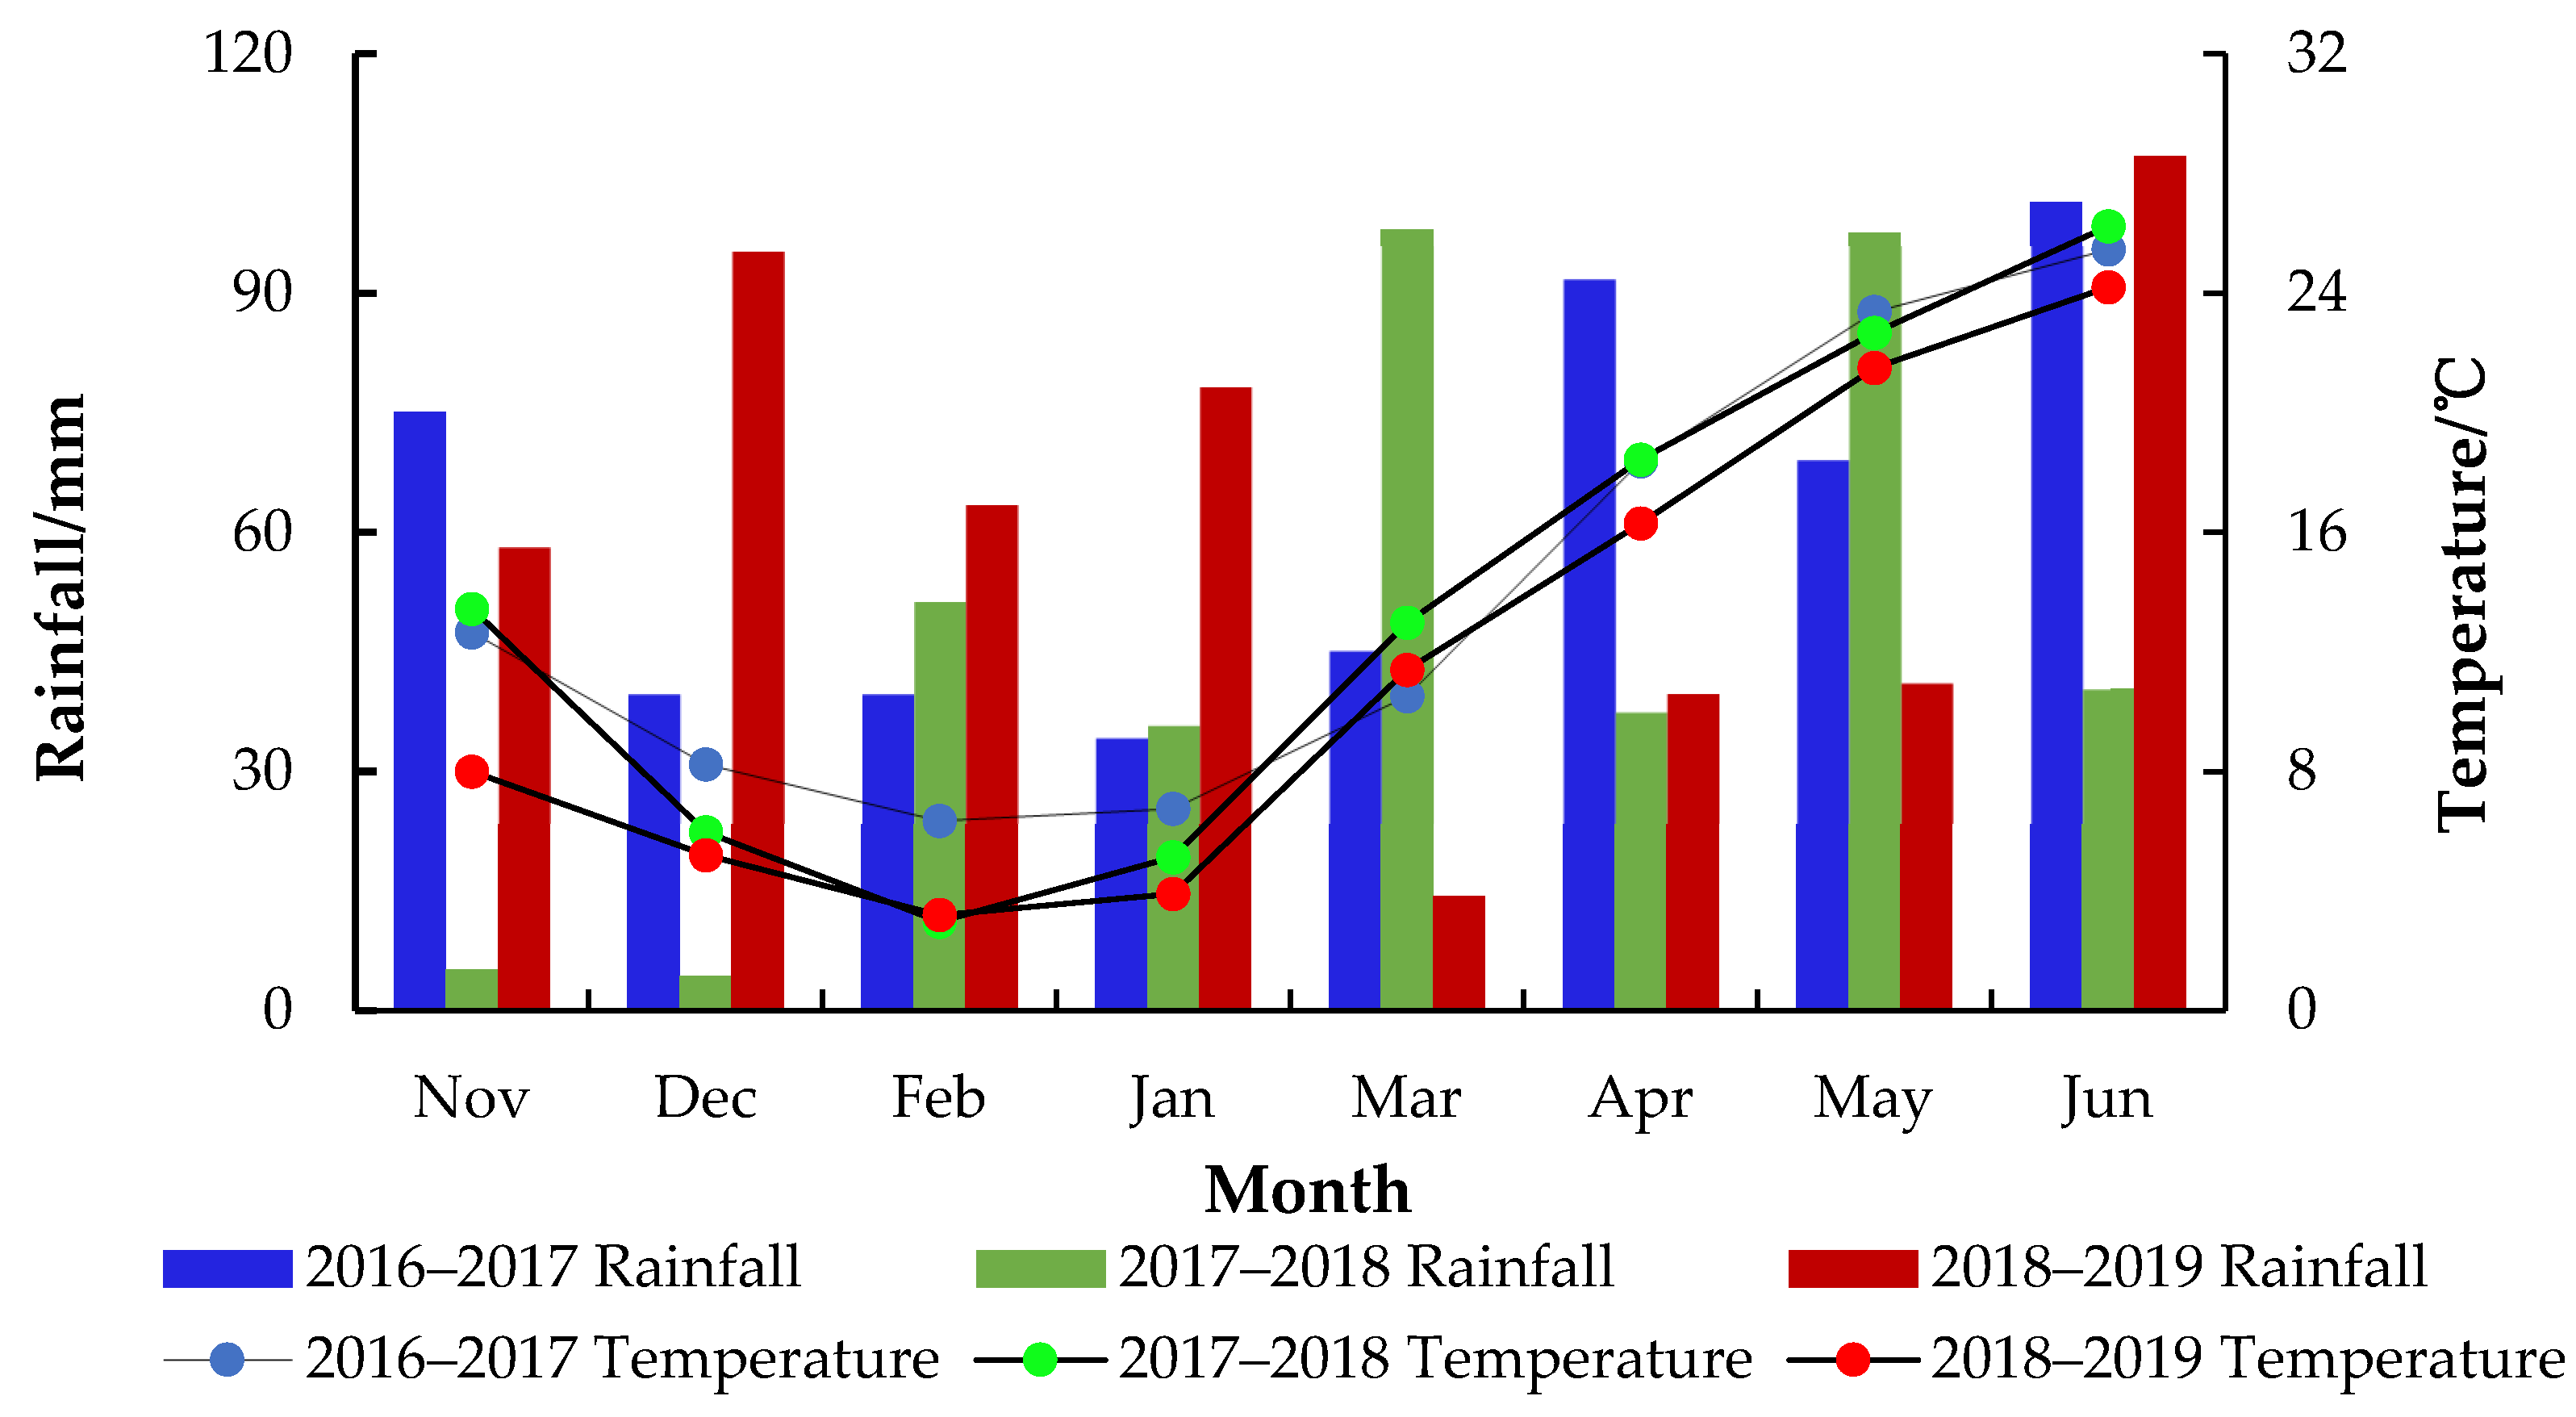
2.1. Experimental Design

This study was conducted at the Jiangsu Experimental Farm, Luhe, Nanjing City, Jiangsu, China (Figure 1). The site is located at 32°28’ N, 118°59’ E, in a subtropical monsoon climate, with an annual rainfall of approximately 1000 mm and an average temperature of 15.8 °C [30]. Rice–wheat rotation is a long-established agricultural system in this region. It is characterized by the paddy year from June to late November. One month before the rice harvest, fields are drained to allow soil to dry out for mechanical harvesting, after which the subsequent year of wheat or canola begins [31]. Soil organic matter, total nitrogen, available nitrogen, available phosphate, and available potassium were estimated to be 8.24 g·kg−1 (low), 0.97 g·kg−1 (medium), 12 mg·kg−1 (low), 12.67 mg·kg−1 (medium), and 11.05 mg·kg−1 (low), respectively. The soil texture consists of clay 21%, loam 40%, and sand 39%. The soil pH was established at 7.6 (alkalinity), according to the study conducted by Chen [32]. The physical parameters of the soil at a depth of 0–30 cm at the test site are shown in Table 1. The field management of the whole wheat period was consistent with that employed by local farmers.
“Ningmai-13”, a main winter wheat variety in the middle and lower reaches of the Yangtze River, was selected as the experimental material [33]. Phosphate, urea, and potassium chloride were applied to the soil surface at rates of 120 kg·hm−2, 150 kg·hm−2, and 135 kg·hm−2, respectively, based on the recommendation of Zhang [30]. In this study, drill single-seed seeding, a typical conservation agriculture system [34], was adopted and carried out on no-till soil with a row distance of about 20 cm. A randomized complete block design (RCBD) factorial was employed, incorporating three seed distances as one factor and three years as another factor, and three replications were made. The seed distances were set at 1.5 cm, 3 cm, and 4.5 cm to create three different planting densities. The treatments were referred to as follows: T1, T2, and T3. The no-till drill seeding method was performed, which was executed by first artificially opening sowing ditches and then seeding with a metal plate with grid spacing designed in the laboratory. Finally, the seeds were covered lightly with soil based on the experimental design proposed by Korohou [11]. The three-year field experiment was conducted in 2016–2017, 2017–2018, and 2018–2019. The sowing dates were 6 November 2016, 8 November 2017, and 8 November 2018, respectively. All treatments were repeated three times and arranged in a randomized complete block design, with plots measuring 3 m by 5 m. The whole wheat year relied on rain feeding, and harvesting was performed manually and brought back to the laboratory. Monthly mean temperature and rainfall data during the experimental period were recorded and are shown in Figure 2.
Wheat samples were collected at the time of harvest on 3 June 2017, 2 June 2018, and 2 June 2019. For each treatment group, a sampling strip with a length of 0.9 m was selected, with four replicates. The wheat in each sample strip was cut down as a single plant, following the method proposed by Zając [35]. Each single plant was placed in a separate plastic fillet bag to prevent sample mixing prior to subsequent treatments in the lab. Each plant was sun dried for three days. Further, each single plant sample was divided into several single-stem panicles, and each stem panicle was separated into organs. Growth analysis of the organs was performed by removing stems, leaves, and ears. The organ samples were dried at 105 °C using an electric blast drying box (Model HG 01-2A, Nanjing Honglong Instrument Equipment Factory, Nanjing China) for 24 h until they reached a constant weight. Finally, the weight of each organ was recorded from a single wheat sample based on the method outlined by Austin [36]. Dried wheat ears were subjected to a threshing treatment using a single-ear thresher (Model Ki-100, Changzhou Dedu Precision Instrument Co., Ltd., factory, Changzhou China) to obtain single-stem panicle grain yield.

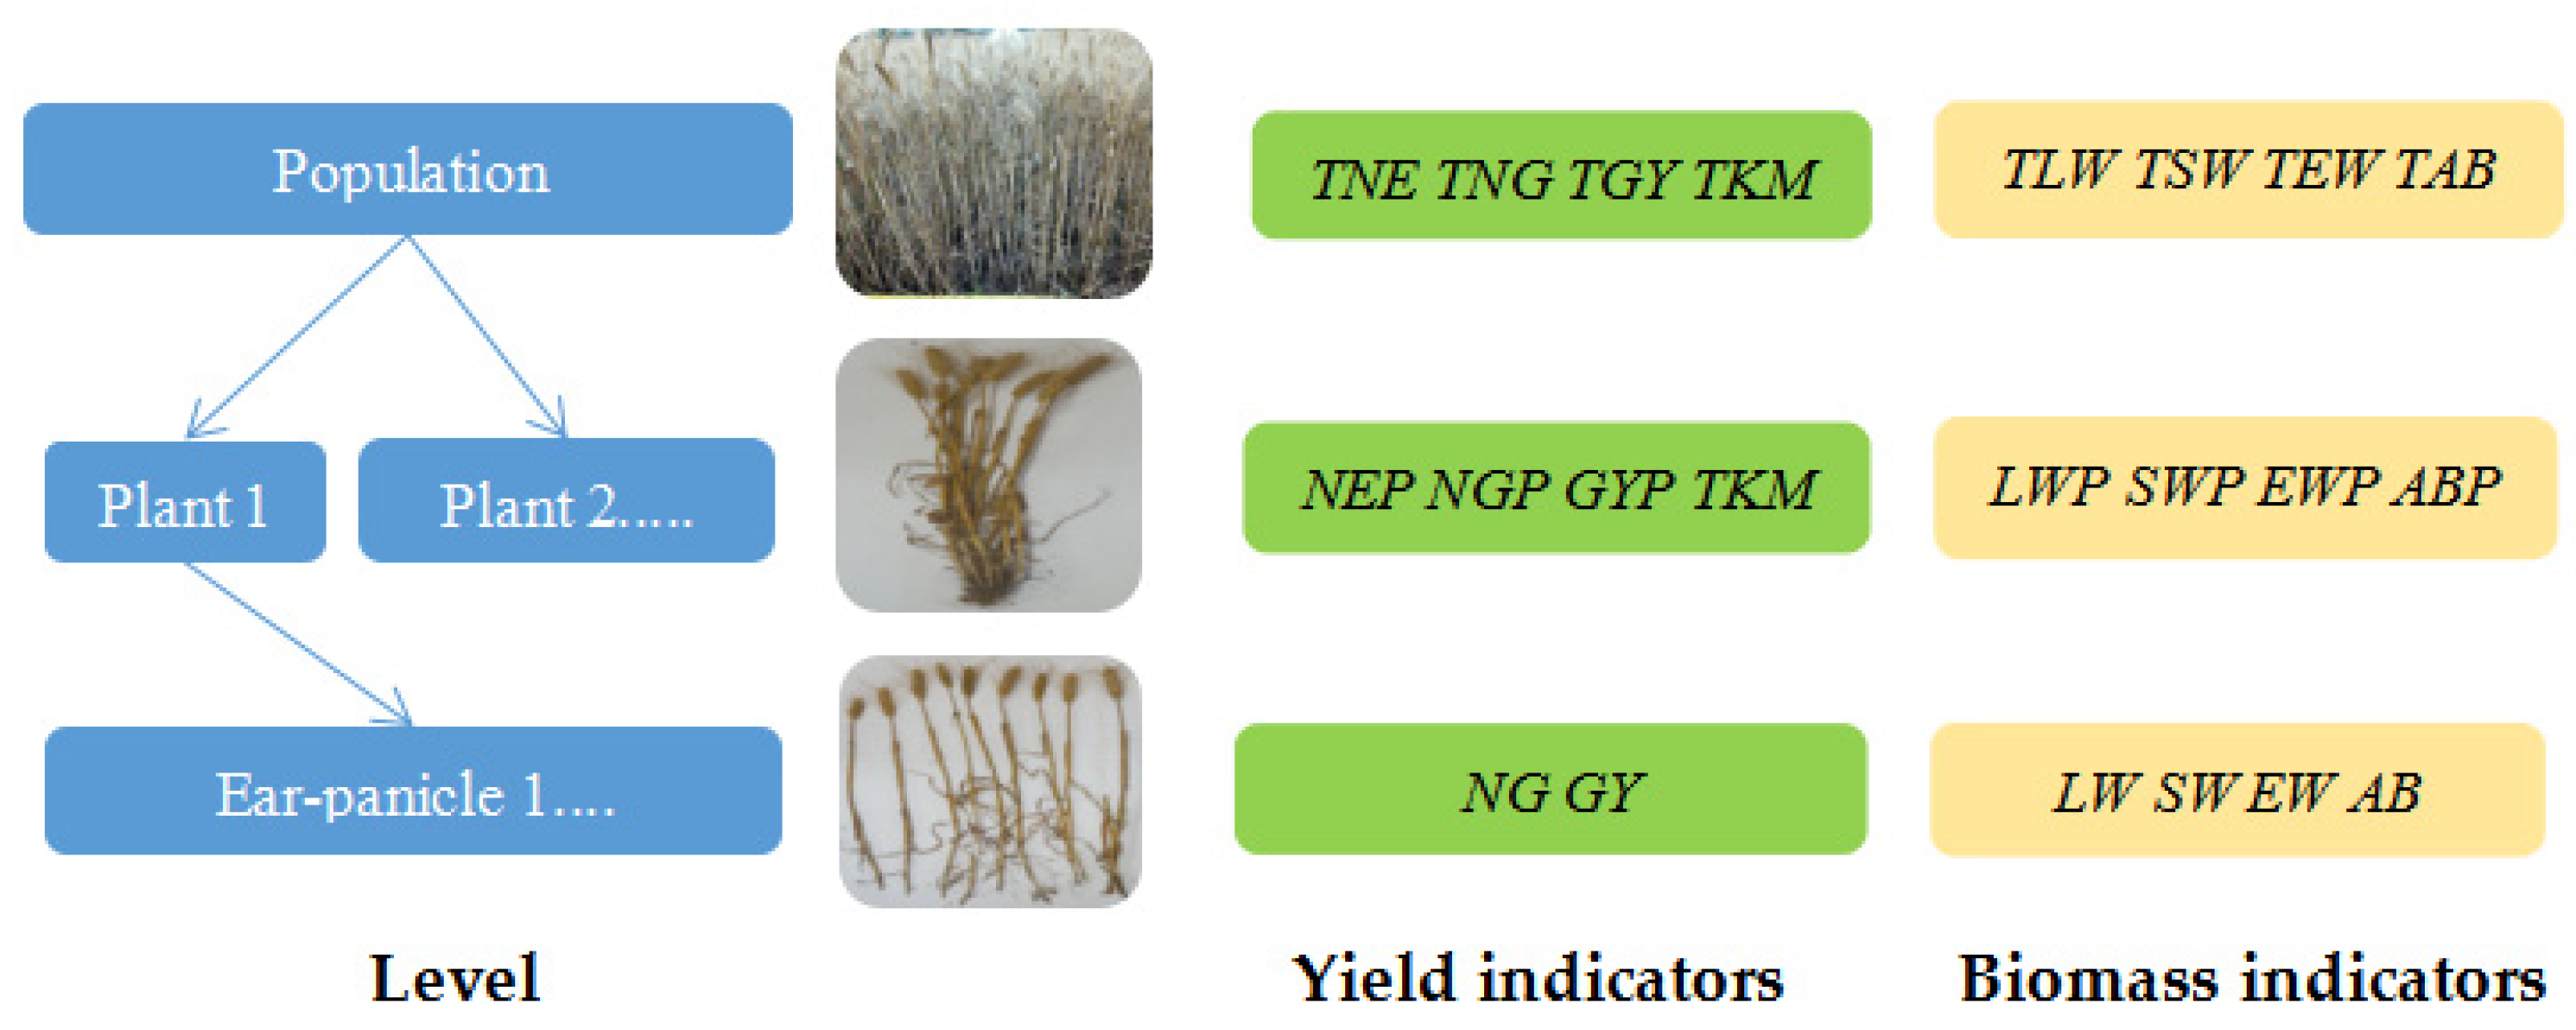
2.2. Plant Indicators

The analysis of the population density effects at the maturity stage was conducted based on the indicators shown in Table 1. For more details, please refer to the study by Tolmay [37]. The decomposition of indicators illustrating the effects of population density on wheat from three different perspectives is shown in Figure 3.
To quantify the effect of planting density on the growth of individual plants within the crop population, a metric called competitive intensity (CI) was proposed and defined as follows [38,39]:
CI = (ValuelcValuehc)/Valuelc,
where Valuelc and Valuehc are the individual plant indicators under low competition and high competition, respectively. The planting density of the T3 treatment was considered low competition, and other planting densities represented higher competition [38].
Further, to quantitatively express the effect of planting density on the growth of a single organ, the coefficient of variation was proposed. The coefficient of variation (CV) was calculated as follows [40]:
CV = s/x,
where s and x are the standard deviation and average value of the indicators per organ.

2.3. Statistical Analysis

An analysis of variance (ANOVA)m including all treatments, was performed for each parameter using the statistical software SPSS 22.0 (International Business Machines Corporation, Armonk, New York, NY, USA). Interaction terms, namely density, year, and year × density, were introduced into the linear mixed-effect model as fixed factors, and replication was treated as random effect factors. In addition, least significance difference (LSD) tests at a 5% probability level were performed to determine significant differences among all the measured properties.

3. Results

3.1. Influence of Planting Density at the Population Level on Wheat

The effects of planting densities on population yield and yield components throughout three years are shown in Table 2. Planting density and annual climate alone significantly (p < 0.05) affected population growth indices, excluding thousand-kernel weight and leaf weight. The interaction of planting density and annual climate significantly affected only the number of grain indicators (p < 0.05) (Table 3). The effect of population density on each indicator showed different results. In the 2016–2017 period, the T3 treatment had the lowest yield of 4652.5 kg·hm−2, which was significantly different from the remaining two treatments. The T1 treatment led to the highest yield in terms of wheat population; however, it was not significantly different from the T2 treatment. Meanwhile, the indicators for the total number of ears in the three treatments showed the same trend. The T2 treatment, although it obtained the highest total number of ears and grains, did not obtain higher yields for reasons related to the thousand-kernel weight indicator. In the 2017–2018 and 2018–2019 periods, the indicators for yield and total number of ears among the three treatments reflected the same trends and differences as observed in the first year. There were no significant differences between the thousand-kernel weight indicators of the three treatments in any of the years. In the first year, the indicators for the total number of grains and thousand-kernel weight were significantly different from those in the following two years, potentially related to the crop growth climate in that year.
Table 3 presents the effects of different planting densities on population biomass indicators under three years. Planting density had different effects on various biomass indicators for wheat. In the first year, there was no significant difference among above-ground biomass indicators under the three treatments. The T3 treatment yielded the lowest indicators for total stem weight and total ear weight and was significantly different from the remaining two treatments. In the 2017–2018 period, the T3 treatment had the lowest biomass indicators in all categories, with significant differences in the total stem weight, total ear weight, and yield indicators compared to the T1 treatment and no significant differences from the T2 treatment. The same results were observed in the three trials during the 2018–2019 period. For three years, differences in total leaf weight were not significant among the three treatments.
For the annual factor, we can notice that the thousand-kernel weight in 2016–2017 was significantly lower than in the two following years, well compensated by the fact that it received more spikes of grains for the yield. The reason could be related to the amount of rainfall during the year. By analyzing the rainfall in the three years of wheat, the 2016–2017 year had significantly more rainfall in April than the following two years, with an increase of 145% and 131%, respectively. At this time, wheat undergoes the tasseling stage, and excessive rainfall can lead to the loss of soil nutrients and insufficient light, which negatively affects the thousand-kernel weight.

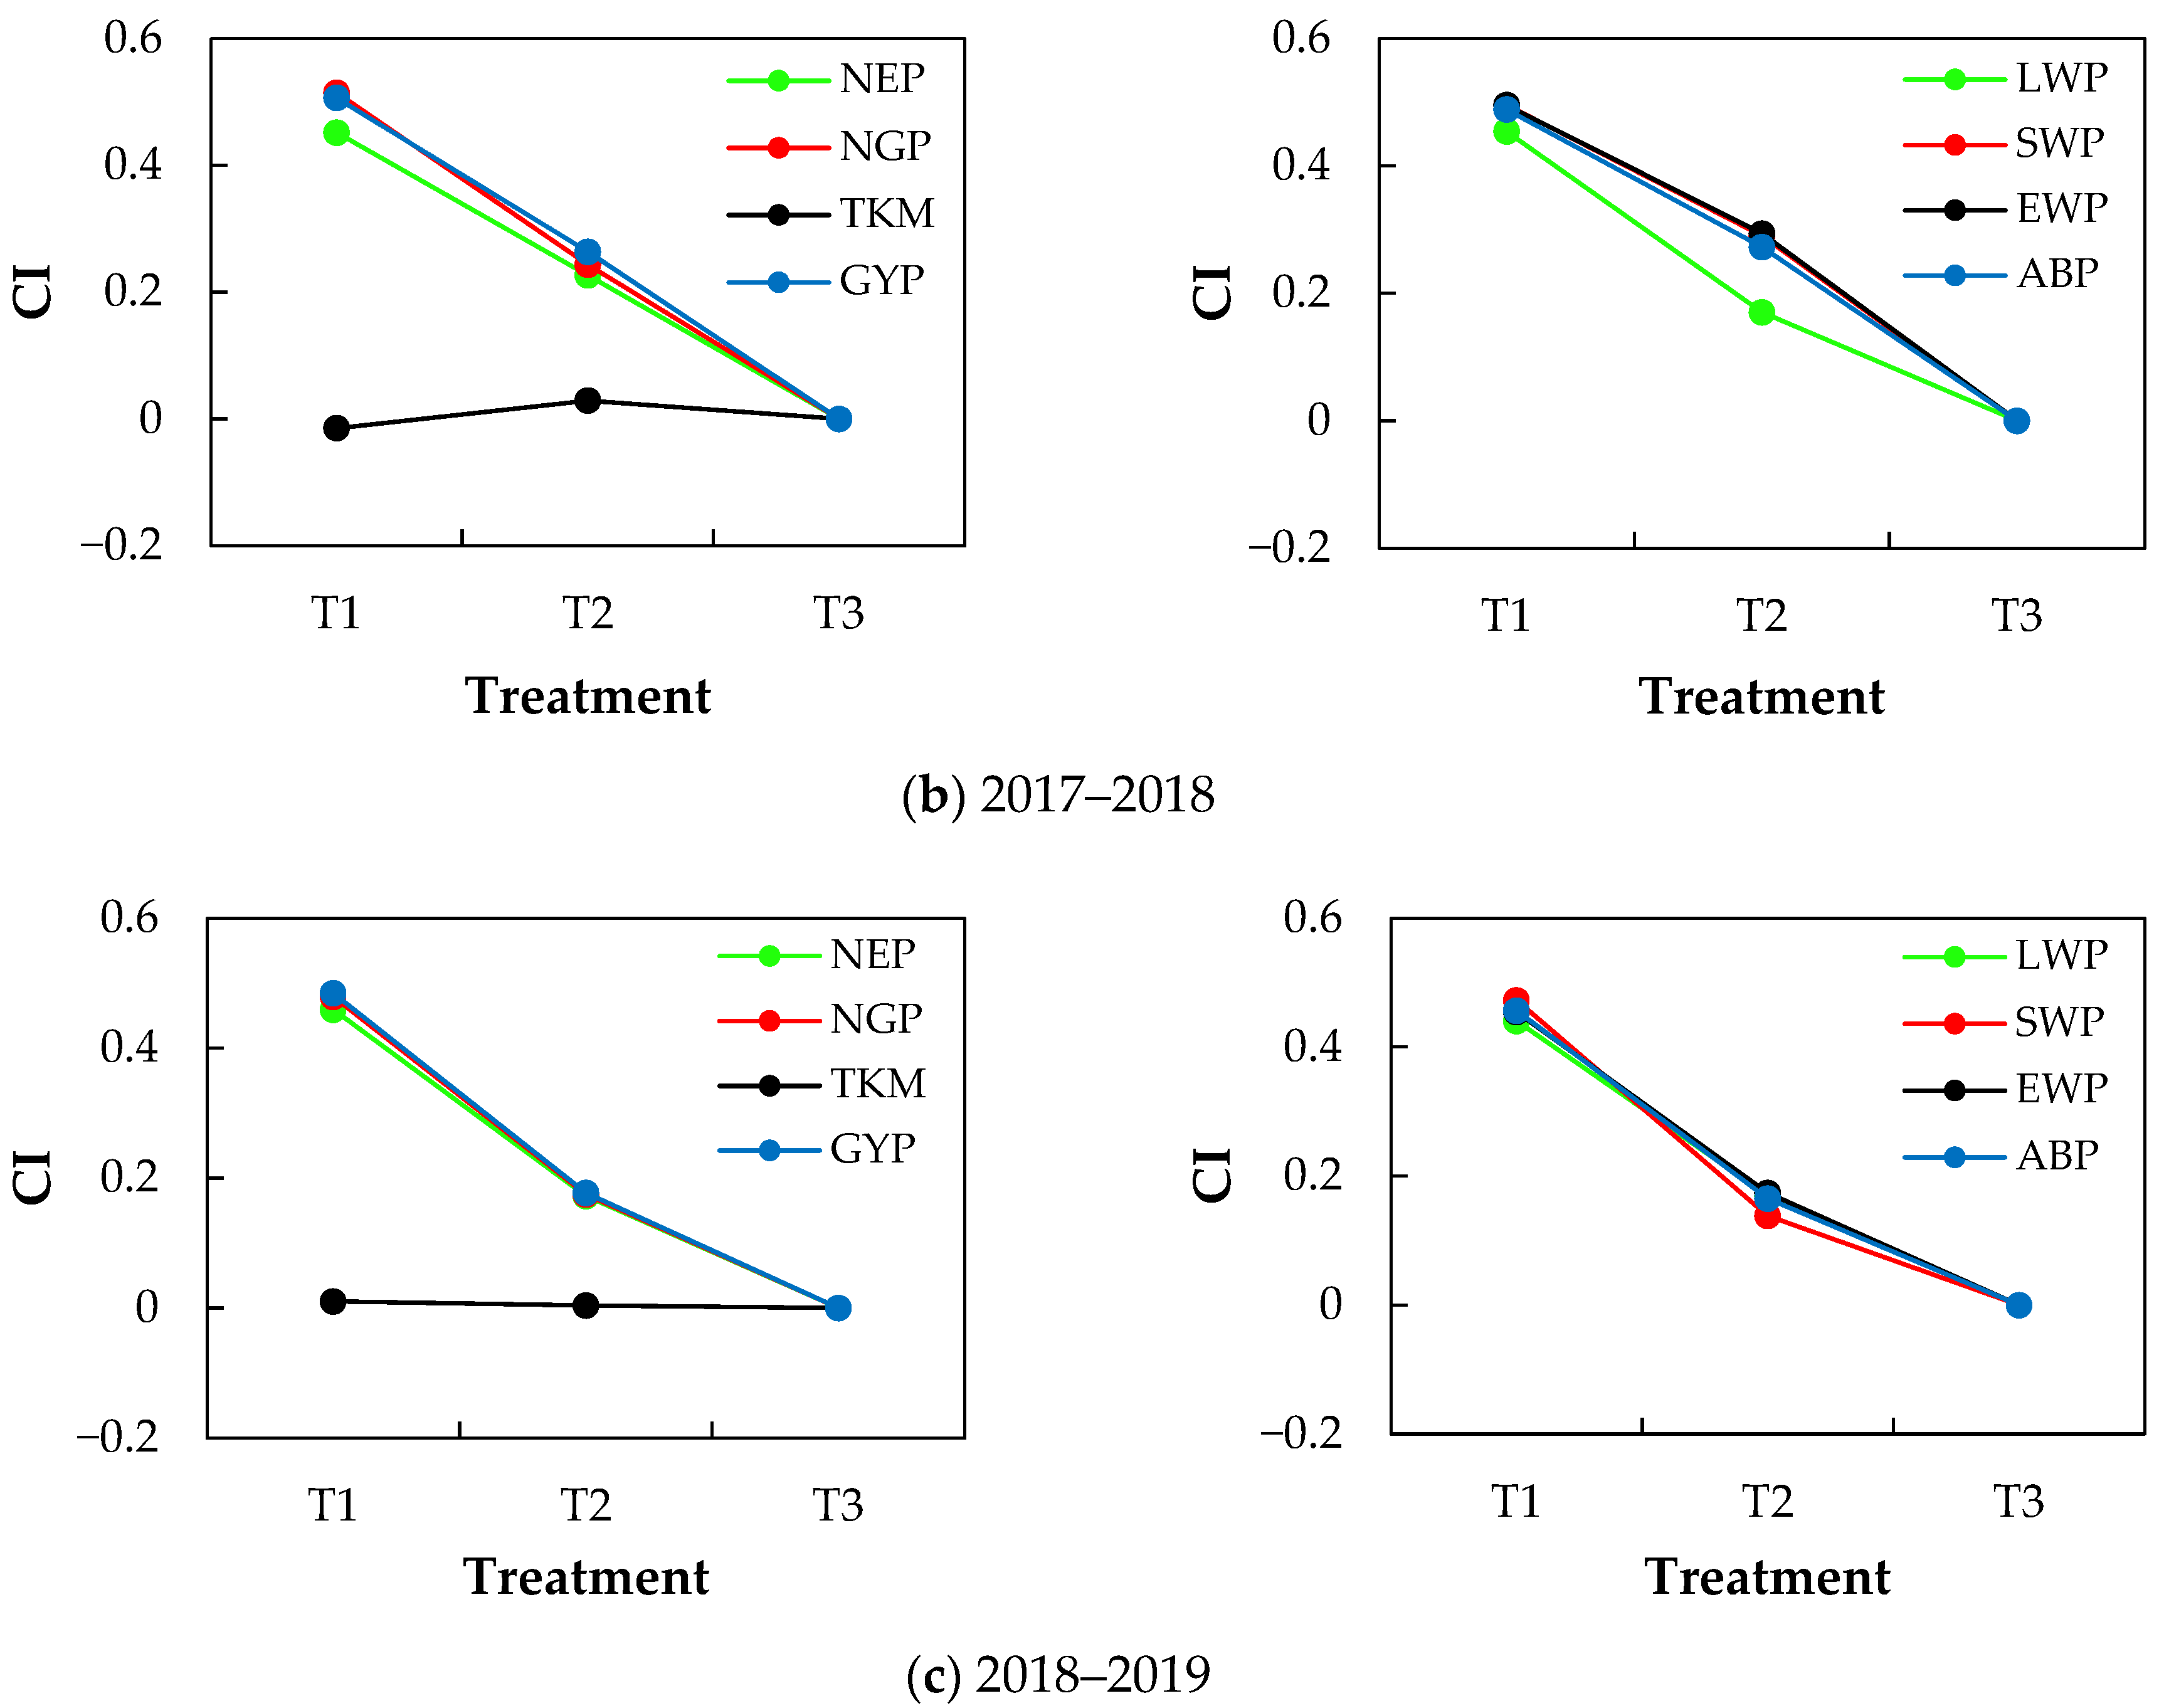
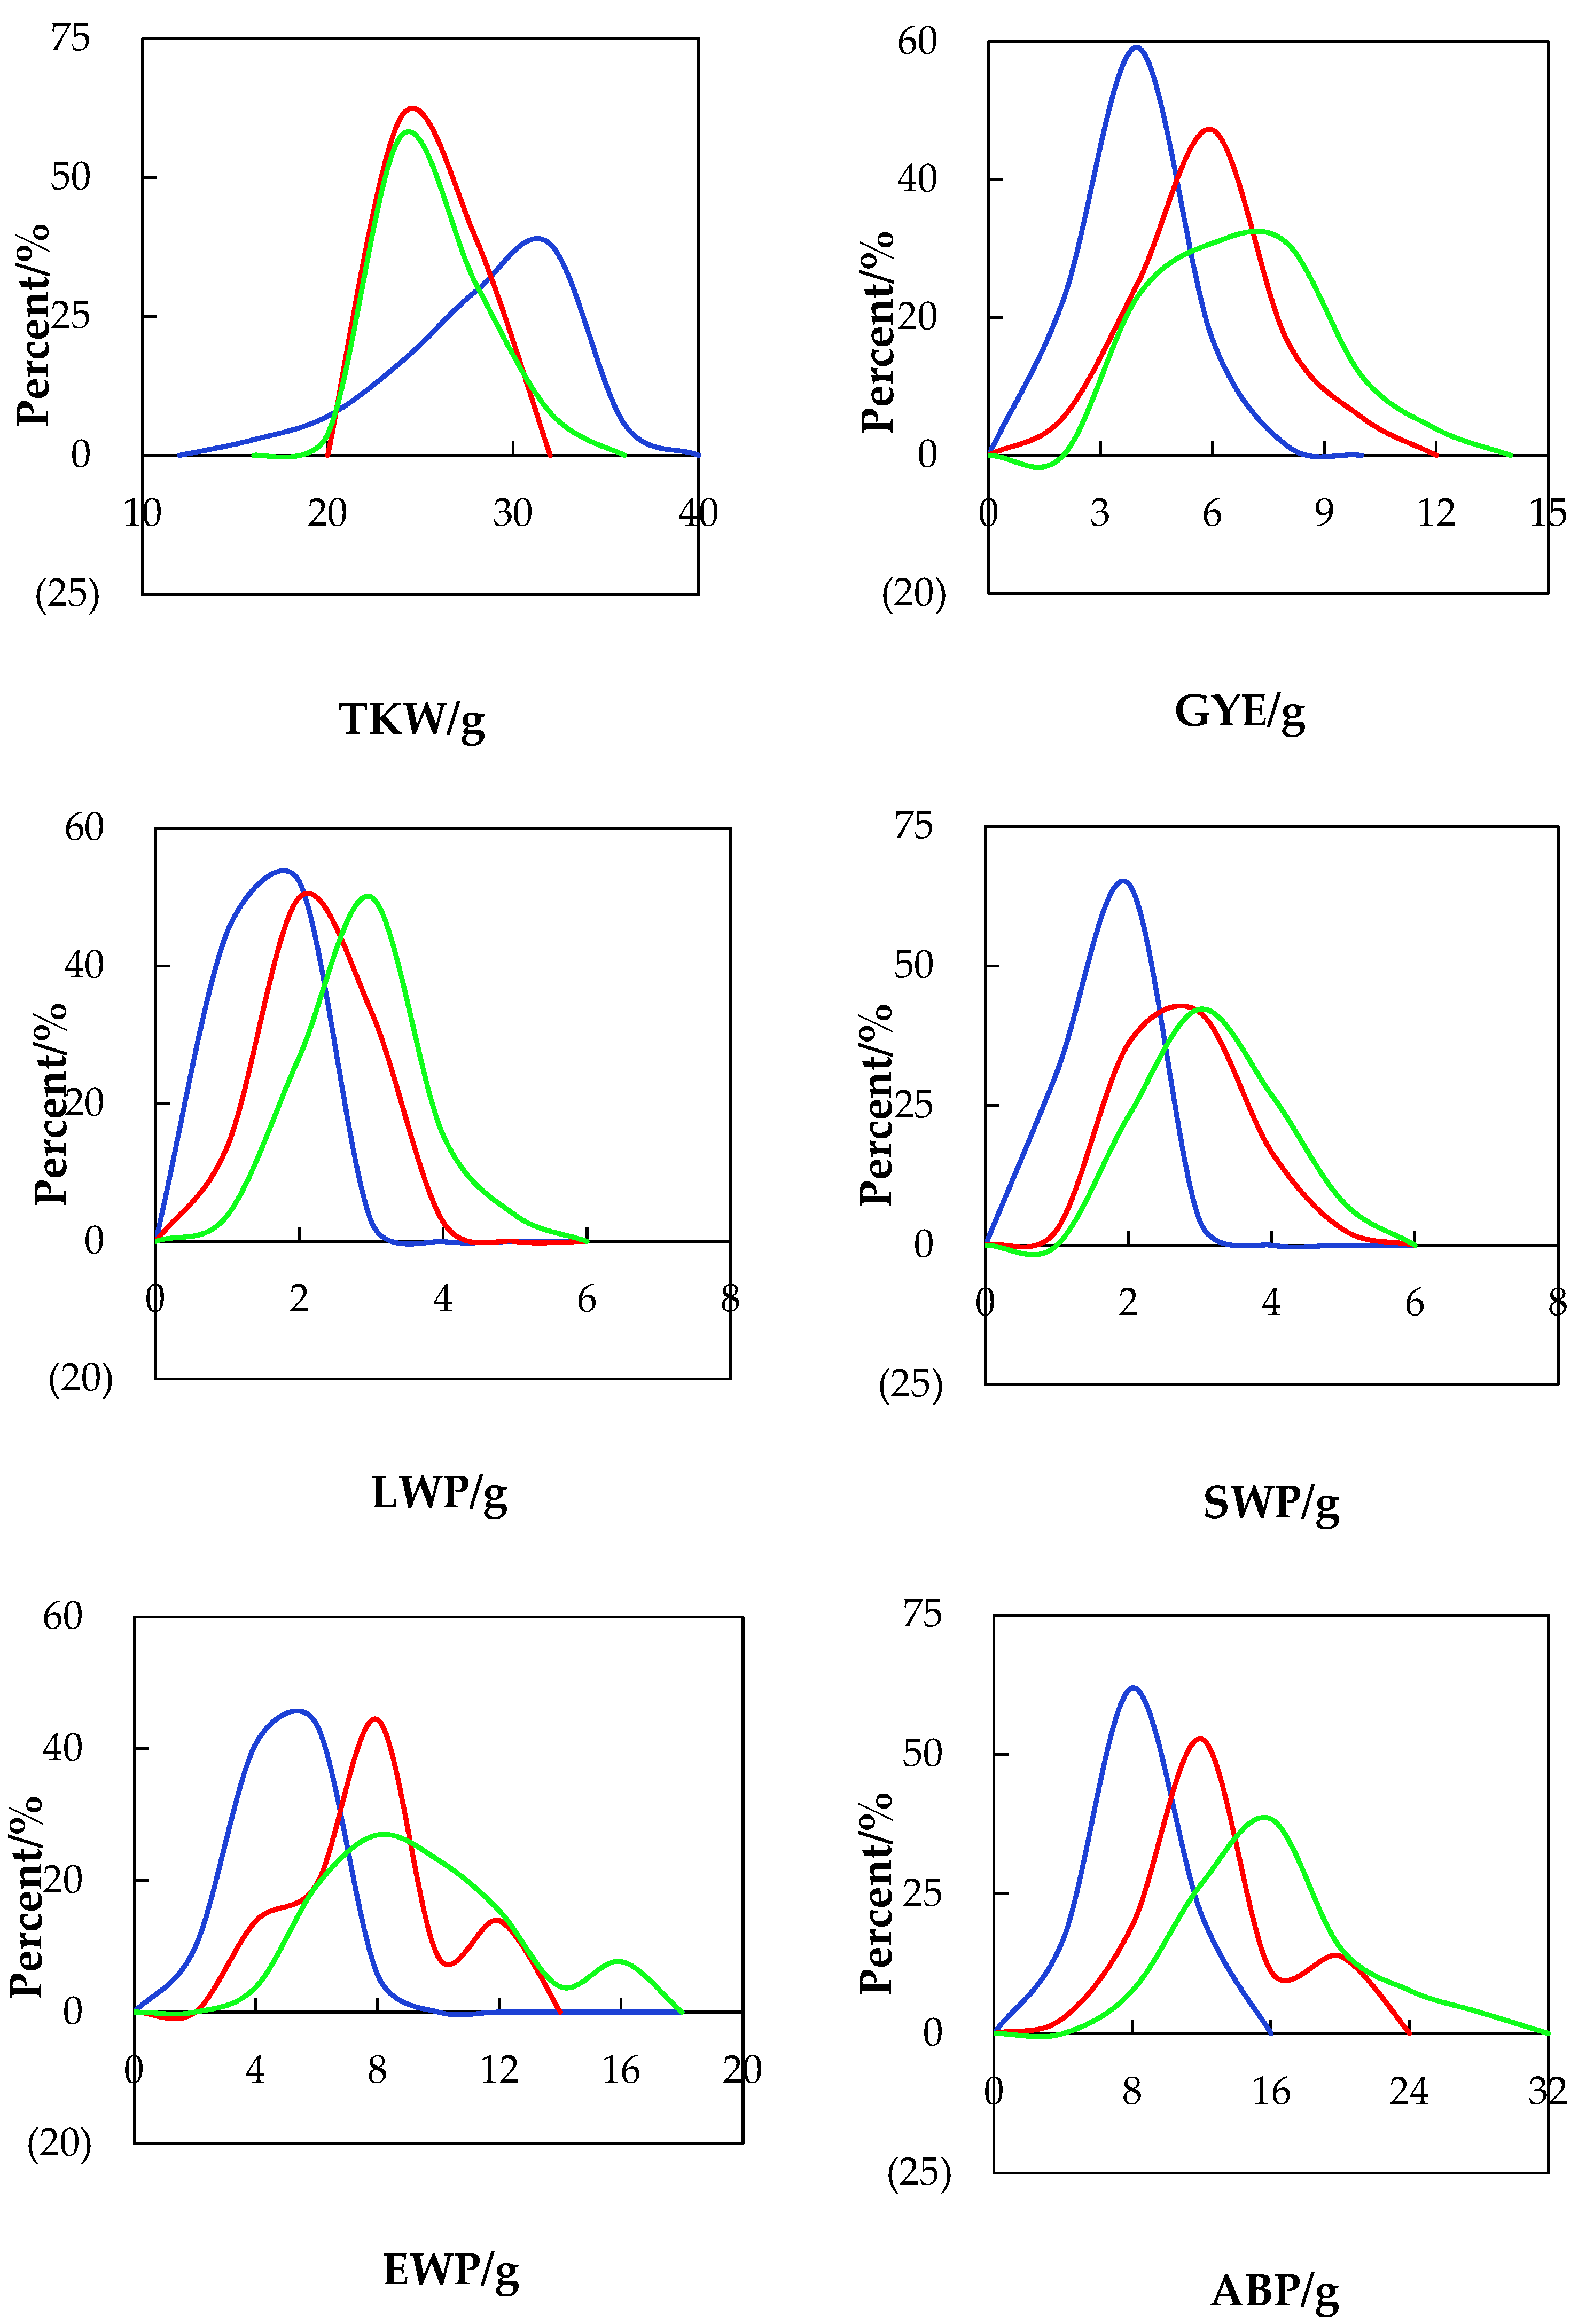
3.2. Influence of Planting Density at the Individual Level on Wheat

The effects of planting densities on the yield composition and biomass indicators of individual plants are shown in Table 4 and Table 5. Planting density significantly affected yield per plant, yield components, and biomass, excluding thousand-kernel weight (p < 0.05). Similarly, almost all the studied parameters were influenced by annual climate (except for leaf weight). Significant annual climatic and planting density had interactions only with the indicator of the number of grains per plant. The number of ears, grains, and yield per plant showed significant differences every year under different densities. In the meantime, these indices decreased with increasing planting density. The reason may be related to intraspecific competition within the crop population. A higher planting density means more intense intraspecific competition and a more suppressed yield potential per plant. The differences in thousand-kernel weight did not reach a significant level in any of the treatments. As can be seen in Table 3, there were significant differences in stem weight, ear weight, and aboveground biomass under different treatments over three years. Biomass indicators showed a decreasing trend with increased planting density. There was a significant difference in leaf weight between the T1 treatment and the T3 treatment each year.
To quantitatively express the effects of planting densities on the growth status of winter wheat, competition intensity (CI) was used in Figure 4. Except for thousand-kernel weight, both yield components and biomass indicators increased progressively in competitive intensity with increasing planting density over all three years. The reason is that increased planting density led to increased intraspecific competition among individuals in the population, and plant growth was inhibited. For the 2016–2017 period, the frequency distribution of single plant indicators is shown in Figure 5. Except for thousand-kernel weight, when the planting density increased for wheat, the distribution of single plant indicators gradually transformed from a normal distribution to an L-shape distribution (the distribution curves of each indicator shifted to the left). Thus, the effect of planting density on monoculture wheat indicators was further confirmed.

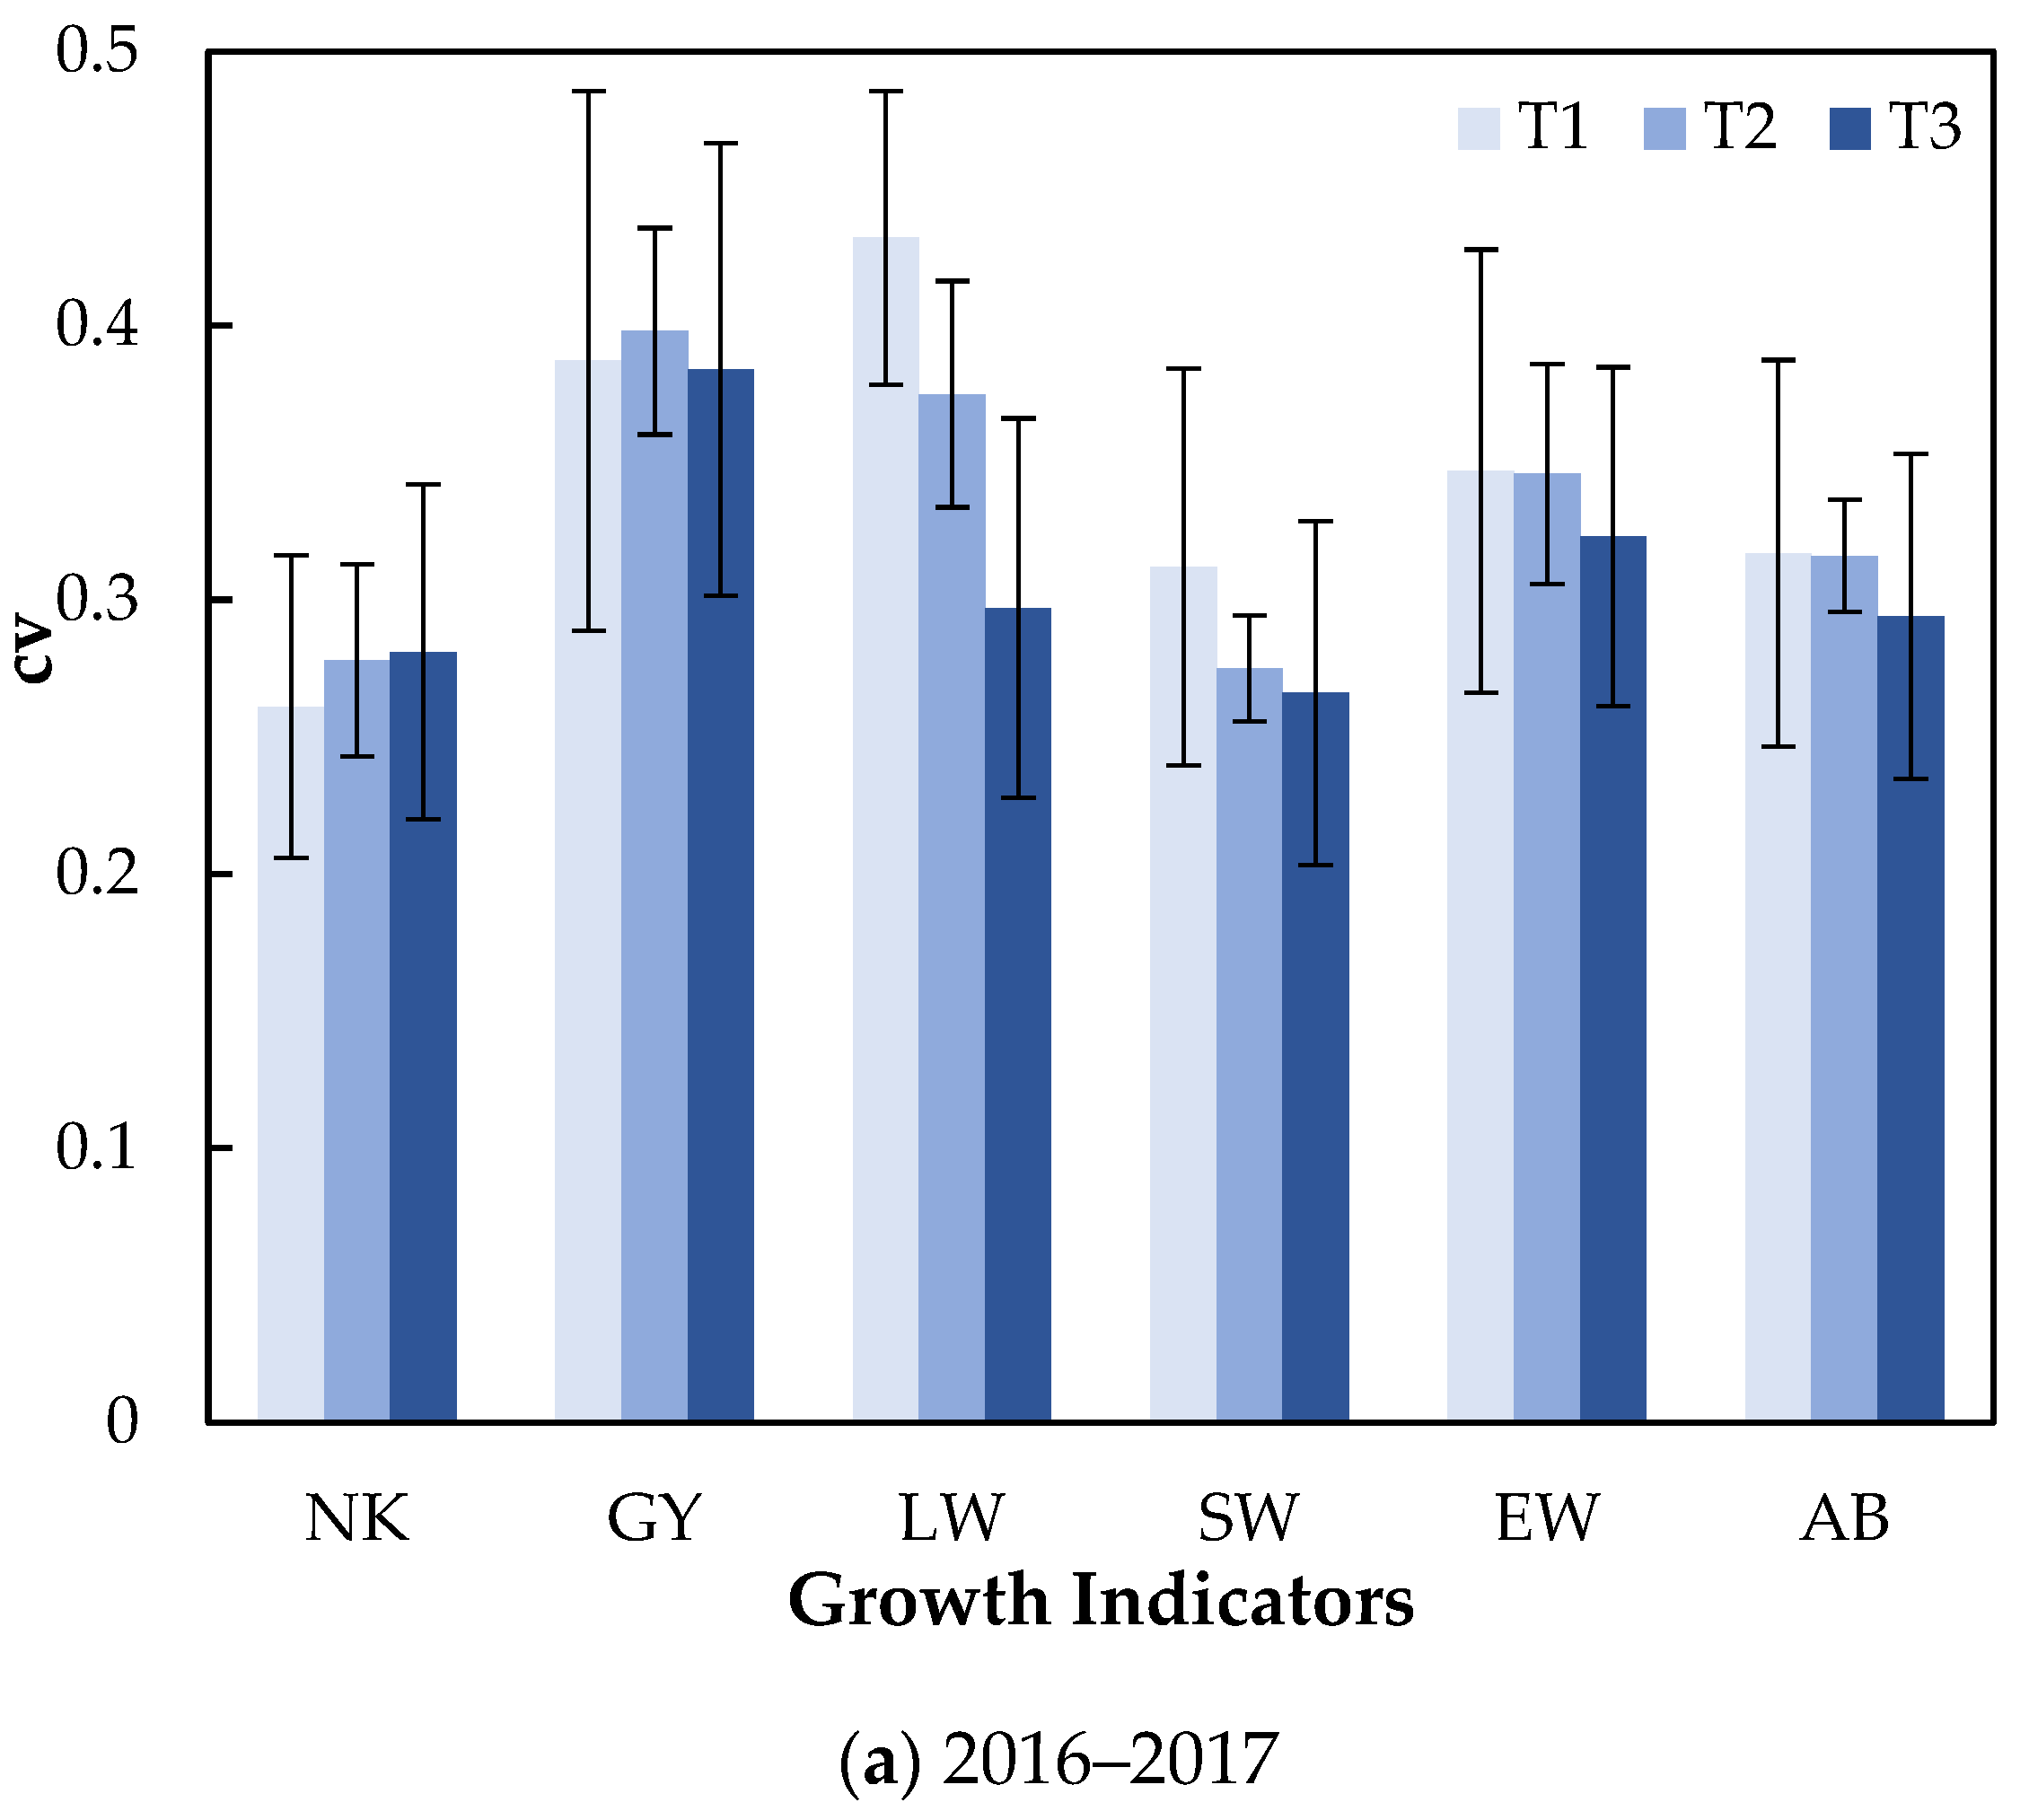
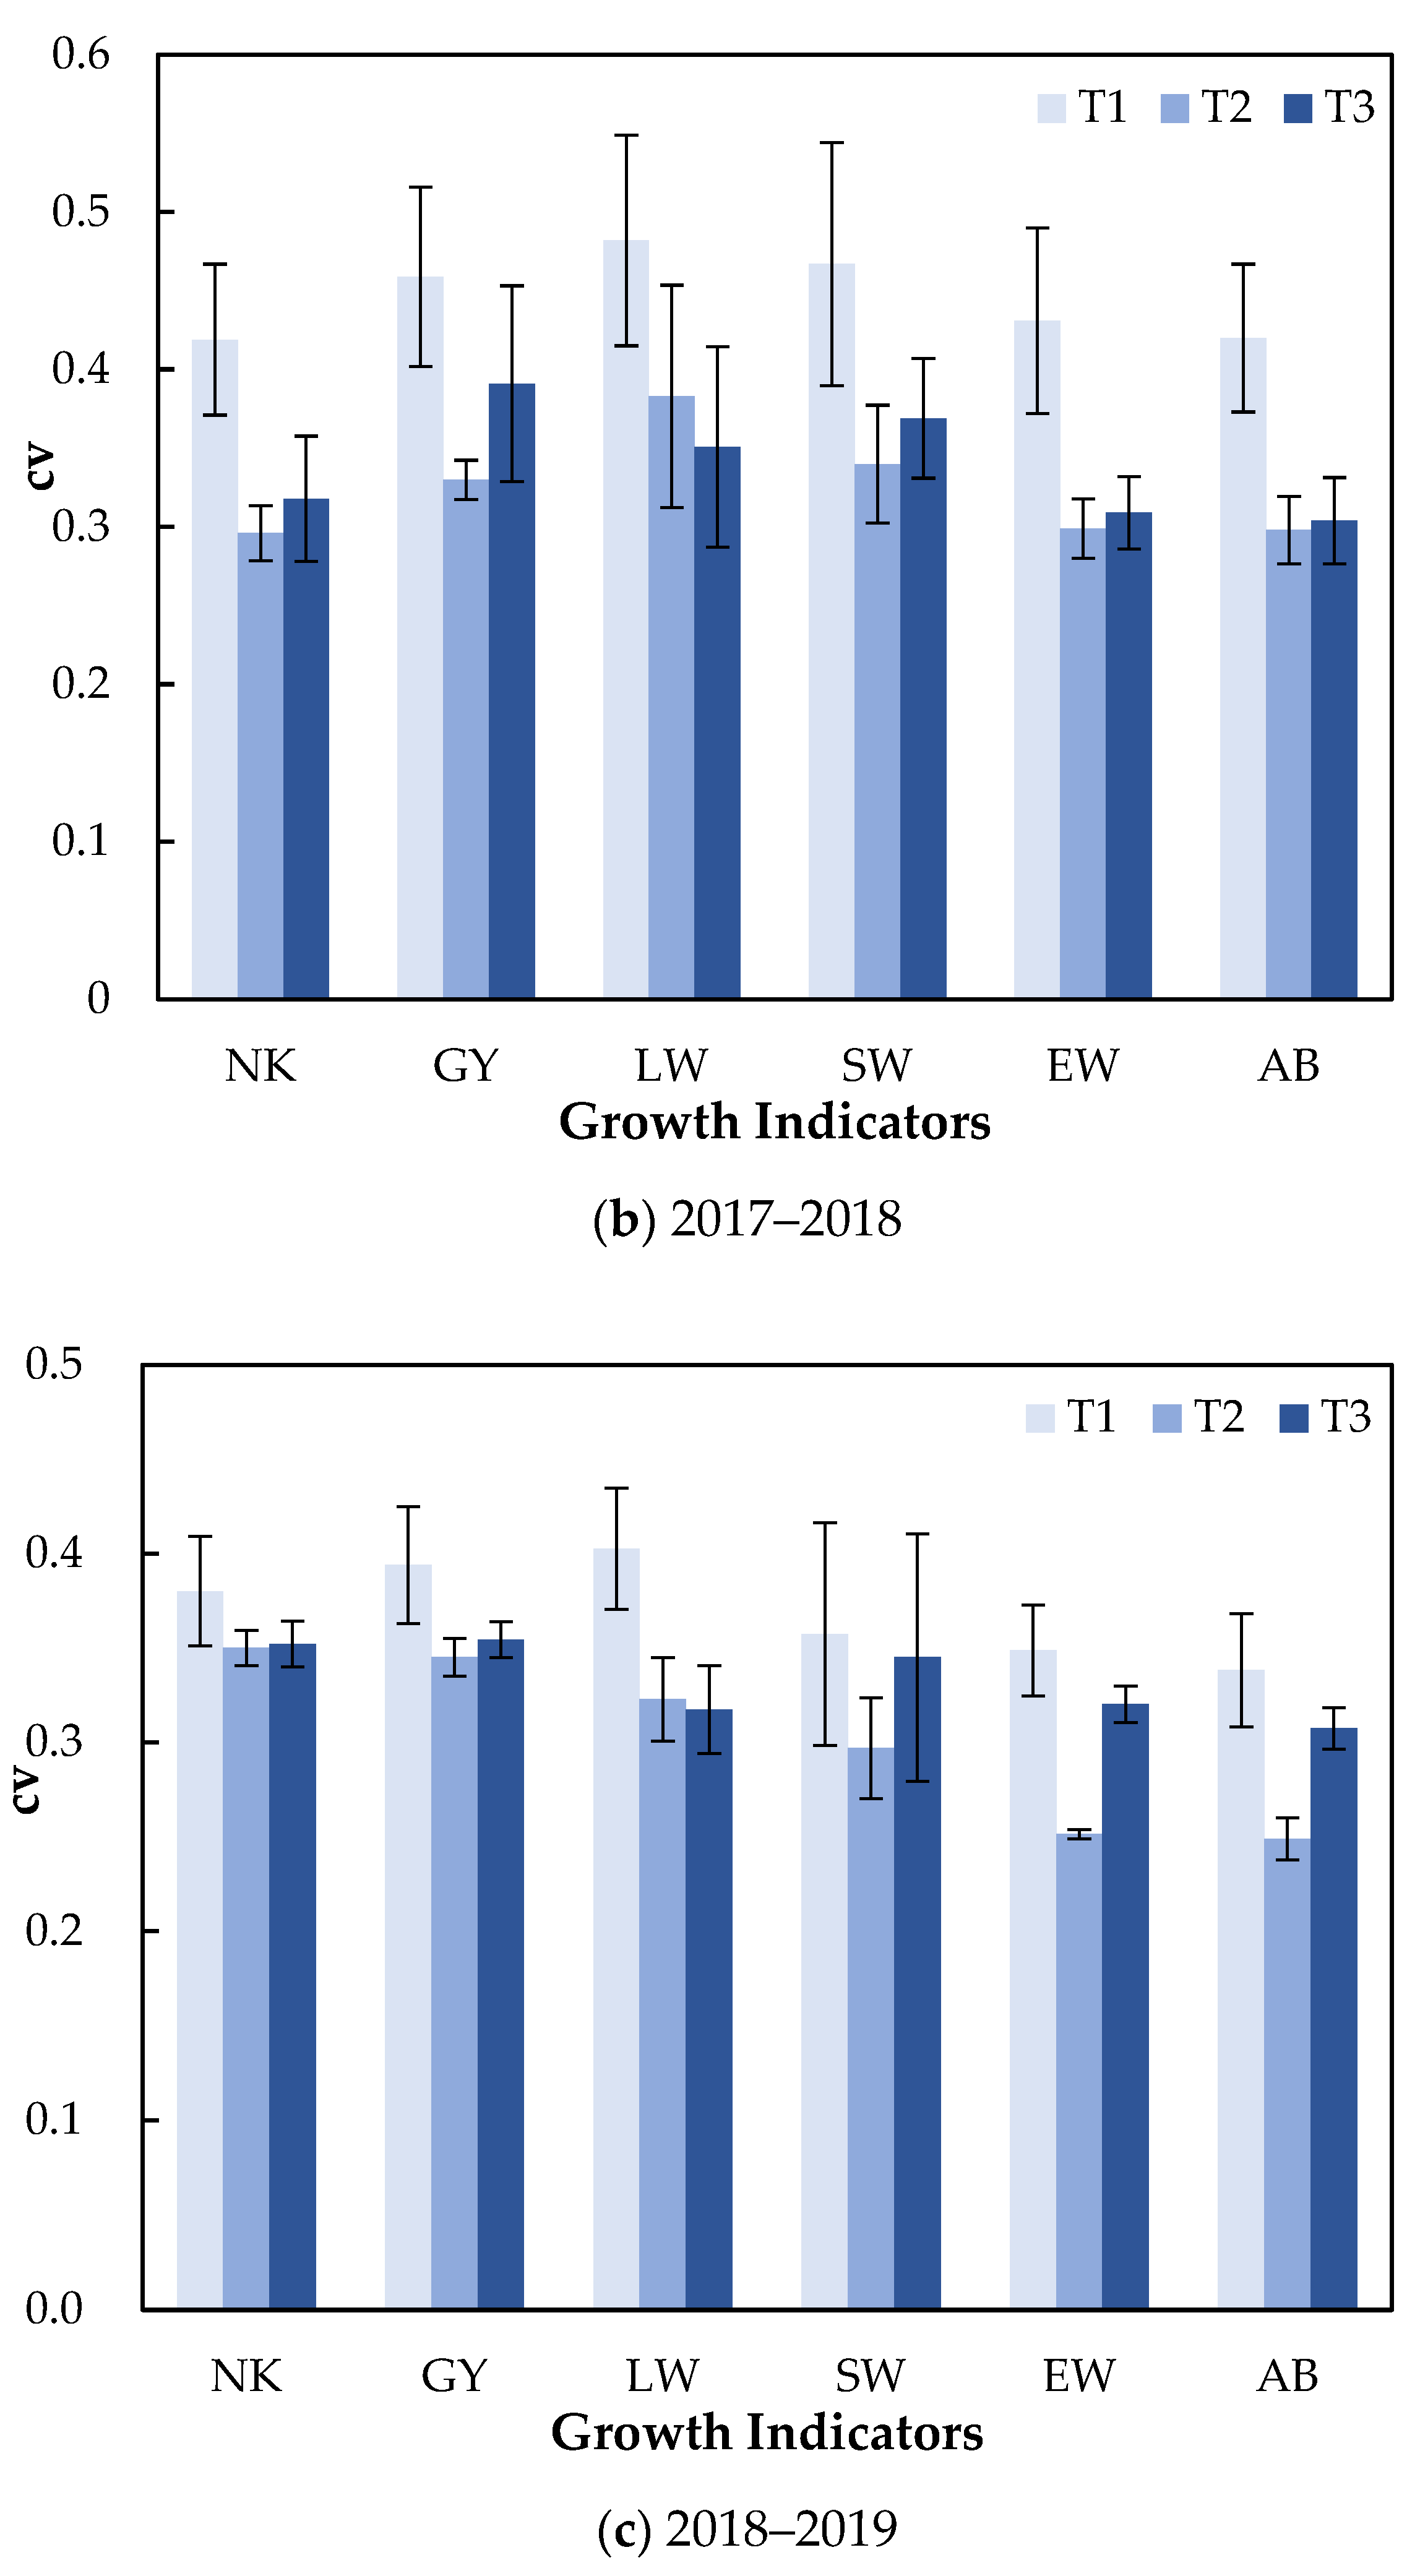
3.3. Influence of Planting Density at the Stem Panicle Level on Wheat

To further explore density effects in wheat, the effects of different planting densities on the yield and biomass indicators of above-ground organs are shown in Table 6. It can be seen that the indicators of single-stem panicles under different planting densities were not significant for the three years. The coefficient of variation for each indicator was different under different treatments (Figure 6). This shows that the degree of variation was related to planting density and annual climate. In the 2016–2017 and 2017–2018 period, the CV of leaf weight under the T1 treatment was the largest, reaching 0.432 and 0.482, respectively. The CV of grain yield was the largest for the T1 treatment during the 2018–2019 period. Further, the coefficient of variation of the T1 treatment was the largest for all indicators in every year, except for the total number of grains and grain yield in 2016–2017. There was no clear regularity in the coefficients of variation for any of the indicators.

4. Discussion

4.1. Suitable Support for Analyzing Group Density Effects

In crop production, the uniformity of seed distribution is an important factor affecting crop yield, and it can be regulated through sowing methods [40]. Ideally, plants in the field should be arranged at the same distance to achieve equal utilization of plant growth resources and eliminate interference and competition between plants [41]. The current mainstream wheat-planting technology still uses the machine drill sowing method, where seed distribution is random, and the spatial ecological position of seeds in the soil is difficult to accurately control, which increases the uncertainty of the physiological and ecological processes of individual plants [40]. Precision drills produce greater evenness in single-plant areas compared to bulk drills [42]. For this purpose, we introduce the drill single-seed seeding technique, which ensures that wheat plants are equally spaced and can maximize access to the same growth space resources for each wheat plant in the population. This approach ensures consistent physiological and ecological processes for each plant. Meanwhile, traditional studies of density effects in wheat monocultures use the traditional sampling method, where a certain number of representative single-plant samples are taken for analysis [15,43,44]. This leads to the possibility of uncertainty and controversy in the obtained results. In this paper, we adopted the band sampling method with the drill single-seed seeding technique, avoiding the chance that bias may occur in multipoint sampling. Single-seed precision seeding technology allowed us to control the number of seeds instead of the seed mass per unit area, which is preferable from an agronomic point of view. Further, this technique would eliminate the influence of seed bulk density on planting density [45]. Thus, the single seeding technique provides basic experimental conditions for the study of the physiological and ecological effects of wheat populations from multiple perspectives, helping researchers to accurately track the growth of individual crops or even individual stem spikes in wheat populations.

4.2. Planting Density’s Effect on Population Level

The results showed that the population effect of planting density depends on the yield components, including the total number of ears and grains, and above-ground biomass components, including the total stem and ear weight. Arduini [46] investigated the harvest growth of wheat using three varieties of durum wheat (Triticum durum Desf.) and three seeding rates. The result of the study showed that yield differences were mainly determined using the number of ears and grains and the weight of the ears in the population. Carr [47] studied the density effect of five varieties of hard red spring wheat (Triticum aestivum L. emend. ThelL). It was found that there were significant correlations between yield and the number of spikes per unit area, and it was demonstrated that annual climate change did not significantly affect the yield composition of wheat populations. Dai [48] conducted a two-year field experiment on winter wheat cultivation in northwestern China. It was observed that the plant density had significant effects on above-ground biomass. In this paper, similar results to previous studies were obtained. The optimal planting density can provide the optimal population structure and achieve high yields [49]. Lower planting density leads to a decrease in the number of effective panicles in the population, making it difficult to achieve high yields. On the contrary, when planting density is higher than the optimal density, the tillering of crops decreases, and the tillering and biomass accumulation in the population is limited, resulting in a decrease in yield instead of an increase [50]. In this study, the increase in planting density did not result in a significant increase in population yield, which is consistent with the findings of Tolmay [37]. Due to the insufficient gradient of selected planting densities in this experiment, the impact of excessive planting density was not clearly reflected in the crop population, and a wider density gradient needs to be further verified.

4.3. Planting Density’s Effect on an Individual Level

The results regarding the effect of planting densities on the growth status of individual crops show that planting density significantly affects the yield, number of ears, number of grains, stem weight, ear weight, and above-ground biomass weight per plant. However, planting density has no significant effect on the thousand-kernel weight. Fioreze [50] investigated the effect of planting density on monoculture wheat in crop populations, which significantly affected the quality of stalks, leaves, and ears, as well as the above-ground biomass of monoculture wheat. It also affected the full range of yield components. Fang [51] used waxy wheat (Triticum aestivum L.) as a research object to analyze the monoculture density effect and found that the effects of crop density were mainly reflected in thousand-kernel weight, yield, and number of grains per plant. Excluding the thousand-kernel weight, the findings of this paper are similar. The reason for this phenomenon is intraspecific competition among crop populations. Competition intensity (CI) is widely used in crop competition research to quantify the degree of competition in crops under different growth environments [38,39]. In this paper, competition intensity was used to reveal the effect of planting density on individual indicators. The results show that the competition intensity of all indicators, except the thousand-kernel weight, gradually increased with the increase in planting density. Furthermore, planting density affects the frequency distribution of individual indicators in the population. Miller [52] investigated the effects of overall density on final biomass in a short-lived perennial weed. They demonstrated that the average biomass of this plant decreased with increasing planting density, and the biomass frequency distribution was skewed to the left. In this paper, except for thousand-kernel weight, the distributions of the other indicators showed the same behavior with the increase in planting density, which means that an increase in planting density inhibits the growth of individual crops. With an increase in planting density, the available resources such as water, nutrients, and light required for the growth of individual crops are reduced, resulting in restricted growth of individual crops and insufficient realization of their growth potential, thereby producing a negative impact on individual crop yields. When the planting density is low, the space resources allocated to each plant can meet its growth and development needs. When the planting density is excessively high, the growth resources required by the plant cannot be met, resulting in limited individual growth potential and negative effects on the establishment of the population [53]. This viewpoint is also confirmed in this article. In addition, the impact of competition intensity on planting density varies among different indicators because the competition dimensions of different indicators are different [54]. In three-year field trials, the same results were presented. Although an increase in planting density results in higher crop yields within the appropriate density range, excessively high planting densities are not recommended as they lead to strong intraspecific competition and, consequently, reduced grain yields. Moreover, different agronomic and breeding optimization measures are recommended to focus on increasing the yield potential of the crop.

4.4. Planting Density’s Effect on Organ Level

From a single-stem panicle perspective, the planting density had no significant effect on any of the growth indices. This indicates that the density effect of wheat was not reflected at the organ level. Combined with the results of the influence of planting density on the growth statuses of individual plants, it was shown that, under different planting density treatments, the differences in growth indices of the individual plants mainly depended on the number of effective tillers. Under the same treatment, the number of effective tillers per plant changed little. This phenomenon further confirms the uniformity of population and individual plant growth under the drill single-seed seeding method.
The study found that the coefficient of variation of the T1 treatment was generally higher than the rest of the indices, except for the number of ears and the yield in 2016–2017. This result may have stemmed from intraspecific competition. As the planting density of the population increased, the number of ears increased, and the growth resources allocated to single-plant wheat or even single-stem panicle wheat gradually decreased, which led to increased intraspecific competition and growth variation in single-stem panicle wheat, including in the biomass of various organs and yield component indicators. In addition, there was no obvious regularity in the performance of the coefficient of variation of the same indicator at different planting densities during the three years, which may be related to the annual climate. The exact reasons for this need to be explored in the future [55,56].

5. Conclusions

A method for evaluating crop population effects based on organ, individual, and population scales is proposed, which can provide methodological support for the accurate analysis of crop physiological and ecological effects in different agroecological zones. Meanwhile, the ecological adaptation and sustainability of wheat under different environmental conditions can be assessed more comprehensively. The population level can provide information about overall crop growth and yield, the single-plant level can study the competitive relationships and adaptations of individual plants, and the organ level can provide in-depth studies on the development and yield composition of a single-stem panicle. These are important for developing appropriate agricultural management strategies and coping with climate change. Further, the focus of wheat population quality regulation should consider the growth performance and stimulate the growth potential of single plants, which can be achieved through the optimization of agronomic measures and variety improvement. The drill single-seed seeding method creates the same spatial resources for each plant and ensures that each seed undergoes the same physiological and ecological processes, which can provide basic experimental conditions for fine-tuned research on crop physiology and ecology in the future.

Author Contributions

Conceptualization, H.L.; methodology, H.L., Z.L. and Q.D.; software, H.L.; validation, H.L., T.K. and J.G.; formal analysis, H.L. and T.K.; investigation, H.L., T.K. and J.G.; resources, Z.L. and Q.D.; data curation, H.L. and T.K.; writing—original draft preparation, H.L.; writing—review and editing, T.K., Z.L. and Q.D.; visualization, H.L.; supervision, Z.L. All authors have read and agreed to the published version of the manuscript.

Funding

This study was funded by the Key Research and Development Program of Shanxi Province (202102140601005), a Research Project Supported by the Shanxi Scholarship Council of China (2023-092).

Institutional Review Board Statement

Not applicable.

Data Availability Statement

Data are contained within the article.

Acknowledgments

We are thankful for the support from a project funded by the Key Research and Development Program of Shanxi Province and a Research Project Supported by the Shanxi Scholarship Council of China.

Conflicts of Interest

The authors declare no conflicts of interest.

References

  1. Buczek, J.; Migut, D.; Jańczak-Pieniążek, M. Effect of Soil Tillage Practice on Photosynthesis, Grain Yield and Quality of Hybrid Winter Wheat. Agriculture 2021, 11, 479. [Google Scholar] [CrossRef]
  2. Woźniak, A.; Rachoń, L. Effect of Tillage Systems on the Yield and Quality of Winter Wheat Grain and Soil Properties. Agriculture 2020, 10, 405. [Google Scholar] [CrossRef]
  3. Gawęda, D.; Haliniarz, M. Grain Yield and Quality of Winter Wheat Depending on Previous Crop and Tillage System. Agriculture 2021, 11, 133. [Google Scholar] [CrossRef]
  4. Iqbal, M.M.; Khan, I.; Chattha, M.U.; Hassan, M.U.; Iqbal, M.; Farooq, M. Performance of Wheat Cultivars Under Different Tillage and Crop Establishment Methods. Int. J. Plant Prod. 2021, 16, 287–297. [Google Scholar] [CrossRef]
  5. Kashkool, H. Effect of Seed Size and Cultivation Method in the Growth Andyield of Wheat (Triticum Aestivum). Plant Arch. J. 2021, 21, 1262–1265. [Google Scholar] [CrossRef]
  6. Megerssa, S.; Beaugendre, T.; Bekele, N. Influence of Seed Rate and Row Spacing on Seed Multiplication Factor and Yield of Durum Wheat in Ethiopia. Agrosyst. Geosci. Environ. 2023, 6, e20373. [Google Scholar] [CrossRef]
  7. Limochi, K.; Farahvash, F.; Davodi, S.; Fateminik, F. The impact of different planting methods on yield and cluster characters wheat (cultivar of chamran) under different conditions of irrigation in the northern khuzestan climate. Int. J. Adv. Biol. Biomed. Res. 2014, 2, 2038–2044. [Google Scholar]
  8. Hussain, M.; Farooq, S.; Jabran, K.; Ijaz, M.; Sattar, A.; Hassan, W. Wheat sown with narrow spacing results in higher yield and water use efficiency under deficit supplemental irrigation at the vegetative and reproductive stage. Agronomy 2016, 6, 22. [Google Scholar] [CrossRef]
  9. Shao, M.; Sun, L.; Zhao, K.; Xu, X.; Huang, L.; Wang, L.; Yan, L.; Ju, Z. Effects of different line spacing and seedling belt width on yield formation of broad-width fine sowing wheat. Agric. Biotechnol. 2020, 9, 29–33. [Google Scholar] [CrossRef]
  10. Korohou, T.; Okinda, C.; Li, H.; Cao, Y.; Nyalala, I.; Huo, L.; Potcho, M.; Li, X.; Ding, Q. Wheat grain yield estimation based on image morphological properties and wheat biomass. J. Sens. 2020, 2020, 1571936. [Google Scholar] [CrossRef]
  11. Korohou, T.W.; Okinda, C.; Ding, Q.; Li, H.; Torotwa, I. Effect of no-till precise seeding on wheat (Triticum aestivum L.) population quality at the emergence stage. J. Anim. Plant Sci. 2022, 32, 186–198. [Google Scholar] [CrossRef]
  12. Tokatlidis, I.S. Addressing the yield by density interaction is a prerequisite to bridge the yield gap of rain-fed wheat. Ann. Appl. Biol. 2014, 165, 27–42. [Google Scholar] [CrossRef]
  13. Ding, J.; Li, F.; Le, T.; Xu, D.; Zhu, M.; Li, C.; Zhu, X.; Guo, W. Tillage and seeding strategies for wheat optimizing production in harvested rice fields with high soil moisture. Sci. Rep. 2021, 11, 119. [Google Scholar] [CrossRef] [PubMed]
  14. Hasan, A.; Carrasco-G, F.; Lizana, X.; Calderini, D. Low Seed Rate in Square Planting Arrangement Has Neutral or Positive Effect on Grain Yield and Improves Grain Nitrogen and Phosphorus Uptake in Wheat. Field Crops Res. 2022, 288, 108699. [Google Scholar] [CrossRef]
  15. Hemmat, A.; Eskandarib, I. Conservation tillage practices for winter wheat-fallow farming in the temperate continental climate of northwestern Iran. Field Crops Res. 2004, 89, 123–133. [Google Scholar] [CrossRef]
  16. Zhao, L.; Li, M.; Zheng, D.; Gu, C.; Na, Y.; Xie, B. Effects of irrigation methods and rice planting densities on yield and photosynthetic characteristics of matter production in cold area. Trans. Chin. Soc. Agric. Eng. 2015, 31, 159–169. [Google Scholar]
  17. Wang, F.; Wang, X.; Sayre, K. Comparison of conventional, flood irrigated, flat planting with furrow irrigated, raised bed planting for winter wheat in China. Field Crops Res. 2004, 87, 35–42. [Google Scholar]
  18. Zuo, Q.; Kuai, J.; Yang, S.; Cao, S.; Yang, Y.; Wu, L.; Sun, Y.; Zhou, G.; Wu, J. Effects of Nitrogen Fertilizer and Planting Density on Canopy Structure and Population Characteristic of Rapeseed with Direct Seeding Treatment. Acta Agron. Sin. 2015, 41, 758–765. [Google Scholar] [CrossRef]
  19. Chu, G.; Zhou, Q.; Xue, Y.G.; Yan, X.Y.; Liu, L.J.; Zhang, J.H. Effects of cultivation patterns on root morph-physiological traits and aboveground development of japonica hybrid rice cultivar Changyou 5. Acta Agron. Sin. 2014, 40, 1245–1258. [Google Scholar] [CrossRef]
  20. Bhatta, M.; Eskridge, K.M.; Rose, D.J.; Santra, D.K.; Baenziger, P.S.; Regassa, T. Seeding rate, genotype, and top dressed nitrogen effects on yield and agronomic characteristics of winter wheat. Crop Sci. 2017, 57, 951–963. [Google Scholar] [CrossRef]
  21. Sukumaran, S.; Reynolds, M.P.; Lopes, M.S.; Crossa, J. Genome-wide association study for adaptation to agronomic plant density: A component of high yield potential in spring wheat. Crop Sci. 2015, 55, 2609–2619. [Google Scholar] [CrossRef]
  22. Walsh, O.S.; Walsh, W.L. Seeding rate and nitrogen fertilizer rate effect on dryland no-till hard red spring wheat yield and quality. Agrosyst. Geosci. Environ. 2020, 3, e20001. [Google Scholar] [CrossRef]
  23. Twizerimana, A.; Niyigaba, E.; Mugenzi, I.; Ngnadong, W.A.; Li, C.; Hao, T.Q.; Shio, B.J.; Hai, J.B. The combined effect of different sowing methods and seed rates on the quality features and yield of winter wheat. Agriculture 2020, 10, 153. [Google Scholar] [CrossRef]
  24. Fasoula, V.A.; Tokatlidis, I.S. Development of crop cultivars by honeycomb breeding. Agron. Sustain. Dev. 2012, 32, 161–180. [Google Scholar] [CrossRef]
  25. Hitbrunnera, J.; Streit, B.; Liedgens, M. Are seeding densities an opportunity to increase grain yield of winter wheat in a living mulch of white clover? Feld Crops Res. 2007, 102, 163–171. [Google Scholar] [CrossRef]
  26. Wall, S.; Vialet-Chabrand, S.; Davey, P.; Rie, J.V.; Galle, A.; Cockram, J.; Lawson, T. Stomata on the abaxial and adaxial leaf surfaces contribute differently to leaf gas exchange and photosynthesis in wheat. New Phytol. 2022, 235, 1743–1756. [Google Scholar] [CrossRef]
  27. Liang, W.; Zhang, Z.; Wen, X.; Liao, Y.; Liu, Y. Effect of non-structural carbohydrate accumulation in the stem pre-anthesis on grain filling of wheat inferior grain. Field Crops Res. 2017, 211, 66–76. [Google Scholar] [CrossRef]
  28. Zhou, B.; Serret, M.D.; Elazab, A.; Pie, J.B.; Araus, J.L.; Aranjuelo, I.; Sanz-Sáez, Á. Wheat ear carbon assimilation and nitrogen remobilization contribute significantly to grain yield. J. Integr. Plant Biol. 2016, 58, 914–926. [Google Scholar] [CrossRef]
  29. Beaugendre, A.; Mingeot, D.; Visser, M. Complex plant interactions in heterogeneous material require the ecological rethinking of sowing density recommendations for bread wheat. A review. Agron. Sustain. Dev. 2022, 42, 9. [Google Scholar] [CrossRef]
  30. Zhang, J.; Ding, Q.; Ding, W.; Li, Y.; Qiu, W.; Lu, M.; Xue, J.; Tian, Y. Effect of stratified rotary tillage on paddy soil physical properties. J. Nanjing Agric. Univ. 2015, 38, 1016–1022. [Google Scholar] [CrossRef]
  31. Padbhushan, R.; Sinha, A.K.; Kumar, U.; Bhattacharya, P.M.; Poddar, P. Plant Growth-Promoting Bacteria and Crop Residue in Rice–Wheat System Cultivated with Favorable Tillage Influence Crop Productivity, Nutrient Uptake, Soil Quality, and Profitability in the Terai Agro-Ecological Zone of West Bengal, India. Agronomy 2023, 13, 2454. [Google Scholar] [CrossRef]
  32. Chen, X.; Ding, Q.; Błaszkiewicz, Z.; Sun, J.; Sun, Q.; He, R.; Li, Y. Phenotyping for the dynamics of field wheat root system architecture. Sci. Rep. 2017, 7, 37649. [Google Scholar] [CrossRef]
  33. Jiang, M.; Xuan, S.; Muneer, M.A.; Sun, B.; Shi, C.; Liu, F.; Wu, R. Response of dry matter partition and yield components to waterlogging and sunlight shortage in different growth stages of wheat. Nat. Hazards 2021, 110, 1133–1152. [Google Scholar] [CrossRef]
  34. Ozpinar, S.; Ozpinar, A. Tillage effects on soil properties and maize productivity in western Turkey. Arch. Agron. Soil Sci. 2015, 61, 1029–1040. [Google Scholar] [CrossRef]
  35. Zając, T.; Oleksy, A.; Stokłosa, A.; Klimek-Kopyra, A.; Styrc, N.; Mazurek, R.; Budzyński, W. Pure sowings versus mixtures of winter cereal species as an effective option for fodder–grain production in temperate zone. Field Crops Res. 2014, 166, 152–161. [Google Scholar] [CrossRef]
  36. Austin, R.B.J.; Bingham, J.; Blackwell, R.D.; Evans, L.T.; Ford, M.A.; Morgan, C.L.; Taylor, M. Genetic improvements in winter wheat yields since 1900 and associated physiological changes. J. Agric. Sci. 1980, 94, 675–689. [Google Scholar] [CrossRef]
  37. Tolmay, J.P.C. Morphological and Physiological Responses of Spring Wheat (Triticum aestivum L.) to Spatial Arrangements. Doctoral Dissertation, Stellenbosch University, Stellenbosch, South Africa, 2008. Available online: http://hdl.handle.net/10019.1/1358 (accessed on 10 October 2016).
  38. Bonser, S. High reproductive efficiency as an adaptive strategy in competition environment. Funct. Ecol. 2013, 27, 876–885. [Google Scholar] [CrossRef]
  39. Zhai, L.; Xie, R.; Ming, B.; Li, S.; Ma, D. Evaluation and analysis of intraspecific competition in maize: A case study on plant density experiment. J. Integr. Agric. 2018, 17, 2235–2244. [Google Scholar] [CrossRef]
  40. Tsybulya, M. Estimation of Seed Distribution Uniformity over an Area. Die Bodenkult. 2002, 53, 3–8. [Google Scholar]
  41. Aula, L.; Easterly, A.C.; Creech, C.F. Winter Wheat Seeding Decisions for Improved Grain Yield and Yield Components. Agronomy 2022, 12, 3061. [Google Scholar] [CrossRef]
  42. Griepentrog, H.W. Seed Distribution over the Area. In Proceedings of the AgEng. 1998: International Conference on Agricultural Engineering, Oslo, Norway, 24–27 August 1998. [Google Scholar]
  43. Yang, D.; Cai, D.; Luo, Y.; Wang, Z. Optimizing plant density and nitrogen application to manipulate tiller growth and increase grain yield and nitrogen-use efficiency in winter wheat. PeerJ 2019, 7, e6484. [Google Scholar] [CrossRef]
  44. Luo, C.; Zhang, X.; Duan, H.; Mburu, D.M.; Kavagi, L.; Naseer, M.; Dai, R.; Nyende, A.B.; Batool, A.; Xiong, Y. Allometric relationship and yield formation in response to planting density under ridge-furrow plastic mulching in rainfed wheat. Field Crops Res. 2020, 251, 107785. [Google Scholar] [CrossRef]
  45. Heege, H.J. Seeding Methods Performance for Cereals, Rape, and Beans. Am. Soc. Agric. Eng. 1993, 36, 653–661. [Google Scholar] [CrossRef]
  46. Arduini, I.; Masoni, A.; Ercoli, L.; Mariotti, M. Grain yield, and dry matter and nitrogen accumulation and remobilization in durum wheat as affected by variety and seeding rate. Eur. J. Agron. 2006, 25, 309–318. [Google Scholar] [CrossRef]
  47. Carr, P.M.; Horsley, R.D.; Poland, W.W. Tillage and Seeding Rate Effects on Wheat Cultivars: II. Yield Components. Crop Sci. 2003, 43, 210–218. [Google Scholar] [CrossRef]
  48. Dai, Y.; Fan, J.; Liao, Z.; Zhang, C.; Yu, J.; Feng, H.; Zhang, F.; Li, Z. Supplemental irrigation and modified plant density improved photosynthesis, grain yield and water productivity of winter wheat under ridge-furrow mulching. Agric. Water Manag. 2022, 274, 107985. [Google Scholar] [CrossRef]
  49. Chen, M.; Zhu, Y.; Ren, M.; Jiang, L.; He, J.; Dong, R. Does Belt Uniform Sowing Improve Winter Wheat Yield under High Sowing Density? Agronomy 2022, 12, 2936. [Google Scholar] [CrossRef]
  50. Fioreze, S.L.; Rodrigues, J.D. Tillering affected by sowing density and growth regulators in wheat. Semin. Ciênc. Agrár. 2014, 35, 589–604. [Google Scholar] [CrossRef]
  51. Fang, X.M.; She, H.Z.; Wang, C.; Liu, X.B.; Li, Y.S.; Nie, J.; Ruan, R.W.; Wang, T.; Yi, Z.L. Effects of Fertilizer Application Rate and Planting Density on Photosynthetic Characteristics, Yield and Yield Components in Waxy Wheat. Cereal Res. Commun. 2018, 46, 169–179. [Google Scholar] [CrossRef]
  52. Miller, T.E.; Winn, A.A.; Schemske, D.W. The effects of density and spatial distribution on selection for emergence time in Prunella vulgaris (Lamiaceae). Am. J. Bot. 1994, 81, 1–6. [Google Scholar] [CrossRef]
  53. Maddonni, G.A.; Otegui, M.E. Intra-specific competition in maize: Contribution of extreme plant hierarchies to grain yield, grain yield components and kernel composition. Field Crops Res. 2006, 97, 155–166. [Google Scholar] [CrossRef]
  54. Zhai, L.; Li, H.; Song, S.; Zhai, L.; Ming, B.; Li, S.; Xie, R.; Jia, X.; Zhang, L. Intra-specific competition affects the density tolerance and grain yield of maize hybrids. Agron. J. 2021, 113, 224–235. [Google Scholar] [CrossRef]
  55. Liu, K.; Zhang, X.; Wang, Q.; Wang, C.; Li, A. Effect of plant density on microclimate in canopy of maize (Zea mays L.). Acta Plytoecologica Sin. 2000, 24, 489–493. [Google Scholar]
  56. Goher, R.; Akmal, M. Wheat cultivars exposed to high temperature at onset of an thesis for yield and yield traits analysis. Agron. Res. 2021, 19, 1467–1486. [Google Scholar] [CrossRef]
Figure 1. Overview of the study area. (a) Location of Jiangsu province in China; (b) location of Nanjing city in Jiangsu province; (c) location of the study area in Luhe, Nanjing City.
Agriculture 14 00176 g001
Figure 2. Monthly mean temperature and rainfall during three years. Jan: January; Feb: February; Mar: March; Apr: April; J: June; Nov: November; Dec: December.
Agriculture 14 00176 g002
Figure 3. Indicator decomposition of population density effects from three different perspectives. Abbreviation: TNE: Total number of ears; TNG: Total number of grains; TGY: Total grain yield; TLW: Total leaf weight; TSW: Total stem weight; TEW: Total ear weight; TAB: Total aboveground biomass; NEP: Number of ears per plant; NGP: Number of grains per plant; GYP: Grain yield per plant; TKM: Thousand-kernel mass; LWP: Leaf weight per plant; SWP: Stem weight per plant; EWP: Ear weight per plant; ABP: Aboveground biomass per plant; NG: Number of grains per-stem panicle; GY: Grain yield per-stem panicle; LW: Leaf weight per-stem panicle; SW: Stem weight per-stem panicle; EW: Ear weight per-stem panicle; AB: Aboveground biomass per-stem panicle.
Agriculture 14 00176 g003
Figure 4. Effects of wheat planting density on the competition index (CI) over three years.
Agriculture 14 00176 g004aAgriculture 14 00176 g004b
Figure 5. Effects of planting density on the frequency distribution of single plant indices. In each frame: Diagram—Blue curve: T1; Red curve: T2; Green curve: T3.
Agriculture 14 00176 g005aAgriculture 14 00176 g005b
Figure 6. Effects of planting densities on the coefficient of variation per stem panicle index.
Agriculture 14 00176 g006aAgriculture 14 00176 g006b
Table 1. Basic physical properties of the 0–30 cm soil layer.
Soil Depth/cmSoil Bulk Density/(g·cm−3)Moisture Content/%Soil Porosity/%
0–51.2436.3253.21
5–101.2734.4752.08
10–151.3432.8249.43
15–201.5525.4341.51
20–251.5624.9741.13
25–301.5823.8640.38
Table 2. Effects of different planting densities on the yield and yield components of the winter wheat population.
YearTreatmentTNE (104·hm−2)TNG (104·hm−2)TKM (g)TGY (kg·hm−2)
2016–2017T1500.0 ± 43.6 a22,566.7 ± 2023.3 ab26.5 ± 1.8 a5972.9 ± 302.0 a
T2508.3 ± 47.9 a24,352.8 ± 1407.5 a23.8 ± 1.1 a5787.4 ± 359.3 a
T3400.0 ± 46.4 b19,602.8 ± 1922.5 b23.9 ± 1.6 a4652.5 ± 201.4 b
2017–2018T1468.5 ± 28.5 a16,274.1 ± 280.8 ab37.7 ± 0.6 a6136.9 ± 108.7 a
T2435.2 ± 21.0 a16,694.4 ± 819.4 a36.1 ± 1.9 a6016.4 ± 112.6 a
T3361.1 ± 24.2 b14,316.7 ± 1343.1 b37.2 ± 1.7 a5301.4 ± 284.9 b
2018–2019T1472.2 ± 11.1 a17,588.9 ± 640.6 a35.7 ± 0.3 a6271.8 ± 180.8 a
T2459.3 ± 13.2 a17,772.2 ± 300.4 a35.9 ± 0.5 a6387.6 ± 104.7 a
T3400.0 ± 5.6 b15,477.8 ± 428.4 b36.0 ± 0.2 a5578.1 ± 127.8 b
Year*********
Density****ns***
Year × densityns*nsns
Values followed by different letters within a category of treatments were statistically dissimilar according to the least significant difference (LSD) test (p < 0.05); this is the same for the tables below. ns: Non-significant at p > 0.05; * Significant at 0.05 probability level; ** Significant at 0.01 probability level; *** Significant at 0.001 probability level.
Table 3. Effects of different planting densities on biomass indices of the winter wheat population.
YearTreatmentTLW
(kg·hm−2)
TSW
(kg·hm−2)
TEW
(kg·hm−2)
TAB
(kg·hm−2)
2016–2017T12199.3 ± 462.5 a2577.5 ± 232.5 a7861.5 ± 715.5 a12,638.3 ± 1156.4 a
T22159.9 ± 319.4 a2666.2 ± 316.4 a8013.3 ± 639.4 a12,839.4 ± 1150.5 a
T31779.8 ± 251.0 a2159.2 ± 85.6 b6661.8 ± 365.1 b10,600.9 ± 1254.6 a
2017–2018T12605.7 ± 505.9 a3193.6 ± 133.6 a9015.4 ± 526.5 a14,814.7 ± 952.9 a
T22661.5 ± 531.0 a2944.3 ± 148.0 ab8292.9 ± 501.8 ab13,898.9 ± 558.6 ab
T32070.2 ± 349.9 a2703.2 ± 232.7 b7630.7 ± 676.5 b12,404.1 ± 1236.4 b
2018–2019T12330.7 ± 237.4 a3266.2 ± 154.7 a9098.2 ± 317.8 a14,695.1 ± 809.0 a
T22206.5 ± 200.4 a3402.9 ± 81.5 a8786.8 ± 255.3 a14,396.3 ± 550.9 a
T31908.3 ± 107.9 a2836.0 ± 94.3 b7645.8 ± 354.6 b12,390.0 ± 508.7 b
Yearns*********
Densityns********
Year × Densitynsnsnsns
Values followed by different letters within a category of treatments were statistically dissimilar according to the least significant difference (LSD) test (p < 0.05); this is the same for the tables below. ns: Non-significant at p > 0.05; ** Significant at 0.01 probability level; *** Significant at 0.001 probability level.
Table 4. Effects of different planting densities on the yield and yield components of individual plants.
YearTreatmentsNEPNGPTKM (g)GYP (g)
2016–2017T12.470 ± 0.170 c111.841 ± 4.790 c26.690 ± 2.718 a2.963 ± 0.324 c
T24.243 ± 0.133 b202.967 ± 8.796 b23.593 ± 1.055 a4.834 ± 0.274 b
T34.987 ± 0.472 a245.862 ± 18.688 a23.807 ± 0.267 a5.831 ± 0.488 a
2017–2018T12.348 ± 0.164 c81.492 ± 3.321 c37.713 ± 0.565 a3.074 ± 0.166 c
T23.312 ± 0.064 b127.061 ± 2.191 b36.096 ± 1.873 a4.588 ± 0.300 b
T34.283 ± 0.301 a167.918 ± 11.649 a37.173 ± 2.730 a6.229 ± 0.420 a
2018–2019T12.657 ± 0.076 c99.000 ± 4.719 c35.720 ± 0.232 a3.530 ± 0.152 c
T24.067 ± 0.103 b156.820 ± 2.282 b35.952 ± 0.543 a5.635 ± 0.161 b
T34.914 ± 0.209 a190.019 ± 2.796 a36.090 ± 0.163 a6.849 ± 0.117 a
Year************
Density******ns***
Year × Densityns*nsns
Values followed by different letters within a category of treatments were statistically dissimilar according to the least significant difference (LSD) test (p < 0.05); this is the same for the tables below. ns: Non-significant at p > 0.05; * Significant at 0.05 probability level; *** Significant at 0.001 probability level.
Table 5. Effects of different planting density on the aboveground biomass of individual plant.
YearTreatmentsLWP (g)SWP (g)EWP (g)ABP (g)
2016–2017T11.087 ± 0.354 b1.278 ± 0.036 c3.901 ± 0.294 c6.266 ± 0.171 c
T21.796 ± 0.331 a2.230 ± 0.164 b6.665 ± 0.276 b10.691 ± 0.287 b
T32.391 ± 0.327 a2.701 ± 0.292 a8.342 ± 0.586 a13.434 ± 1.011 a
2017–2018T11.323 ± 0.548 b1.600 ± 0.094 c4.514 ± 0.182 c7.437 ± 0.57 c
T22.012 ± 0.279 ab2.251 ± 0.263 b6.320 ± 0.312 b10.582 ± 0.298 b
T32.424 ± 0.338 a3.173 ± 0.239 a8.949 ± 0.528 a14.546 ± 1.065 a
2018–2019T11.309 ± 0.293 b1.837 ± 0.143 c5.121 ± 0.158 c8.267 ± 0.034 c
T21.944 ± 0.240 a3.002 ± 0.072 b7.757 ± 0.136 b12.703 ± 0.174 b
T32.341 ± 0.344 a3.484 ± 0.171 a9.389 ± 0.213 a15.213 ± 0.353 a
Yearns*********
Density************
Year × Densitynsnsnsns
Values followed by different letters within a category of treatments were statistically dissimilar according to the least significant difference (LSD) test (p < 0.05); this is the same for the tables below. ns: Non-significant at p > 0.05; *** Significant at 0.001 probability level.
Table 6. Effects of planting densities at the stem panicle level on wheat.
YearTreatmentNKGY (g)LW (g)SW (g)EW (g)AB (g)
2016–2017T145.489 ± 4.857 a1.209 ± 0.214 a0.436 ± 0.133 a0.520 ± 0.055 a1.589 ± 0.248 a2.545 ± 0.244 a
T248.093 ± 1.915 a1.145 ± 0.031 a0.427 ± 0.099 a0.528 ± 0.024 a1.581 ± 0.116 a2.536 ± 0.161 a
T349.284 ± 5.555 a1.172 ± 0.093 a0.484 ± 0.030 a0.541 ± 0.022 a1.677 ± 0.102 a2.702 ± 0.102 a
2017–2018T134.749 ± 3.199 a1.310 ± 0.045 a0.554 ± 0.203 a0.682 ± 0.007 a1.925 ± 0.060 a3.160 ± 0.146 a
T238.363 ± 0.563 a1.384 ± 0.065 a0.609 ± 0.095 a0.679 ± 0.068 a1.908 ± 0.073 a3.195 ± 0.066 a
T339.225 ± 1.659 a1.455 ± 0.054 a0.565 ± 0.064 a0.741 ± 0.081 a2.092 ± 0.106 a3.398 ± 0.269 a
2018–2019T137.386 ± 3.747 a1.333 ± 0.058 a0.495 ± 0.049 a0.695 ± 0.057 a1.934 ± 0.060 a3.124 ± 0.133 a
T239.494 ± 1.579 a1.419 ± 0.043 a0.490 ± 0.022 a0.756 ± 0.043 a1.953 ± 0.035 a3.199 ± 0.056 a
T341.595 ± 1.513 a1.499 ± 0.066 a0.512 ± 0.059 a0.763 ± 0.054 a2.055 ± 0.082 a3.330 ± 0.164 a
Values followed by different letters within a category of treatments were statistically dissimilar according to the least significant difference (LSD) test (p < 0.05).
Disclaimer/Publisher’s Note: The statements, opinions and data contained in all publications are solely those of the individual author(s) and contributor(s) and not of MDPI and/or the editor(s). MDPI and/or the editor(s) disclaim responsibility for any injury to people or property resulting from any ideas, methods, instructions or products referred to in the content.

