Article

The Influence of Surrounding Arable Fields on the Species Diversity and Composition of Isolated Mountain Mesic Grassland Patches

by
Daniel Pruchniewicz
1,*,
Ludwik Żołnierz
1 and
Agnieszka Dradrach
2
1
Department of Botany and Plant Ecology, Wrocław University of Environmental and Life Sciences, pl. Grunwaldzki 24a, 50-363 Wrocław, Poland
2
Institute of Agroecology and Plant Production, Wrocław University of Environmental and Life Sciences, pl. Grunwaldzki 24a, 50-363 Wrocław, Poland
*
Author to whom correspondence should be addressed.
Agriculture 2024, 14(2), 180; https://doi.org/10.3390/agriculture14020180
Submission received: 31 December 2023 / Revised: 22 January 2024 / Accepted: 23 January 2024 / Published: 24 January 2024
(This article belongs to the Section Ecosystem, Environment and Climate Change in Agriculture)

Abstract

:
This study aimed to determine the impact of arable fields on the diversity and species composition of isolated meadow patches of the order Arrhenatheretalia. The study was conducted in the Sowie Mountains and the adjacent hills (SW Poland). The species composition of the vegetation was analyzed along transects designated from the edge up to 33 m into the meadow patches. The species composition varied significantly in zones directly affected by arable fields, proving their strong negative impact on the vegetation of the mesic grasslands examined. The highest values of the diversity index were recorded 9 m away from the edge, while the lowest values were found in the direct influence zone of arable fields—2 m from the edge. In the case of apophytes, synanthropic species of local origin, the lowest values were recorded within 1 m and the highest values were recorded within 9 m. A significant change in the percentage of graminoids and dicotyledonous herbs was found between 9 m and 33 m from the edge. The study found no significant differences in habitat parameters measured with ecological indicators. Species of the Artemisietea vulgaris class effectively penetrate deep into grassland patches and can visibly degrade their vegetation.

1. Introduction

Fragmentation of plant communities is one of the main causes of the biodiversity crisis [1]. It leads to a reduction in habitat areas and changes in soil properties [2] and is also responsible for the creation of isolated sub-populations [3]. In isolated patches, the colonization rate of new species is lower, and the extinction rate is higher, which consequently leads to a decline in biodiversity [4]. In recent decades, habitat fragmentation has been increasing as a result of changes in land usage such as shifting cultivation or intensification of agriculture, the introduction of forest plantations, or agricultural expansion [5]. This issue also applies to semi-natural mountain grass communities, which are often characterized by high species diversity [6]. The mesic Arrhenatheretalia R. Tx. 1931 type meadows represent very common Central European grassland communities. They are also a very important landscape component both in lowland as well as in mountain areas. Tall oat grass (Arrhenatherum elatius) is the most characteristic species of this meadow type. This grass species has a suboceanic–submeridional distribution and this is the same for the range of Arrhenatheretalia-type meadows. These meadows occur in mesic habitats from damp up to slightly dry soils, with a wide pH range from slightly acidic to alkaline. They are never flooded. In the Central European mountains, they occur in the submontane belt as the secondary communities replacing natural beech or hornbeam forests. Usually, they are moderately fertilized or manured, giving one to three cuts per year [7,8,9]. Those cut twice a year are usually the most species rich. More frequent cutting combined with higher fertilization and periodic grazing may increase yields but lead to a decrease in species richness [9]. In the studied area, some of these meadows have remained out of use in recent years and some are used less or more intensively.
Mesic Arrhenatheretalia-type meadows may be seen as biodiversity refugia, especially in the areas of intensely anthropogenically transformed landscapes. Currently, one can see both intensively managed as well as abandoned mountain meadows. In both cases, the species richness and diversity are spectacularly decreasing. Therefore, according to Leuschner and Ellenberg [9], generally, one can say that the ‘typical’ Arrhenatheretum meadows have been disappearing in Europe within recent decades. Such a situation urgently necessitates the protection of the still-existing species-rich mountain meadows.
In transformed landscapes, including mountain areas and meadows, patches of different sizes are adjacent to forests or arable areas. In both cases, one can observe various edge effects related to the competition and overlapping of vegetation and plant species ranges. According to Cadenasso et al. [10], ecological edges are borders or transition zones between two adjacent landscape patches or land cover types. The transition zone (ecotone) connecting the edge area and core area has a different ecological character as compared to both adjacent patches [10]. In these zones, abiotic factors, species distribution, and interactions may change [11]. In this study, we focused on the edge effects determining the plant species composition and richness in the ecotones between fragmented meadow patches and arable lands.
Cultivating crops in areas bordering grasslands and the resulting increased presence of nutrients, pesticides, and crop-related species [12,13] constitute one of the most serious threats to them. Agricultural fields may also be a reservoir of foreign seeds, which invade the surrounding habitats and displace native species, ultimately leading to a decline in habitat diversity [13]. This process affects specialized species at risk of extinction due to changes in habitat parameters [14]. Taking into account the intensification of agriculture, which is progressing at an unprecedented pace [13,15], this process constitutes one of the main threats to the diversity of grass phytocoenoses.
Despite many studies on the impact of habitat fragmentation on species diversity, this topic is still not sufficiently understood [16]. In our study, it was assumed that, in the contact zone between a meadow patch and an intensively cultivated arable field, there would be visible habitat fertilization due to the penetration of fertilizers. Consequently, and stimulated by this, synanthropic (segetal) species would enter. This will lead to both an increase in the species number and the degradation of the grassland plant community at the same time. The goal of our study was to determine the intensity and scope of this phenomenon and the degree of meadow vegetation transformation. It should fill the gap in the knowledge concerning phenomena in the contact zones of isolated grassland patches with surrounding arable fields. This is a very important issue in the context of the currently ongoing process of the fragmentation of semi-natural communities. They play a very important role in biodiversity refugia in still expanding agriculturally transformed areas. Such a phenomenon is also typical for the mountain area where we carried out our survey.

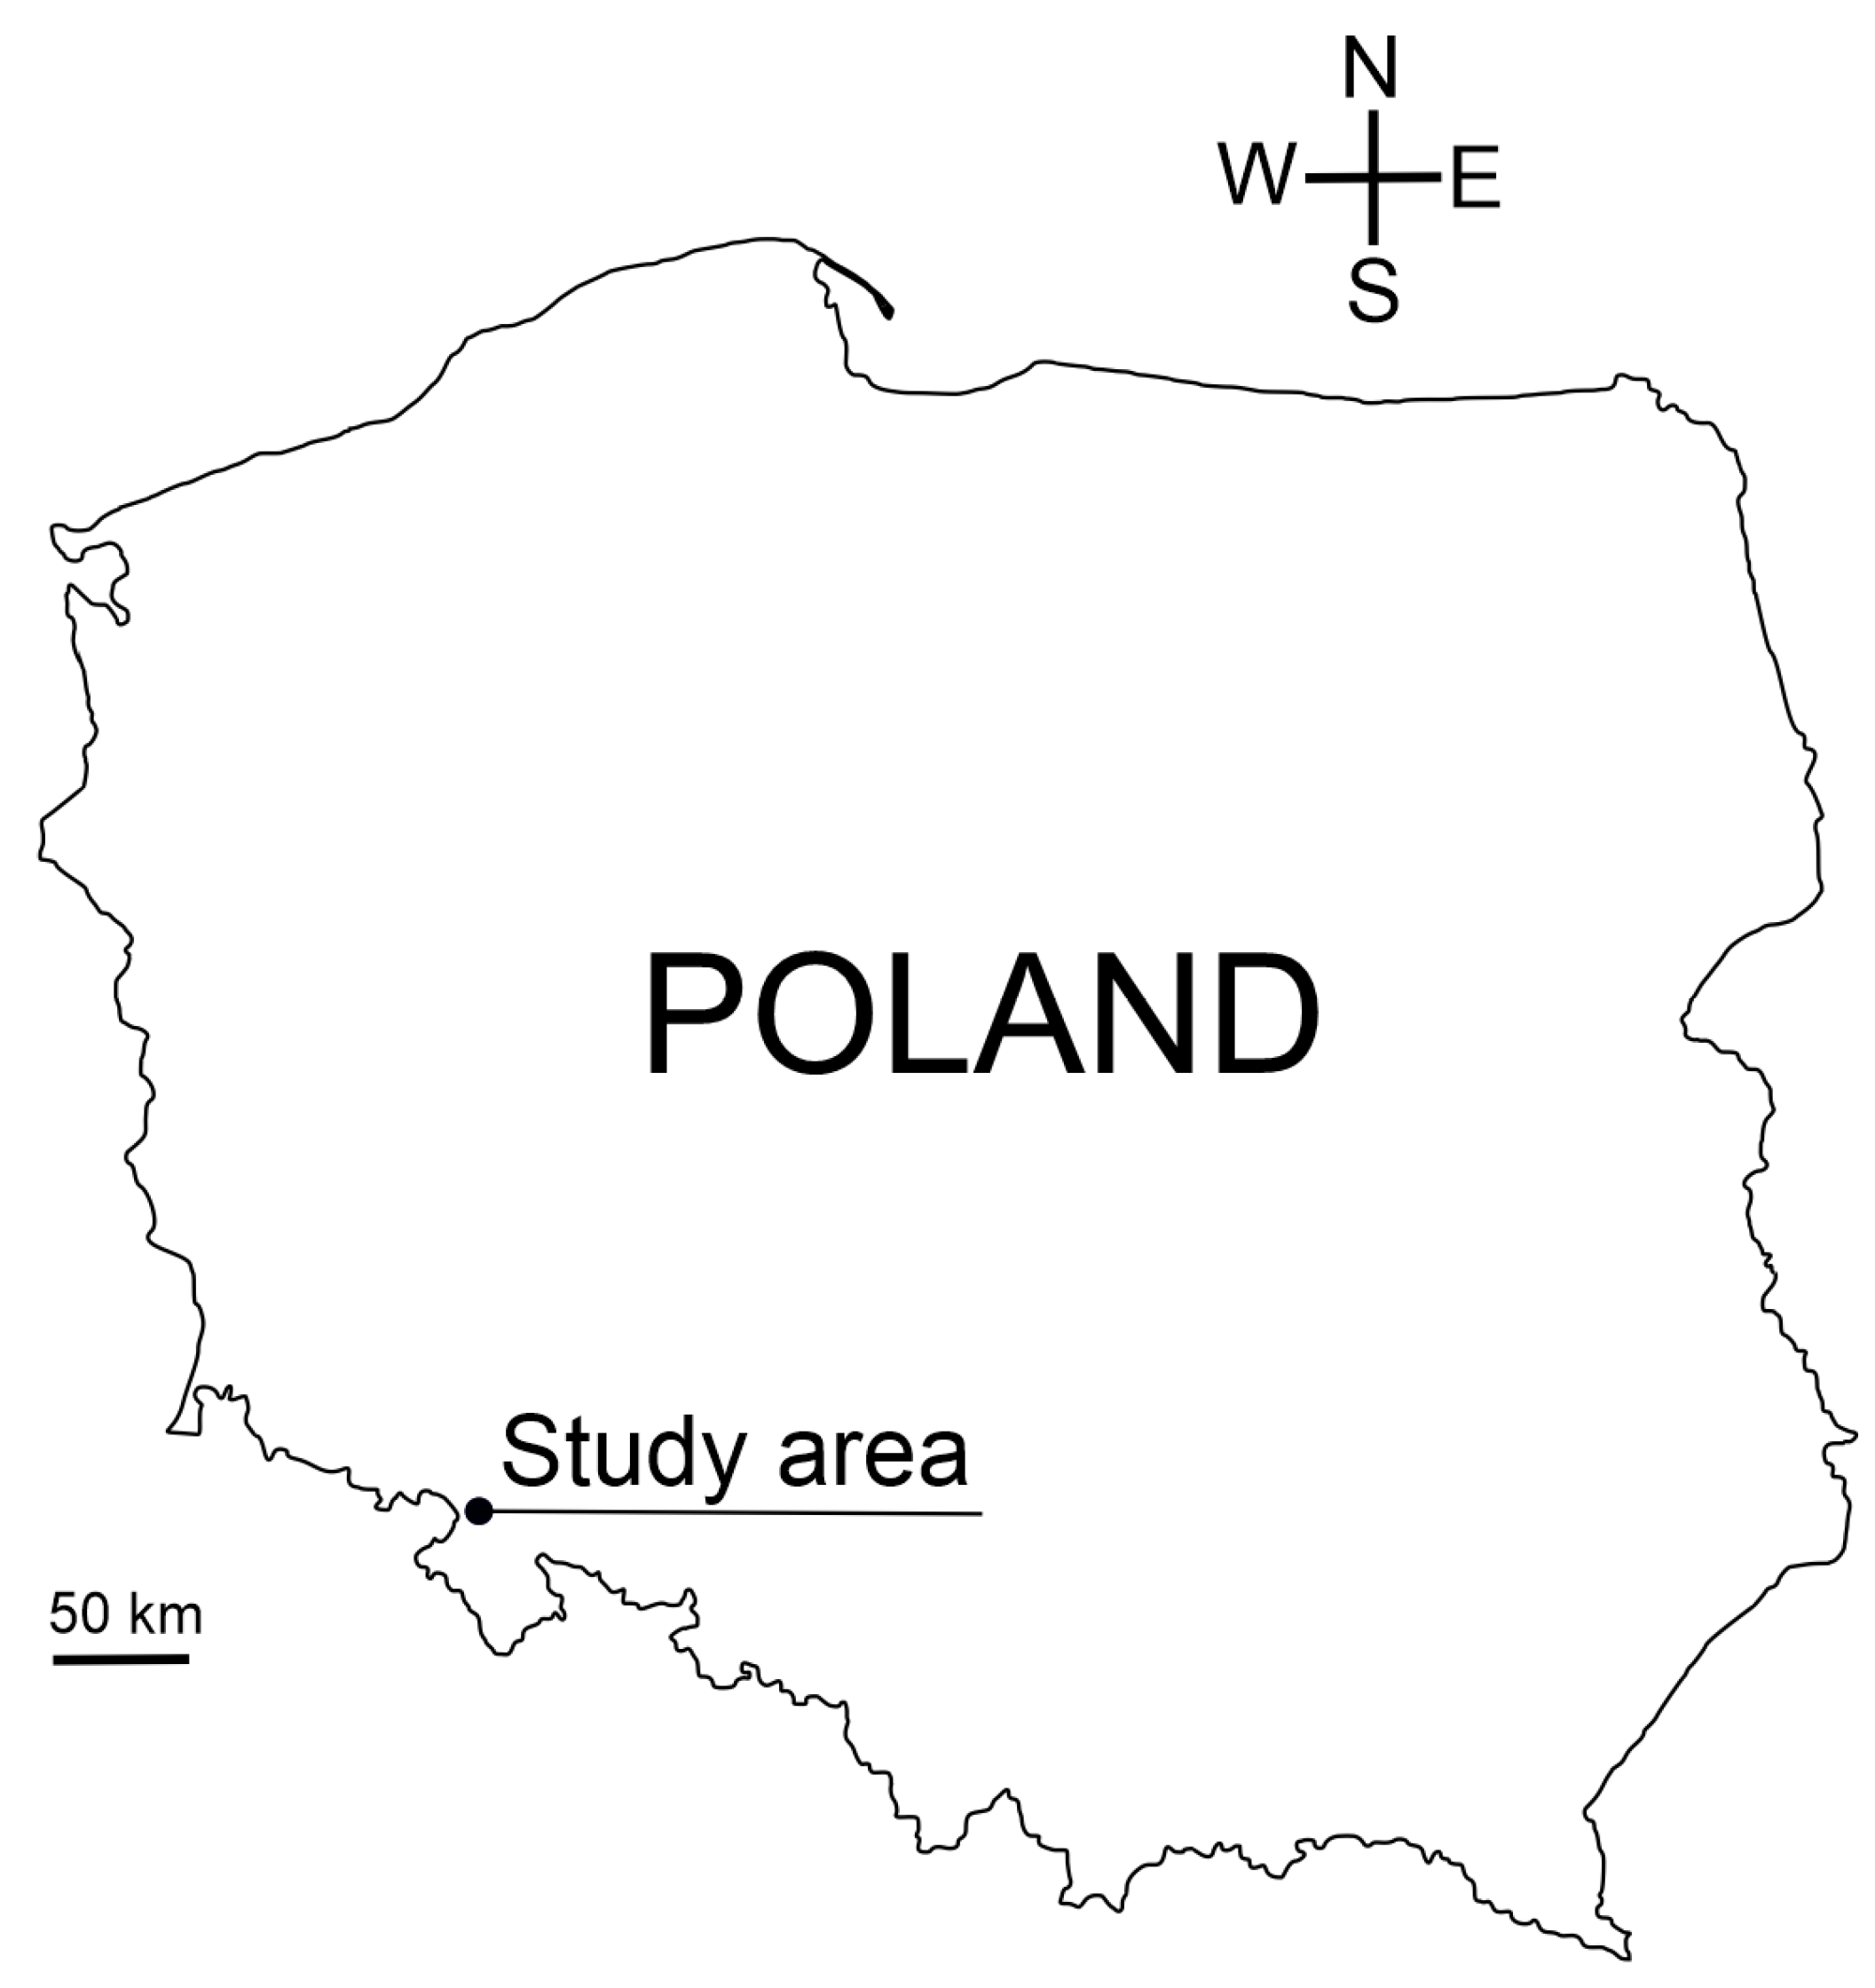
2. Materials and Methods

The study was conducted on four patches of mesic meadows, representing the Arrhenatheretalia order, adjacent to arable fields. During the study, triticale and wheat were grown in the fields. The research sites were located in the Sowie Mountains (SW Poland) at the range of altitudes of 428 to 623 m a.s.l. (Figure 1).
At each site, 5 transects of about the length of 33 m were randomly designated and ran perpendicularly from the edge of the arable field to the middle of the meadow. Relevés in squares with 1 m sides were taken along the transects at the following distances: 0–1 m (marked as 1 m in the later parts of the article), 1–2 m (marked as 2 m), 4–5 m (marked as 5 m), 8–9 m (marked as 9 m), 16–17 m (marked as 17 m), and 32–33 m (marked as 33 m) from the edge of the meadow. The meadows selected for the study were relatively small, so the extension of transects was abandoned due to the possible influence from the opposite side of the sites. A total of 120 phytosociological relevés were taken. Species richness parameters (number of species S, Shannon–Wiener diversity index H’, and evenness index J’) were calculated using MVSP software v 3.2 [17]. The ecological indicator values for light (L), humidity (F), acidity (R), and trophy were adopted from those of Ellenberg et al. [18]. The calculations used averages weighted by species cover in a given relevé. The list of synanthropic species and other analyzed botanical features of the species was prepared using the BIOLFLOR database [19]. The division of species into syntaxonomic groups was adopted according to Matuszkiewicz [8]. The share of a specific species cover in the total cover of all species in a plot was assumed to be the measure of its relative abundance in the vegetation.
The STATISTICA package was used for statistical analyses [20]. Data compliance with normal distribution was analyzed using the Shapiro–Wilk W test. Homogeneity of variances was determined using Levene’s test. Variables deviating from normality were found using the Kruskal–Wallis test. Variables with a normal distribution and homogeneous variances were determined using the one-way analysis of variance with post hoc testing of the significance of differences using Tukey’s HSD test. Canoco software v 5 was used for the multivariate analyses [21]. Detrended correspondence analysis (DCA) determined the gradient length represented by the first canonical axis. On this basis, unimodal techniques were applied in further calculations—canonical correspondence analysis (CCA) along with testing the significance of variables using the Monte Carlo permutation test with stepwise selection of variables [21,22].

3. Results

3.1. The Influence of Edge Effect on Habitat Properties Expressed through Ellenberg Ecological Indicators

No direct tests of soil properties and micro-climatic factors were conducted. The habitat properties followed indirectly from comparing the calculated Ellenberg indicators. The calculations did not show significant differences in the mean ecological indicators for the light index L (H = 5.125, p = 0.401), humidity F (H = 1.762, p = 0.881), trophy N (H = 5.578, p = 0.349), or soil acidity R (H = 3.633, p = 0.603) on a transect distance from the borderline with arable fields. Detailed values of the tested parameters are listed in Table 1.

3.2. The Intensity and Extent of Meadow Vegetation Transformation under the Influence of Agricultural Crops

Sixty-nine species belonging to 26 botanical families were found in the studied plots. The calculations showed statistically significant differences in the mean values for the diversity index H’ (F = 5.344, p = 0.0002), the number of species S (H = 22.790, p = 0.0004), the percentage of apophytes (H = 11.325; p = 0.453) and the share of dicotyledonous species (H = 11.224; p = 0.471) and graminoids in the studied transect (H = 11.227; p = 0.471). In the case of the Shannon–Wiener species diversity index (H’), the highest values were recorded in the range of 9 m, and the lowest values were recorded in the direct edge effect zone—2 m. In the case of apophytes, synanthropic species of local origin, the lowest values were recorded in the range of 1 m, and the highest values were recorded in 9 m. No significant differences in the number of synanthropic and non-synanthropic species were recorded. Analyzing the functional groups showed a significant change in the percentage of graminoids and dicotyledonous herbs at a distance of 9 and 33 m (Table 2).
Multivariate analyses were used to determine the species composition on transects laid from the edge to 33 m into patches of mesic meadows. The length of the environmental gradient represented by the first DCA axis was 5.5 standard deviations, which allowed us to use unimodal techniques (canonical correspondence analysis—CCA) in further calculations. The eigenvalues for the first two canonical CCA axes were 0.1949 and 0.6710, respectively, explaining the fitted variation cumulative of 1.92% and 8.54%, respectively. The Monte Carlo permutation test with stepwise selection of variables showed significant differences in species composition patterns for the distances (pseudo-F: 2.30; p = 0.002).
In terms of the frequency of occurrence and total cover, species accompanying crops as weeds of the class Stellarietea mediae and nitrophilous species of the class Artemisietea vulgaris dominate within the strip covering the first two meters from the edge of the meadow patches, while meadow species only occur there sporadically and with a small quantitative share. Typical vegetation of mesic meadows dominates from the fifth meter onward. However, throughout the entire range of the studied transects, it is degraded by synanthropic species, mainly belonging to the Artemisietea vulgaris class, whose share in the total cover does not fall below around 20%. Only sporadic seedlings of tree and shrub species (Populus tremula and Crataegus monogyna) were present, indicating the direction of further succession (Figure 2). The analysis of changes in the percentage of species characteristic of individual phytosociological classes on the distance transect showed a significant impact of the edge effect only for the Molinio-Arrhenatheretea class, for which the lowest values were recorded at 1 m and the highest lowest values were recorded at 33 m from the border with agricultural fields (H = 12.548; p = 0.028). No significant differences were found for the classes Stellarietea mediae (H = 10.528; p = 0.062) and Artemisietea vulgaris (H = 5.546; p = 0.353) or the group “other classes” (H = 2.855; p = 0.722). The calculation results are summarized in Table 3.

4. Discussion

In our study, we assumed that in the contact area between meadow patches and intensively cultivated arable fields, there would be a visible habitat fertilization effect due to the penetration of fertilizers and the consequent expansion of synanthropic species. Our intention was to determine the intensity and range of this phenomenon and the degree of vegetation transformation in patches of mesic meadows subject to fragmentation. We defined this fragmentation as the occurrence of discontinuities in dominant or native land cover and habitat features [23]. In our study, this discontinuity was manifested by the occurrence of visible changes in species composition, diversity, and percentage shares of apophytes, graminoids, and dicotyledonous herbs in a given study area.
In the case of the Shannon–Wiener species diversity indices, the highest values were recorded at a distance of 9 m and the lowest were recorded in the direct edge effect zone—2 m. The values of the Shannon–Wiener diversity index correspond to the results obtained for species richness, for which the highest values were found in the range of 9 m and 33 m. Many authors suggest that species richness may be higher in transition zones [24]. In the study by Winsa et al. [25], the authors recorded an increased diversity of species specialists for grasslands in edge zones, with this decreasing as the distance from the edge increased. Zschokke et al. [26] recorded more grass species and fewer butterflies in patches undergoing fragmentation as compared to controls. The authors did not note any differences in the species richness of herbs, ants, grasshoppers, or gastropods [26]. Our observations are consistent with the results of Schöpke et al. [27], who drew attention to greater species richness and diversity in the middle of the meadow compared to the edges bordering crop fields. The decrease in species richness in bordering zones may be related to habitat fluctuations leading to the creation of habitats unfriendly to plant growth [28] or the inflow of nutrients or pesticides [12] from crop fields, which was confirmed in the research of Zechmeister et al. [29]. These studies show that the species richness of meadows is negatively correlated with the intensity of fertilization and mowing [29].
The literature indicates that the species richness at the edges of arable fields or other agro-ecosystems may be shaped by the surrounding landscape [13], while species richness and the occurrence of generalist species may increase with a decrease in fragment size [30]. In the case of our research, these hypotheses were not verified due to the relatively homogeneous environment and similar size of the patches examined. The scope of the edge effect left its mark on the species composition and the percentage of grasses and herbs. While species accompanying crops as weeds (Stellarietea mediae class) penetrate meadow vegetation only in the outermost parts of the patches, nitrophilous species of the Artemisietea vulgaris class occur with high frequency and with a visible quantitative share also in the parts of meadows furthest from their edges. This may also be due to the abundant production of highly mobile seeds common to these species and their high competitive capabilities, according to Grime [31]. It is noteworthy that in the case of apophytes, i.e., synanthropic species of local origin, the lowest percentages were recorded at 1 m, with the highest recorded at 9 m. In the functional groups, a significant change in the percentage of graminoids was found at a distance of 9 m (lowest values) and 33 m (maximum values). The lack of differences and clear trends in our research concur with the thesis of Hylander [32], according to whom the spatial range of edge effects is difficult to measure due to the exponential nature of these interactions. Baur et al. [3] indicate that meadow fragmentation negatively impacts many interactions between species, genetic diversity, and plant populations. The total land cover of species in fragmented sites may be 22% lower than controls [33]. Wu et al. [34] also drew attention to meadow productivity, which is higher on the edges than in the central parts.
Research on the vegetation in the ecotone zones emphasizes the significant relationship between the edge effect and soil properties. Burst et al. [35] point out the strong influence of these interactions on the properties of meadow soils. Excluding edge zones from use may lead to a reduction in their fertility, which may also affect the species composition of plant communities. Research conducted by Buisson et al. [36] showed an increase in soil pH and phosphorus concentration in the field boundary zone. Schmidt et al. [37] also point out that, in their study, soil moisture in the transition zones was lower in the forest than in arable areas. Our analysis of the Ellenberg ecological indicators did not show differences in the values of the habitat parameters, which does not rule out the existence of differences that could appear in detailed chemical or micro-climatic studies. In our research, all of the measured Ellenberg ecological indicators for the light factor, humidity, trophy, and acidity of soils showed similar values along the studied transects.

5. Conclusions

At the beginning of our study, we assumed that in the contact area between meadow patches and intensively cultivated arable fields, a visible habitat fertilization effect would appear due to the penetration of fertilizers and the consequent expansion of synanthropic species. This penetration is visible in the stripe adjacent to crop fields, with it especially having an effect on species composition and the ‘dilution’ of typical meadow species cover. However, changes in species diversity and richness indices along the studied transects still remain unclear. Moreover, an analysis of changes in the Ellenberg ecological indicators showed no significant differences. This also concerns the nitrogen indicator values, which means that the input of nutrients did not push the plant species composition towards an increase in nitrophilous species share so far. However, as nitrophilous synanthropic species were found even in the most distant positions along the transects, it may be possible that the process is ongoing, and one can expect an increase in synanthropization in the future.

Author Contributions

Conceptualization, D.P. and L.Ż.; methodology, D.P. and L.Ż.; field data collection D.P. and L.Ż.; validation, D.P., L.Ż. and A.D.; formal analysis, D.P., L.Ż. and A.D. investigation, D.P. and L.Ż.; writing—original draft preparation, D.P., L.Ż. and A.D.; writing—review and editing, D.P., L.Ż. and A.D.; visualization, D.P., L.Ż. and A.D.; supervision, D.P, L.Ż. and A.D. All authors have read and agreed to the published version of the manuscript.

Funding

The APC is financed by Wrocław University of Environmental and Life Sciences.

Institutional Review Board Statement

Not applicable.

Data Availability Statement

Data are contained within the article.

Conflicts of Interest

The authors declare no conflicts of interest.

Abbreviations

The list of the species names and their respective abbreviations.
Species NameAbbreviation
Achillea millefolium L. ach.mil
Aegopodium podagraria L. aeg.pod
Agrostis capillaris L. agr.cap
Alchemilla sp. alch.sp
Alopecurus pratensis L. alo.pra
Anthriscus sylvestris (L.) Hoffm. ant.syl
Anthoxanthum odoratum L. ant.odo
Arrhenatherum elatius (L.) P. Beauv. ex J. Presl & C. Presl arr.ela
Briza media L. bri.med
Calamagrostis epigejos (L.) Roth cal.epi
Campanula patula L. cam.pat
Centaurea jacea L. cen.jac
Cerastium arvense L. s. s. cer.arv
Chamomilla suaveolens (Pursh) Rydb. cha.sua
Chaerophyllum aromaticum L. cha.aro
Cirsium arvense (L.) Scop. cir.arv
Convolvulus arvensis L. con.arv
Crataegus monogyna Jacq. cra.mon
Dactylis glomerata L. dac.glo
Deschampsia caespitosa (L.) P. Beauv. des.cae
Equisetum sylvaticum L. equ.syl
Erodium cicutarium (L.) L’Hér. ero.cic
Festuca rubra L. s. s. fes.rub
Fragaria vesca L. fra.ves
Galeopsis speciosa Mill. ga.spec
Galium mollugo L. gal.mol
Galium aparine L. gal.apa
Geum urbanum L. geu.urb
Heracleum sphondylium L. her.sph
Holcus lanatus L. hol.lan
Hypericum maculatum Crantz hyp.mac
Knautia arvensis (L.) J. M. Coult. kna.arv
Lathyrus pratensis L. lat.pra
Lathyrus sylvestris L. lat.syl
Leontodon autumnalis L. leo.aut
Leontodon hispidus L. leo.his
Lotus corniculatus L. lot.cor
Luzula campestris (L.) DC. luz.cam
Lupinus polyphyllus Lindl. lup.pol
Papaver rhoeas L. pap.rho
Pimpinella major (L.) Huds. pim.maj
Pimpinella saxifraga L. pim.sax
Plantago lanceolata L. pla.lan
Poa pratensis L. poa.pra
Populus tremula L. pop.tre
Ranunculus acris L. s. s. ran.acr
Ranunculus repens L. ran.rep
Reseda lutea L. res.lut
Rhinanthus minor L. rhi.min
Rubus sp. rub.sp
Rumex acetosa L. rum.ace
Rumex crispus L. rum.cri
Rumex obtusifolius L. rum.obt
Sedum maximum (L.) Hoffm. sed.max
Taraxacum officinale F. H. Wigg. tar.off
Tragopogon orientalis L. tra.ori
Tragopogon pratensis L. s. s. tra.pra
Trisetum flavescens (L.) P. Beauv. tri.fla
Thlaspi arvense L. thl.arv
Trifolium pratense L. tri.pra
Trifolium repens L. tri.rep
Urtica dioica L. urt.dio
Veronica chamaedrys L. ver.cha
Veronica officinalis L. ver.off
Vicia hirsuta (L.) S. F. Gray vic.hir
Vicia tetrasperma (L.) Schreb. vic.tet
Vicia villosa Roth vic.vill
Viola tricolor L. s. s. vio.tri
×Triticosecale Wittm. ex A.Camus triticale

References

  1. Wilson, M.C.; Chen, X.-Y.; Corlett, R.T.; Didham, R.K.; Ding, P.; Holt, R.D.; Holyoak, M.; Hu, G.; Hughes, A.C.; Jiang, L.; et al. Habitat fragmentation and biodiversity conservation: Key findings and future challenges. Landsc. Ecol. 2016, 31, 219–227. [Google Scholar] [CrossRef]
  2. Benton, T.G.; Vickery, J.A.; Wilson, J.D. Farmland biodiversity: Is habitat heterogeneity the key? Trends Ecol. Evol. 2003, 18, 182–188. [Google Scholar] [CrossRef]
  3. Baur, B.; Rusterholz, H.-P.; Braschler, B. The Grassland Fragmentation Experiment in the Swiss Jura Mountains: A Synthesis. Diversity 2023, 15, 130. [Google Scholar] [CrossRef]
  4. MacArthur, R.H.; Wilson, E.O. The Theory of Island Biogeography; Princeton University Press: Princeton, NJ, USA, 1967; p. 203. [Google Scholar]
  5. Habel, J.C.; Dengler, J.; Janišová, M.; Török, P.; Wellstein, C.; Wiezik, M. European grassland ecosystems: Threatened hotspots of biodiversity. Biodivers. Conserv. 2013, 22, 2131–2138. [Google Scholar] [CrossRef]
  6. Pruchniewicz, D.; Żołnierz, L. The influence of environmental factors and management methods on the vegetation of mesic grasslands in a central European mountain range. Flora 2014, 209, 687–692. [Google Scholar] [CrossRef]
  7. Mucina, L.; Grabherr, G.; Ellmauer, T. Die Pflanzengesellschaften Österreichs. Teil I Anthropogene Vegetation; Gustav Fischer Verlag: Jena, Germany, 1993. [Google Scholar]
  8. Matuszkiewicz, W. The Guide to Determination of Polish Plant Communities; Wydawnictwo Naukowe PWN: Warszawa, Poland, 2012. (In Polish) [Google Scholar]
  9. Leuschner, C.; Ellenberg, H. Ecology of Central European Non-Forest Vegetation: Coastal to Alpine, Natural to Man-Made Habitats; Vegetation Ecology of Central Europe; Springer International Publishing: Cham, Switzerland, 2017; Volume II. [Google Scholar]
  10. Cadenasso, M.L.; Pickett, S.T.A.; Weathers, K.C.; Jones, C.G. A framework for a theory of ecological boundaries. BioScience 2003, 53, 750–758. [Google Scholar] [CrossRef]
  11. Ries, L.; Fletcher, R.J., Jr.; Battin, J.; Sisk, T.D. Ecological responses to habitat edges: Mechanisms, models, and variability explained. Annu. Rev. Ecol. Evol. Syst. 2004, 35, 491–522. [Google Scholar] [CrossRef]
  12. De Jong, F.M.W.; de Snoo, G.R.; van de Zande, J.C. Estimated nationwide effects of pesticide spray drift on terrestrial habitats in the Netherlands. J. Environ. Manag. 2008, 86, 721–730. [Google Scholar] [CrossRef]
  13. Boutin, C.; Baril, A.; Martin, P.A. Plant diversity in crop fields and woody hedgerows of organic and conventional farms in contrasting landscapes. Agric. Ecosyst. Environ. 2008, 123, 185–193. [Google Scholar] [CrossRef]
  14. Monks, A.; Burrows, L. Are threatened plant species specialists, or just more vulnerable to disturbance? J. Appl. Ecol. 2014, 51, 1228–1235. [Google Scholar] [CrossRef]
  15. Tilman, D.; Balzer, C.; Hill, J.; Befort, B.L. Global food demand and the sustainable intensification of agriculture. Proc. Natl. Acad. Sci. USA 2011, 108, 20260–20264. [Google Scholar] [CrossRef] [PubMed]
  16. Rader, R.; Birkhofer, K.; Schmucki, R.; Smith, H.G.; Stjernman, M.; Lindborg, R. Organic farming and heterogeneous landscapes positively affect different measures of plant diversity. J. Appl. Ecol. 2014, 51, 1544–1553. [Google Scholar] [CrossRef]
  17. Kovach, W.L. MVSP—A MultiVariate Statistical Package for Windows, Ver. 3.2; Kovach Computing Services: Pentraeth, UK, 2010. [Google Scholar]
  18. Ellenberg, H.; Düll, R.; Wirth, V.; Werner, P.D. Zeigerwerte von Pflanzen in Mitteleuropa. In Scripta Geobotanica; Auflage, Verlag Erich Goltze KG: Göttingen, Germany, 1992; Volume 18, p. 2. (In German) [Google Scholar]
  19. Klotz, S.; Kühn, I.; Durka, W. [Hrsg.]. BIOLFLOR—Eine Datenbank zu Biologisch-Ökologischen Merkmalen der Gefäßpflanzen in Deutschland.—Schriftenreihe für Vegetationskunde 38; Bundesamt für Naturschutz: Bonn, Germany, 2015. [Google Scholar]
  20. Tibico Software Inc. Statistica, Version 13; Tibico Software Inc.: Palo Alto, CA, USA, 2017; Available online: http://statistica.io (accessed on 8 December 2023).
  21. Ter Braak, C.J.F.; Šmilauer, P. Canoco Reference Manual and User’s Guide: Software for Ordination, version 5.0; Microcomputer Power: Ithaca, NY, USA, 2012. [Google Scholar]
  22. Jongman, R.H.G.; ter Braak, C.J.F.; van Tongeren, D.F.R. (Eds.) Data Analysis in Community and Landscape Ecology; Pudoc: Wageningen, The Netherlands, 1987. [Google Scholar]
  23. Strayer, D.L.; Power, M.E.; Fagan, W.F.; Pickett, S.T.A.; Belnap, J. A classification of ecological boundaries. BioScience 2003, 53, 723–729. [Google Scholar] [CrossRef]
  24. Odum, E.P. Basic Ecology; Saunders College Publishing: Philadelphia, PA, USA, 1983. [Google Scholar]
  25. Winsa, M.; Bommarco, R.; Lindborg, R.; Marini, L.; Öckinger, E. Recovery of plant diversity in restored semi-natural pastures depends on adjacent land use. Appl. Veg. Sci. 2015, 18, 413–422. [Google Scholar] [CrossRef]
  26. Zschokke, S.; Dolt, C.; Rusterholz, H.-P.; Oggier, P.; Braschler, B.; Thommen, G.H.; Lüdin, E.; Erhardt, A.; Baur, B. Shortterm responses of plants and invertebrates to experimental small-scale grassland fragmentation. Oecologia 2000, 125, 559–572. [Google Scholar] [CrossRef] [PubMed]
  27. Schöpke, B.; Wesche, K.; Wulf, M. Dry grasslands adjacent to organic fields have higher plant diversity—Even far into their interior. Agric. Ecosyst. Environ. 2023, 357, 108672. [Google Scholar] [CrossRef]
  28. Van der Maarel, E. On the establishment of plant community boundaries. Ber. Dtsch. Bot. Ges. 1976, 89, 415–443. [Google Scholar] [CrossRef]
  29. Zechmeister, H.G.; Schmitzberger, I.; Steurer, B.; Peterseil, J.; Wrbka, T. The influence of land-use practices and economics on plant species richness in meadows. Biol. Conserv. 2003, 114, 165–177. [Google Scholar] [CrossRef]
  30. Fisher, J.; Lindenmayer, D.B. Landscape modification and habitat fragmentation: A synthesis. Glob. Ecol. Biogeogr. 2007, 16, 265–280. [Google Scholar] [CrossRef]
  31. Grime, J.P. Competitive Exclusion in Herbaceous Vegetation. Nature 1973, 242, 344–347. [Google Scholar] [CrossRef]
  32. Hylander, K. Aspect modifies the magnitude of edge effects on bryophyte growth in boreal forests. J. Appl. Ecol. 2005, 42, 518–525. [Google Scholar] [CrossRef]
  33. Joshi, J.; Stoll, P.; Rusterholz, H.-P.; Schmid, B.; Dolt, C.; Baur, B. Small-scale experimental habitat fragmentation reduces colonization rates in species-rich grasslands. Oecologia 2006, 148, 144–152. [Google Scholar] [CrossRef]
  34. Wu, J.; Han, P.; Yu, J.; Jarvie, S.; Zhang, Y.; Zhang, Q. Edge grassland provide a stronger thermal buffer against core grassland in the agro-pastoral ecotone of Inner Mongolia. Ecol. Indic. 2023, 154, 110762. [Google Scholar] [CrossRef]
  35. Burst, M.; Chauchard, S.; Damrine, E.; Dupouey, J.-L.; Amiaud, B. Distribution of soil properties along forest-grassland interfaces: Influence of permanent environmental factors or land-use after-effects? Agric. Ecosyst. Environ. 2020, 289, 106739. [Google Scholar] [CrossRef]
  36. Buisson, E.; Dutoit, T.; Torre, F.; Romermann, C.; Poschlod, P. The implications of seed rain and seed bank patterns for plant succession at the edges of abandoned fields in Mediterranean landscapes. Agric. Ecosyst. Environ. 2006, 115, 6–14. [Google Scholar] [CrossRef]
  37. Schmidt, M.; Lischeid, G.; Nendel, C. Microclimate and matter dynamics in transition zones of forest to arable land. Agric. For. Meteorol. 2019, 268, 1–10. [Google Scholar] [CrossRef]
Figure 1. Location of the research area.
Agriculture 14 00180 g001
Figure 2. Canonical correspondence analysis (CCA) results. Species representing the Stellarietea mediae class are marked in red; the Artemisietea vulgaris class is marked in purple; the Molinio-Arrhenatheretea class is marked in green; and the species of the other classes are marked in black. Species abbreviations are included in the Abbreviations Section.
Agriculture 14 00180 g002
Table 1. Values of Ellenberg ecological indicators (mean ± SE) for light index (L), humidity (F), trophy (N), and acidity (R). Homogeneous groups obtained during the Kruskal–Wallis test at p ≤ 0.05 are marked with letters.
1 m2 m5 m9 m17 m33 m
L5.10 ± 0.53 a5.70 ± 0.47 a5.70 ± 0.50 a5.56 ± 0.35 a5.73 ± 0.42 a4.52 ± 0.52 a
F3.36 ± 0.37 a3.45 ± 0.34 a3.56 ± 0.36 a3.94 ± 0.31 a3.83 ± 0.28 a3.53 ± 0.40 a
N3.03 ± 0.55 a3.61 ± 0.56 a3.96 ± 0.59 a3.36 ± 0.36 a3.46 ± 0.46 a2.66 ± 0.43 a
R4.99 ± 0.37 a5.30 ± 0.37 a4.90 ± 0.32 a4.53 ± 0.31 a4.75 ± 0.32 a4.90 ± 0.27 a
Table 2. Arithmetic means with standard errors of species diversity parameters, as well as shares of the synanthropic and non-synanthropic species, graminoids, and forbs in the total number of species. Homogeneous groups obtained during the Kruskal–Wallis test and analysis of variance at p ≤ 0.05 are marked with letters.
1 m2 m5 m9 m17 m33 m
H’1.09 ± 0.06 ab1.03 ± 0.07 a1.13 ± 0.09 ab1.46 ± 0.08 c1.38 ± 0.05 bc1.31 ± 0.09 abc
J’0.70 ± 0.04 a0.73 ± 0.04 a0.72 ± 0.04 a0.82 ± 0.02 a0.79 ± 0.02 a0.75 ± 0.04 a
S4.90 ± 0.26 ab4.25 ± 0.27 a4.90 ± 0.35 ab6.20 ± 0.44 b5.95 ± 0.38 b6.21 ± 0.52 b
Share of apophyte species [%]68.33 ± 3.61 a81.17 ± 3.71 ab78.19 ± 3.96 ab83.35 ± 3.09 b81.39 ± 2.74 ab80.26 ± 4.91 ab
Share of alien synanthropic species [%]8.00 ± 3.17 a4.33 ± 2.02 a2.63 ± 1.47 a1.67 ± 1.15 a2.17 ± 1.22 a3.33 ± 1.65 a
Share of non-synanthropic species [%]23.67 ±3.59 a14.50 ± 4.03 a19.18 ± 3.99 a14.99 ± 2.82 a16.44 ± 2.79 a16.41 ± 4.19 a
Graminoid species [%]45.70 ± 6.75 ab44.94 ± 6.09 ab50.16 ± 5.36 ab39.65 ± 4.98 a41.74 ± 4.47 ab62.56 ± 4.40 b
Forb species [%]53.95 ± 6.84 ab54.48 ± 6.02 ab47.21 ± 5.91 ab60.35 ± 4.98 b58.26 ± 4.47 ab37.37 ± 4.38 a
Table 3. Relative share of species representing different vegetation classes in the total vegetation cover of the research areas. Arithmetic means ± standard errors are reported. Homogeneous groups obtained during the Kruskal–Wallis test are marked with letters.
Class1 m2 m5 m9 m17 m33 m
Molinio-Arrhenatheretea [%]50.62 ± 6.53 a55.89 ± 6.36 ab 71.49 ± 5.07 ab62.59 ± 5.46 ab69.69 ± 5.30 ab 75.61 ± 5.21 b
Artemisietea vulgaris [%]27.91 ± 5.67 a29.27 ± 5.18 a18.51 ± 4.90 a20.93 ± 3.84 a19.25 ± 4.03 a16.68 ± 4.21 a
Stellarietea mediae [%]14.67 ± 3.91 a12.48 ± 5.07 a8.09 ± 2.86 a14.30 ± 3.87 a10.37 ± 3.17 a6.65 ± 2.07 a
Other classes [%]6.80 ± 2.38 a2.36 ± 1.40 a1.91 ± 1.37 a2.18 ± 1.58 a0.69 ± 0.36 a1.06 ± 0.65 a
Disclaimer/Publisher’s Note: The statements, opinions and data contained in all publications are solely those of the individual author(s) and contributor(s) and not of MDPI and/or the editor(s). MDPI and/or the editor(s) disclaim responsibility for any injury to people or property resulting from any ideas, methods, instructions or products referred to in the content.

