Article

Automatic Detection of Rice Blast Fungus Spores by Deep Learning-Based Object Detection: Models, Benchmarks and Quantitative Analysis

1
College of Plant Protection, South China Agricultural University, Guangzhou 510642, China
2
College of Mathematics and Informatics, South China Agricultural University, Guangzhou 510642, China
3
Guangzhou Key Laboratory of Intelligent Agriculture, Guangzhou 510642, China
4
College of Plant Protection, China Agricultural University, Beijing 100193, China
*
Authors to whom correspondence should be addressed.
Agriculture 2024, 14(2), 290; https://doi.org/10.3390/agriculture14020290
Submission received: 13 December 2023 / Revised: 22 January 2024 / Accepted: 5 February 2024 / Published: 10 February 2024
(This article belongs to the Special Issue Detection, Identification and Control of Plant Pathogens)

Abstract

:
The severity of rice blast and its impacts on rice yield are closely related to the inoculum quantity of Magnaporthe oryzae, and automatic detection of the pathogen spores in microscopic images can provide a rapid and effective way to quantify pathogen inoculum. Traditional spore detection methods mostly rely on manual feature extraction and shallow machine learning models, and are mostly designed for the indoor counting of a single spore class, which cannot handle the interference of impurity particles in the field. This study achieved automatic detection of rice blast fungus spores in the mixture with other fungal spores and rice pollens commonly encountered under field conditions by using deep learning based object detection techniques. First, 8959 microscopic images of a single spore class and 1450 microscopic images of mixed spore classes, including the rice blast fungus spores and four common impurity particles, were collected and labelled to form the benchmark dataset. Then, Faster R-CNN, Cascade R-CNN and YOLOv3 were used as the main detection frameworks, and multiple convolutional neural networks were used as the backbone networks in training of nine object detection algorithms. The results showed that the detection performance of YOLOv3_DarkNet53 is superior to the other eight algorithms, and achieved 98.0% mean average precision (intersection over union > 0.5) and an average speed of 36.4 frames per second. This study demonstrated the enormous application potential of deep object detection algorithms in automatic detection and quantification of rice blast fungus spores.

1. Introduction

Rice is one of the three major food crops in the world. According to the statistics of the Food and Agriculture Organization of the United Nations (FAO) in 2023, the total production quantity of rice in 2021 was 787 million tons, second only to corn [1]. Its production safety is crucial for the stability of the world’s food supply [2]. Rice blast is an important epidemic disease caused by Magnaporthe oryzae. The disease is mainly transmitted through airborne conidia and can spread rapidly under suitable environmental conditions, leading to large-scale disease epidemics and often causing 10–30% yield loss of rice annually [3,4]. Monitoring the quantity of airborne spores in the field is important for assessing the occurrence and prevalence of rice blast.
The inoculum quantity of M. oryzae is usually quantified by collecting spores using specific traps and observing them under a microscope [5]. Normally, the carriers for capturing spores are glass slides or tapes. However, as the field environment is complex, many impurities may be collected besides conidia of M. oryzae, such as rice pollens and other fungal spores. Using the naked eye to distinguish different impurities and count spores of M. oryzae is inefficient and labor-intensive, during which the accuracy may decline with the occasional diversion of human attention [6]. If the machine learning techniques can be used to automatically detect the spores on the collected glass slides or tapes, it can not only improve the efficiency, but also ensure the consistency and accuracy in the process of identifying and quantifying conidia of M. oryzae.
Object detection is an important technique in machine learning and computer vision, which provides a promising solution for the above research goal. There are two sub-tasks for object detection in the image, namely, locating the objects of interest and classifying the objects in the image [7]. In the early stage of object detection, the region of interest (ROI) is usually selected through the sliding window, and then some traditional feature descriptors, such as the scale invariant feature transform (SIFT) [8], histograms of oriented gradients (HOG) [9], would be adopted to extract the features manually. Finally, the extracted features would be used to classify the objects and to make the bounding box regression [10]. However, these traditional object detection methods are often faced with two limitations. On the one hand, the region selection strategy based on a sliding window produces lots of candidate windows with significant redundancy, therefore is time-consuming and memory-consuming [11]. On the other hand, it typically adopts artificially designed features, lacks the feature representation learning ability and relies on experts with rich experience in feature designing [12].
With the development of deep learning and the emergence of high-performance GPU, the performance of object detection methods has been greatly improved in recent years [13]. The deep learning based object detection methods can be divided into two main categories [14]. The first category is the two-stage methods, which first utilize selective search or region proposal network (RPN) to select candidate boxes and then use the convolutional neural network (CNN) to classify and regress the objects [15]. The methods in this category include regions with CNN features (R-CNN) [16], spatial pyramid pooling net (SPP-net) [17], etc. The second category includes the one-stage methods, such as you only look once (YOLO) [18], the single shot detector (SSD) [19], etc. The methods in this category typically identify the classes and the location information of the objects directly through the backbone network with a fast detection speed, which, however, may sacrifice a certain degree of accuracy [20].
In the field of agriculture or medicine, some researchers used the object detection techniques based on deep learning to detect fungal spores or human cells, and have made considerable progresses. Zhang et al. [21] proposed a fungal spores detector called FSNet, using VGG16 [22] as the backbone network and Faster R-CNN [23] as the framework, and achieved a 91.6% average precision (intersection over union (IoU) > 0.6) in the detection of fungal spores on stored grains. Kubera et al. [24] collected three allergic pollen particles by using specific instruments to construct a microscopic image dataset. Then the pollen was detected using the YOLO network in comparison with two other object detection methods, i.e., Faster R-CNN and RetinaNet [25]. The results showed that the YOLO network outperformed the other two methods and achieved a mean average precision mAP(0.5:0.95) of 86.8–92.4% on three pollen test sets. Shakarami et al. [26] used the improved YOLOv3 [27] to detect white blood cells, red blood cells and platelets in blood, and reached an accuracy of 98.92%, 80.41% and 90.25%, respectively, on the three blood cells.
However, little research has been conducted on the deep learning based detection of spores produced by fungal pathogens of rice, especially M. oryzae. Although some attempts have been made to detect the rice disease spores, these were mostly used the traditional (shallow) machine learning techniques with manually extracted features for object detection. For instance, Yang et al. [28] detected the spores of rice false smut and rice blast pathogens separately by using the decision tree and the confusion matrix based on features of texture and shape. Wang et al. [29] extracted the HOG features based on the shape of rice blast spores, after which an intersection kernel support vector machine classifier was used to detect rice blast spores. Qi et al. [30] obtained the binary image of the rice blast pathogen spores firstly, and then adopted the improved watershed algorithm to separate the adhesive spores and count them. These traditional object detection algorithms typically rely on complex feature engineering and lack the ability of feature representation learning. Meanwhile, most of these studies only consider one type of spore in an image and ignore the existence of other types of spores in the field, which could only be used for indoor spore detection and counting.
According to the field experience, the common impurity particles to rice blast fungal conidia in the rice fields usually include spores of Alternaria spp. and Fusarium spp. and rice pollens. Meanwhile, in the laboratory environments, spores of Botrytis spp. are also encountered commonly during culturing of rice blast fungus, and in the process of producing and quantifying conidia of the pathogen. With the capability of feature representation of deep neural networks, if the deep learning-based object detection technique can be utilized to accurately locate and identify spores of M. oryzae, whether cultured indoors or collected in the field, it may not only solve the problem of the time-consuming and labor-intensive manual spore counting, but also overcome the potential interference of other types of objects and the inaccurate recognition in the field.
The accurate identification of M. oryzae conidia and other impurity particles is closely related to the subsequent spores counting problem. The research of Lee et al. [31] suggested that using similar datasets rather than universally shared datasets for pre-training feature extraction networks might improve the detection performance of models for target spores. Meanwhile, many studies have shown that the pre-training of transfer learning can speed up model convergence and achieve better training results [32,33,34]. Therefore, the question that whether using a pre-trained model (obtained from the self-built single class of spores data) for the final training is helpful for the detection of M. Oryzae conidia and other spores is also worth exploring.
To address the above problems, this study constructed a multi-scene and multi-object microscopic image dataset of rice blast fungus spores, and presented a deep learning-based object detection framework to accurately detect the rice blast fungus spores in the mixture of fungal spores and rice pollens, so as to achieve accurate counting of the pathogen conidia. The specific research objectives were as follows:
  • To construct a microscopic imageset of M. oryzae conidia captured in different magnification and different scenes, including the images of M. oryzae conidia mixed with other impurities;
  • To train a variety of object detection algorithms based on deep learning to detect conidia of M. oryzae in different scenes, where different evaluation criteria were used to compare the performance of various object detection algorithms;
  • To explore whether using the pre-trained model obtained from the self-built single class of spore data for training is helpful for the detection of M. oryzae conidia and other spores.

2. Materials and Methods

2.1. Dataset Construction

The microscopic spore images of M. oryzae (Figure 1A), Fusarium spp. (Figure 1B) (Isolated host: watermelon and melon), Alternaria spp. (Figure 1C) (Isolated host: watermelon and sugar beet) and Botrytis spp. (Figure 1D) (Isolated host: strawberry) were collected in this experiment. The samples of Fusarium spp. and Alternaria spp. were provided by the laboratory of fungal diseases of industrial crops, China Agricultural University, and the samples of Botrytis spp. were provided by the laboratory of Professor Zhang, Guozhen, China Agricultural University. The dataset includes spore images of a single class under 10 × 40 microscope (D40) (Table 1a) and multi-object images of impurity particles mixed with M. oryzae conidia under 10 × 20 microscope (D20) (Table 1b). Specifically, the conidia of M. oryzae under the 10 × 40 field were produced with isolates collected from 10 Chinese provinces including Anhui, Chongqing, Guangdong, Hubei, Hunan, Jiangsu, Jiangxi, Liaoning, Sichuan and Yunnan in the past five years, while the conidia of M. oryzae under 10 × 20 field were collected from fresh diseased rice leaf in Liaoning Province in 2019 and 2020.
When M. oryzae conidia, collected through the spore traps in the field, were observed under microscope, it was found that rice pollens were also frequently presented on slides. Therefore, rice pollens collected in the field were also photographed to obtain the images of a single pollen under a 10 × 40 microscope (Figure 1E). In the meantime, because the number of images in which rice pollens and M. oryzae conidia were captured simultaneously was small, the multi-object image containing only rice pollens was also used for D20, whose number was half of the number of the other types in D20 (Table 1b). For better description, the five image classes of rice blast fungus conidia, macro-conidia of Fusarium spp., conidia of Alternaria spp. conidia of Botrytis spp. and rice pollens were abbreviated as ric, mel, bet, str and pol, respectively.
For the test set, two image sets were built for different scenes (Figure 2). The first test set was built under the indoor scene (D20_test_indoor), which contained 50 images from each class in D20, leading to a total of 225 images, except that the multi-object images of pol came from the rice field. Another test set was built by collecting the microscope images of mixed spores collected in the field (T20_field), with the only exception that the images of ric mixed with str were collected from the indoor environment. The compositions of the different datasets are shown in Table 1a,b. The field collection sites included mainly rice experimental fields in Panjin City, Liaoning Province and Wuyuan City, Jiangxi Province, China. The spore trapping was completed with six portable spore traps designed by our own laboratory (Patent No.: ZL201410009269.6), and the image acquisition was conducted with a micro imaging integrated equipment camera (Model: Zeiss AxioCam ERc 5s Microscope camera, Manufacturer: Carl Zeiss AG, Oberkochen, Germany).

2.2. Image Pre-Processing and Labelling

The original images taken by the microscopic imaging system had a resolution of 2560 × 1920 pixels, and were saved in JPEG format. For D40, the images were resized to 800 × 800 and converted into gray scale for training the pre-trained model. For the images under the 10 × 20 field, including D20 and T20_field, the images were first converted into gray-scale images, and then divided into 12 square blocks with a size of 640 × 640 pixels, after which the images containing multiple objects were finally selected for standardized labelling according to the following principles: (a) The blocks must include two or more objects; (b) The multi-object images should contain at least two classes of objects.
LabelImg (version: 1.8.5) was the software used for labelling, and the labelling was carried out according to the following principles. First, an incomplete object should be labelled only when over a half of its area was visible. Second, overlapping objects should be labelled separately. The labelled D20 was divided into the training set, validation set and test set according to a ratio of 8:2:2. At the same time, the field spore test set T20_field was also labelled. D20 and T20_fields were sorted according to the format of the MS COCO (Common Objects in Context) dataset. The MS COCO dataset is an open dataset widely used for evaluating the performance of object detection [35]. The process of constructing all the datasets is shown in Figure 3.

2.3. Object Detection Frameworks and Backbone Networks

In this study, two types of two-stages object detection frameworks, including Faster R-CNN and Cascade R-CNN, and one type of one-stage object detection framework YOLOv3 were selected for comparing the performance in detecting rice blast fungus conidia mixed with other impurity particles. Meanwhile, three types of backbone networks used in this study, including DarkNet53, ResNet and MobileNet, would also be described in this section.

2.3.1. Faster R-CNN

Faster R-CNN [23] is the latest research achievement of the R-CNN series. Different to R-CNN [15] and Fast R-CNN [36], it does not need to extract the features of each generated candidate box. Instead, Faster R-CNN uses the CNN to generate the feature map of the whole image after inputting, and then uses the RPN to generate the ROIs, which will be mapped to the last convolution layer and generate the feature map with specified size by ROI pooling. Finally, the classification probability and bounding box regression are jointly trained by the softmax loss and the smooth L1 loss.

2.3.2. Cascade R-CNN

Generally, for two-stage object detection algorithms, the IoU threshold is set first to decide positive and negative samples. In practical application, this threshold is usually set to 0.5. However, even so, many noisy bbox, which is very close to the correct but not the correct bbox, will be generated in the detection process. In order to solve this problem, Cai and Vasconcelos [37] proposed Cascade R-CNN, which is a stack of three detectors. The proposals output by the previous detector would become the input of the next detection. The accuracy of the prediction box is improved by continuously increasing the threshold without losing positive samples. For Cascade R-CNN, the backbone network usually used is ResNet50.

2.3.3. YOLOv3 and DarkNet-53

As a representative object detection algorithm in one-stage, the main idea of YOLO is to divide an image into S × S grid cells. If the center of an object falls in the grid, the grid is responsible for predicting the object. In other words, each grid can only be responsible for prediction of one object, so it means that the method is easy to miss detection of adjacent or small objects. In the YOLO series, we chose YOLOv3 [27] for the experiment, which is the most widely used version at present. It uses different anchor boxes to detect objects of different sizes on the three layers of feature maps. Instead of using the softmax classifier, logistic regression is used to find the one with the highest objective score from the nine anchor priors. It uses its own designed DarkNet-53 as the backbone network. The model has 53 convolutional layers, including the fully connected layer, and each convolutional layer will be followed by a Batch Normalization (BN) layer and a LeakyReLU layer.

2.3.4. ResNet

ResNet series were one of the classical convolutional neural networks (CNNs) proposed by He et al. [38]. The residual module of ResNet series was designed to alleviate the problem of gradient dispersion. The backbone networks used in this study were ResNet34, ResNet50 and ResNet50_vd. Compared with ResNet50, ResNet50_vd adds a 2 × 2, stride 1 average pooling layer before the convolution layer of the down-sampling path Path_B of the residual module, which can avoid the 3/4 information loss of input feature maps in the next down-sampling stage [39].

2.3.5. MobileNet

MobileNet is a lightweight CNN model proposed by Howard et al. [40], specially designed for mobile terminals and embedded devices. The network replaces the traditional convolution operation with depth-wise separable convolution, that is, the combination of depth-wise convolution and point-wise convolution. In this study, MobileNetv1 and MobileNetv3_large [41] were used.

2.4. Transfer Learning

Transfer learning is a commonly used training method in deep learning. It can transfer the features and parameters learned from large datasets to the new model, effectively solving the problem of slow model convergence caused by random parameter initialization, and improving model performance [42,43]. In this study, although the spore microscopic images captured at a magnification of 200 times might contain multiple objects, each spore occupied only a small number of pixels and the image clarity was not as good as the spore images obtained at a magnification of 400 times. Inspired by Lee et al. [31], we constructed a spore image set of a single class under 10 × 40 microscope (D40) to train six backbone models, expecting the model would learn accurate spore features and parameters for each spore class. After that, these weights and parameters were transferred into the corresponding object detection algorithm and updated by training with D20. In this study, the transfer learning method only changed the initial weight parameters of the model, but did not freeze the number of layers. This experiment was conducted to explore whether this transfer learning method was superior to training from scratch in spore detecting tasks.

2.5. Experimental Scheme Design

In this study, D40 was first used to pre-train six backbone networks, namely, ResNet50_vd, ResNet50, ResNet34, DarkNet53, MobileNetv1 and MobileNetv3_large, and to obtain the pre-trained weights (Figure 4). Subsequently, three object detection frameworks including Faster R-CNN, Cascade R-CNN and YOLOv3, with different backbone networks were trained with D20 (Figure 4). In total, 9 different object detection algorithms were compared in this study, namely, Cascade_RCNN_ResNet50, Cascade_RCNN_ ResNet50_vd, Faster_RCNN_ResNet34, Faster_RCNN_ResNet50_vd, YOLOv3_ResNet34, YOLOv3_ResNet50_vd, YOLOv3_DarkNet53, YOLOv3_MobileNetv1 and YOLOv3_MobileNetv3_large. These 9 object detection algorithms were trained by using transfer learning with pre-trained weights and by training-from-scratch, respectively, resulting in a total of 18 object detection models. Finally, the models obtained above were tested with D20_test_indoor and T20_field for model comparison (Figure 4).

2.6. Training Tools and Parameter Settings

Paddle is an open source deep learning platform (https://www.paddlepaddle.org.cn/, accessed on 1 December 2023), which integrates the core framework and basic model library of deep learning, so it can help researchers improve efficiency and devote more energy to solving problems in different types of training data and application scenarios. In this study, PaddleClas and PaddleDetection were the two modules used. Firstly, PaddleClas was used in pre-training with D40 to obtain the pre-trained models, and then PaddleDetection was used to train the pre-trained model or to train from scratch according to the designs described above. The model weights obtained after training were then used for model performance evaluation. This study was completed with a computer using a 64-bit Windows 10 operating system, and equipped with GTX 1080Ti graphics card and 32 G memory module. All workouts were based on a single graphic processing unit (GPU). The specific training parameters are presented in Table 2.

2.7. Evaluating Indicators

Generally, it is difficult to completely overlap the bounding box of the object predicted by the machine with the actual bounding box of the object. Therefore, a threshold was set for the degree of overlap. If the overlap was greater than or equal to this threshold, the detection was recognized as a positive sample. Otherwise, it was recognized as a negative, and this degree of overlap was called IoU (Intersection over Union).
IoU ( A P , A G ) = A P A G A P A G
AP was the area of the prediction box, AG was the area of the ground truth.
Based on IoU, the object and background can be distinguished, and two common indicators for evaluating the accuracy of object detection algorithm, precision and recall, can be obtained. At the same time, F1 calculated based on these two, were used to comprehensively evaluate the performance of the algorithm. The specific calculation formula was as follows:
Precision = TP TP + FP
Recall = TP TP + FN
F 1 = 2 Precision × Recall Precision + Recall
TP: True positive refers to the number of positive samples correctly predicted. FP: False positive refers to the number of negative samples predicted to be positive. TN: True negative refers to the number of negative samples correctly predicted. FN: False negative refers to the number of positive samples predicted to be negative.
The above indicators are mainly used for the evaluation of the binary classification object detection algorithm. When the task becomes multi-object detection, the calculation of the evaluation indicators becomes more complex. In this study, five different classes of objects were detected. The evaluation system followed the calculation method in the evaluation system of MS COCO dataset, using mAP(0.5) and mAP_ric(0.5:0.95) and Macro F1, respectively. Among them, mAP(0.5) referred to the average precision of five classes when the IoU threshold was set to 0.5. As no index combining mAP and recall was used to comprehensively evaluate the overall performance of a model in the MS COCO evaluation system through Paddle platform, we introduced a modified Macro F1 for this purpose. Instead of using the original Macro F1 calculated from the average value of precision and recall of all classes at a certain threshold, mAP(0.5:0.95) and Recall(0.5:0.95) were used to calculate the modified Macro F1 in this study since Recall(0.5) was not output from MS COCO.
Macro _ F 1 = 2 mAP ( 0.5 : 0.95 ) × Recall ( 0.5 : 0.95 ) mAP ( 0.5 : 0.95 ) + Recall ( 0.5 : 0.95 )
mAP(0.5:0.95) referred to the mean average precision obtained by averaging the AP value every 0.05 by setting the IoU threshold from 0.5 to 0.95. This value can better reflect the recognition accuracy of the model. Similarly, Recall(0.5:0.95) was also the average recall rate calculated according to this principle.
At the same time, because this research was mainly aimed at sourcing the accurate identification and location of ric, mAP_ric(0.5:0.95) was used as one of the evaluation indicators to explore the detection effect of different algorithms on ric.
In addition to comparing the accuracy of the object detection algorithm, the detection speed was also used to evaluate the performance of the algorithm. Frames per second (FPS), an index commonly used in the field of object detection to evaluate the speed of algorithms, was calculated as the average number of images that the algorithm could process per second.

3. Results and Discussion

3.1. Influence of Model Pre-Training

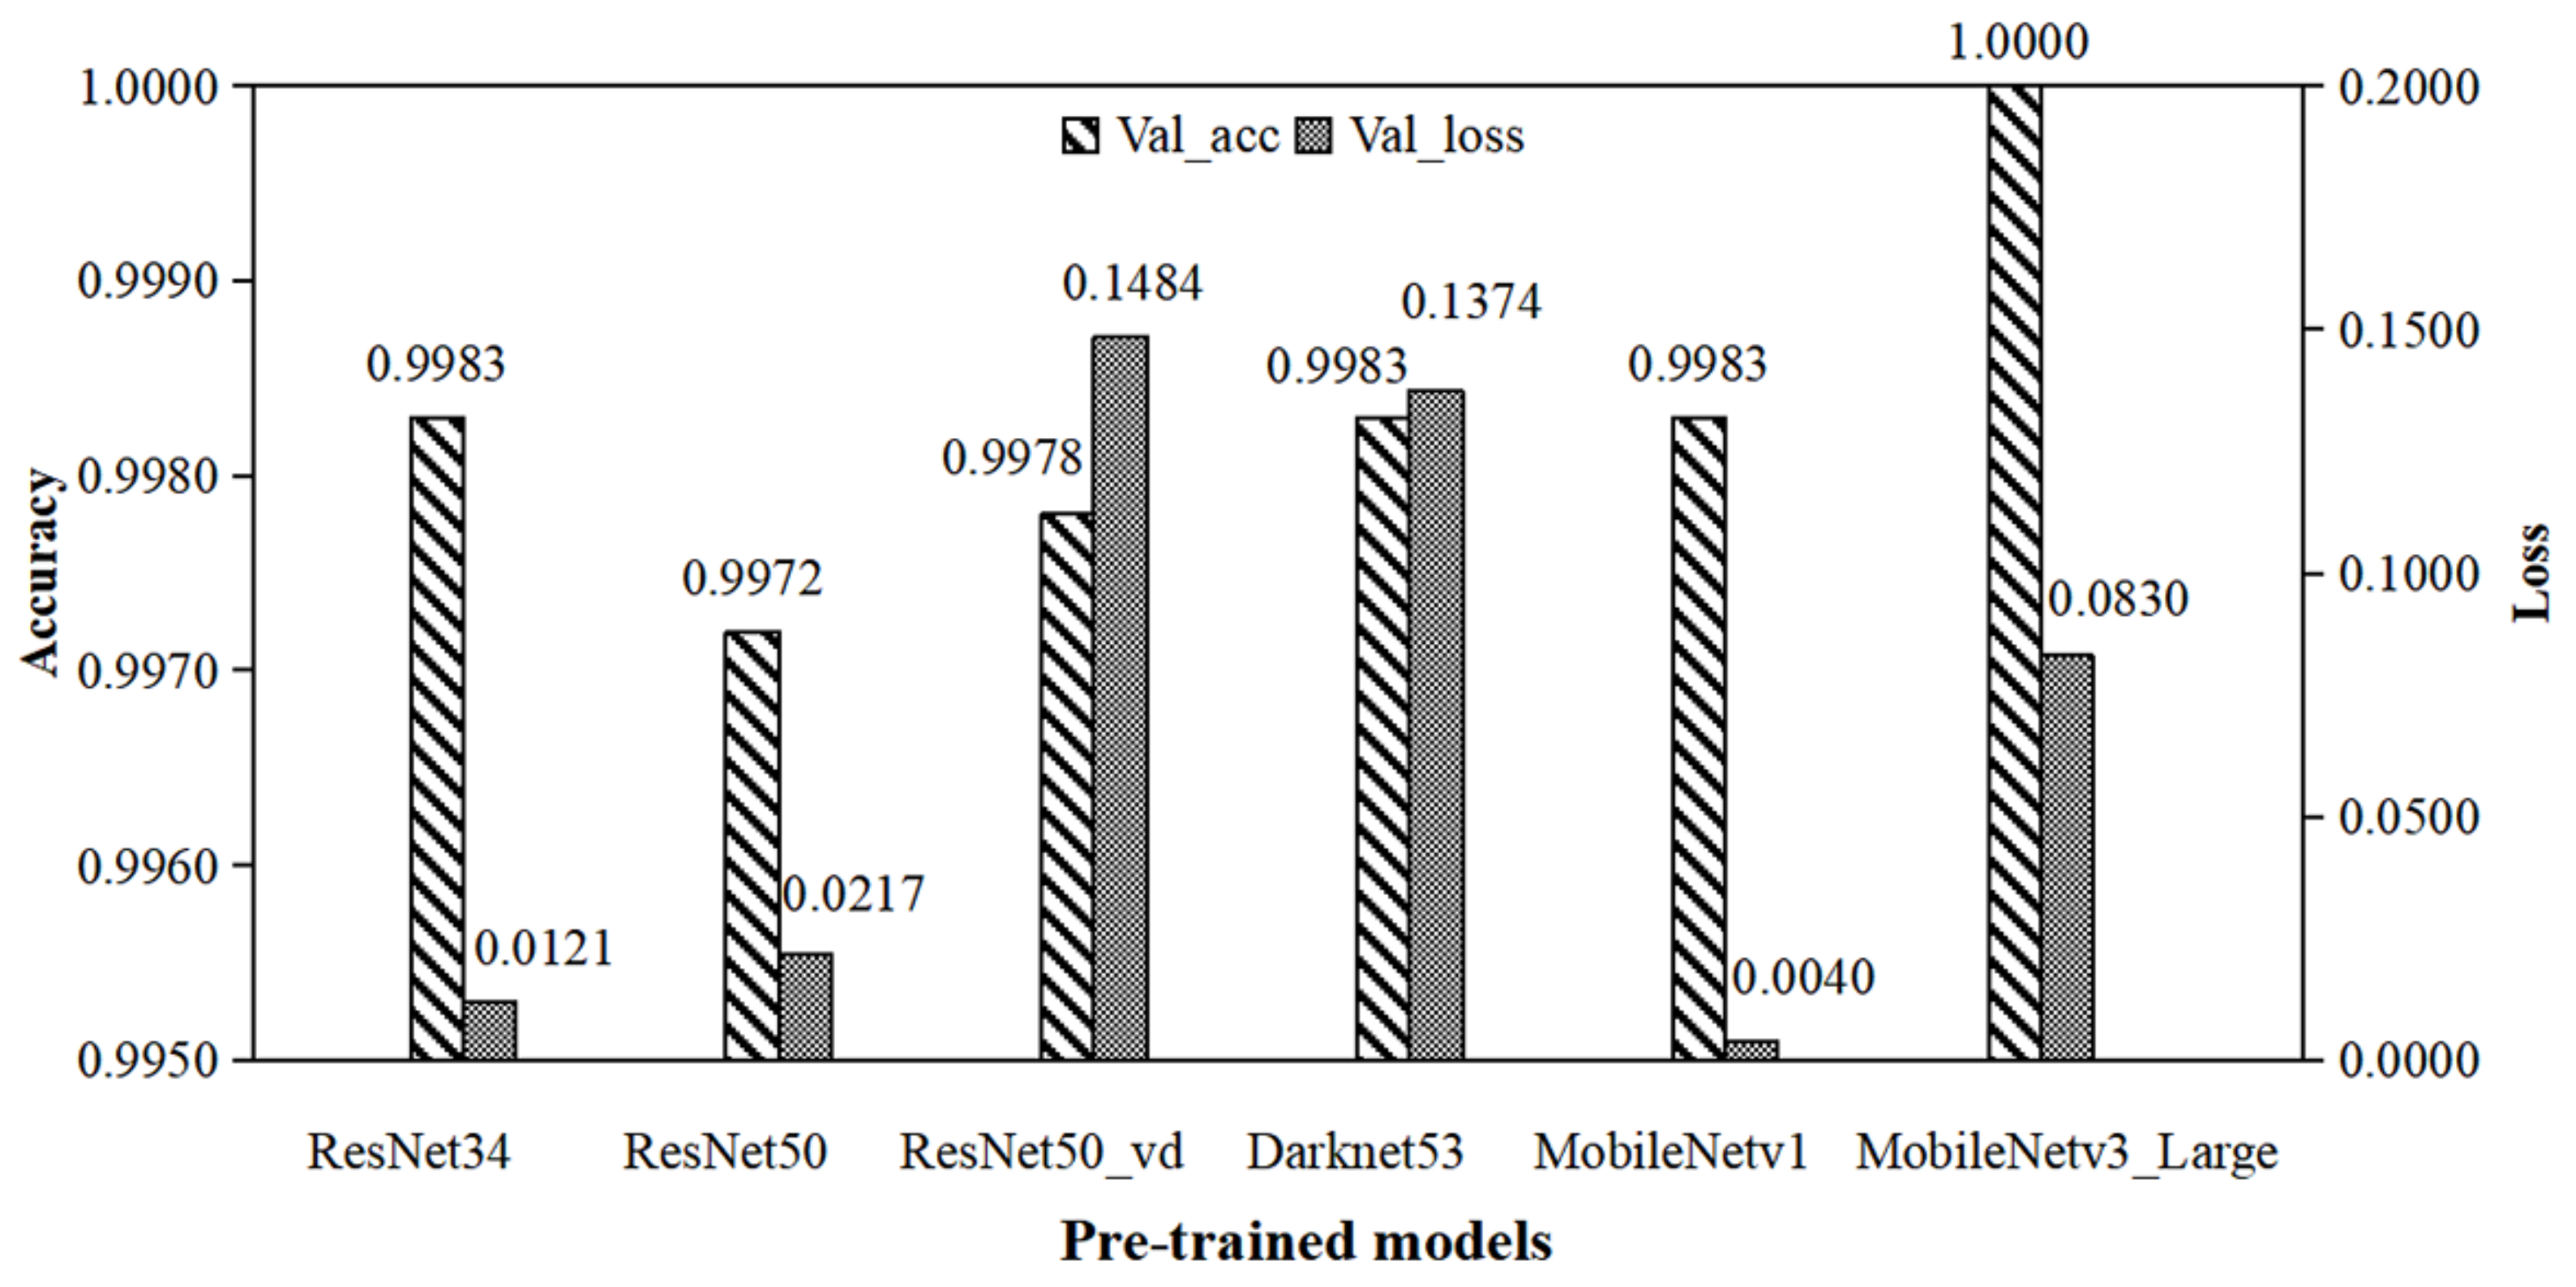
For the nine object detection algorithms selected in the experiment, a total of six CNN models were used as backbone networks, namely ResNet50_vd, ResNet50, ResNet34, DarkNet53, MobileNetv1 and MobileNetv3_large. After training with D40, six pre-trained weights were obtained (Figure 5). The results show that the overall validation accuracy of six CNN models for four classes of spores and rice pollens reached more than 99%, especially the validation accuracy of MobileNetv3, which even reached 100%. It indicated that the recognition characteristics of the five image classes were quite different and could be well distinguished.
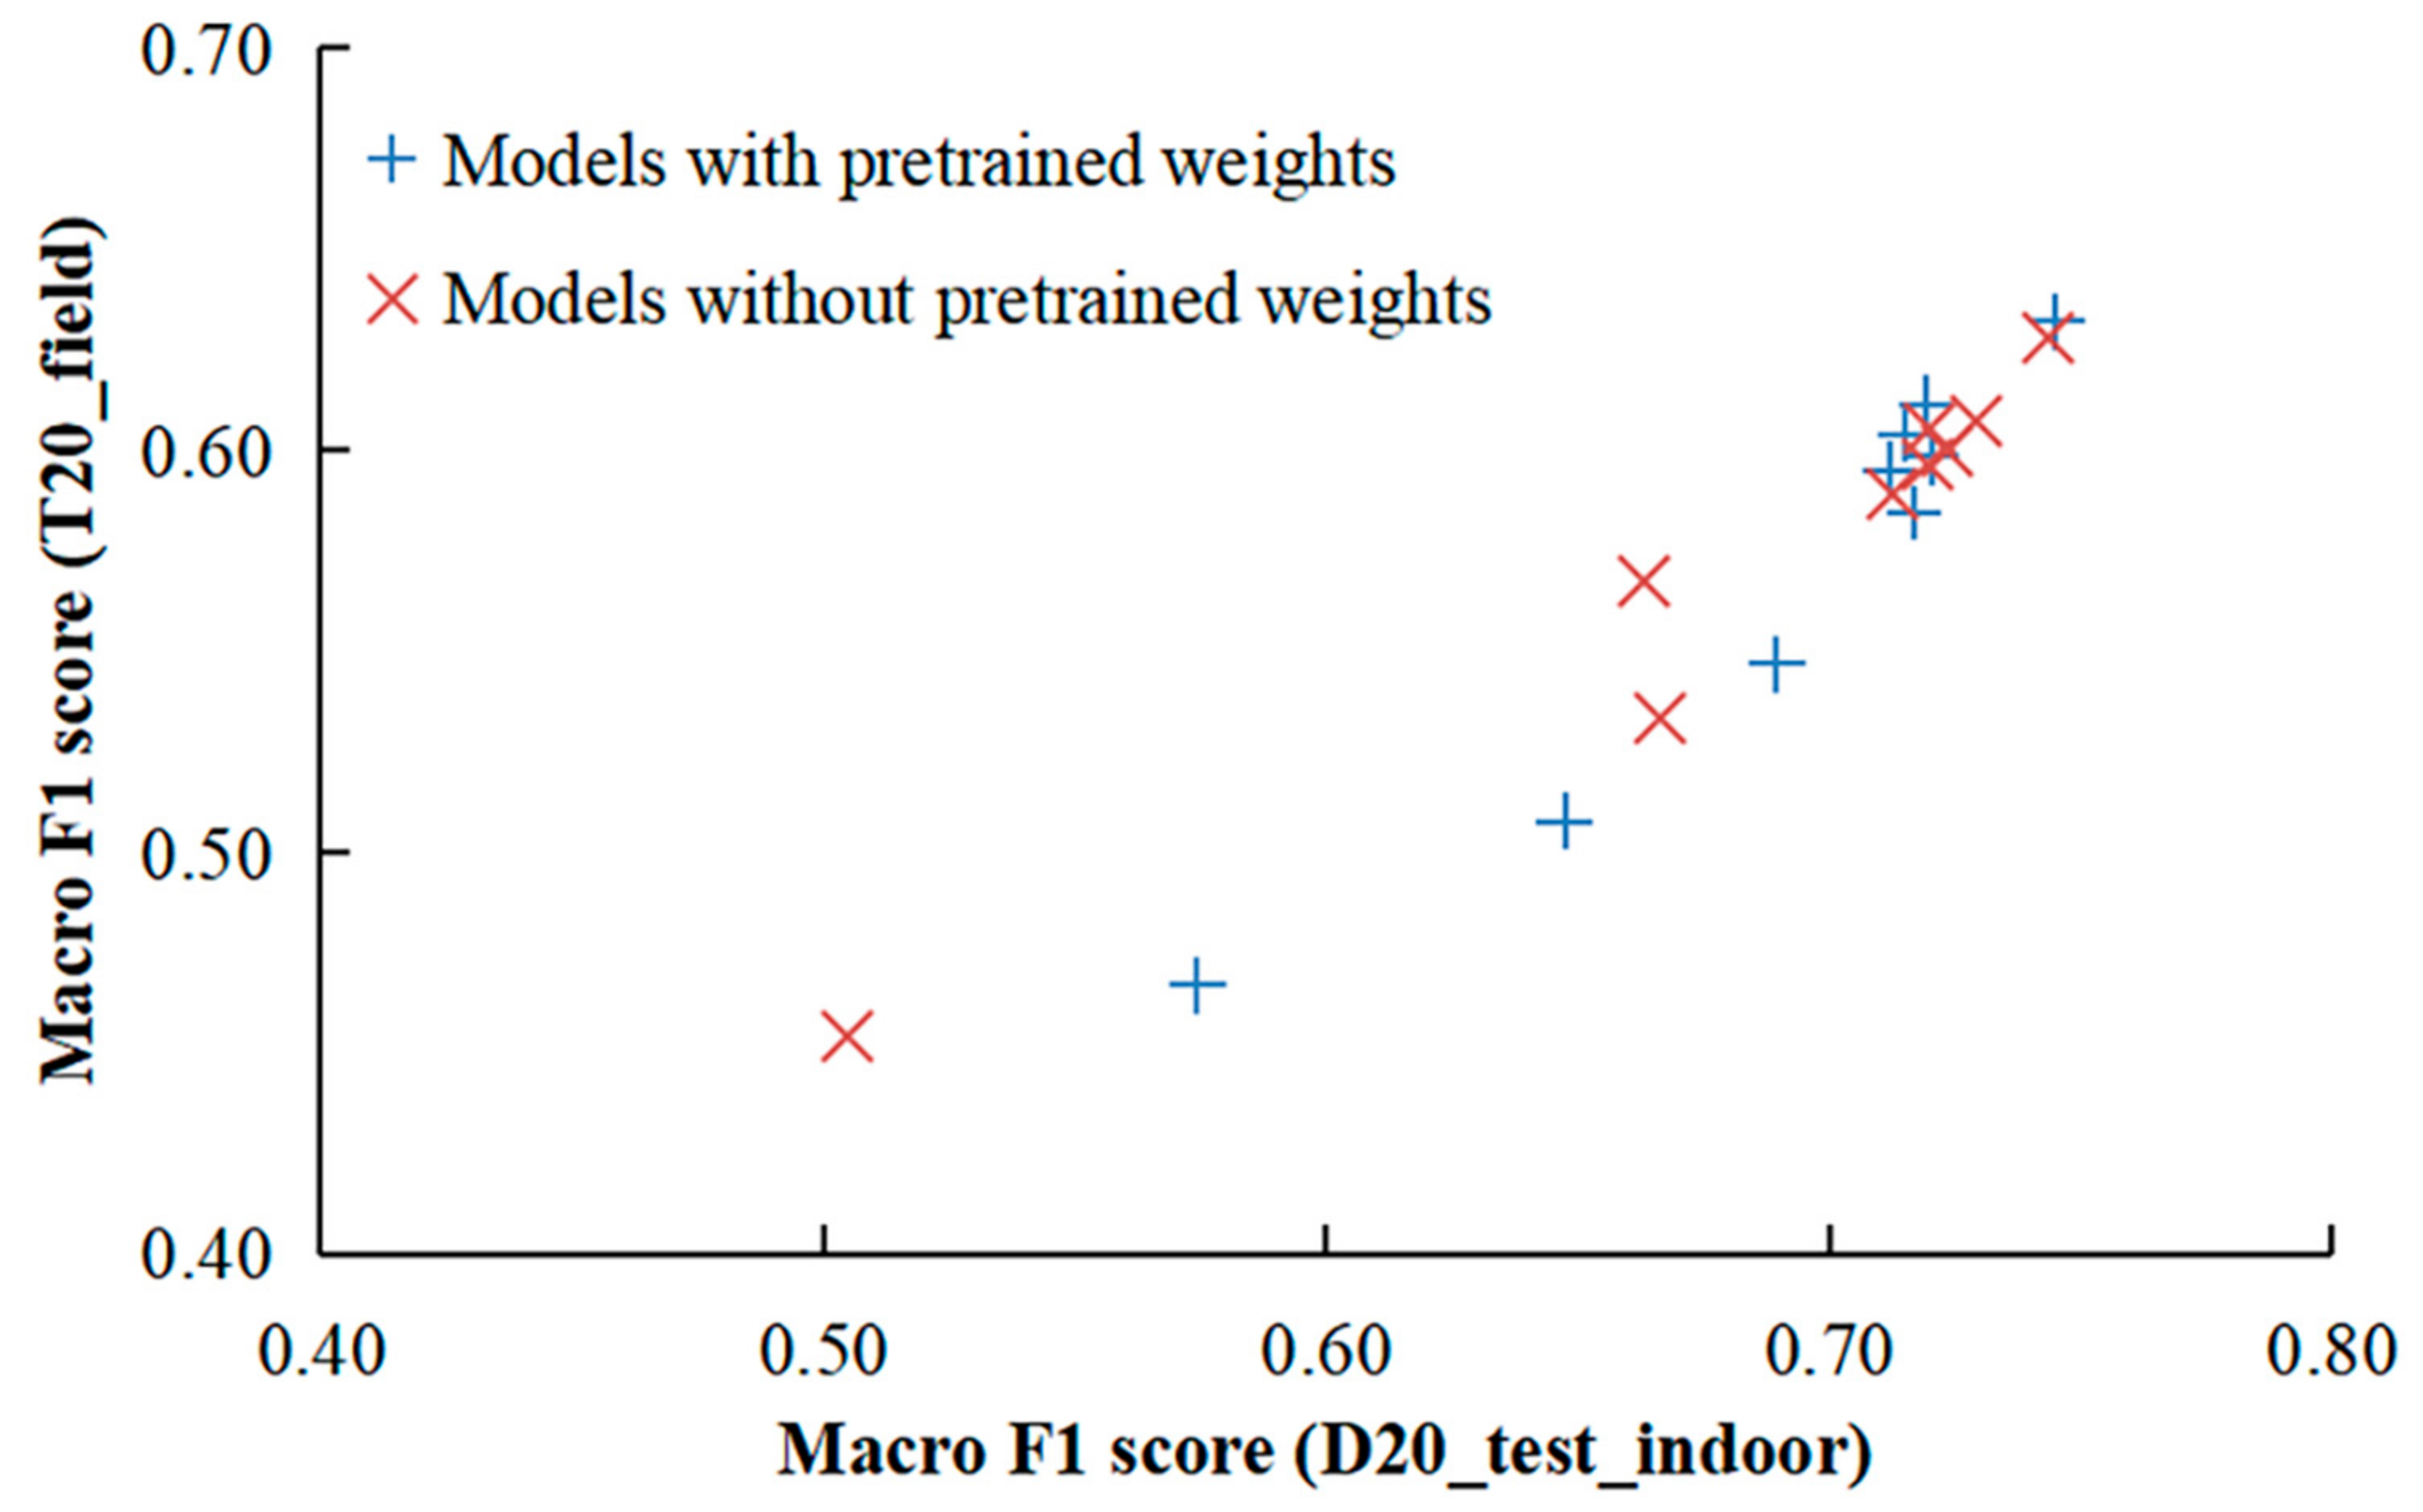
However, when these pre-trained models were used for subsequent object detection training, it was hard to note whether the models with pre-trained weights performed better than the models without pre-trained weights (Table 3). Plotting the Macro F1 scores of models using pre-trained weights and the models trained from scratch revealed that the two series were basically concentrated in one district without obvious zoning (Figure 6). Then the paired-samples t-test between two types of models also indicated that the Macro F1 scores of two types of models did not differ significantly, no matter on the D20_test_indoor (p = 0.49) or the T20_field (p = 0.44). The reason might be that the morphological features of the five classes were relatively simple. After 100 epochs of training by using the object detection algorithms, the features required for classifying could be well extracted to distinguish the five classes, and the average mAP(0.5) of most models except YOLOv3_ResNet50_vd reached more than 0.93, no matter whether the pre-trained weight was used or not (Table 3).

3.2. Performance Comparison of Different Object Detection Algorithms

Both fast speed and high F1 score are pursued by the spore detection algorithms. Therefore, in order to comprehensively evaluate the performance differences among these nine object detection algorithms selected in this experiment, a scatter diagram was drawn based on Macro F1 and FPS (Figure 7). The algorithms using YOLOv3 as the framework had a much higher detection speed (FPS) than the other four algorithms based on Faster R-CNN or Cascade R-CNN, and the detection speed of all one-stage algorithms exceeded 35 frames per second. The Macro F1 scores of all the two-stage algorithms and two one-stage algorithms exceeded 0.700, and Cascade R-CNN_ResNet50 had the highest score when testing with two different test sets. Meanwhile, the Macro F1 scores of YOLOv3_DarkNet53 and YOLOv3_ResNet34 were only slightly lower than that of Cascade R-CNN. Probably because YOLOv3_ResNet34 only has 34 layers and fewer parameters, it had a faster detection speed in this study. However, the deeper network also brings the higher detection accuracy, and the Macro F1 of YOLOv3_DarkNet53 was slightly higher than that of YOLOv3_ResNet34, which reached 0.717 and 0.600 on the two test sets, respectively. From the perspective of Macro F1 and FPS, YOLOv3_DarkNet53 could be considered as the best one among all algorithms.
The detection speeds of algorithms based on YOLOv3 were very fast (Table 3), and the average FPS value of YOLOv3_DarkNet53 was 36.4 frames per second, about three times as much as that of Cascade_RCNN_ResNet50. For one-stage detection algorithms, faster detection speed usually means a certain loss of detection accuracy, but YOLOv3_DarkNet53 obtained the highest average mAP(0.5) (0.980) on D20_test_indoor among all selected algorithms, and the average mAP(0.5) on T20_field also reached 0.811, second only to Cascade_RCNN_ResNet50 (0.813). This result again suggested that the overall performance of YOLOv3_DarkNet53 was the best among all algorithms.
Meanwhile, it was found that YOLOv3_ResNet50_vd was significantly inferior to other algorithms (Table 3). Different from other algorithms, Paddle adds Deformable ConvNets (DCN) [44] in phase 3 of ResNet50 in YOLOv3_ResNet50_vd. The original intention of replacing standard convolution with deformable convolution was to improve its ability to adapt to the geometric changes of objects. However, the shape of fungal spores are considered one of the main classification bases so the deformable convolution layer may not be suitable for extracting features of spores. At the same time, this operation also put the non ROI into the feature map, which will affect the feature extraction. Although the second version of DCN added some mechanisms to reduce this impact, it could not fundamentally eliminate it.

3.3. Analysis of Model Performance on Two Types of Test Sets

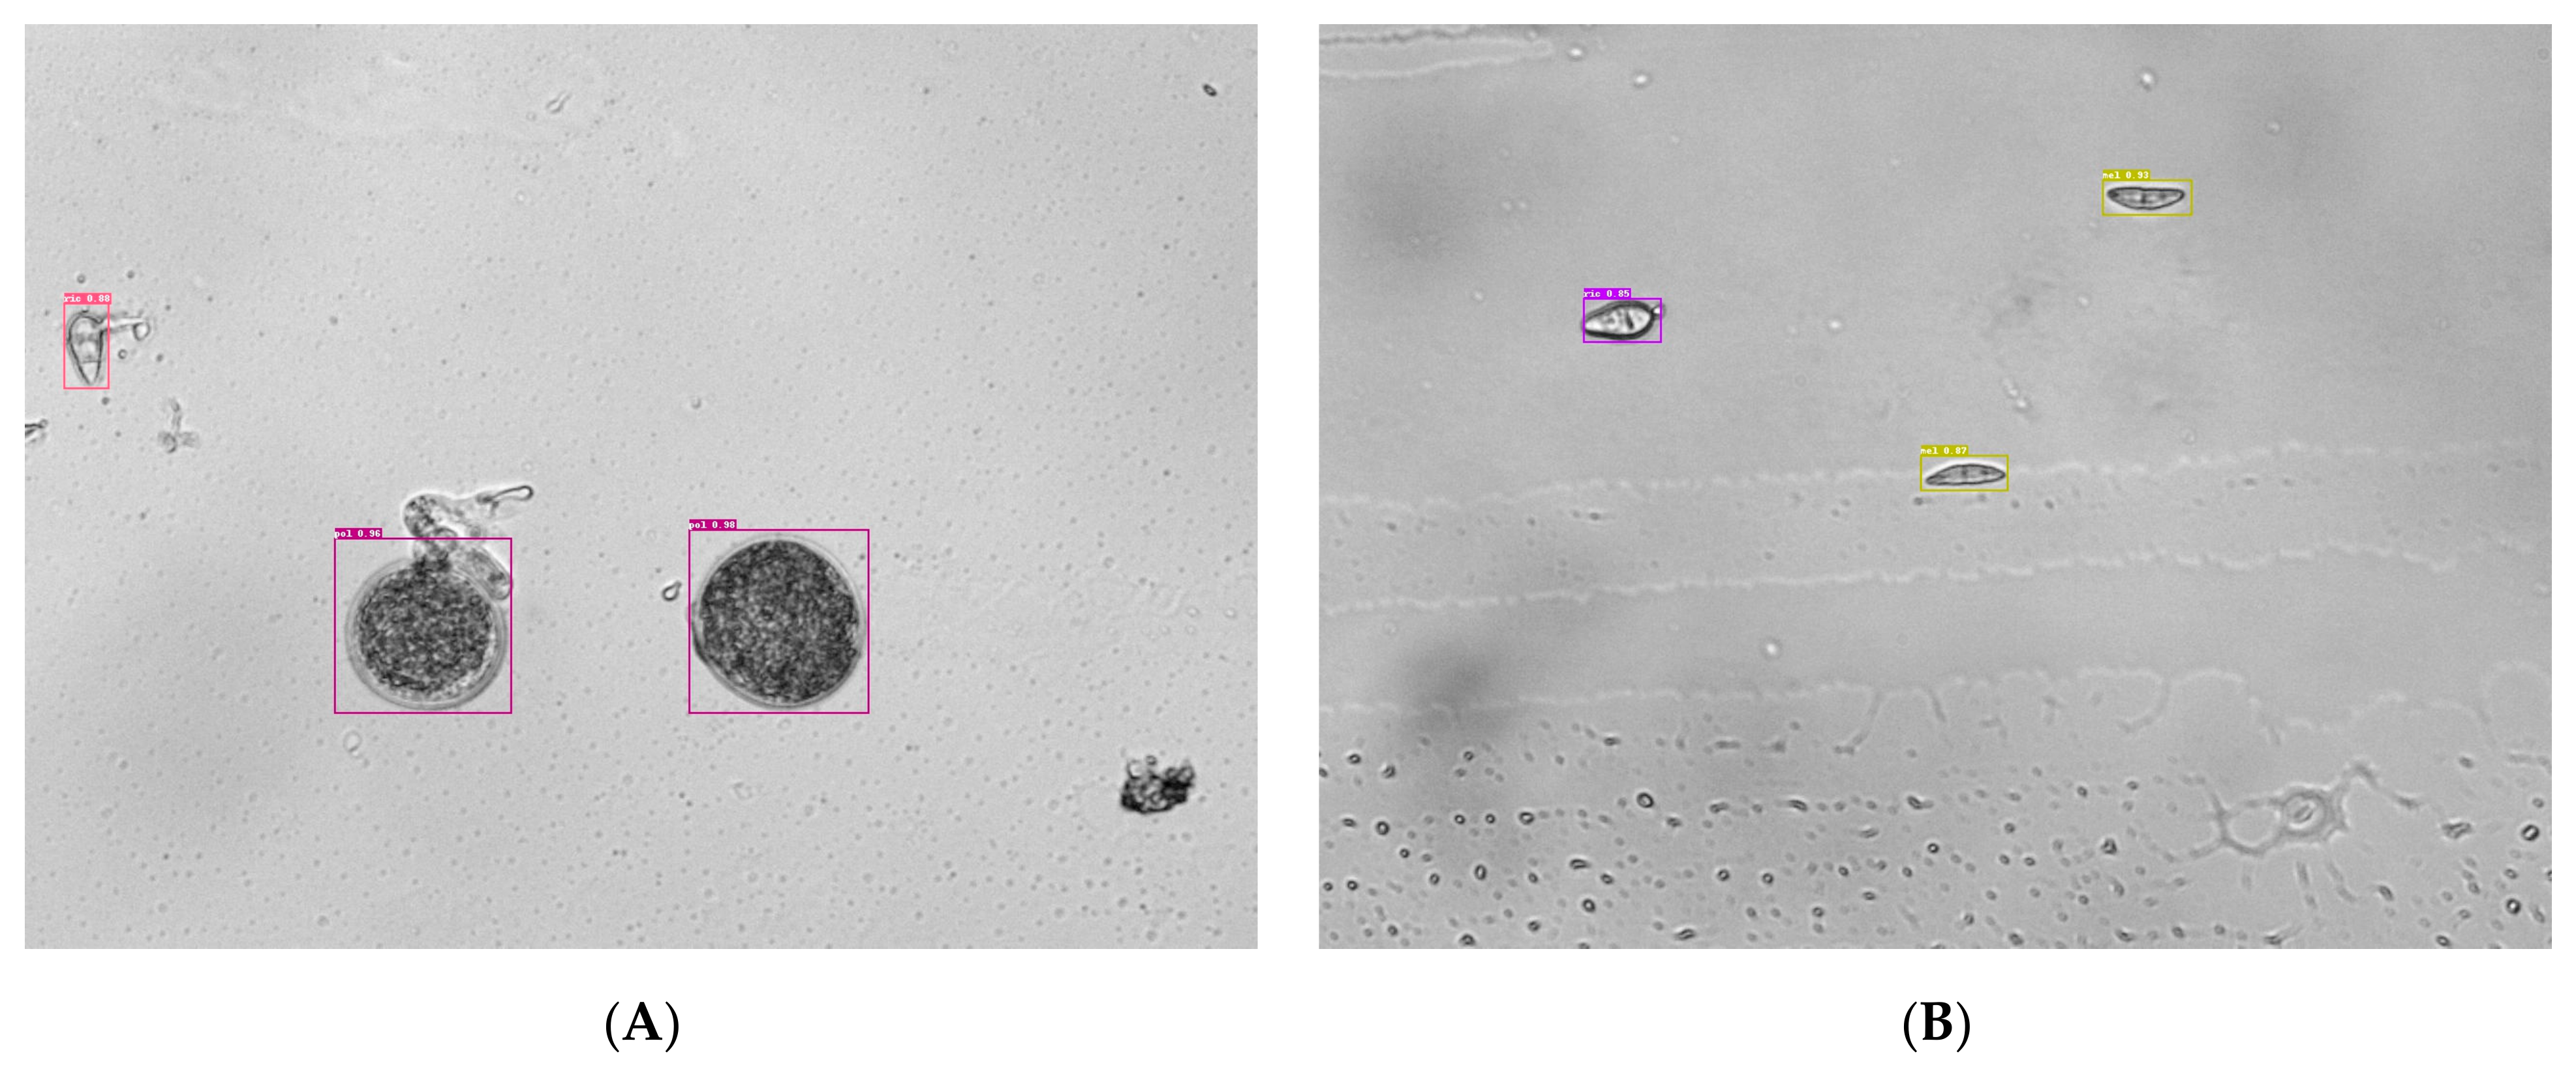
The results also revealed that the Macro F1 scores were much higher when the algorithms were tested on D20_test than the Macro F1 score obtained with the same algorithms on T20_field (Figure 7), and the independent-samples t-test showed a significant difference between the two groups (p < 0.05). The possible explanation might be that the variation sources in D20_test_indoor were consistent with those in the training set and validation set, the training effect of the model can be reflected properly by testing while T20_field collected by spore traps in the field might have more interfering factors that were not presented in training and validation datasets, and affected the recognition accuracy. For example, the trap could collect small insects or plant tissues in the air, as shown in Figure 8A. In addition, the spores collected in the field without cryopreservation might have shrunk due to dehydration or germinated to produce germ tubes (Figure 8A). For another example, the existence of petroleum jelly, which was coated on the glass slide to enhance spore trapping efficiency, could also lead to unclear outer contour of spores (Figure 8B). This was similar to the finding by Ferentinos [45], who also found that evaluating models by using test sets that were not part of the same database as the training set could result in a substantial reduction in model performance. This illustrated that the training dataset should include data from different sources and shooting conditions, so that the models trained can be applied in a wider range of applications. The good thing is that even when models trained with indoor images were tested with T20_field, four object detection algorithms using three different frameworks had a mAP(0.5) of 0.8, and the highest mAP(0.5) reached 0.822 for YOLOv3_ResNet34 (Table 3). It suggested that the spore detection models by using deep learning-based object detection algorithms were capable of producing robust detection performance, and could perform well after changing to the test set collected in the field scene.

3.4. Detection Performance Comparison on M. oryzae Conidia

The results demonstrated the excellent detection ability of the deep object detection for rice blast fungus spores (Table 3). Among the nine object detection algorithms, the method based on Cascade R-CNN had the best performance on the detection of ric, when D20_test_indoor was used as a test set, the average mAP_ric(0.5:0.95) reached the highest 0.741, which was twice as high as that of YOLOv3_ResNet50_vd. When the test set was changed to T20_field, the mAP of all object detection algorithms for ric decreased. The two algorithms based on Cascade R-CNN were still the best among the nine algorithms, the mAP_ric(0.5:0.95) reached 0.586, and YOLOv3_DarkNet53 was the best among the five algorithms based on YOLOv3, mAP_ric(0.5:0.95) was up to 0.527. Among the three frameworks, Faster R-CNN had the largest decline, suggesting that this framework might have poor generalization ability when encountering different types of datasets.
Since mAP_ric(0.5:0.95) was the average value of the detection precision of ric under the condition of setting different thresholds, the value should be lower than mAP_ric(0.5). However, the research purpose of this study was to quantify the ric, as long as accurate classification and localization were achieved, there was no need to fully overlap with the ground truth boundary box. In much research of object detection, the threshold of mAP was usually set to 0.5. In this study, the performance of mAP_ric(0.5) and mAP(0.5) on the same object detection algorithm should be consistent, because ric accounted for a relatively large proportion of the overall objects, as the dataset was constructed with ric as the most important detection object. Thus, the mAP(0.5) of most object detection algorithms on the two test sets reached 0.900 and 0.700, respectively (Table 3). It could be verified from the side that if the threshold was set as 0.5, mAP_ric(0.5) should also be greatly improved from mAP_ric(0.5:0.95).

3.5. Performance Comparison with Previous Studies

In this study, as the main detection objects were conidia of rice blast fungus, and correctly classifying different fungus spores and pollen is one of the most important tasks for monitoring the airborne pathogen spores in the field, other interfering particles were also labeled and detected, alongside the rice blast fungus spores. By using mAP(0.5) as one of the main evaluation indicators, on the test set consisting of mixed spores that simulated field conditions, YOLOv3_DarkNet53 achieved the highest mAP value of 0.980. Meanwhile, this algorithm only took about 0.03 s to detect a single image, which meant that this algorithm could handle about 2000 images every minute. Unlike deep learning-based spore detection algorithms, the main focus of traditional machine learning algorithms was to detect a single spore class, which had relatively lower detection difficulty [5,6]. Although the lowest detection rate among the three previous studies reached 0.940 [28,29,30], there were many problems, such as the models could not be applied to detect mixed spore images directly and had much lower detection efficiency (Table 4). Therefore, according to the results of this study, for the task of monitoring conidia inoculum of rice blast fungus in the field, the deep object detection algorithms are more applicable and effective.

4. Conclusions

In this study, microscopic image sets containing a total of 10,409 images of conidia of M. oryzae, three impurity spores and rice pollens were constructed. The dataset included not only the spore images obtained from indoor environment culture, but also the microscopic images collected using spore traps in the complex rice field environments, and should be a meaningful data resource for the spore microscopic image detection of crop disease pathogens. The results of this study indicated that the object detection algorithm based on deep learning has a great potential to detect conidia of M. oryzae mixed with other classes. This model can be deployed to a rice blast monitoring system as a reference to predict the new infection of rice blast. Meanwhile, it may also be a good choice to automatically detect and count the spores of mel, bet and str. Rather than detecting a single type of spore, it can distinguish four different types of spores and rice pollens at the same time, which has a variety of application prospects.
However, though we have fully demonstrated the feasibility of deep learning based object detection algorithms in mixed spore detection, there are still some crucial issues that remain to be tackled before we can proceed to apply the proposed model in real-world scenarios. Firstly, although YOLOv3_DarkNet53 has a high detection speed, its advantage in detection precision is not very obvious when compared with some other two-stage object detection models. Further investigations are required regarding the balance between the detection speed and the detection precision. At the same time, we mainly discussed the detection speed and accuracy of the model in this study, while the number of model parameters will significantly affect the computational efficiency of the model. Optimizing the model parameters without affecting the recognition accuracy can further improve the speed of model training and reduce the size of the model, which can be embedded into some lightweight devices such as mobile phones. Our results indicated that the YOLO series algorithms have better overall performance. Therefore, it will be a logical next step to test all algorithms of the YOLO series in the future and to improve the overall performance of the model via structural optimization and hyper-parameter fine-tuning. In addition, all the models we used in this study may not perform well when facing unseen datasets collected in the field. Therefore, in order to improve the practicability of the proposed method, we plan to expand the dataset by adding more images of in-field rice blast conidia and use some digital image processing methods such as image enhancement for constructing a high-quality dataset to further improve the generalization capability of models for detecting M. oryzae spores in a complex rice field environment.

Author Contributions

Conceptualization, H.Z. and B.W.; methodology, H.Z.; software, H.Z.; validation, Q.L. and D.H.; formal analysis, H.Z. and D.C.; investigation, H.Z. and Q.L.; data curation, H.Z. and D.C.; writing—original draft preparation, H.Z.; writing—review and editing, all authors; visualization, H.Z. and Q.L.; supervision, B.W. and Q.H.; funding acquisition, B.W, D.H. and Q.H. All authors have read and agreed to the published version of the manuscript.

Funding

This research was funded by the National Natural Science Foundation of China, grant number 31471727 and 61976097, the National Key Research and Development Program of China, grant number 2016YFD0300702 and 2023YFF0725005, and the Natural Science Foundation of Guangdong Province, grant number 2021A1515012203.

Data Availability Statement

The data presented in this study are available on request from the corresponding author.

Acknowledgments

We would like to thank Panjin Saline Alkali Land Utilization and Research Institute and Wuyuan Plant Protection Station for providing experimental fields in collecting rice disease fungal spores. And we also thank Guozhen Zhang and Xuehong Wu for providing us with three fungi samples.

Conflicts of Interest

The authors declare no conflicts of interest.

References

  1. Food and Agriculture Organization of the United Nations. Available online: https://www.fao.org/faostat/ (accessed on 1 December 2023).
  2. Deng, R.L.; Tao, M.; Xing, H.; Yang, X.L.; Liu, C.; Liao, K.F.; Qi, L. Automatic diagnosis of rice diseases using deep learning. Front. Plant Sci. 2021, 12, e701038. [Google Scholar] [CrossRef]
  3. Yang, N.; Hu, J.Q.; Zhou, X.; Wang, A.Y.; Yu, J.J.; Tao, X.Y.; Tang, J. A rapid detection method of early spore viability based on AC impedance measurement. J. Food Process Eng. 2020, 43, e13520. [Google Scholar] [CrossRef]
  4. Fernandez, J.; Orth, K. Rise of a cereal killer: The biology of Magnaporthe oryzae biotrophic growth. Trends Microbiol. 2018, 26, 582–597. [Google Scholar] [CrossRef] [PubMed]
  5. Lei, Y.; Yao, Z.F.; He, D.J. Automatic detection and counting of urediniospores of Puccinia striiformis f. sp. tritici using spore traps and image processing. Sci. Rep. 2018, 8, e13647. [Google Scholar] [CrossRef] [PubMed]
  6. Wagner, J.; Macher, J. Automated spore measurements using microscopy, image analysis, and peak recognition of near-monodisperse aerosols. Aerosol Sci. Technol. 2012, 46, 862–873. [Google Scholar] [CrossRef]
  7. Zhao, Z.Q.; Zheng, P.; Xu, S.T.; Wu, X.D. Object detection with deep learning: A review. IEEE Trans. Neural Netw. Learn. Syst. 2019, 30, 3212–3232. [Google Scholar] [CrossRef] [PubMed]
  8. Lowe, D.G. Distinctive image features from scale-invariant keypoints. Int. J. Comput. Vis. 2004, 60, 91–110. [Google Scholar] [CrossRef]
  9. Dalal, N.; Triggs, B. Histograms of oriented gradients for human detection. In Proceedings of the 2005 IEEE Conference on Computer Vision and Pattern Recognition, San Diego, CA, USA, 20–25 June 2005; IEEE: Piscateville, NJ, USA, 2005; pp. 886–893. [Google Scholar] [CrossRef]
  10. Wu, X.W.; Sahoo, D.; Hoi, S.C.H. Recent advances in deep learning for object detection. Neurocomputing 2020, 396, 39–64. [Google Scholar] [CrossRef]
  11. Yang, G.F.; Yang, Y.; He, Z.K.; Zhang, X.Y.; He, Y. A rapid, low-cost deep learning system to classify strawberry disease based on cloud service. J. Integr. Agric. 2022, 21, 460–473. [Google Scholar]
  12. Xiao, Y.Z.; Tian, Z.Q.; Yu, J.C.; Zhang, Y.S.; Liu, S.; Du, S.Y.; Lan, X.G. A review of object detection based on deep learning. Multimed. Tools Appl. 2020, 79, 23729–23791. [Google Scholar] [CrossRef]
  13. Liu, L.; Ouyang, W.L.; Wang, X.G.; Fieguth, P.; Chen, J.; Liu, X.W.; Pietikainen, M. Deep learning for generic object detection: A survey. Int. J. Comput. Vis. 2020, 128, 261–318. [Google Scholar] [CrossRef]
  14. Fu, L.; Feng, Y.; Wu, J.; Liu, Z.; Gao, F.; Majeed, Y.; Al-Mallahi, A.; Zhang, Q.; Li, R.; Cui, Y. Fast and accurate detection of kiwifruit in orchard using improved YOLOv3-tiny model. Precis. Agric. 2021, 22, 754–776. [Google Scholar] [CrossRef]
  15. Parvathi, S.; Selvi, S.T. Detection of maturity stages of coconuts in complex background using Faster R-CNN model. Biosyst. Eng. 2021, 202, 119–132. [Google Scholar] [CrossRef]
  16. Girshick, R.; Donahue, J.; Darrell, T.; Malik, J. Rich feature hierarchies for accurate object detection and semantic segmentation. In Proceedings of the 2014 IEEE Conference on Computer Vision and Pattern Recognition, Columbus, OH, USA, 23–28 June 2014; IEEE: Piscateville, NJ, USA, 2014; pp. 580–587. [Google Scholar] [CrossRef]
  17. He, K.M.; Zhang, X.Y.; Ren, S.Q.; Sun, J. Spatial pyramid pooling in deep convolutional networks for visual recognition. IEEE Trans. Pattern Anal. Mach. Intell. 2015, 37, 1904–1916. [Google Scholar] [CrossRef]
  18. Redmon, J.; Divvala, S.; Girshick, R.; Farhadi, A. You only look once: Unified, real-time object detection. In Proceedings of the 2016 IEEE Conference on Computer Vision and Pattern Recognition, Las Vegas, NV, USA, 27–30 June 2016; IEEE: Piscateville, NJ, USA, 2016; pp. 779–788. [Google Scholar] [CrossRef]
  19. Liu, W.; Anguelov, D.; Erhan, D.; Szegedy, C.; Reed, S.; Fu, C.Y.; Berg, A.C. SSD: Single shot multibox detector. In Proceedings of the 14th European Conference on Computer Vision, Amsterdam, The Netherlands, 11–14 October 2016; IEEE: Piscateville, NJ, USA, 2016; pp. 21–37. [Google Scholar] [CrossRef]
  20. Pham, M.T.; Courtrai, L.; Friguet, C.; Lefevre, S.; Baussard, A. YOLO-Fine: One-stage detector of small objects under various backgrounds in remote sensing images. Remote Sens. 2020, 12, 2501. [Google Scholar] [CrossRef]
  21. Zhang, Y.; Li, J.; Tang, F.; Zhang, H.; Cui, Z.; Zhou, H. An automatic detector for fungal spores in microscopic images based on deep learning. Appl. Eng. Agric. 2021, 37, 85–94. [Google Scholar] [CrossRef]
  22. Simonyan, K.; Zisserman, A. Very deep convolutional networks for large-scale image recognition. arXiv 2014, arXiv:1409.1556. [Google Scholar] [CrossRef]
  23. Ren, S.Q.; He, K.M.; Girshick, R.; Sun, J. Faster R-CNN: Towards real-time object detection with region proposal networks. IEEE Trans. Pattern Anal. Mach. Intell. 2017, 39, 1137–1149. [Google Scholar] [CrossRef]
  24. Kubera, E.; Kubik-Komar, A.; Kurasinski, P.; Piotrowska-Weryszko, K.; Skrzypiec, M. Detection and recognition of pollen grains in multilabel microscopic images. Sensors 2022, 22, 2690. [Google Scholar] [CrossRef]
  25. Lin, T.Y.; Goyal, P.; Girshick, R.; He, K.; Dollár, P. Focal loss for dense object detection. In Proceedings of the 2017 IEEE International Conference on Computer Vision, Venice, Italy, 22–29 October 2017; IEEE: Piscateville, NJ, USA, 2017; pp. 2999–3007. [Google Scholar] [CrossRef]
  26. Shakarami, A.; Menhaj, M.B.; Mahdavi-Hormat, A.; Tarrah, H. A fast and yet efficient YOLOv3 for blood cell detection. Biomed. Signal Process. Control 2021, 66, e102495. [Google Scholar] [CrossRef]
  27. Redmon, J.; Farhadi, A. YOLOv3: An Incremental Improvement. arXiv 2018, arXiv:1804.02767. [Google Scholar] [CrossRef]
  28. Yang, N.; Qian, Y.; EL-Mesery, H.S.; Zhang, R.B.; Wang, A.Y.; Tang, J. Rapid detection of rice disease using microscopy image identification based on the synergistic judgment of texture and shape features and decision tree-confusion matrix method. J. Sci. Food. Agric. 2019, 99, 6589–6600. [Google Scholar] [CrossRef]
  29. Wang, Z.; Chu, G.; Wang, J.; Huang, X.; Gao, F.; Ding, X. Spores detection of rice blast by IKSVM based on HOG features. Trans. Chin. Soc. Agric. Mach. 2018, 49, 387–392, (In Chinese with English Abstract). [Google Scholar] [CrossRef]
  30. Qi, L.; Jiang, Y.; Li, Z.; Ma, X.; Zheng, Z.; Wang, W. Automatic detection and counting method for spores of rice blast based on micro image processing. Trans. Chin. Soc. Agric. Eng. 2015, 31, 186–193, (In Chinese with English Abstract). [Google Scholar] [CrossRef]
  31. Lee, S.H.; Goeau, H.; Bonnet, P.; Joly, A. New perspectives on plant disease characterization based on deep learning. Comput. Electron. Agric. 2020, 170, e105220. [Google Scholar] [CrossRef]
  32. Chen, J.D.; Chen, J.X.; Zhang, D.F.; Sun, Y.D.; Nanehkaran, Y.A. Using deep transfer learning for image-based plant disease identification. Comput. Electron. Agric. 2020, 173, e105393. [Google Scholar] [CrossRef]
  33. Jiang, J.L.; Liu, H.Y.; Zhao, C.; He, C.; Ma, J.F.; Cheng, T.; Zhu, Y.; Cao, W.X.; Yao, X. Evaluation of diverse convolutional neural networks and training strategies for wheat leaf disease identification with field-acquired photographs. Remote Sens. 2022, 14, 3446. [Google Scholar] [CrossRef]
  34. Feng, Q.; Xu, P.; Ma, D.; Lan, G.; Wang, F.; Wang, D.; Yun, Y. Online recognition of peanut leaf diseases based on the data balance algorithm and deep transfer learning. Precis. Agric. 2023, 24, 560–586. [Google Scholar] [CrossRef]
  35. Lin, T.Y.; Maire, M.; Belongie, S.; Hays, J.; Perona, P.; Ramanan, D.; Dollar, P.; Zitnick, C.L. Microsoft COCO: Common objects in context. In Proceedings of the 13th European Conference on Computer Vision, Zurich, Switzerland, 6–12 September 2014; IEEE: Piscateville, NJ, USA, 2014; pp. 740–755. [Google Scholar] [CrossRef]
  36. Girshick, R. Fast R-CNN. In Proceedings of the 2015 IEEE International Conference on Computer Vision, Santiago, Chile, 11–18 December 2015; IEEE: Piscateville, NJ, USA, 2015; pp. 1440–1448. [Google Scholar] [CrossRef]
  37. Cai, Z.W.; Vasconcelos, N. Cascade R-CNN: Delving into high quality object detection. In Proceedings of the 2018 IEEE Conference on Computer Vision and Pattern Recognition, Salt Lake City, UT, USA, 18–22 June 2018; IEEE: Piscateville, NJ, USA, 2018; pp. 6154–6162. [Google Scholar] [CrossRef]
  38. He, K.M.; Zhang, X.Y.; Ren, S.Q.; Sun, J. Deep residual learning for image recognition. In Proceedings of the 2016 IEEE Conference on Computer Vision and Pattern Recognition (CVPR), Las Vegas, NV, USA, 26 June–1 July 2016; IEEE: Piscateville, NJ, USA, 2016; pp. 770–778. [Google Scholar] [CrossRef]
  39. He, T.; Zhang, Z.; Zhang, H.; Zhang, Z.Y.; Xie, J.Y.; Li, M. Bag of tricks for image classification with convolutional neural networks. In Proceedings of the 2019 IEEE Conference on Computer Vision and Pattern Recognition, Long Beach, CA, USA, 16–20 June 2019; IEEE: Piscateville, NJ, USA, 2019; pp. 558–567. [Google Scholar] [CrossRef]
  40. Howard, A.G.; Menglong, Z.; Chen, B.; Kalenichenko, D.; Weijun, W.; Weyand, T.; Andreetto, M.; Adam, H. MobileNets: Efficient convolutional neural networks for mobile vision applications. arXiv 2017, arXiv:1704.04861. [Google Scholar] [CrossRef]
  41. Howard, A.; Sandler, M.; Chu, G.; Chen, L.; Chen, B.; Tan, M.X.; Wang, W.J.; Zhu, Y.K.; Pang, R.M.; Vasudevan, V.; et al. Searching for MobileNetV3. In Proceedings of the 2019 IEEE International Conference on Computer Vision, Seoul, Republic of Korea, 27 October–2 November 2019; IEEE: Piscateville, NJ, USA, 2019; pp. 1314–1324. [Google Scholar] [CrossRef]
  42. Fraiwan, M.; Faouri, E.; Khasawneh, N. Classification of corn diseases from leaf images using deep transfer learning. Plants 2022, 11, 2668. [Google Scholar] [CrossRef] [PubMed]
  43. Gogoi, M.; Kumar, V.; Begum, S.A.; Sharma, N.; Kant, S. Classification and detection of rice diseases using a 3-Stage CNN architecture with transfer learning approach. Agriculture 2023, 13, 1505. [Google Scholar] [CrossRef]
  44. Zhu, X.Z.; Hu, H.; Lin, S.; Dai, J.F. Deformable ConvNets v2: More deformable, better results. In Proceedings of the 2019 IEEE Conference on Computer Vision and Pattern Recognition, Long Beach, CA, USA, 16–20 June 2019; IEEE: Piscateville, NJ, USA, 2019; pp. 9300–9308. [Google Scholar] [CrossRef]
  45. Ferentinos, K.P. Deep learning models for plant disease detection and diagnosis. Comput. Electron. Agric. 2018, 145, 311–318. [Google Scholar] [CrossRef]
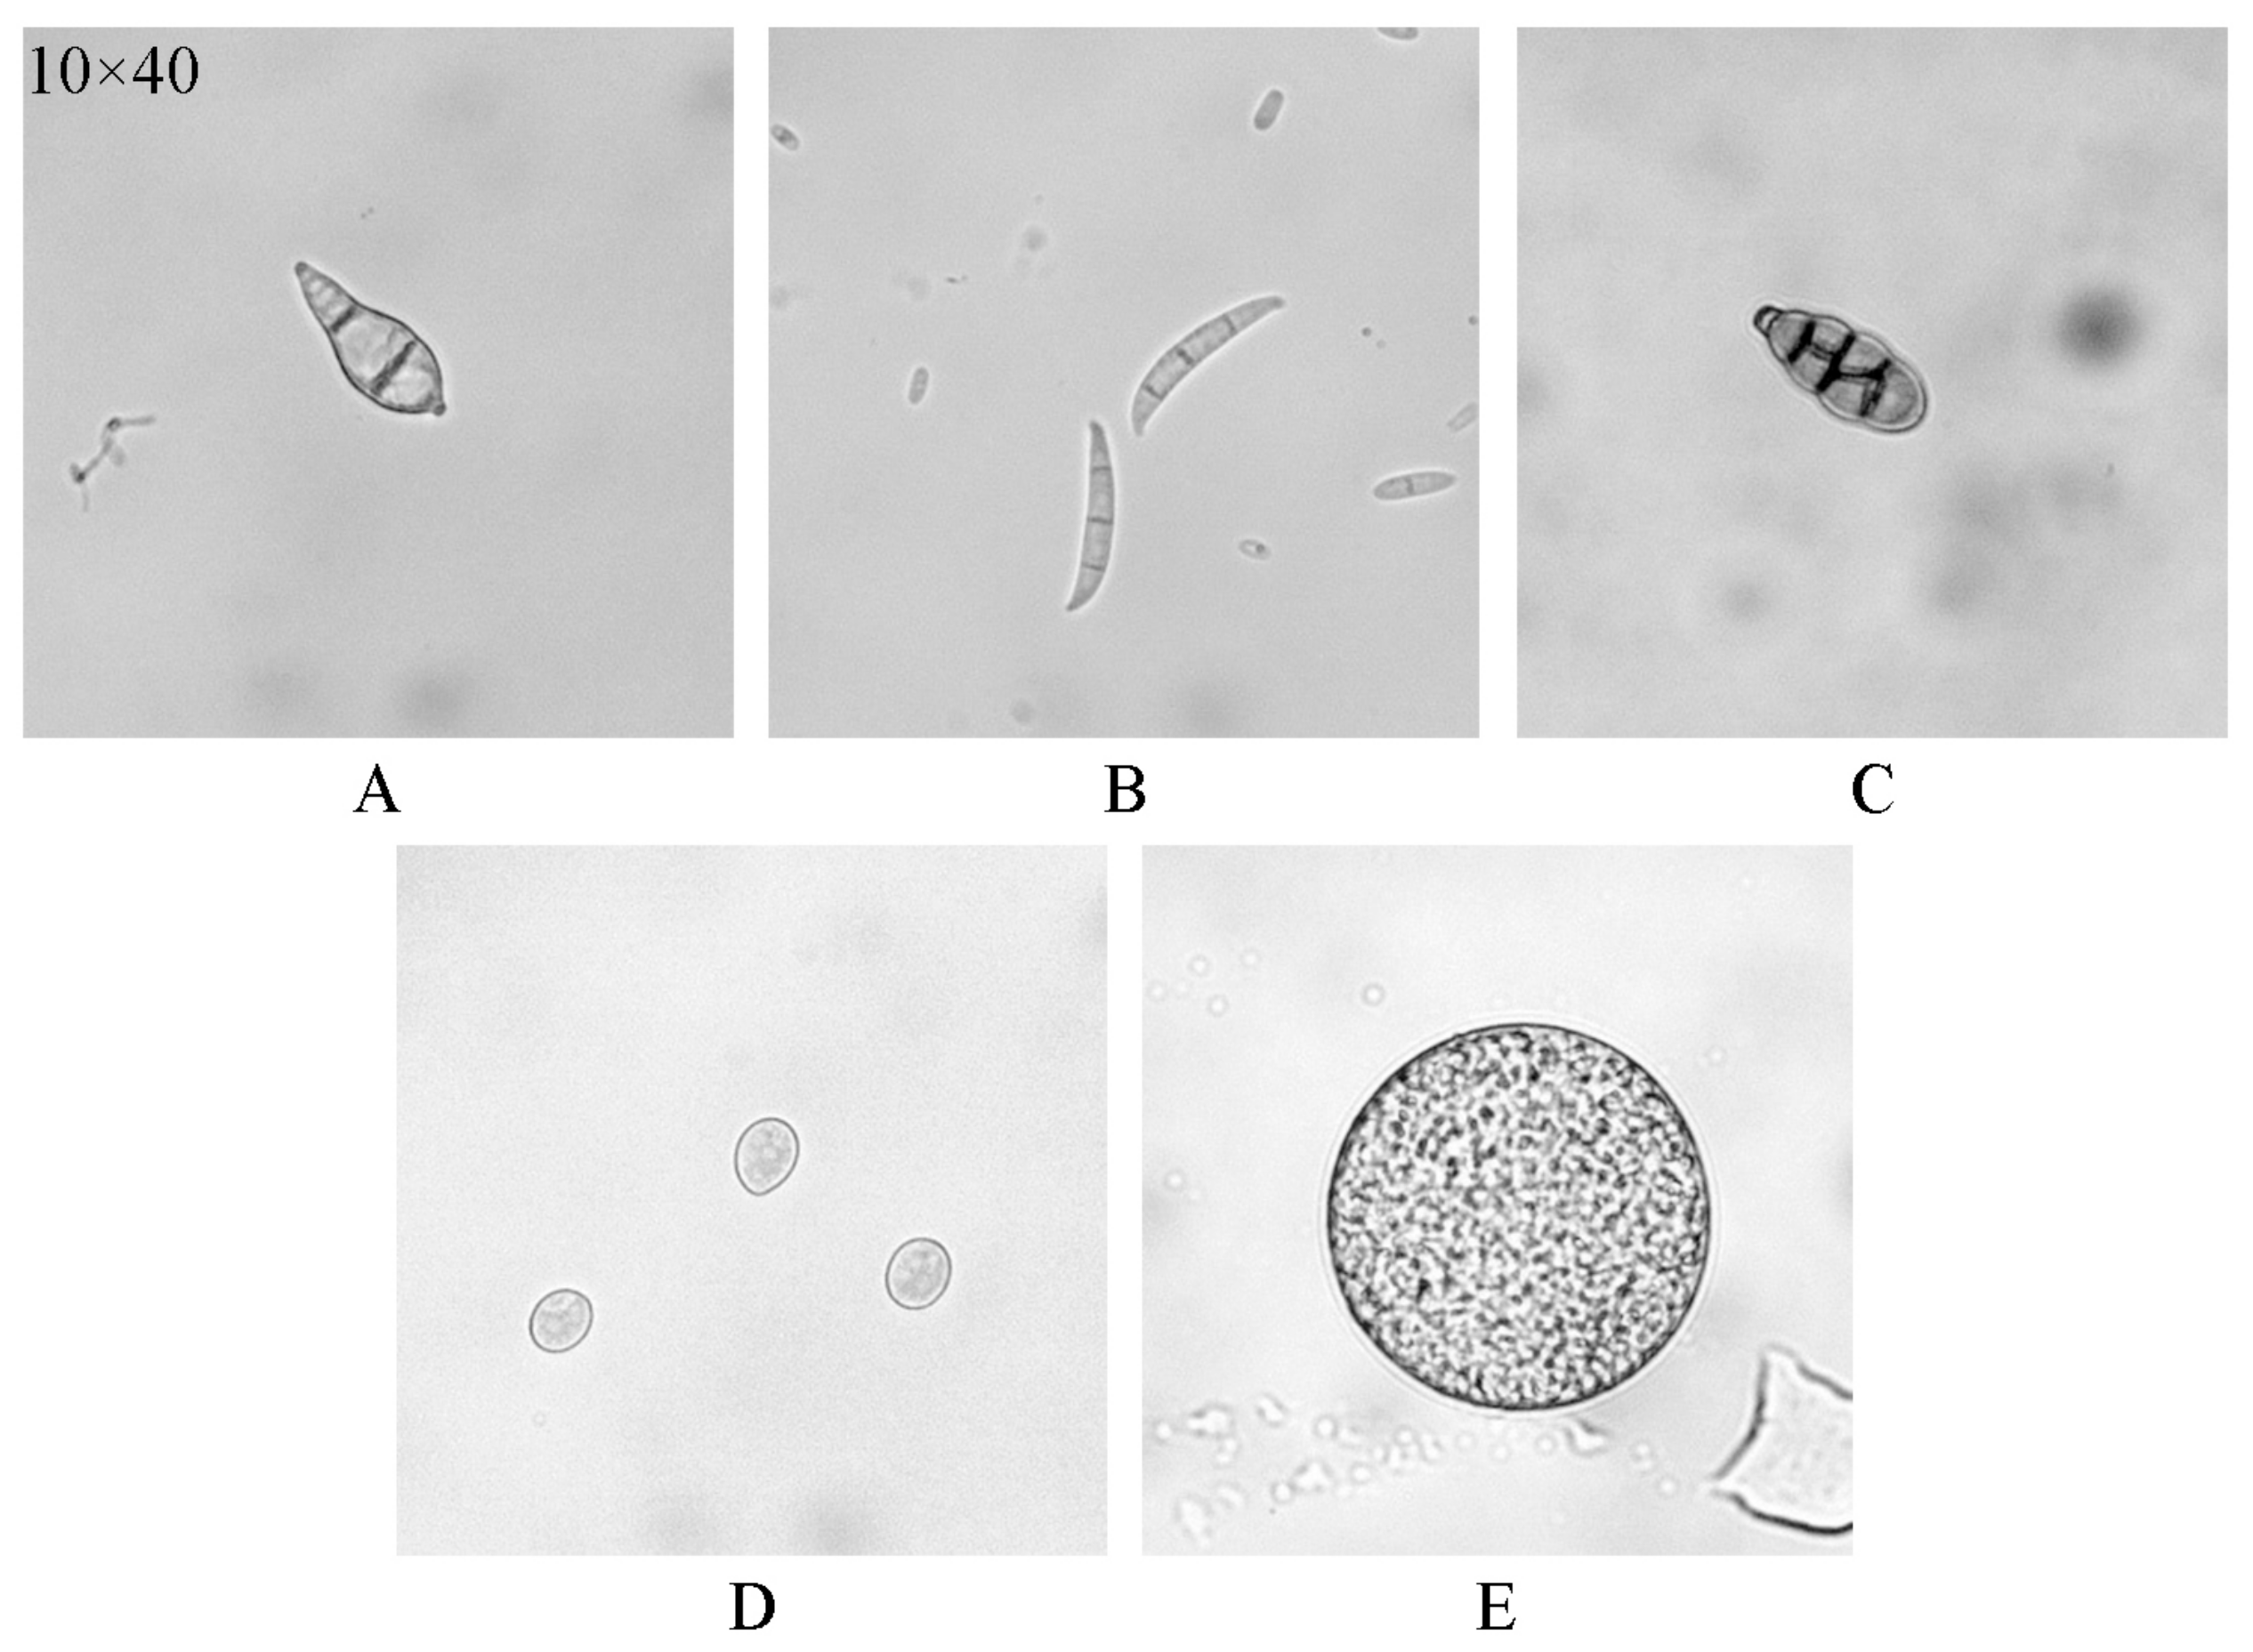
Figure 1. Image examples of M. oryzae conidia and other four impurity particles: (A) M. oryzae, ric; (B) Fusarium spp., mel; (C) Alternaria spp., bet; (D) Botrytis spp., str; (E) Rice pollen, pol.
Agriculture 14 00290 g001
Figure 2. Image examples of fungal spores and rice pollens captured under different conditions in the self-built datasets.
Agriculture 14 00290 g002
Figure 3. The process of constructing the datasets of M. oryzae conidia and other four impurity particles under indoor and field conditions.
Agriculture 14 00290 g003
Figure 4. Overall flowchart of object detection framework for four classes of fungal spores and rice pollens in the rice field.
Agriculture 14 00290 g004
Figure 5. Validation results of pre-trained models by training with D40.
Agriculture 14 00290 g005
Figure 6. Compare the influence of pre-trained weights on the test result of object detection algorithms.
Agriculture 14 00290 g006
Figure 7. The comprehensive performance of different object detection algorithms. (Markers with the same shape represent the same test set, and markers with the same color represent the same object detection algorithm. The closer the marker is to the upper right, the better the performance of the object detection algorithm. The YOLOv3_DarkNet53 was considered as the best model among the nine models based on its comprehensive performance).
Agriculture 14 00290 g007
Figure 8. The output examples of T20_field test set by using the Yolov3_DarkNet53 model: (A) ric and pol; (B) ric and mel; (C) ric and bet; (D) ric and str.
Agriculture 14 00290 g008aAgriculture 14 00290 g008b
Table 1. (a) Single object datasets of rice blast fungus conidia and other impurities in 10 × 40 field. (b) Multiple objects datasets of rice blast fungus conidia and other impurities in 10 × 20 field.
(a)
ric 1mel 2bet 3str 4pol 5
D40_Train15201425146514411316
D40_Validation380357366360329
(b)
Datasetsricric&melric&betric&strric&polpol
D20_Train200200200200/100
D20_Validation50505050/25
D20_test_indoor50505050/25
T20_field2020202020/
1 M. oryzae; 2 Fusarium spp., 3 Alternaria spp., 4 Botrytis spp., 5 rice pollen.
Table 2. Hyper-parameter setting of pre-trained models and object detection algorithms during training.
Pre-Trained ModelsObject Detection Algorithms
Epochs100100
Initial learning rate0.10.001
Milestone 130, 60, 9050, 80
Warmup steps 2/4000
Batch_size324
Pretrained weightFalseTrue/False
Input sizedefaultdefault
1 At the node learning rate will decrease to 0.1 of the previous value; 2 At the beginning of training, the learning rate gradually increases from 0 to the initial value with the number of steps required.
Table 3. Comparison of different object algorithms with mAP of all classes and M. oryzae.
ModelsPre-Train 1FPS
(f/s)
mAP(0.5)mAP_ric(0.5:0.95)
D20_Test_
Indoor
T20_FieldD20_Test_
Indoor
T20_Field
Cascade_RCNN_
ResNet50
True11.50.9760.8120.7390.586
False11.70.9690.8130.7420.546
ave11.60.973 20.8130.7410.566
Cascade_RCNN_
ResNet 50_vd
True11.40.9530.7890.7100.513
False11.60.9630.7760.7190.504
ave11.50.9580.7830.7150.509
Faster_RCNN
_ResNet34
True20.10.9670.8040.6940.451
False19.20.9690.8010.6960.469
ave19.60.9680.8030.6950.460
Faster_RCNN
_ResNet50_vd
True3.50.9460.7760.7150.416
False3.50.9540.7960.7220.468
ave3.50.9500.7860.7190.442
Yolov3_ResNet34True42.40.9800.8220.7020.504
False42.50.9780.8000.6760.499
ave42.50.9790.8110.6890.502
Yolov3_ResNet50_vdTrue36.80.8220.6630.4230.300
False36.50.7130.6540.3760.342
ave36.70.7680.6590.4000.321
Yolov3_
DarkNet53
True35.00.9790.8180.7050.527
False37.70.9800.8030.6940.506
ave36.40.9800.8110.7000.517
Yolov3_MobileNetv1True42.00.9240.6920.6130.431
False43.30.9450.7450.6120.441
ave42.70.9350.7190.6130.436
Yolov3_MobileNetv3_largeTrue42.50.9660.7270.6500.476
False42.60.9390.7740.6230.477
ave42.60.9530.7510.6370.477
1 Pre-train means whether to use pre-trained weight at the beginning of object detection training. 2 The numbers marked in bold mean the top3 in the column.
Table 4. Summary of the performance of traditional spore detection algorithms in detecting rice blast fungus spores in previous research.
Data LocationDetection
Rate
Spore
Classes
Time
(s/f)
Test
Images
DT/
CM [28] 1
Table 40.940Rice blast spores and rice smut spores18500
HOG/
IKSVM [29] 2
Table 10.982Rice blast spores4.8150
FCM-Canny/
DT-GF-WA [30] 3
Table 10.985Rice blast spores/100
1 Decision tree/confusion matrix; 2 Histogram of oriented gradient/intersection kernel support vector machine; 3 Fuzzy c-means algorithm-Canny edge detection/distance transformation- gaussian filtering- watershed algorithm.
Disclaimer/Publisher’s Note: The statements, opinions and data contained in all publications are solely those of the individual author(s) and contributor(s) and not of MDPI and/or the editor(s). MDPI and/or the editor(s) disclaim responsibility for any injury to people or property resulting from any ideas, methods, instructions or products referred to in the content.