Article

Chitosan Regulates the Root Architecture System, Photosynthetic Characteristics and Antioxidant System Contributing to Salt Tolerance in Maize Seedling

1
College of Resources and Environment, Henan Agricultural University, Zhengzhou 450046, China
2
Department of Agronomy, Abdul Wali Khan University Mardan, Mardan 23200, Pakistan
3
College of Agronomy, Henan Agricultural University, Zhengzhou 450046, China
*
Authors to whom correspondence should be addressed.
These authors contributed equally to this work.
Agriculture 2024, 14(2), 304; https://doi.org/10.3390/agriculture14020304
Submission received: 17 January 2024 / Revised: 9 February 2024 / Accepted: 12 February 2024 / Published: 14 February 2024
(This article belongs to the Section Crop Production)

Abstract

:
Salinity is an obstacle to global agriculture, as it affects plant growth and development. Chitosan (CTS) has been suggested as a plant growth regulator to alleviate environmental stresses. In this study, the morphological and biochemical responses of chitosan application (75 mg L−1) on maize seedling growth under salt stress (150 mM) were conducted with a hydroponic experiment. The results exhibited that CTS application effectively recovered salt-inhibited biomass accumulation and root architecture by increasing chlorophyll content and photosynthetic assimilation and reducing sodium content in shoots and roots by 25.42% and 5.12% compared with NaCl treatment. Moreover, salt-induced oxidative stress was alleviated by CTS application by increasing the activities of antioxidant enzymes of superoxide dismutase, catalase, ascorbate peroxidase, peroxidase and content of ascorbate. Correlation analysis and partial least squares (PLS) analysis revealed that root morphology and ascorbate play key roles for maize seedlings in response to salt stress. Based on these results, CTS application is recommended as an effective approach to enhance the tolerance of maize seedlings under salt stress.

1. Introduction

Salt stress poses a significant environmental threat as an abiotic stressor in contemporary agriculture, exerting detrimental influences on plant growth and global crop productivity [1]. Human-driven agricultural practices, including extensive irrigation and the over-clearance of vegetation, expedite the process of salinization, resulting in a detrimental effect on crop growth [2,3]. The Food and Agriculture Organization (FAO) reported that more than 6% of total land area and a minimum of 20% of irrigated land globally are subjected to salt-related issues [3,4]. Additionally, salt has detrimental effects on seed germination, photosynthetic performance, ion homeostasis, and crop yield [3], which can be attributed to salt-induced oxidative stress, destruction of chloroplast structure, and inhibition of key metabolic pathways [5,6,7,8]. With the increasing degradation of arable land and the escalating frequency of extreme weather events, it has become imperative to comprehend and mitigate the adverse effects of salt stress on crops [9]. In recent years, diverse strategies have been explored to mitigate the deleterious impact of salt stress on plants, including plant growth regulators [10,11], plant hormones [12,13,14], nanoparticles [15,16,17], nutrient elements [18,19], and aqueous extracts [20].
Chitosan (CTS), a naturally occurring biopolymer derived from chitins through partial deacetylation, has found application in agriculture as a growth promoter. This can be attributed to several characteristics: non-toxicity, biocompatibility, biodegradability and renewability from cost-effective resources [9,21,22,23]. Chitosan initiates numerous defense mechanisms to bolster plant tolerance against a spectrum of biotic and abiotic stressors, encompassing drought [24,25,26], cold [27], salt [10,22,28], and water-related challenges [29]. It has been demonstrated that chitosan application helped to increase chlorophyll content, consequently improving tomato growth under salt-induced stress conditions [22]. Yang et al. (2009) [24] found that the application of chitosan improved the antioxidant enzyme activities, thereby improving the capacity to eliminate excessive reactive oxygen species (ROS), and consequently mitigating lipid peroxidation in drought-stressed apple seedlings. Pretreatment with chitosan could alleviate the decline in photosynthetic rate and increase the antioxidant enzyme activities (superoxide dismutase (SOD), peroxidase (POD), catalase (CAT)), thereby minimizing oxidative damage in order to improve the creeping bentgrass tolerance under salt stress [30]. Zhang et al. (2023) demonstrated that chitosan effectively declined hydrogen peroxide (H2O2) and malondialdehyde (MDA) levels, while also improving photosynthetic characteristics and SOD and POD activities, thereby alleviating cadmium toxicity in wheat seedlings [31]. Chitosan effectively mitigated negative effects, increasing biomass accumulation and reducing the levels of hydrogen peroxide (H2O2) and malondialdehyde (MDA), as well as lowering the osmolyte contents (proline, total soluble sugars). These impacts increased SOD and APX activities in such a way as to reduce oxidative stress in sorghum [11].
Maize (Zea mays L.), a staple crop globally, exhibits sensitivity to salt stress [32]. Liu et al. (2023) [33] found that the application of exogenous chitosan effectively enhanced drought tolerance, which was attributable to the reduction in MDA contents, the improvement of ascorbate (AsA) and glutathione (GSH) contents, the modification of the photosynthetic system and the promotion of root architecture. Chitosan possesses the capacity to decrease the contents of superoxide radical (O2) and H2O2, but enhances antioxidant enzyme activities and increases the contents of AsA and GSH, thereby improving antioxidant ability to alleviate growth inhibition induced by cadmium stress and enhance cadmium tolerance [34,35]. Chitosan only barely effectively improved drought tolerance, as evidenced by increasing plant height and chlorophyll contents, reducing the levels of electrolyte leakage and MDA, and enhancing anatomical characteristics [29]. Despite the increasing interest in the role of chitosan in stress mitigation, its precise mechanisms of action in stimulating root architecture and improving photosynthesis under salt-induced stress in maize seedlings remain relatively unclear. Therefore, this study aims to investigate the potential of chitosan in minimizing salt-induced limitations of maize growth and development. Through an assessment of their impact on root morphology, photosynthetic efficiency and antioxidant defense mechanisms in maize under salt stress, this research endeavors to provide valuable insights for sustainable crop management practices in challenging environmental settings.

2. Materials and Methods

2.1. Plant Materials, Growth Conditions and Experimental Design

Zhengdan 958, a commonly cultivated variety in the Huanghuai summer corn-producing region of China, was utilized in this experiment. A hydroponic experiment was conducted in a relatively controlled environment chamber following the seed germination and cultivation procedures detailed in our prior study [33]. Within an individual hydroponic box (34 × 25 × 12 cm) filled with 2 L of nutrient solution, nine uniformly sized plants with similar shoot height and root length were cultivated, and six hydroponic boxes were designated for each experimental treatment. Upon reaching the three-leaf stage, four treatments were applied to the seedlings as delineated below: (1) control group (CK)-plants grown in a nutrient solution devoid of CTS and NaCl; (2) NaCl group (S)-plants grown in a nutrient solution containing 150 mM NaCl; (3) CTS group (CTS)-plants grown under conditions mirroring the control group, with an addition of 75 mg L−1 CTS; (4) CTS + NaCl group (CTS + S)-plants grown under conditions similar to the NaCl group, supplemented with 75 mg L−1 CTS. The water-soluble carboxylated chitosan (CTS) was added to the nutrient solution, which was described in a previous study [31,36]. The formula of nutrient solution is macro elements (mM): 6mM KNO3, 4 mM Ca(NO3)2·4 H2O, 2 mM MgSO4·7 H2O, 1 mM NaH2PO4; micro elements (μM): 46.1 μM H3BO3, 9.1 μM MnCl2·4 H2O, 0.76 μM ZnSO4·7 H2O, 0.32 μM CuSO4·5 H2O, 0.08 μM Na2MoO4·2 H2O, 100 μM EDTA-Fe. The Hogland nutrient solution was replenished every three days to ensure a continuous supply of nutrients, and after being treated for 7 days, all seedlings were harvested.

2.2. Plant Growth Parameters and Root Morphology

The seedlings were carefully excised from the joint of the shoot and root using a sterile scissor to further measure shoot height, main root length, fresh and dry weight in both shoot and root, and root morphological parameters. The main root length and shoot height were measured by using a ruler calibrated with a precision scale of 1.00 mm. Subsequently, samples in both root and shoot underwent thorough rinsing with deionized water, repeating the process 3–5 times. Root morphological characteristics were recorded utilizing a scanner (V700 PHOTO, Epson, Nagano, Japan). Data analysis was carried out using specialized image analysis software (WinRHIZOTM 2003b, Québec, QC, Canada) to determine various root morphological parameters, including total root length (RL), root average diameter (RD), root surface area (SA), total root volume (RV), root tips (RT), and root forks (RF). The root architecture was mainly categorized into four classes determined by the range of root diameter (RD): I class, 0 < RD < 0.5 mm; II class, 0.5 < RD < 1.0 mm; III class, 1.0 < RD < 1.5 mm; IV class, RD > 1.5 mm. Shoot and root dry weight were assessed by drying plant tissue for 30 min at 105 °C, then further drying at 70 °C for approximately 48 h. The samples were digested following the protocol outlined in Liu et al. (2023) [37]. The concentrations of Na in both shoot and root tissues were quantified using atomic absorption spectrophotometry (ZEEnit7010, Analytik Jena, Jena, Germany). Extra fresh samples in leaf and root tissues were stored at −80 °C for sequent analyses. The comprehensive evaluation of maize seedling tolerance was calculated as described in Liu et al. (2023) [37].
Root/shoot ratio = root dry weight/shoot dry weight
Tolerance index = dry weight of the treatment group (g plant−1)/dry weight of the control group (g plant−1) × 100%
U(X) = (X − Xmin)/(Xmax − Xmin) (measure index were positive with tolerance index)
U(X) = 1 − (X − Xmin)/(Xmax − Xmin) (measure indexes were negative with tolerance index)

2.3. Determination of Photosynthetic Efficiency and Photosynthetic Pigments

There were some photosynthetic characteristics, encompassing photosynthetic rate (Pn), intercellular CO2 concentration (Ci), stomatal conductance (Gs), and transpiration rate (Tr) of the foremost expanded leaf at maize apex, determined by utilizing a portable photosynthesis system (Li-6400, LICOR Inc., Lincoln, NE, USA) prior to the harvesting phase. All measurements were conducted within specified environmental conditions: a leaf temperature kept at 25 °C; relative humidity maintained at 60 ± 5%; photosynthetic photon flux density established at 1000 µmol m−2 s−1; external CO2 concentration set at 500 µmol m−1. Three biological replications were employed for each treatment used. Stomatal limitation (Ls) value was calculated based on the photosynthetic parameters, following the equations outlined in our study [37].
The fully expanded maize leaves were meticulously sectioned into shortly crushed pieces. Subsequently, 0.5 g of fresh maize leaves were immersed in 95% ethanol and kept at 25 °C. After 7 days, as the leaf color faded, the photosynthetic pigment contents, comprising chlorophyll a (Chla), chlorophyll b (Chlb) and total chlorophyll (TChl), were quantified spectrophotometrically with the absorbance recorded at 470 nm, 649 nm and 665 nm according to the method of Shi (2016) [38].

2.4. Measurement of Relative Electrolyte Conductivity, MDA, AsA Content

The level of relative electrolyte conductivity (REC) was measured according to the method of Hnilickova et al. (2019) [39]. Fresh maize samples (0.5 g) were homogenized with 5% trichloroacetic acid solution (TCA). Then, the homogenate was centrifuged at 10,000× g for 10 min at 4 °C (H2050R, XIANGYI, Shanghai, China), and the supernatant was used to the sequent quantification of malondialdehyde (MDA) and ascorbate (AsA). MDA content was determined using the thiobarbituric acid method (TBA) according to the method of Draper et al. (1993) [40]. Ascorbate content was assessed following the procedure outlined by Mukherjee and Choudhuri (1983) [41].

2.5. Detection of Soluble Protein and Antioxidant Enzymes

Frozen samples (0.5 g) were homogenized with 0.1 M potassium phosphate-buffered solution (pH 7.8), and homogenate was subsequently centrifuged at 12,000× g for 10 min at 4 °C. Then, the supernatant was transferred into another clean tube for subsequent quantification of soluble protein content and antioxidant enzyme activities. The contents of soluble protein content in leaf and root tissues were detected using Coomassie Brilliant Blue staining following the method outlined by Bradford (1976) [42]. Superoxide dismutase (SOD) activity was quantified utilizing the nitroblue tetrazolium method following the procedure by Beauchamp and Fridovich (1971) [43]. Catalase (CAT) activity was measured using the manner of Aebi (1984) [44]. Peroxidase (POD) activity determination was carried out following the method outlined by Maehly and Chance (1954) [45]. Ascorbate peroxidase (APX) activity was assessed according to the process of Nakano and Asada (1981) [46].

2.6. Statistical Analysis

The physiological and biochemical data of maize seedlings were shown as means ± standard deviation (SD), derived from three biological replications. The statistical analysis encompassed one-way analysis of variance with Tukey’s test (SPSS v.18.0, IBM Inc., Chicago, IL, USA), where the significance of data was established at p values of ≤ 0.05. Graphs were illustrated utilizing Origin 2018 software (OriginLab Corp., Northampton, MA, USA). Further, principal component analysis (PCA) and correlation analysis were performed using MetaboAnalyst 5.0. Accuracy was quantitatively assessed, and primary factors were identified by utilizing the variable importance for projection (VIP) within the partial least squares (PLS) plug-in unit in MATLAB R2012a.

3. Result

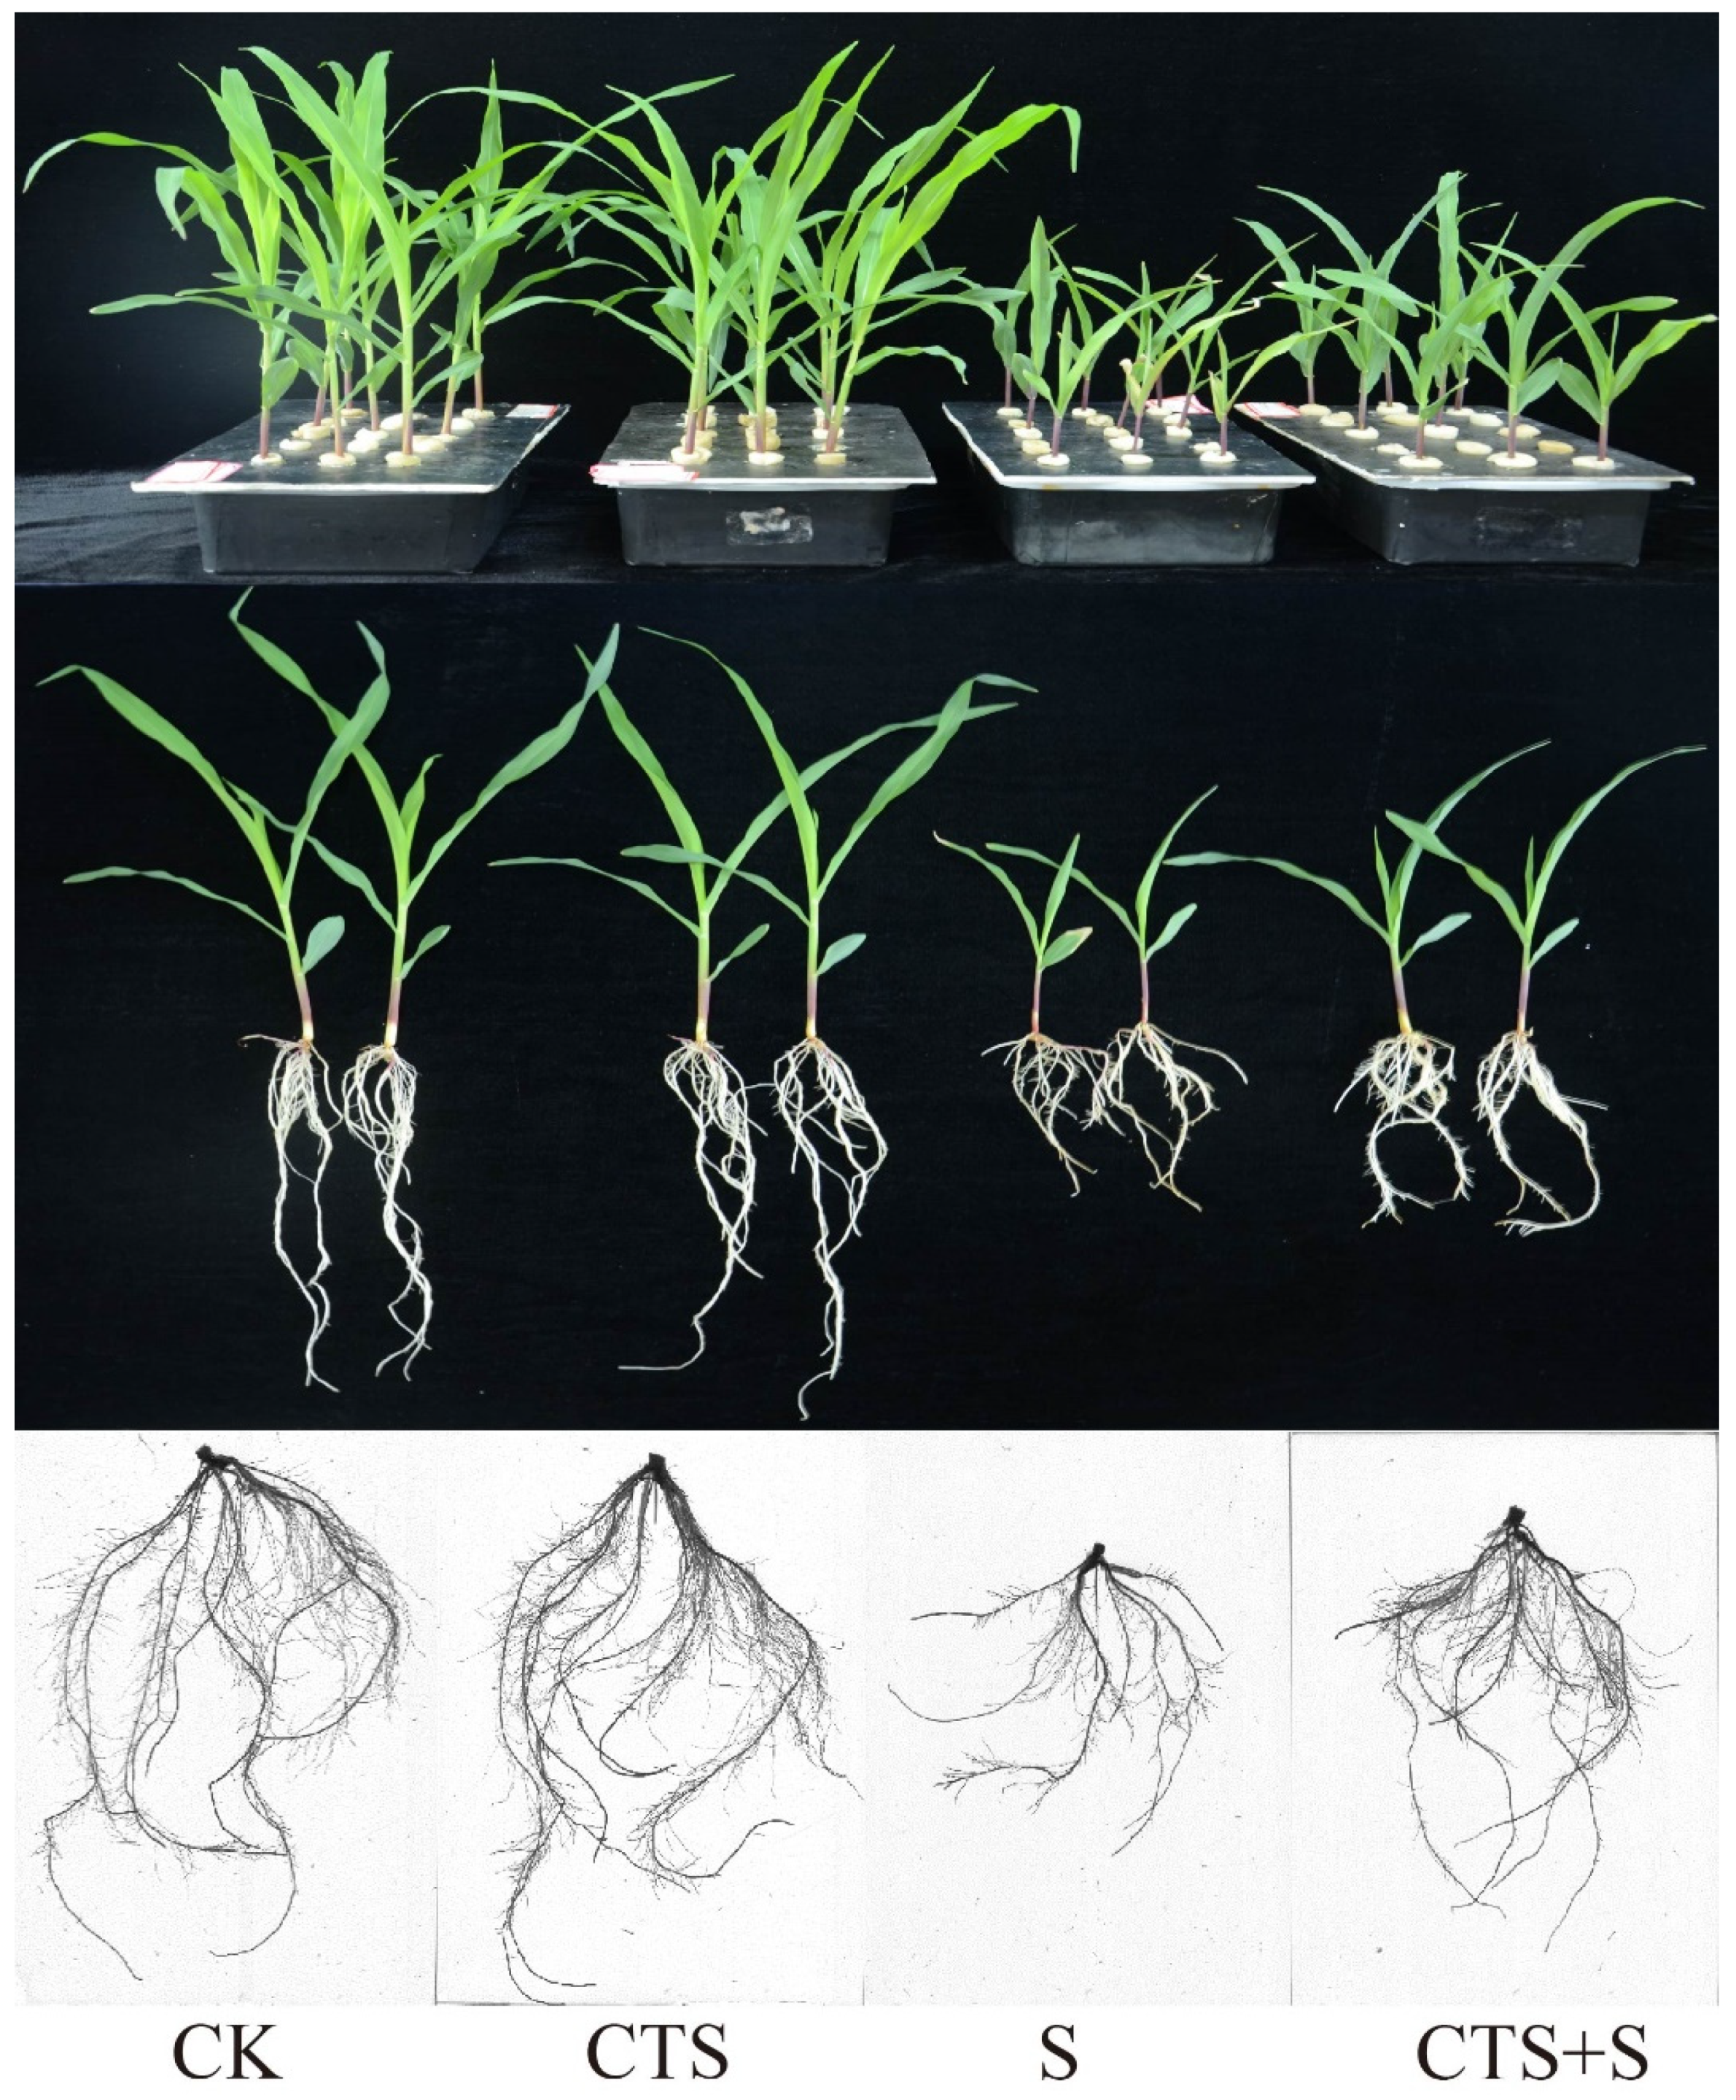
3.1. Effect of Exogenous CTS on Biomass, Plant Height and Main Root Length of Maize Seedlings under Salt Stress

Under salt stress, maize seedlings reduced the maize leaf area, presenting a diminutive and yellowish appearance, which was concomitant with a diminished root system characterized by shorter and fewer roots, leading to evident inhibition in overall plant growth (Figure 1). In comparison to the control treatment (CK), maize seedlings exposed to salt stress exhibited a significant inhibition in plant growth (p < 0.05), as evidenced by reductions in plant height, main root length, fresh weight (FW) and dry weight (DW) in shoot and fresh weight and dry weight in the root by 58.00%, 39.39%, 73.95%, 64.39%, 38.11%, and 27.99%, respectively (Table 1). The application of exogenous CTS at 75 mg L−1 alleviated the salt-induced growth inhibition in maize seedlings (Figure 1). In contrast to seedlings exposed solely to salt stress, supplementation with chitosan resulted in enhancements in plant height by 47.75%, main root length by 8.98%, fresh weight and dry weight in shoot by 68.45% and 60.86%, and fresh weight and dry weight in the root by 47.41% and 23.63%, respectively (Table 1). On the contrary, the root/shoot ratio of maize seedlings, which was improved by 101.38% under salt stress, experienced a decline of 22.76% following CTS application during salt stress. Additionally, the tolerance indexes in both shoot and root were decreased by 64.39% and 27.96%, respectively; nevertheless, CTS + S treatment significantly ameliorated the tolerance indexes in both shoot and root by 60.86% and 23.69%, respectively (p < 0.05) (Table 1).

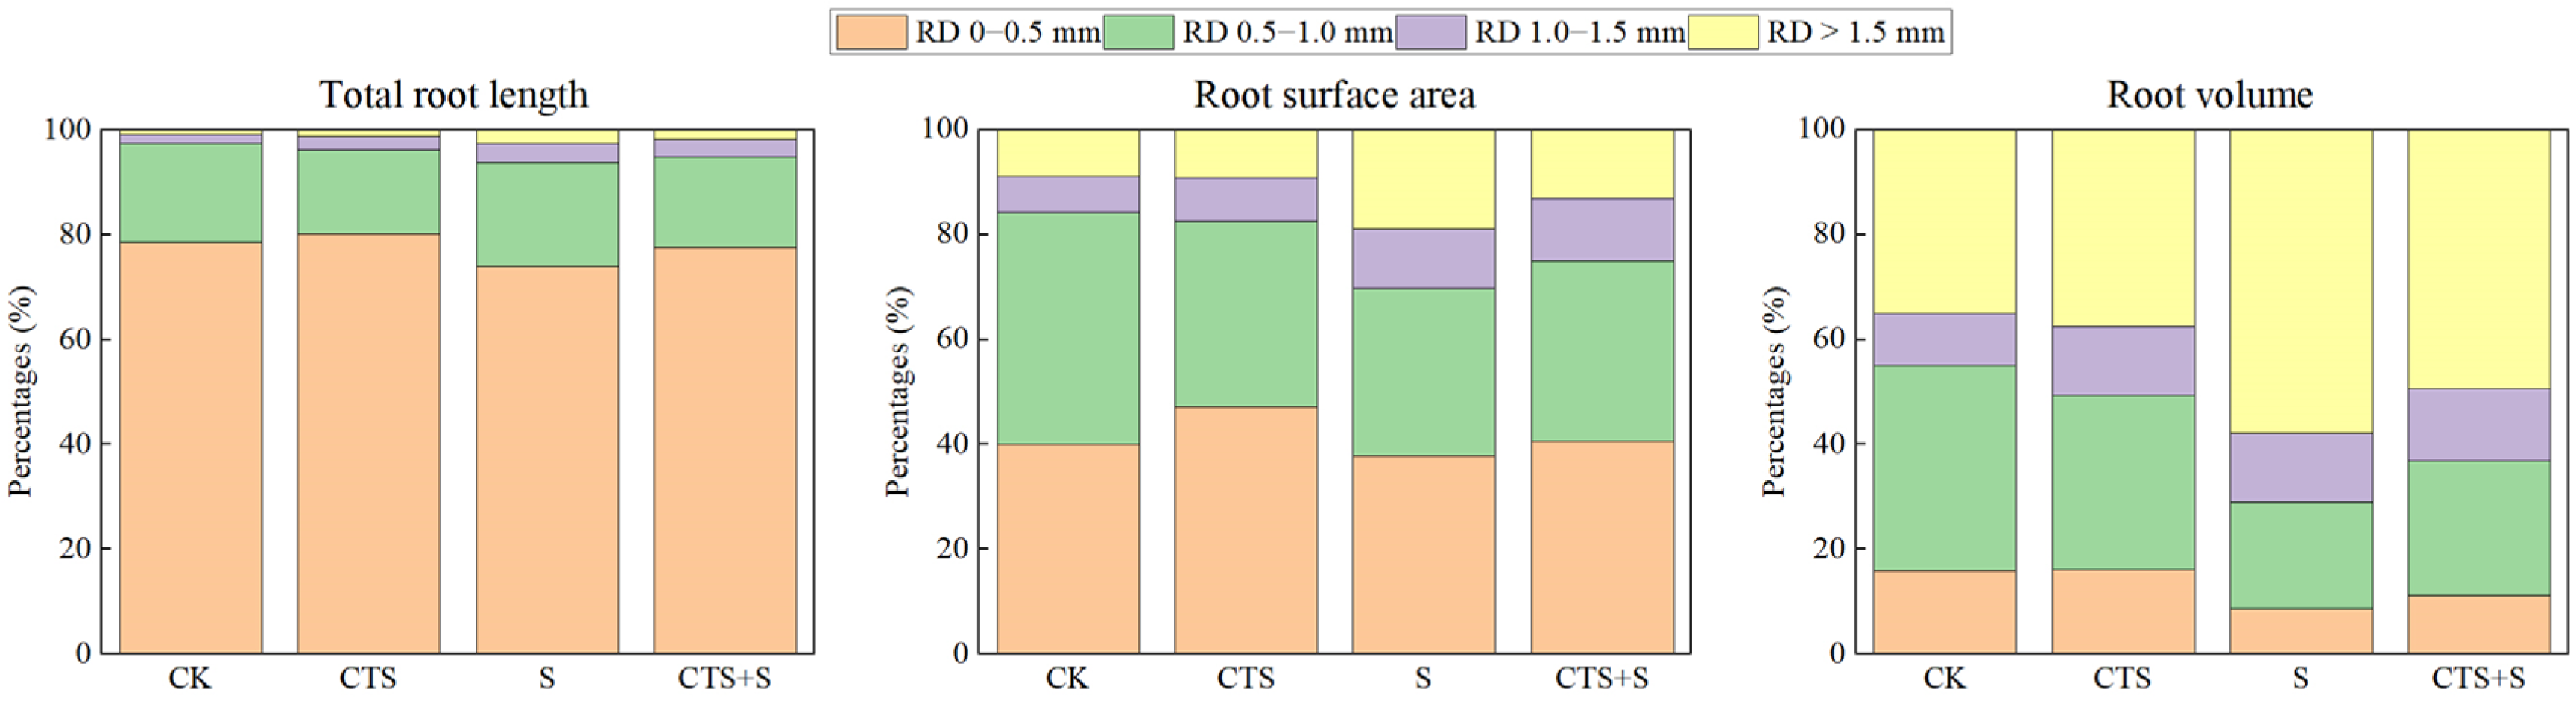
3.2. Effect of Exogenous CTS on the Characteristic Parameters of Root Growth of Maize Seedlings under Salt Stress

In comparison to CK, root characteristic parameters, such as RL, SA, RV, RT, and RF, experienced substantial reductions of 57.50%, 47.43%, 28.83%, 64.91% and 42.87% under salt stress, respectively (Table 2). Remarkably, the average diameter of maize seedlings was significantly increased by 29.10% under S treatment. After the application of exogenous CTS, the parameters (excluding average diameter) in the CTS + S treatment exhibited significant increases of 102.78%, 80.96%, 59.42%, 82.38% and 84.13%, compared with the single salt treatment, respectively (p < 0.05). Furthermore, compared to the CK treatment, the classes of I to III (0 < RD < 1.5 mm) in RL, SA and RV were both decreased, but the IV class (RD > 1.5 mm) of RL, SA and RV showed improvements under salt stress by 16.10%, 25.08%, and 14.82%, respectively (Table 2). Following CTS application, all classes of RL, SA and RV were both increased under salt stress ranging from 40.38% to 114.86%, 20.79% to 90.83%, and 47.07% to 123.26%, compared with the single salt treatment, respectively (Table 2).
Additionally, salt treatment resulted in a reduction in the percentage of the I class of RL, SA and RV in maize seedlings by 5.91%, 5.34%, and 45.81%, compared with the control treatment, respectively (Figure 2). Conversely, in comparison to CK, the percentages of the III and IV classes of RL, SA and RV were increased, with the IV class experiencing enhancements under salt stress by 170.84%, 116.63%, and 64.59%, respectively. Compared with the salt treatment, the percentages of II to IV classes of RL declined by 32.98% to 256.89%, except for the percentage of the I class, which rose by 371.99% under CTS + S treatment. In contrast, under CTS + S treatment, the percentages of I to III classes of SA and RV were increased by 58.47% to 270.30% and 65.31% to 529.84%, respectively, except for the percentages of the IV class, which were decreased by 595.53% and 849.31%, respectively.

3.3. Effect of Exogenous CTS on Salt Concentration of Maize Seedlings under Salt Stress

As depicted in Figure 3, in comparison to the CK treatment, the S treatment significantly increased the concentrations of Na in both shoot and root tissues by 156.70% and 533.10%, respectively. Conversely, with the application of CTS under salt stress, there were reductions in Na concentration, decreasing by 25.42% and 5.12% in shoot and root, respectively.

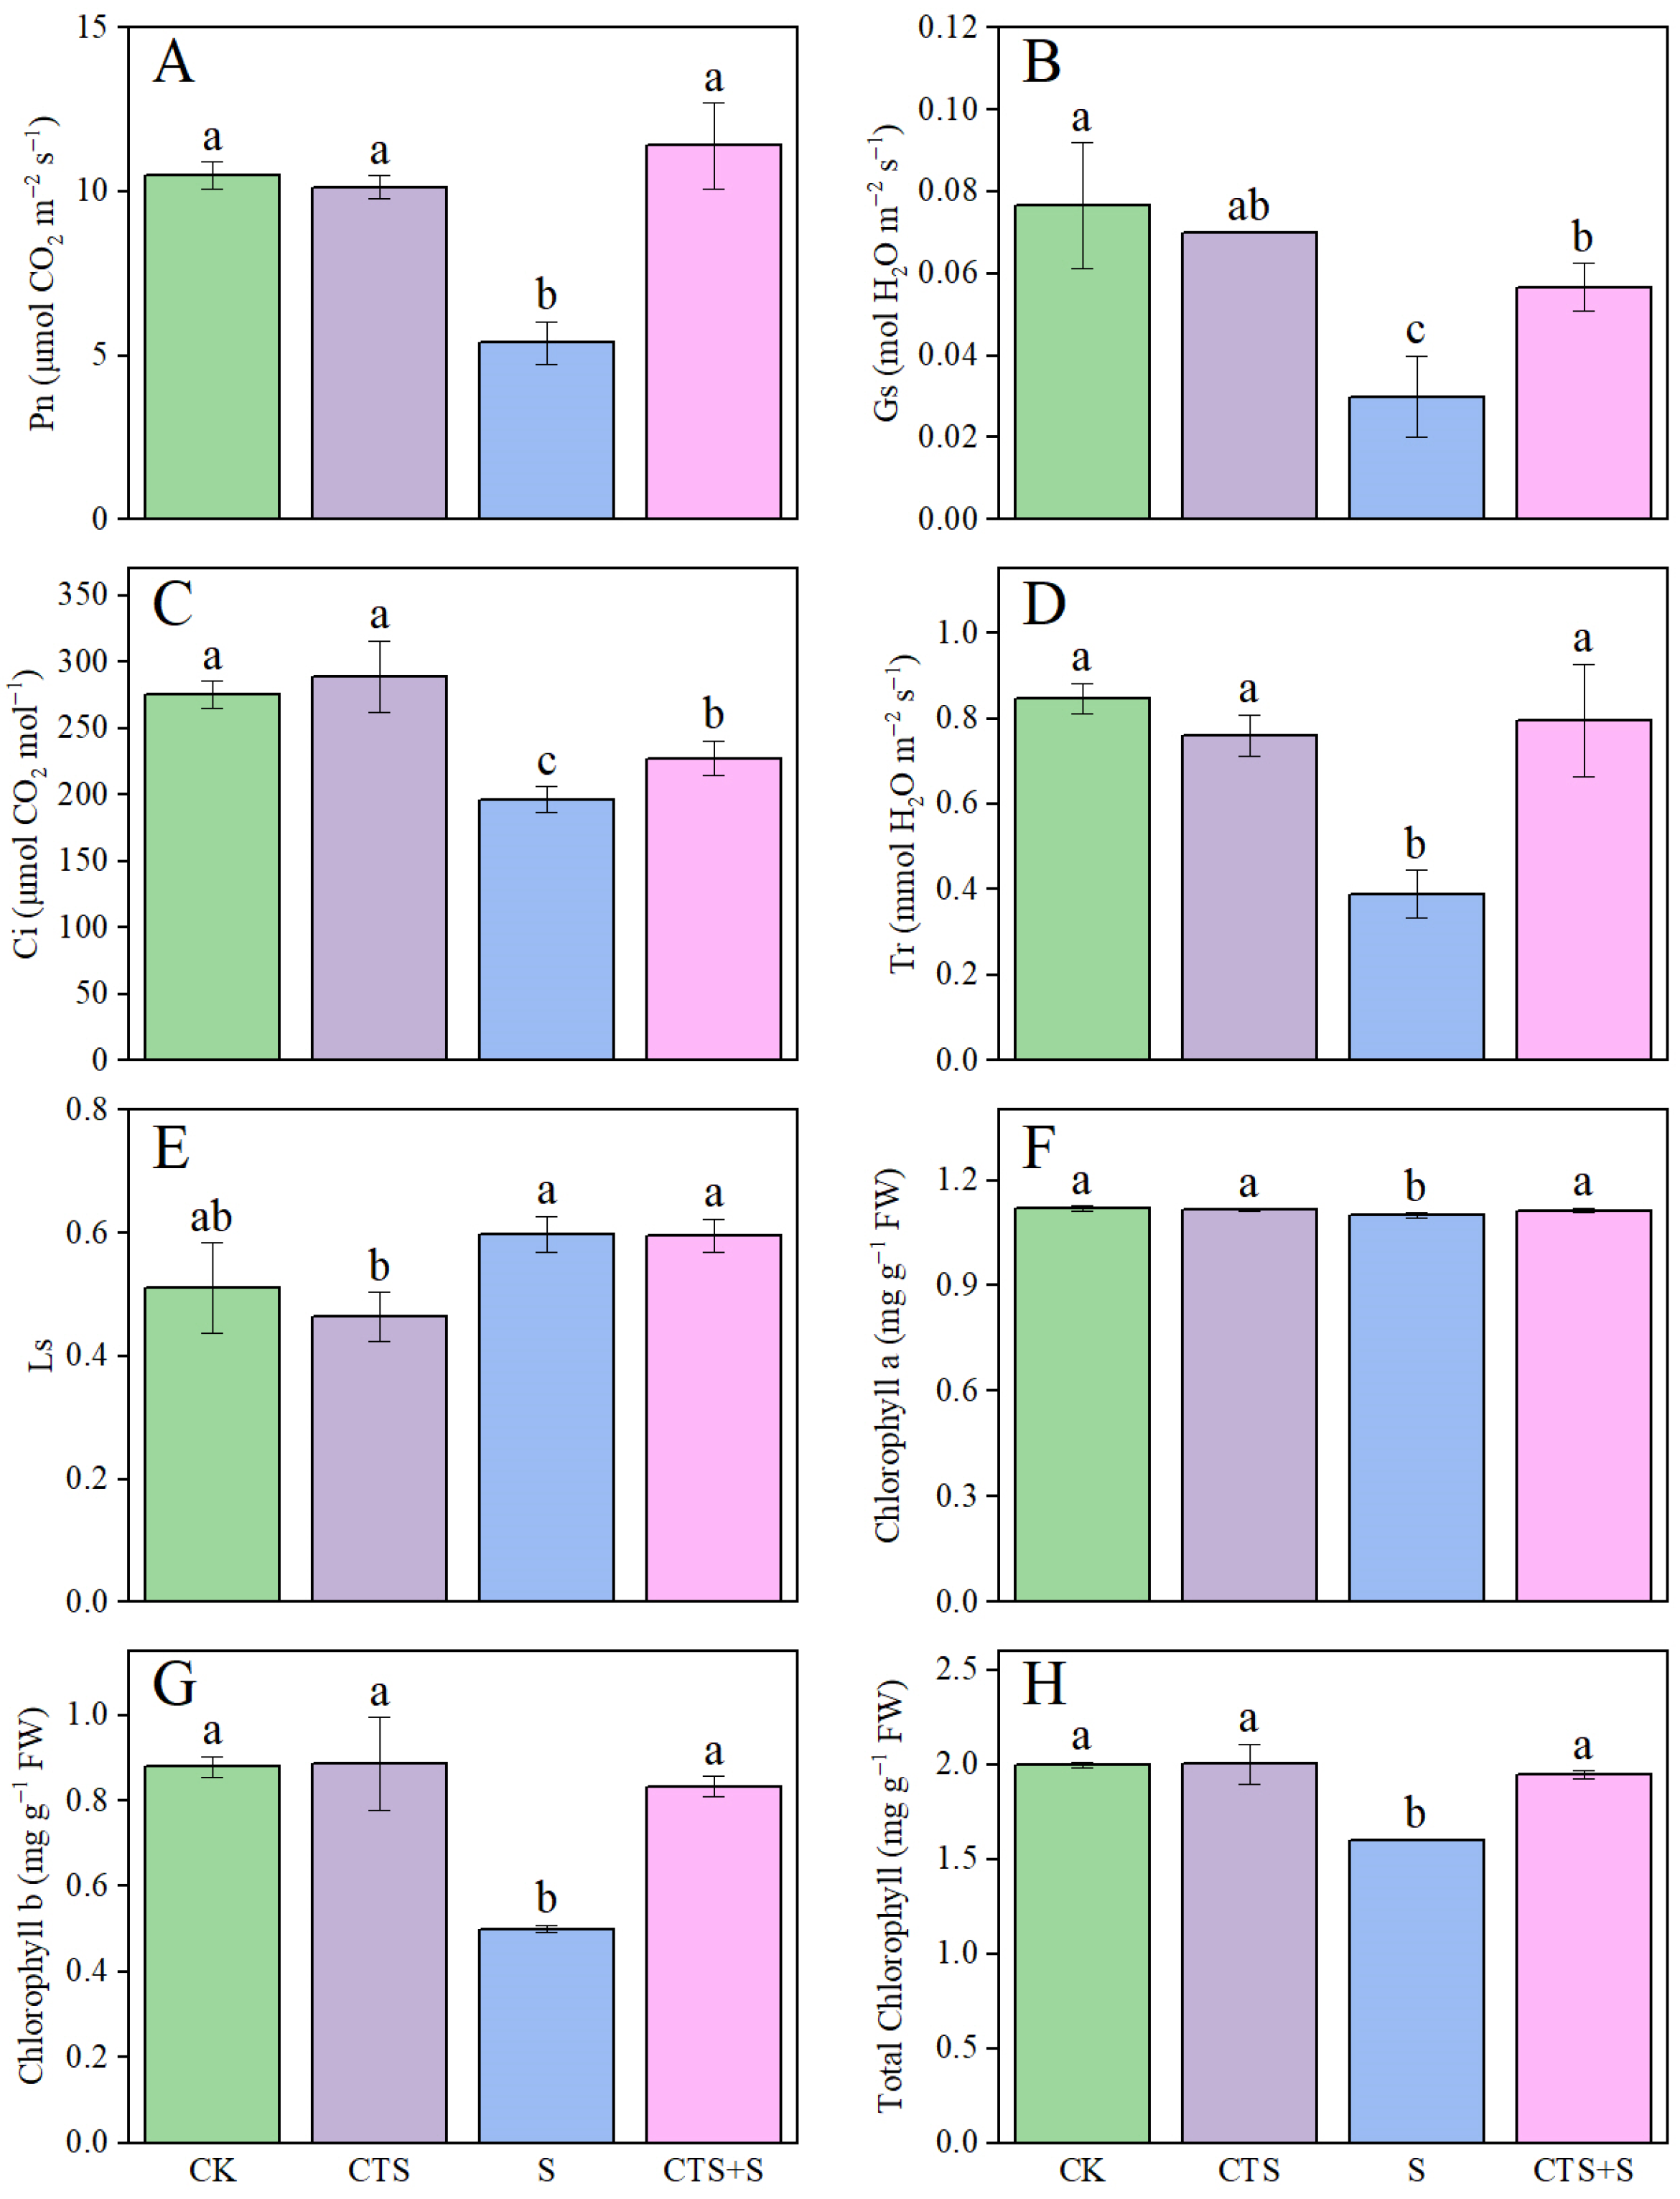
3.4. Effect of Exogenous CTS on Photosynthetic Characteristics and Pigment Contents of Maize Seedlings under Salt Stress

In comparison to the CK condition, the photosynthetic characteristics of Pn, Gs, Ci and Tr of maize seedling leaves exhibited reductions of 48.64%, 60.89%, 28.69%, and 54.04%, respectively (p < 0.05) (Figure 4). Notably, salt stress enhanced the stomatal limitation by 17.00%. However, the supplementation of exogenous CTS demonstrated varying degrees of improvement in Pn, Gs, Ci, and Tr parameters of maize seedlings under salt stress, resulting in increments of 111.63%, 89.00%, 15.86%, and 104.39%, respectively. Furthermore, the CTS + S treatment mitigated the stomatal limitation, showing a reduction of 0.42%.
In comparison to the CK condition, the pigments of Chla, Chlb and TChl contents were significantly declined under salt stress by 1.65%, 43.08%, and 19.88%, respectively (p < 0.05). However, subsequent to CTS treatment, there was a significant rise in the contents of Chla, Chlb and TChl under salt stress by 1.14%, 66.38%, and 21.52%, compared with the single salt treatment, respectively (p < 0.05).

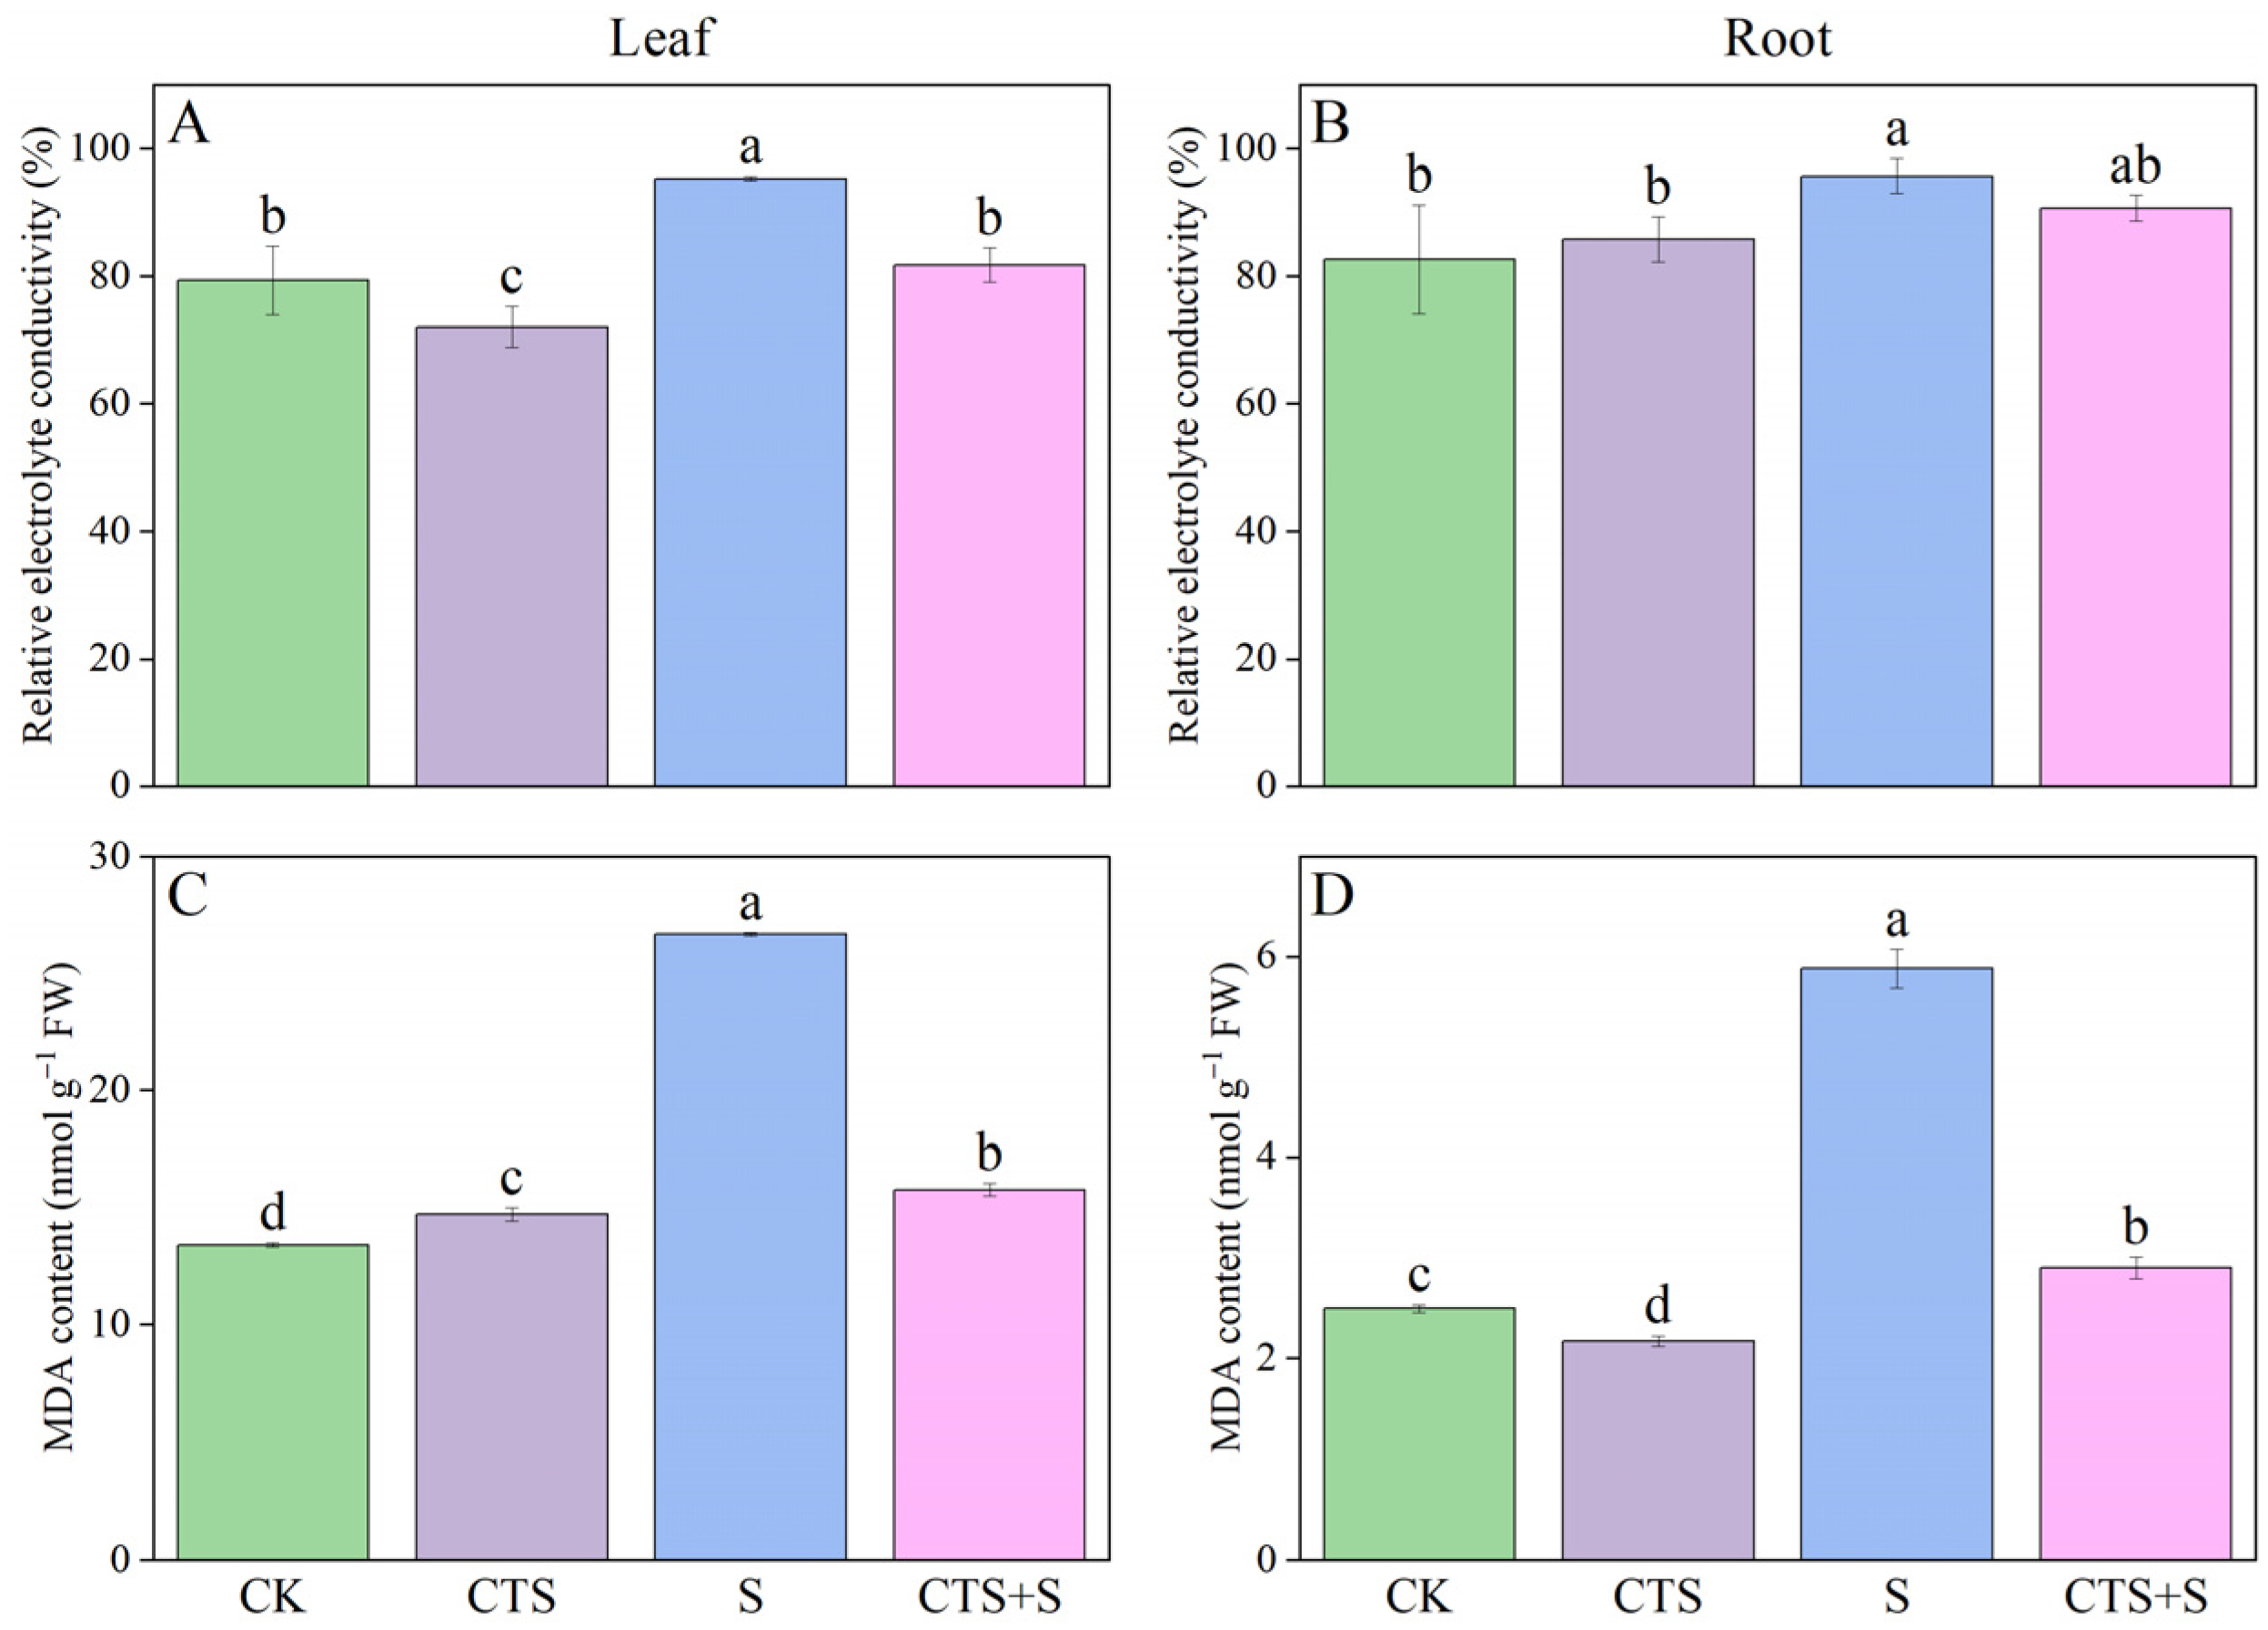
3.5. Effect of Exogenous CTS on Relative Electrolyte Conductivity, Malondialdehyde and Ascorbate Content of Maize Seedlings under Salt Stress

Compared to the CK condition, the relative electrolyte conductivity (REC) and MDA content both exhibited a significant increase in maize seedling leaf and root tissues under salt stress conditions by 20.14%, 15.91%, 99.11% and 135.90%, respectively (p < 0.05) (Figure 5). After the application of exogenous CTS, reductions were observed in relative electrolyte conductivity and MDA content under salt stress, in comparison to compared with the single salt treatment. Specifically, reductions of 14.23% and 40.93% were observed in the leaf, while reductions of 5.32% and 50.80% were noted in the root, respectively, compared with the salt treatment.
Compared to the CK condition, the AsA content in the leaf displayed a marked increase of 58.45% but, conversely, decreased by 37.05% in the root under salt stress condition (p < 0.05) (Figure 6). However, under the CTS + S treatment, there was an enhancement observed in the AsA content, specifically a rise of 22.06% and 16.19% in the leaf and root, respectively, compared to the S treatment.

3.6. Effect of Exogenous CTS on Soluble Protein and the Activity of Antioxidant Enzymes in Maize Seedlings under Salt Stress

In this study, the soluble protein content in both leaf and root tissues of maize seedlings was significantly decreased under salt, experiencing reductions by 17.68% and 43.89%, respectively (p < 0.05) (Figure 7). However, when compared to the salt stress condition, the addition of CTS increased the soluble protein content in the leaf and root of maize seedlings by 15.46% and 13.10%, respectively. Our findings also revealed similar trends in enzyme activities. Compared to the CK condition, the antioxidant enzyme activities of maize seedlings were significantly reduced under salt stress (p < 0.05). Specifically, SOD, CAT, APX, and POD activities were decreased by 32.32%, 37.36%, 26.00%, and 7.30% in the leaf and 19.13%, 32.22%, 55.67%, and 19.14% in the root, respectively. Conversely, compared to the S treatment, SOD, CAT, APX, and POD activities were enhanced by 47.24%, 24.56%, 10.81%, and 9.77% in the leaf and 2.45%, 55.73%, 25.56%, and 15.27% in the root under the CTS + S treatment, respectively.

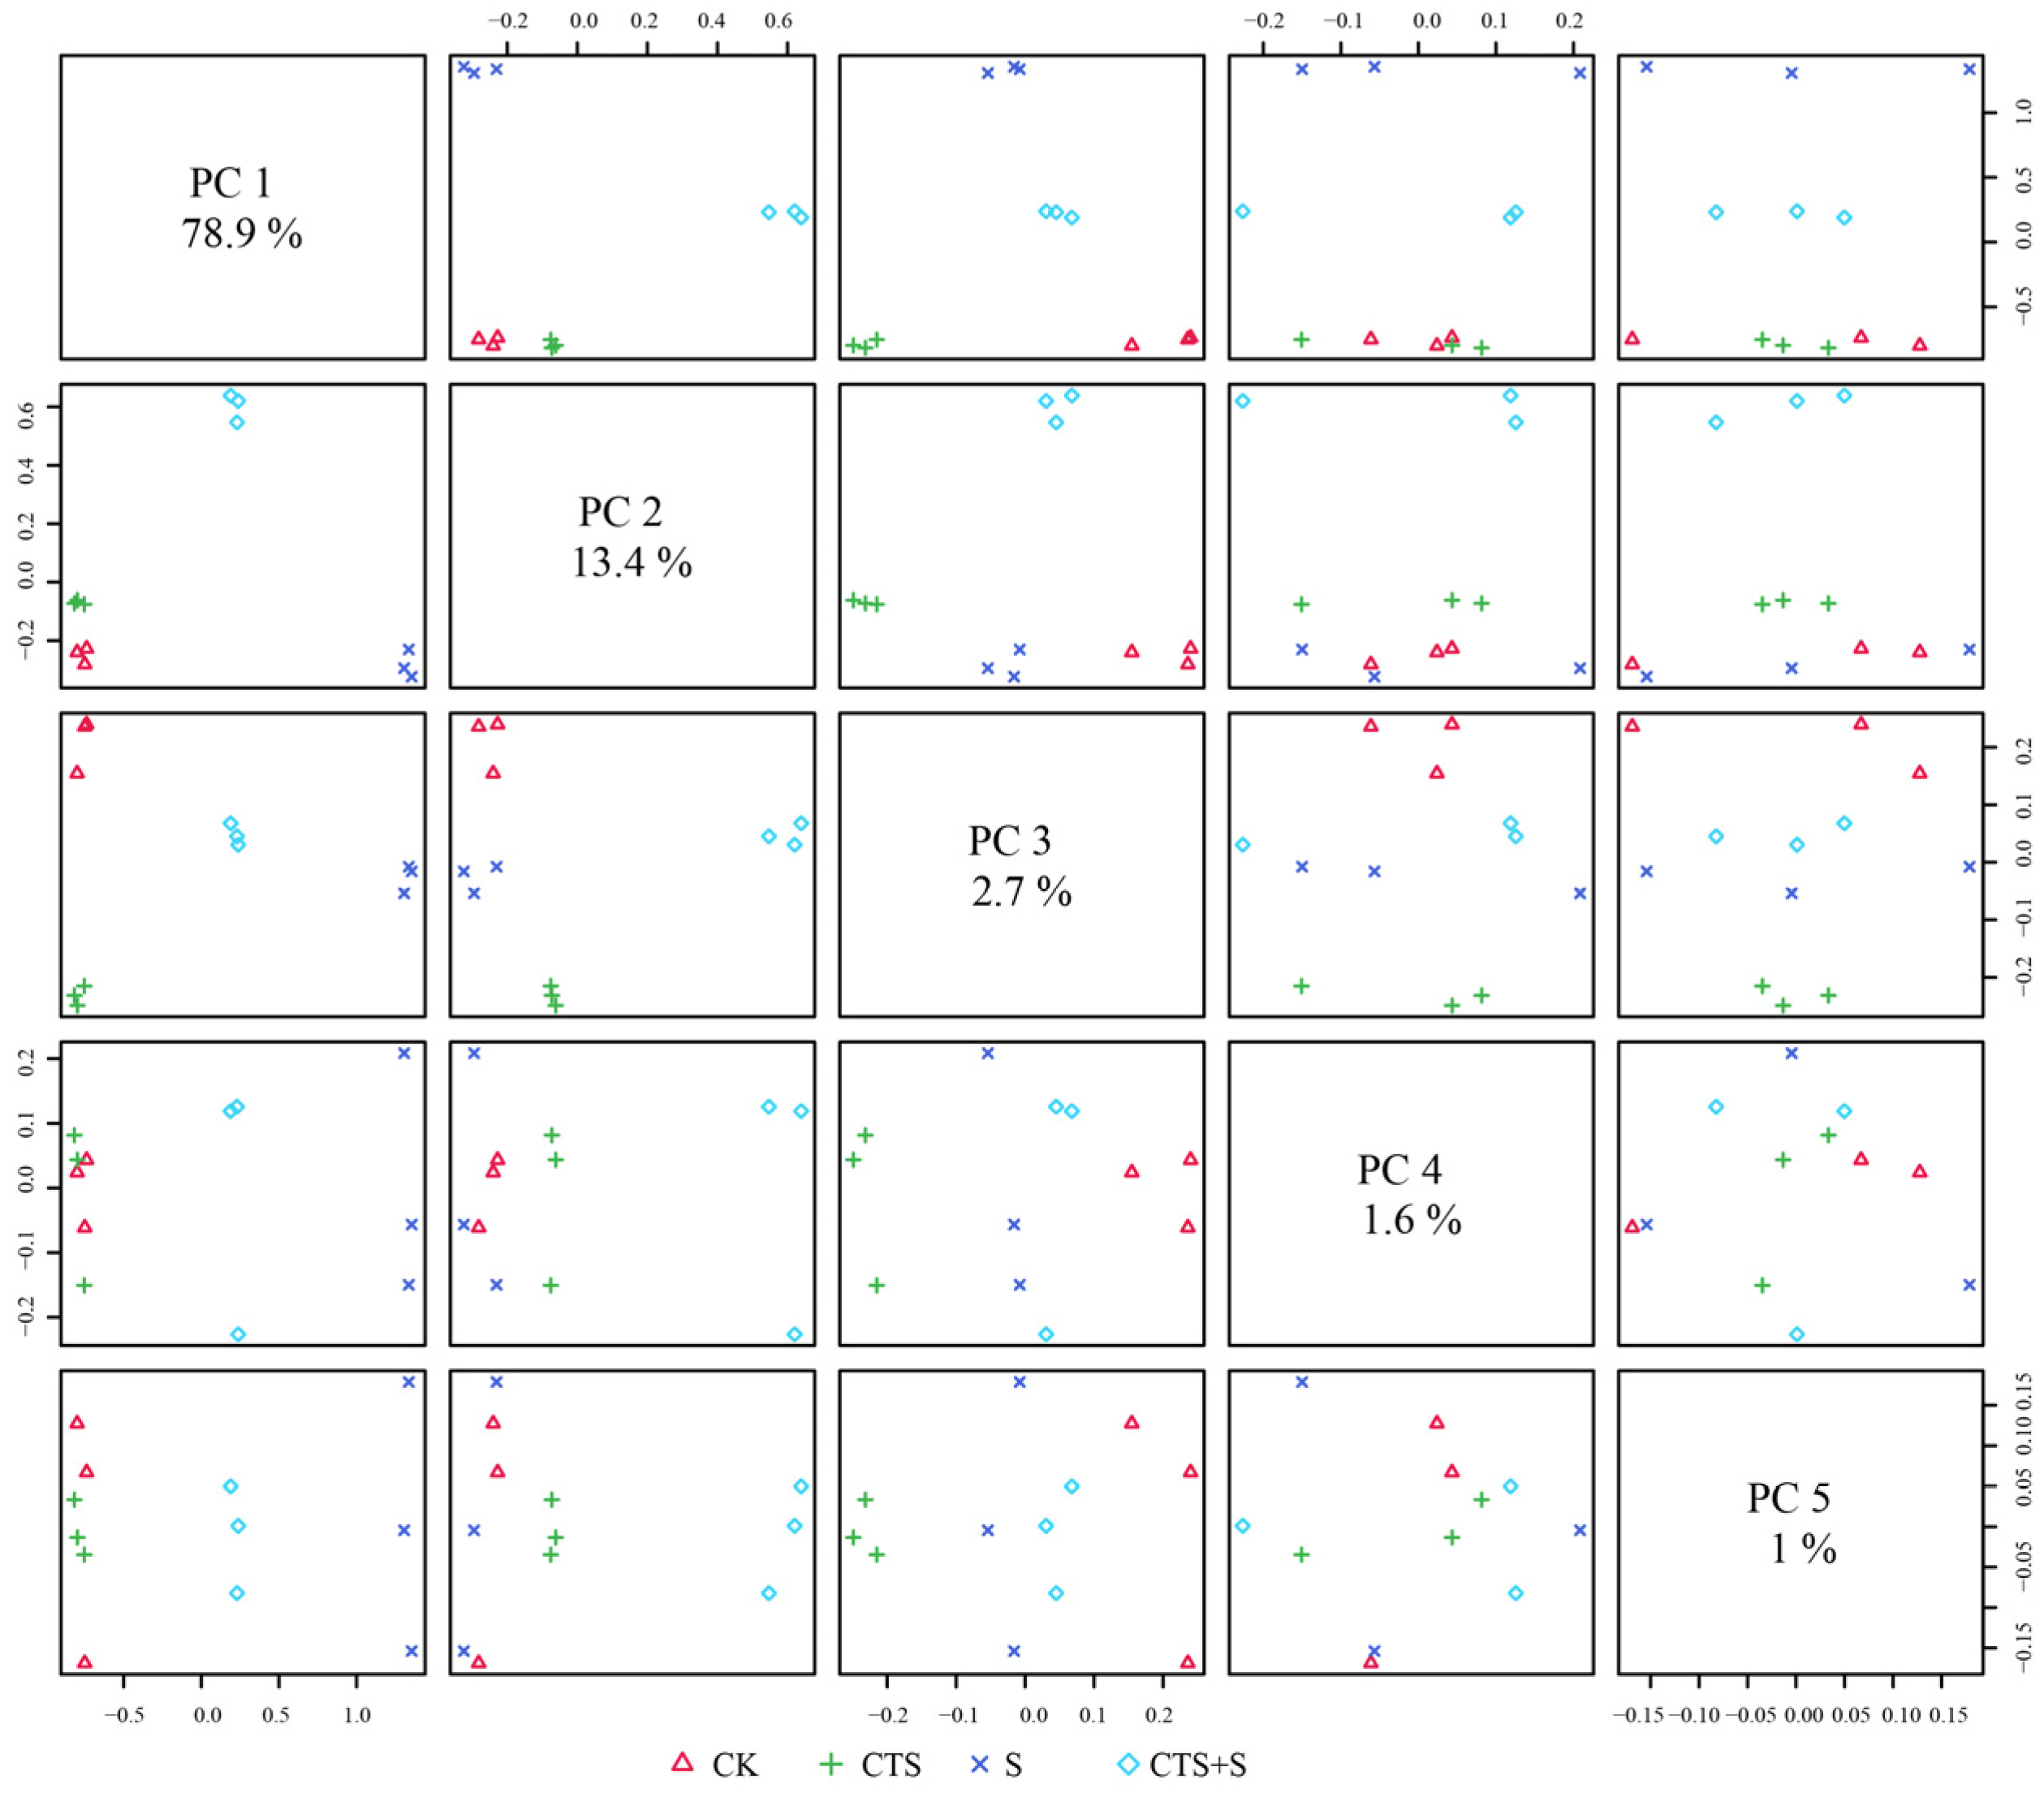
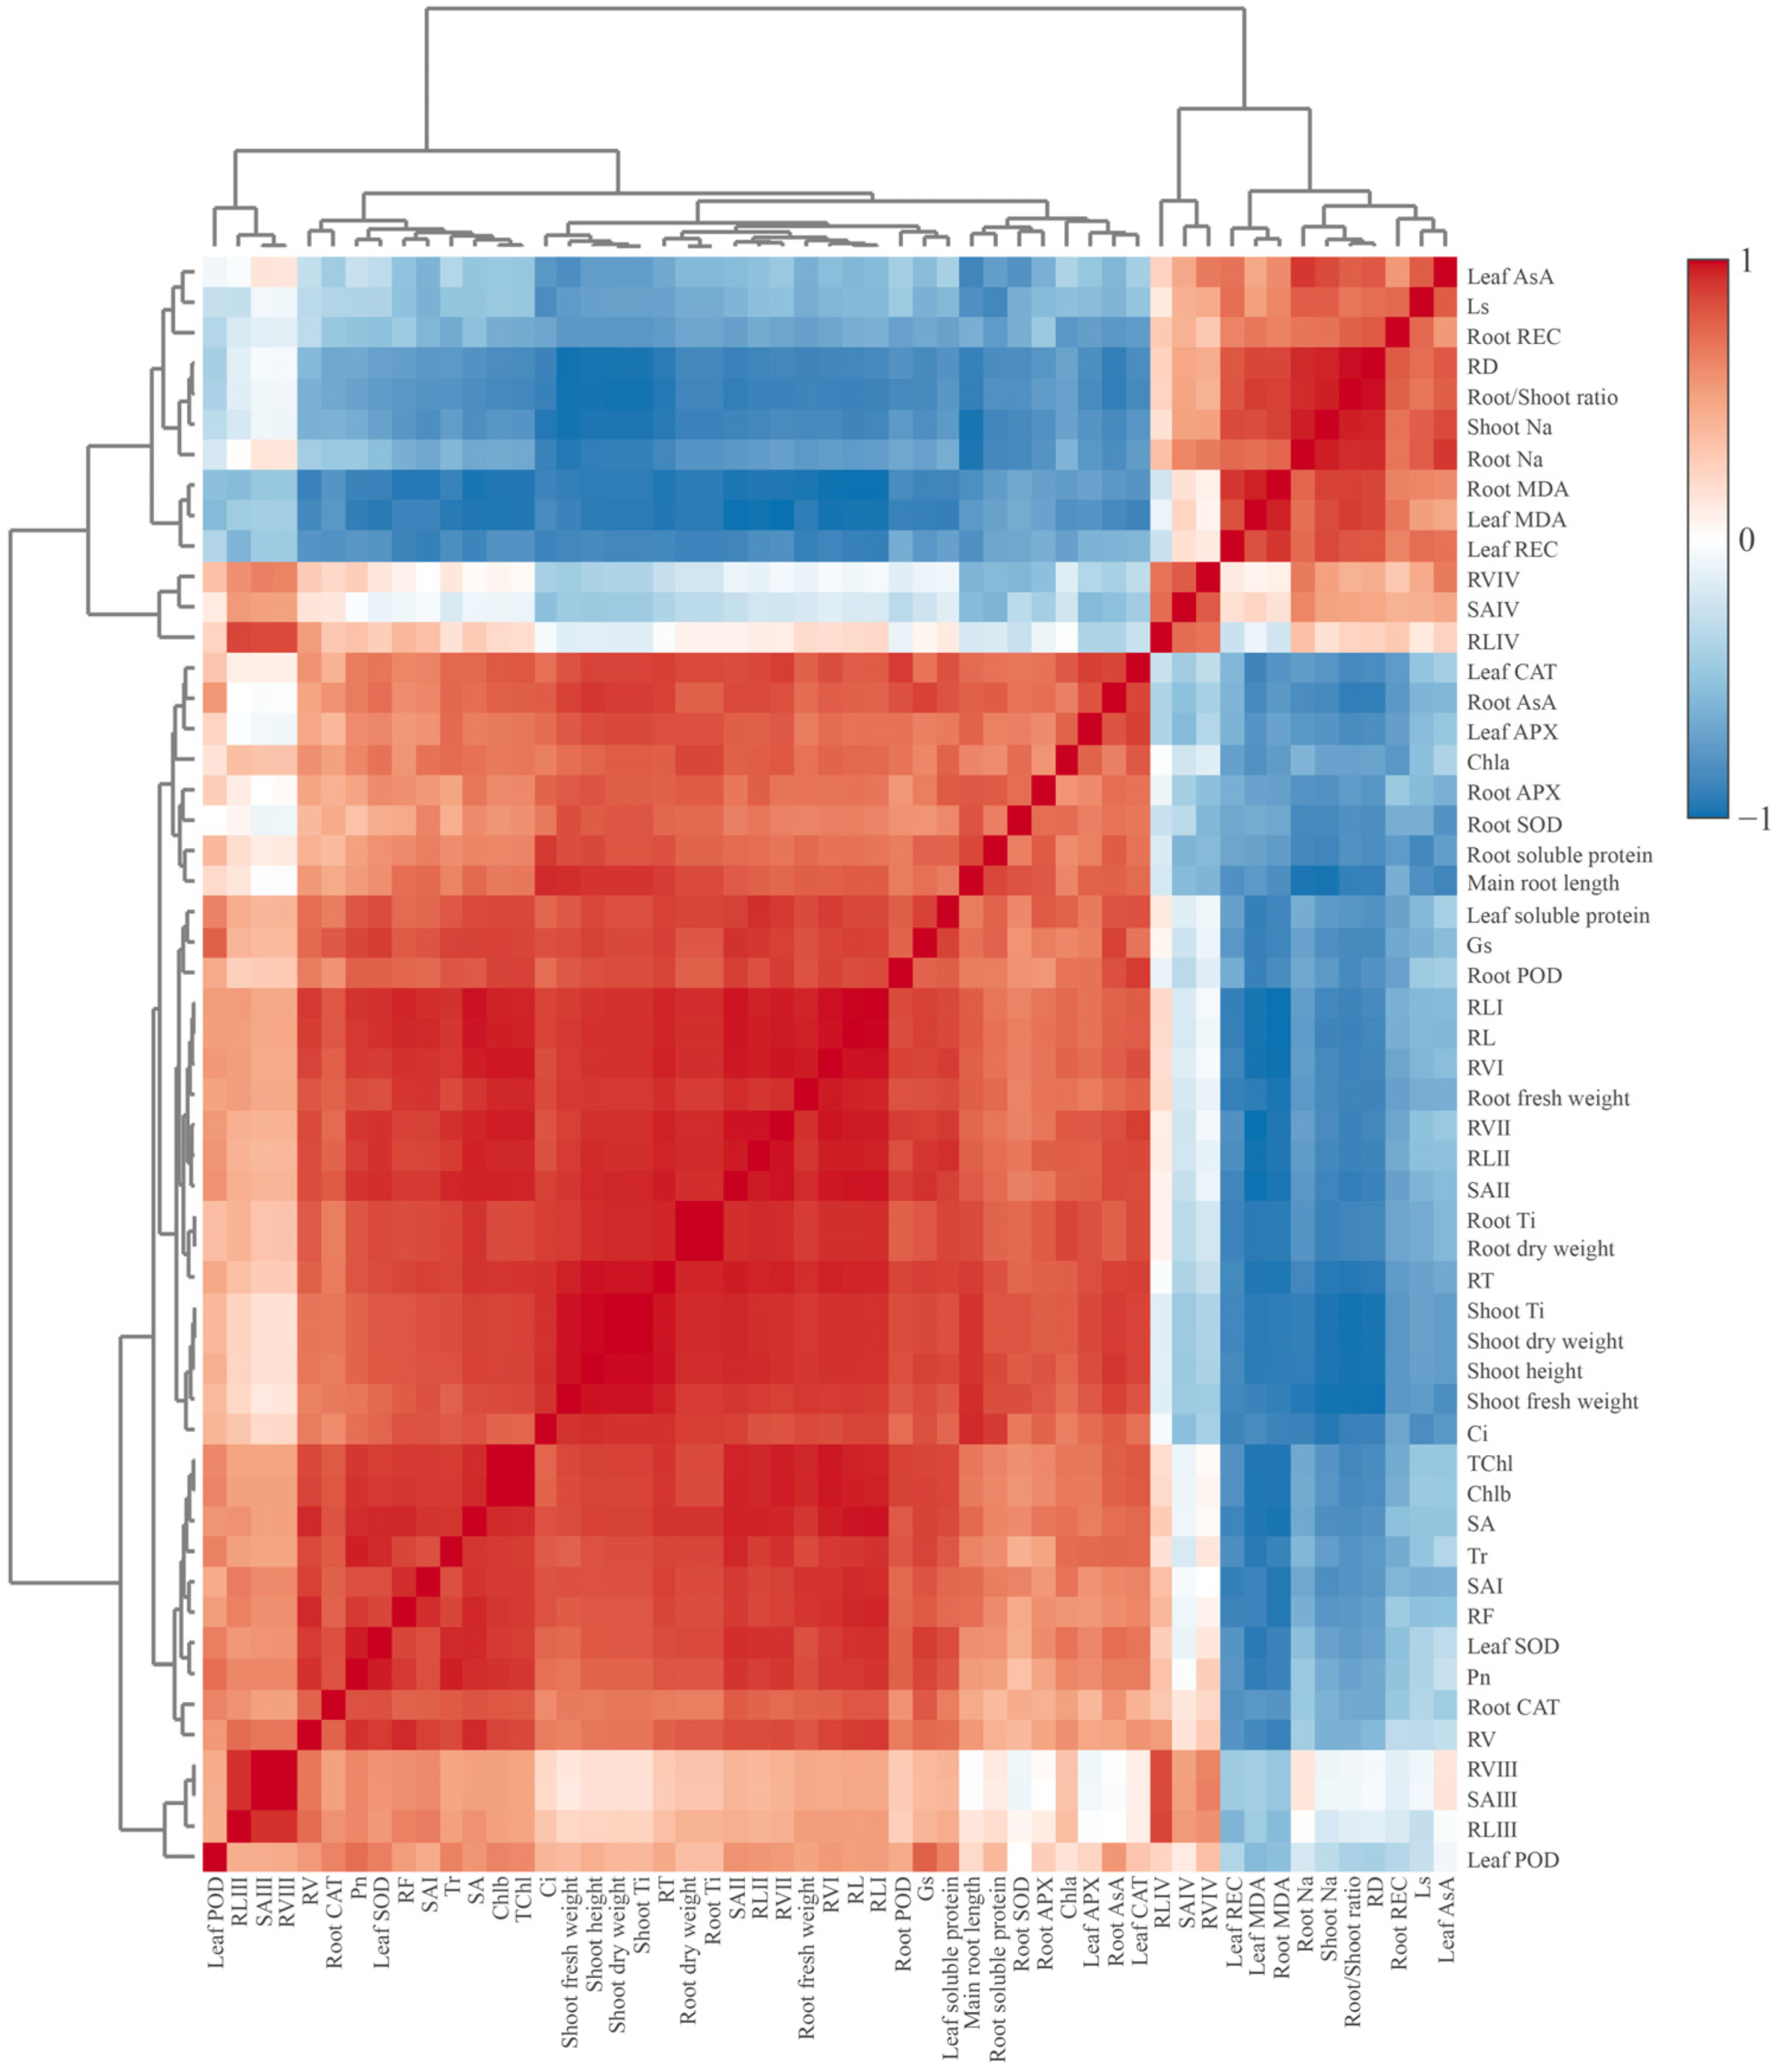
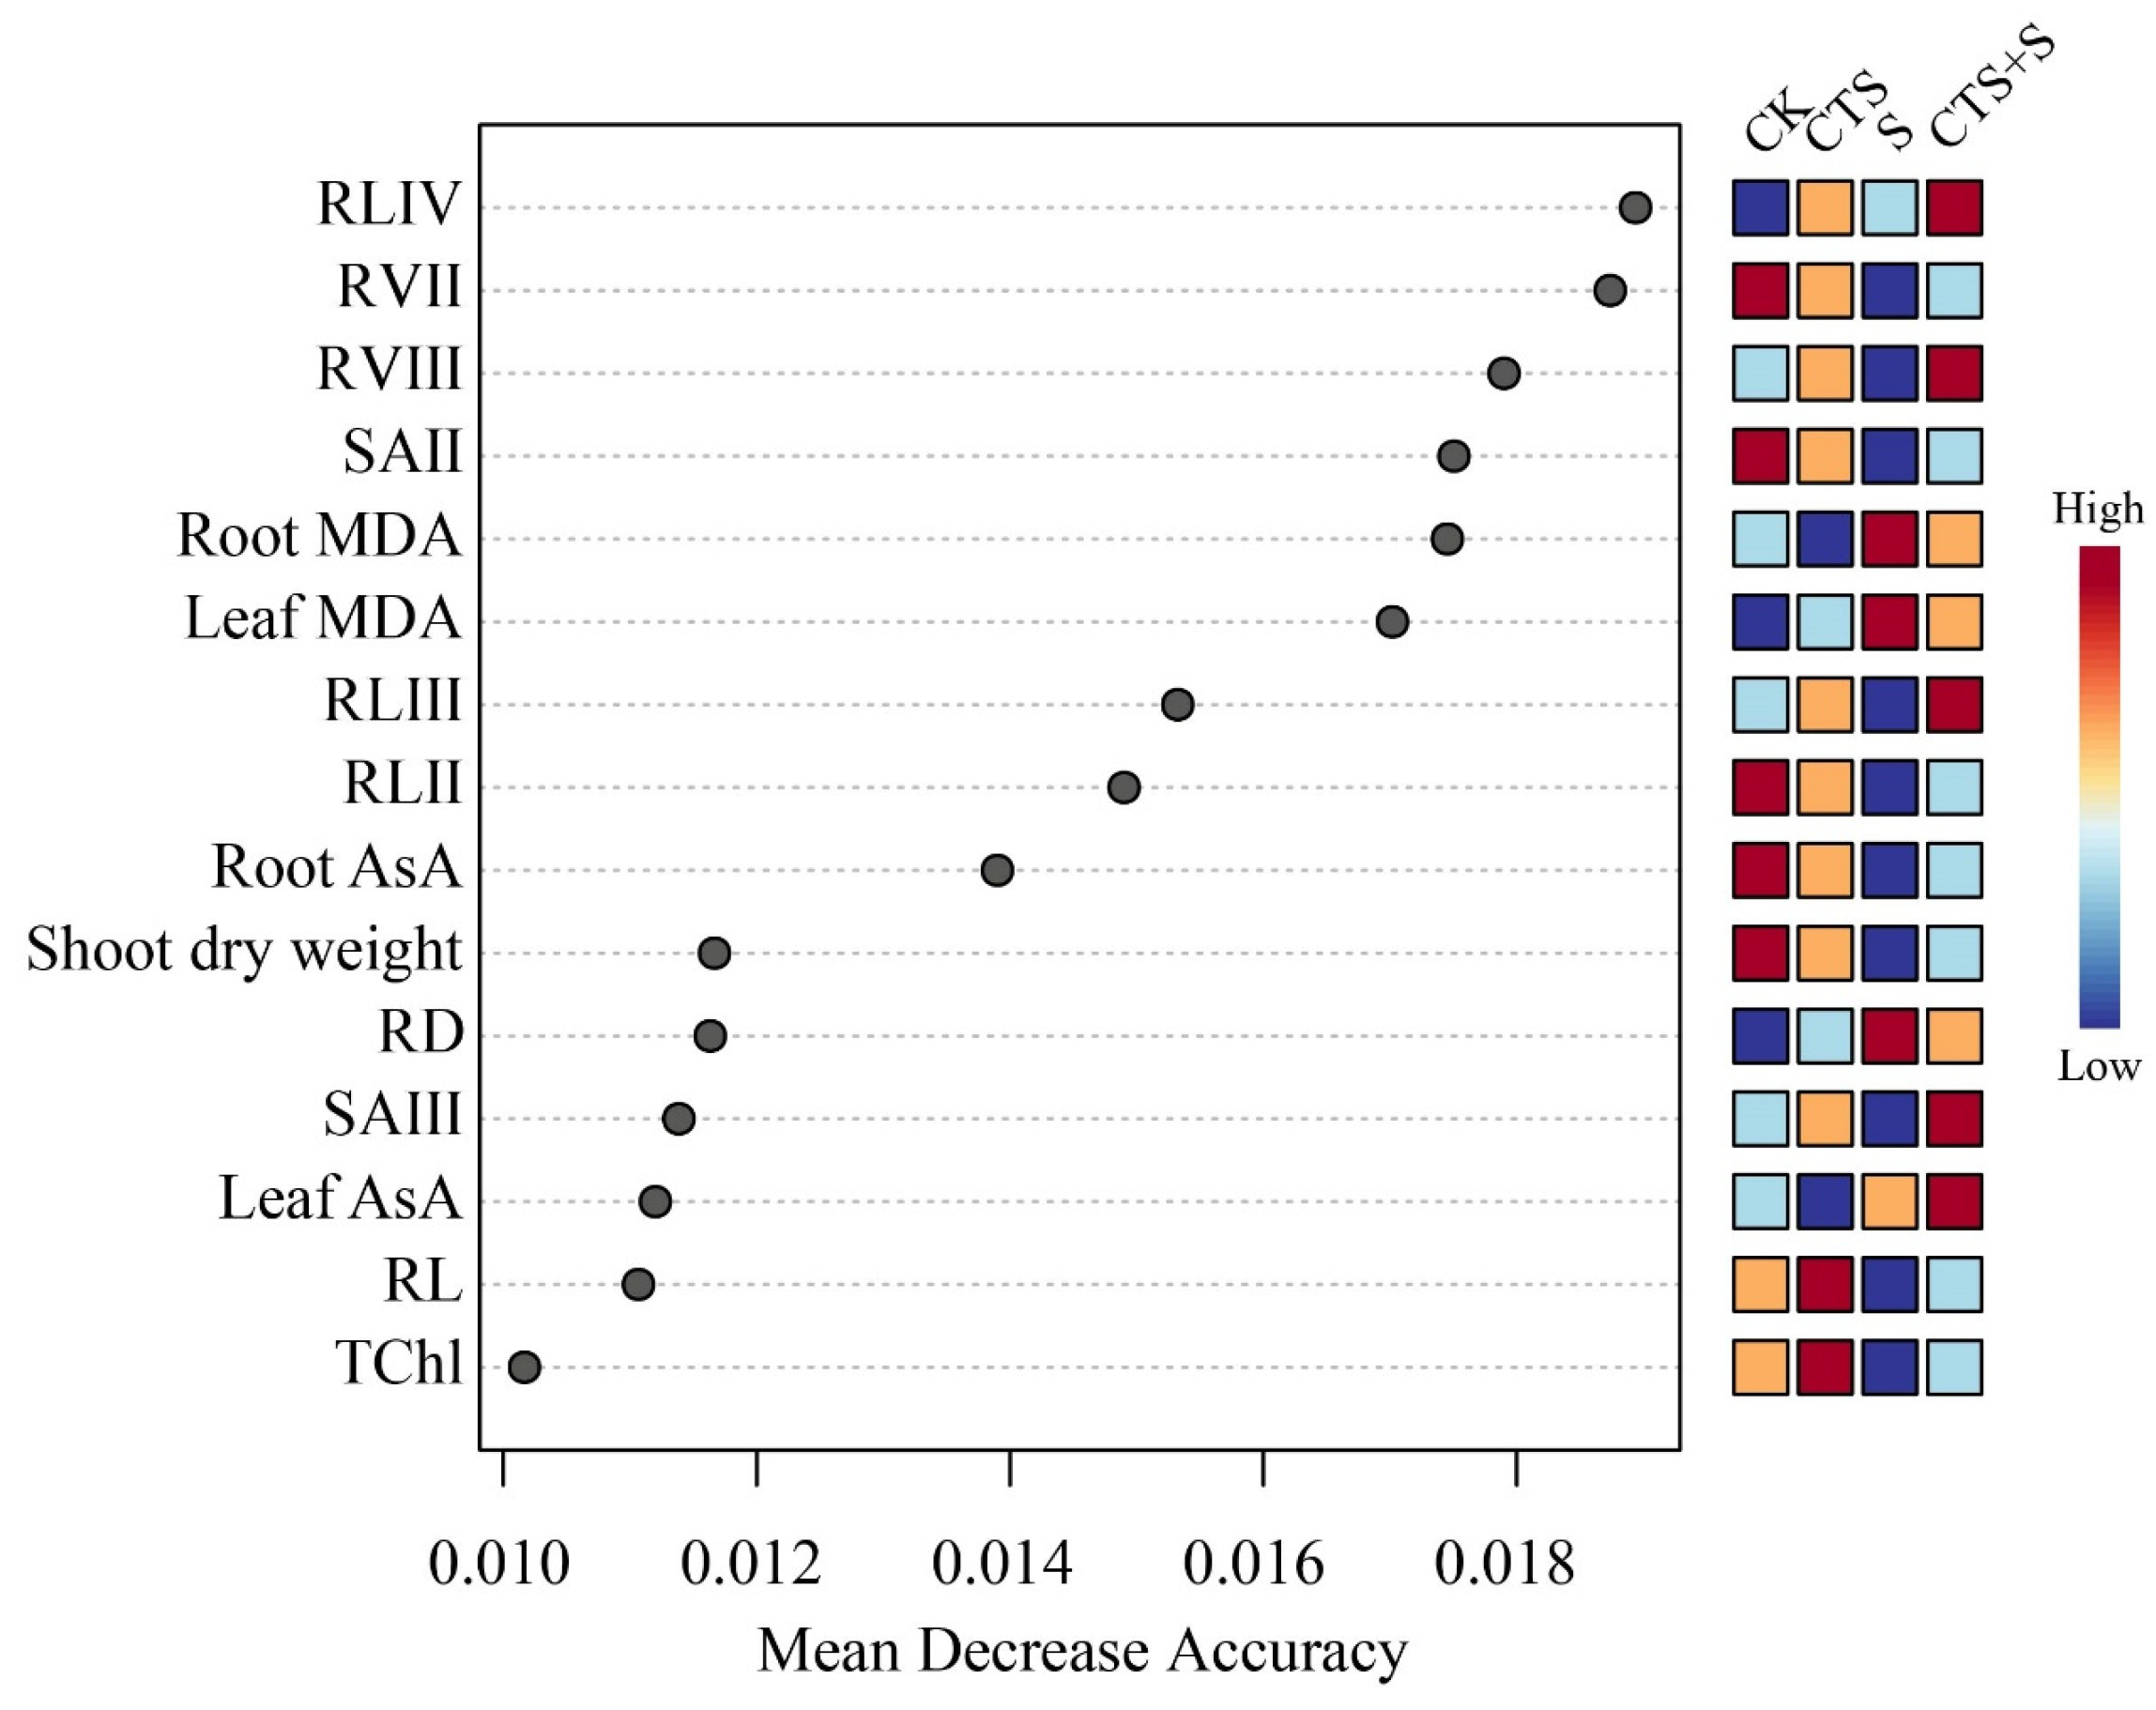
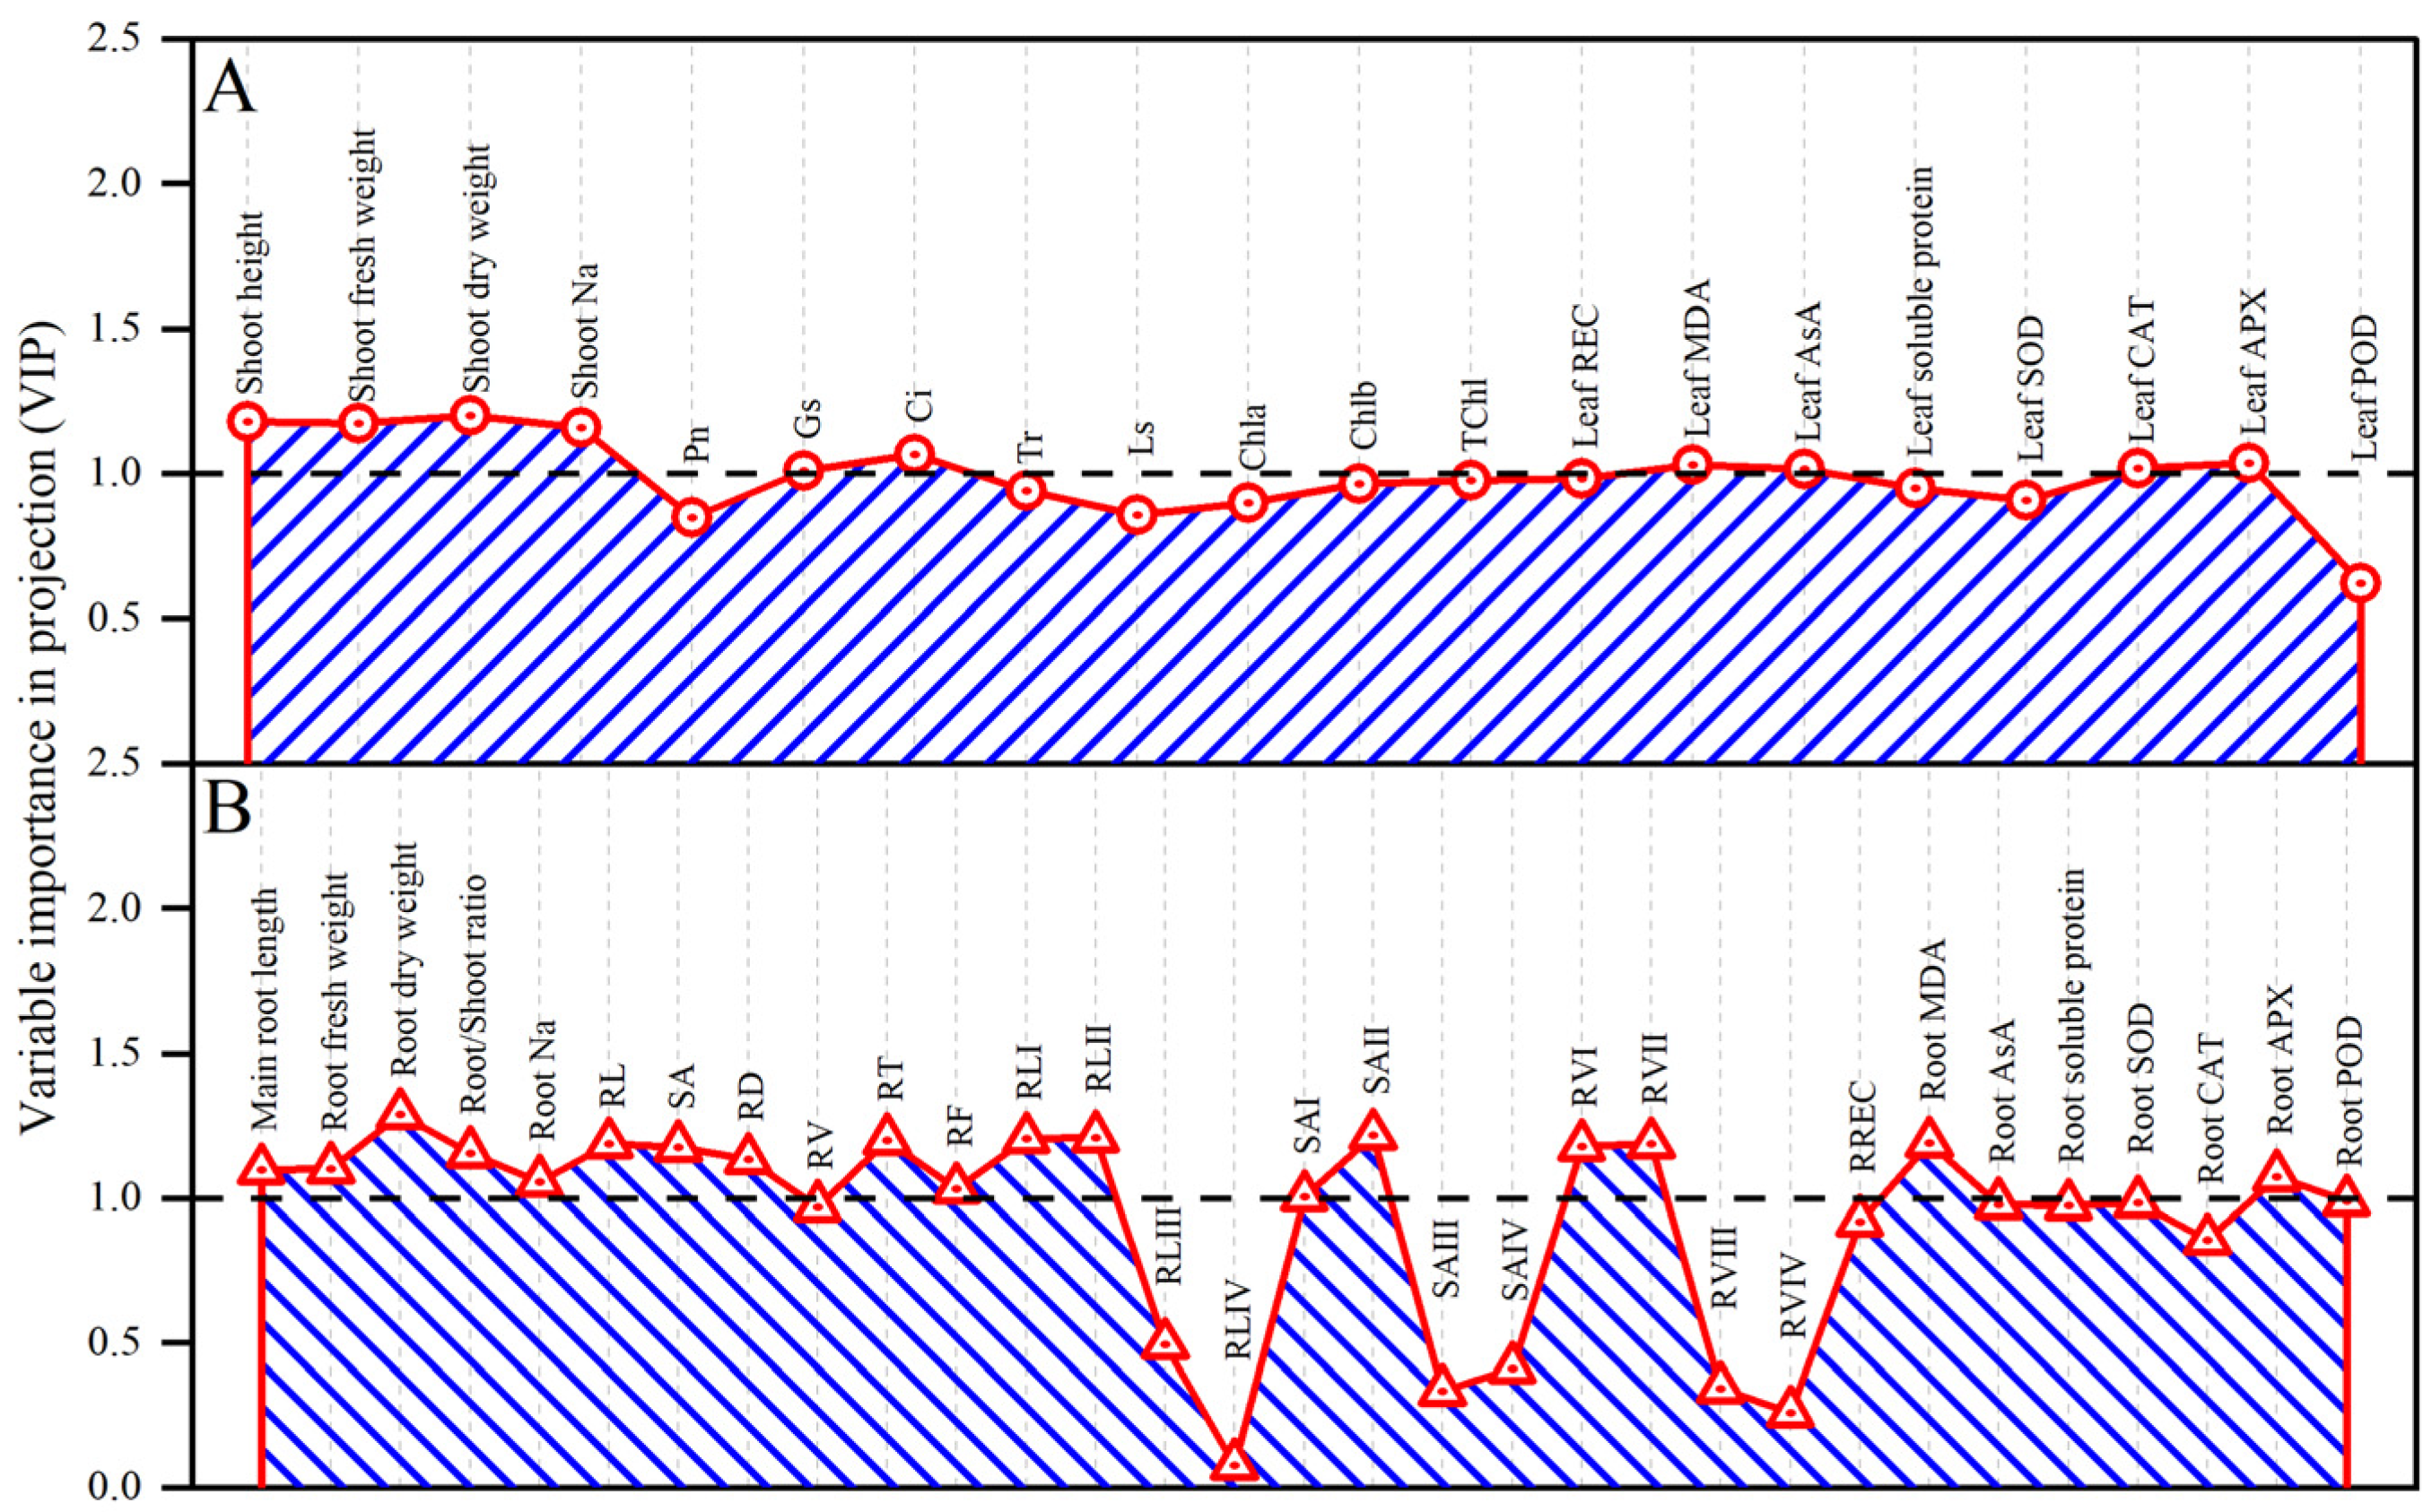
3.7. Multiple Analysis of Influence of Exogenous CTS on Maize Seedlings under Salt Stress

Physiological and biochemical indices related to stress tolerance were calculated using a membership function method following the exogenous application of CTS under salt stress. These results indicated that stress tolerance of maize seedlings followed the sequence: CTS > CK > CTS + S > S (Table 3).
We found that in primary component analysis (PCA), there were five components, but the top two components were PC1 and PC2, explaining 78.9% and 17.4% of the total variation, respectively (Figure 8). Furthermore, the replications of treatments were clearly illustrated by PC1 and PC2; the replications that were handled well were grouped together, and four treatments were thoroughly separated (Figure 9A). These indices of maize seedlings were significantly influenced by PC1, which encompassed various factors such as RD, the IV class of RL, SA, RV, Na concentration in the shoot and root, Ls, REC in leaf and root tissues, MDA content in leaf and root samples, leaf AsA content, and root/shoot ratio. Simultaneously, other indices were influenced by PC2, involving factors like fresh weight and dry weight in the root, RL, SA, RV, RT, RF, the I to III class of RL, SA, RV, Pn, Gs, Tr, Chlb, TChl, leaf soluble protein, leaf SOD, root CAT, and POD activity in leaf and root tissues (Figure 9B).
The correlation and heatmap analysis revealed a positive association between Na concentration in both shoot and root with RD, the IV class of RL, SA, RV, root/shoot ratio, Ls, REC and MDA content in leaf and root samples, as well as AsA content in leaf tissue. Conversely, there was a negative correlation found between Na concentration and growth parameters (shoot height, main root length, FW and DW in both shoot and root samples), root characteristics (RL, SA, RV, RT, RF, the I to III class of RL, SA, and RV), photosynthetic characteristics (Pn, Gs, Ci, and Tr) and pigment (Chla, Chlb, and TChl), root AsA, soluble protein in leaf and root tissues, and antioxidant enzyme activities (SOD, CAT, APX, and POD in both leaf and root samples) (Figure 10 and Figure 11). However, the tolerance index in both shoot and root tissues exhibited a positive correlation with growth parameters, root morphology and architecture, photosynthesis, photosynthetic pigment, and antioxidant system (Figure 10 and Figure 11).
The random forest analysis presented a ranking of mean decrease accuracy values, highlighting the most influential factors as the IV class of RL, II class of RV, SA and RL, MDA content in the leaf and root, and III class of RV, RL and SA, AsA content in the leaf and root, shoot dry weight, RD, RL, and TChl (Figure 12).
The results from the PLS model showed that several indices significantly influenced shoot tolerance, encompassing shoot height, shoot FW, and DW, shoot Na concentration, Gs, Ci, MDA and AsA content in leaf samples, as well as CAT and APX activities in leaf samples (Figure 13A). Importantly, among these factors, shoot dry weight displayed the highest sensitivity, exerting a significant impact on the response of maize seedlings to salt stress (Figure 13A). Furthermore, several parameters were recognized as substantial contributors to root tolerance, including main root length, root FW and DW, root/shoot ratio, root Na concentration, RL, SA, RD, RT, RF, the I and II classes of RL, SA, RV, root MDA content, and root APX activity (Figure 13B). Notably, root dry weight emerged as the most crucial factor influencing the response to salt stress among these parameters (Figure 13B).

4. Discussion

Salt significantly impedes growth and development by diminishing germination rates, suppressing plant morphology and altering physiological structures, consequently impacting the absorption of water and essential nutrients, leading to a reduction in biomass and a decline in plant height [22,47,48]. In the present study, the maize height and main root length were significantly inhibited, while the dry weight of the shoot and root were both reduced and the absorption of Na was increased under salt stress (p < 0.05) (Figure 1 and Figure 3, Table 1). Previous studies reported that salt stress inhibited photosynthesis and nutrient absorption, resulting in less biomass accumulation and shorter shoot and root length of maize seedlings due to the higher Na uptake [8,49,50,51]. Chitosan could improve the absorption and transport of mineral nutrients, as well as photosynthesis, thereby increasing plant growth and height [10,22,52]. Our results also confirmed that chitosan has the capacity to improve root length and plant height and increase the dry weight of the shoot and root to enhance the salt tolerance in maize seedlings under salt stress. Furthermore, the results of the PLS model also showed that the length and dry weight of the shoot and root significantly contributed to the tolerance of maize seedlings (Figure 13).
The root, the first tissue to encounter stress, has a crucial function in the absorption and transportation of water and nutrients, as well as serving as a sensor for stress signals in plants [50,53]. The development of root system architecture undergoes alterations and remodeling in response to stress environment [54,55]. Salt stress significantly inhibited root growth and development of maize seedlings, affecting parameters such as RL, SA, RV, RT, RF (Table 2), which coincides with earlier observations [56,57]. Meanwhile, the proportions of fine root (0 < RD < 1.0 mm) in terms of RL, SA and RV were also suppressed under salt stress (Figure 2, Table 2). This result showed that salt stress could reduce the proportion of thin roots and impact the development of root systems to influence the tolerance of maize seedlings. In contrast, chitosan ameliorated the detrimental effect of salt stress on the root system parameters, but decreased the proportion of coarse root (RD > 1.5 mm) (Figure 2, Table 2), suggesting that CTS could accelerate the development of the root system to enhance the absorption rate and transportation ability of water and nutrients to sustain the normal growth of maize seedlings. The root/shoot ratio also indicated an increased transport and retention of carbohydrates in shoot tissue (Table 1). The correlation analysis also confirmed this result (Figure 10). Miao et al. (2020) [50] reported that salicylic acid facilitated root growth and carbohydrate accumulation to enhance the salt tolerance of cucumber seedlings. Altaf et al. (2021) [57] also discovered that melatonin pretreatment could improve the root traits under salt stress. The results of correlation analysis demonstrated a negative relationship between the IV class of RL, SA and RL with the tolerance index of both shoot and root tissues (Figure 10), suggesting that CTS could inhibit the proportion of coarse root to enhance the salt tolerance of maize seedlings. In addition, CTS also decreased the Na uptake by altering root growth and development, alleviating the inhibitory effects of salt stress to improve biomass accumulation and tolerance in maize seedlings. These findings also explained the negative correlation between Na concentration in both shoot and root tissues with DW in both shoot and root samples, the tolerance index of shoot and root tissues, and root morphology parameters (RL, SA, RV, RT, RF, the I to III class of RL, SA, RV) (Figure 10). Similarly, the PLS model also showed that root morphology architecture played a pivotal role in maize tolerance (Figure 13).
Photosynthesis could provide carbohydrates to maintain normal plant growth and activities [57]. In this study, salt stress induced a significantly detrimental effect on the photosynthesis of maize seedlings, such as Pn, Gs, Ci and Tr (Figure 4). Similar results have been reported in maize [8,49], creeping bentgrass [30], and tomato [57]. However, these characteristics were enhanced through CTS application (Figure 4). According to Geng et al. (2020) [30], CTS pretreatment significantly increased Pn, thereby enhancing the growth of creeping bentgrass under salt stress. The exogenous application of CTS also could elevate Gs to mitigate the stomata closure, and improve other photosynthetic characters such as Pn, Ci and Tr, thus enhancing the photosynthetic activity of edible rape under Cd stress [58]. As reported by Shehzad et al. (2020) [59], CTS upregulated the stomatal aperture to increase the uptake and diffusion of CO2, resulting in improved levels in Pn, Gs and Ci. In addition, the correlation analysis showed that photosynthetic characteristics (Pn, Gs, Ci and Tr) had a positive correlation with tolerance as well as biomass accumulation of maize seedlings (Figure 9). These results suggested that CTS has a positive function on the photosynthetic ability of maize seedlings to improve the photosynthetic activity and growth, thus enhancing the tolerance of maize seedlings under salt stress. Moreover, we also found that salt significantly declined the chlorophyll content (Chla, Chlb), leading to a significant reduction in TChl content (Figure 4). However, the decline in chlorophyll content induced by salt stress was significantly reversed when maize seedlings were treated with exogenous applications of CTS. Consistent observations in previous studies support the result of a positive effect of chitosan on chlorophyll [22,58,60]. The correlation analysis showed that photosynthetic pigments (Chla, Chlb, TChl) were positively correlated with tolerance and biomass accumulation of maize seedlings (Figure 10). Consequently, CTS improved the chlorophyll synthesis to improve salt tolerance and accelerate the growth of maize seedlings under salt stress [58].
Salt stress induced excessive production and ROS accumulation, resulting in lipid peroxidation and oxidative damage in plant cells [61,62]. MDA, as a byproduct of membrane lipid peroxidation, is used to reflect the degree of oxidative injury to the cell membrane [58,60,63]. Moreover, relative electrolyte conductivity (REC) serves as an additional indicator of membrane injury. In our study, compared to CK treatment, salt stress significantly elevated the levels of MDA and REC in both leaf and root tissues of maize seedlings (Figure 5), indicating a deterioration in the normal structure and function of the cell membrane attributed to the salt-induced overaccumulation of ROS. Similar results had been demonstrated by Zhang et al. (2021) [60] and Altaf et al. (2021) [57]. However, exogenous application CTS mitigated the accumulation of MDA and the elevation of REC under salt stress, suggesting that CTS application reduced ROS accumulation and minimized lipid peroxidation. Similar impacts on MDA concentrations and REC levels were observed in studies involving edible rape exposed to CTS under Cd stress [58], apple seedlings treated with CTS under drought stress [24], and lettuce subjected to CTS treatment under salt stress conditions [60].
Chitosan exhibits antioxidant properties, thereby enhancing the tolerance to oxidative damage induced by adverse conditions in plants [24]. The plant antioxidant defense systems are primarily composed of enzymatic antioxidant components (SOD, CAT, APX, POD) and non-enzymatic antioxidants (AsA, GSH). AsA, one of the widespread antioxidants, directly participates in the scavenging process of ROS as the primary line of defense [57]. In the current investigation, salt stress led to an increment in the leaf but a reduction in the root in the AsA content (Figure 6). The reduction may be attributed to the direct interaction of AsA with ROS, resisting the oxidative damage induced by salt stress, which has been found in edible rape [58] and tomato seedlings [57]. CTS application significantly elevated AsA content in maize seedlings subjected to salt stress (Figure 6). The results indicated that CTS has the capability to enhance AsA synthesis, consequently improving the antioxidant ability in response to oxidative damage induced by salt stress.
Furthermore, the antioxidant enzymes are crucial in mitigating oxidative injury induced by salt stress. SOD could directly catalyze the conversion of O2- into H2O2. The generated H2O2 is effectively converted into water (H2O) through the catalytic action of CAT, APX and POD enzymes. The present study also demonstrated that salt stress induced lower SOD, CAT, APX, and POD activities in both leaf and root tissues of maize seedlings (Figure 7), which were similar to the study in cucumber [18]. However, Razavizadeh et al. (2020) [64] and Tabassum et al. (2024) [51] found an elevation in antioxidant enzyme activities exposed to salt stress, alleviating oxidative injury. The difference in antioxidant enzymes might be caused by the plant species. Furthermore, exogenous application of CTS elevated enzyme activities in maize seedlings under salt stress (Figure 7). Similarly, the CTS application elevated the activities of antioxidant enzymes in maize seedlings under salt stress [10], apple seedlings under drought stress [24], edible rape under cadmium (Cd) stress [58], Pisum sativum L. [51], lettuce [60] and durum wheat under salt stress [62], creeping bentgrass under salt stress [30] and drought stress [63], sorghum under drought stress [65], and sunflower under drought stress [59]. In conclusion, these results indicated that CTS application effectively scavenged excessive ROS by improving antioxidant enzyme activities, ultimately mitigating oxidative injury exposed to salt stress.
In addition, osmotic regulation stands as a fundamental adaptive mechanism utilized by plants to mitigate salt-induced adverse effects [60]. Soluble proteins could participate in osmotic adjustment as osmolytes [66]. Our results showed a reduction in soluble protein content in both leaf and root samples under salt stress, but the phenomenon was mitigated by the exogenous CTS application. These results were similar to previous studies, indicating that CTS application enhanced protein synthesis, mitigated oxidative damage and improved water relations to improve the stressed resistance in maize [67,68], tomato [69], and potato [66].

5. Conclusions

In this study, the effects of exogenous CTS on maize seedling growth under salt stress were explored. The results showed that CTS application could improve maize growth and ameliorate root architecture under salt stress by increasing chlorophyll content and photosynthetic ability. Exogenous CTS alleviated NaCl-induced oxidative stress by enhancing the activities of antioxidant enzymes of SOD, POD, APX and CAT, and the content of AsA and soluble proteins to scavenge excessive MDA in maize leaf and root tissues. Our results suggested that CTS application is an effective approach to enhance the tolerance of maize seedlings under saline conditions. Although the morphological and physio-biochemical responses of CTS application on maize growth under salt stress have been investigated in this study, more endeavor is needed to reveal the potential molecular mechanism.

Author Contributions

Conceptualization, Q.J. and H.L.; methodology, F.S.; software, F.L. and Y.Z.; validation, L.F. and Z.S.; investigation, J.Z.; resources, J.S.; data curation, F.S.; writing—original draft preparation, Q.J. and F.S.; writing—review and editing, S.F., H.L. and Z.T.; funding acquisition, H.L. All authors have read and agreed to the published version of the manuscript.

Funding

Key Research Projects of Higher Education Institutions in Henan Province (24A210011), College Students’ Innovative Entrepreneurial Training Plan Program (2023CX162).

Institutional Review Board Statement

Not applicable.

Informed Consent Statement

Not applicable.

Data Availability Statement

The data presented in this study are available on request from the corresponding author.

Conflicts of Interest

The authors declare no conflicts of interest.

References

  1. Isayenkov, S.V.; Maathuis, F.J.M. Plant Salinity Stress: Many Unanswered Questions Remain. Front. Plant Sci. 2019, 10, 80. [Google Scholar] [CrossRef] [PubMed]
  2. Hoang, T.M.L.; Tran, T.N.; Nguyen, T.K.T.; Williams, B.; Wurm, P.; Bellairs, S.; Mundree, S. Improvement of Salinity Stress Tolerance in Rice: Challenges and Opportunities. Agronomy 2016, 6, 54. [Google Scholar] [CrossRef]
  3. Parihar, P.; Singh, S.; Singh, R.; Singh, V.P.; Prasad, S.M. Effect of salinity stress on plants and its tolerance strategies: A review. Environ. Sci. Pollut. Res. 2015, 22, 4056–4075. [Google Scholar] [CrossRef] [PubMed]
  4. Chaves, M.M.; Flexas, J.; Pinheiro, C. Photosynthesis under drought and salt stress: Regulation mechanisms from whole plant to cell. Ann. Bot. 2009, 103, 551–560. [Google Scholar] [CrossRef] [PubMed]
  5. Behera, L.M.; Hembram, P. Advances on plant salinity stress responses in the post-genomic era: A review. J. Crop Sci. Biotechnol. 2021, 24, 117–126. [Google Scholar] [CrossRef]
  6. Kumar, J.; Singh, S.; Singh, M.; Srivastava, P.K.; Mishra, R.K.; Singh, V.P.; Prasad, S.M. Transcriptional regulation of salinity stress in plants: A short review. Plant Gene 2017, 11, 160–169. [Google Scholar] [CrossRef]
  7. Zhu, Y.X.; Gong, H.J.; Yin, J.L. Role of Silicon in Mediating Salt Tolerance in Plants: A Review. Plants 2019, 8, 147. [Google Scholar] [CrossRef]
  8. Singh, M.; Sharma, J.G.; Giri, B. Augmentative Role of Arbuscular Mycorrhizal Fungi, Piriformospora indica, and Plant Growth-Promoting Bacteria in Mitigating Salinity Stress in Maize (Zea mays L.). J. Plant Growth Regul. 2023, 1–21. [Google Scholar] [CrossRef]
  9. Hidangmayum, A.; Dwivedi, P.; Katiyar, D.; Hemantaranjan, A. Application of chitosan on plant responses with special reference to abiotic stress. Physiol. Mol. Biol. Plants 2019, 25, 313–326. [Google Scholar] [CrossRef]
  10. Turk, H. Chitosan-induced enhanced expression and activation of alternative oxidase confer tolerance to salt stress in maize seedlings. Plant Physiol. Biochem. 2019, 141, 415–422. [Google Scholar] [CrossRef]
  11. Mulaudzi, T.; Nkuna, M.; Sias, G.; Doumbia, I.Z.; Njomo, N.; Iwuoha, E. Antioxidant Capacity of Chitosan on Sorghum Plants under Salinity Stress. Agriculture 2022, 12, 1544. [Google Scholar] [CrossRef]
  12. Gupta, P.; Srivastava, S.; Seth, C.S. 24-Epibrassinolide and Sodium Nitroprusside alleviate the salinity stress in Brassica juncea L. cv. Varuna through cross talk among proline, nitrogen metabolism and abscisic acid. Plant Soil 2017, 411, 483–498. [Google Scholar] [CrossRef]
  13. Ma, N.; Hu, C.; Wan, L.; Hu, Q.; Xiong, J.L.; Zhang, C.L. Strigolactones Improve Plant Growth, Photosynthesis, and Alleviate Oxidative Stress under Salinity in Rapeseed (Brassica napus L.) by Regulating Gene Expression. Front. Plant Sci. 2017, 8, 1671. [Google Scholar] [CrossRef]
  14. Ahsan, M.; Zulfiqar, H.; Farooq, M.A.; Ali, S.; Tufail, A.; Kanwal, S.; Shaheen, M.R.; Sajid, M.; Gul, H.; Jamal, A.; et al. Strigolactone (GR24) Application Positively Regulates Photosynthetic Attributes, Stress-Related Metabolites and Antioxidant Enzymatic Activities of Ornamental Sunflower (Helianthus annuus cv. Vincent’s Choice) under Salinity Stress. Agriculture 2023, 13, 50. [Google Scholar] [CrossRef]
  15. Singh, D.; Sillu, D.; Kumar, A.; Agnihotri, S. Dual nanozyme characteristics of iron oxide nanoparticles alleviate salinity stress and promote the growth of an agroforestry tree, Eucalyptus tereticornis Sm. Environ. Sci. Nano 2021, 8, 1308–1325. [Google Scholar] [CrossRef]
  16. Singh, A.; Sengar, R.S.; Rajput, V.D.; Minkina, T.; Singh, R.K. Zinc Oxide Nanoparticles Improve Salt Tolerance in Rice Seedlings by Improving Physiological and Biochemical Indices. Agriculture 2022, 12, 1014. [Google Scholar] [CrossRef]
  17. Hassan, F.; Ali, E.; Gaber, A.; Fetouh, M.; Mazrou, R. Chitosan nanoparticles effectively combat salinity stress by enhancing antioxidant activity and alkaloid biosynthesis in Catharanthus roseus (L.) G. Don. Plant Physiol. Biochem. 2021, 162, 291–300. [Google Scholar] [CrossRef] [PubMed]
  18. Zhu, Z.J.; Wei, G.Q.; Li, J.; Qian, Q.Q.; Yu, J.Q. Silicon alleviates salt stress and increases antioxidant enzymes activity in leaves of salt-stressed cucumber (Cucumis sativus L.). Plant Sci. 2004, 167, 527–533. [Google Scholar] [CrossRef]
  19. Al Murad, M.; Muneer, S. Physiological and Molecular Analysis Revealed the Role of Silicon in Modulating Salinity Stress in Mung Bean. Agriculture 2023, 13, 1493. [Google Scholar] [CrossRef]
  20. Chanthini, K.M.-P.; Senthil-Nathan, S.; Pavithra, G.-S.; Malarvizhi, P.; Murugan, P.; Deva-Andrews, A.; Janaki, M.; Sivanesh, H.; Ramasubramanian, R.; Stanley-Raja, V.; et al. Aqueous Seaweed Extract Alleviates Salinity-Induced Toxicities in Rice Plants (Oryza sativa L.) by Modulating Their Physiology and Biochemistry. Agriculture 2022, 12, 2049. [Google Scholar] [CrossRef]
  21. Pongprayoon, W.; Roytrakul, S.; Pichayangkura, R.; Chadchawan, S. The role of hydrogen peroxide in chitosan-induced resistance to osmotic stress in rice (Oryza sativa L.). Plant Growth Regul. 2013, 70, 159–173. [Google Scholar] [CrossRef]
  22. Ullah, N.; Basit, A.; Ahmad, I.; Ullah, I.; Shah, S.T.; Mohamed, H.I.; Javed, S. Mitigation the adverse effect of salinity stress on the performance of the tomato crop by exogenous application of chitosan. Bull. Natl. Res. Cent. 2020, 44, 181. [Google Scholar] [CrossRef]
  23. Sen, S.K.; Chouhan, D.; Das, D.; Ghosh, R.; Mandal, P. Improvisation of salinity stress response in mung bean through solid matrix priming with normal and nano-sized chitosan. Int. J. Biol. Macromol. 2019, 145, 108–123. [Google Scholar] [CrossRef] [PubMed]
  24. Yang, F.; Hu, J.J.; Li, J.L.; Wu, X.L.; Qian, Y.R. Chitosan enhances leaf membrane stability and antioxidant enzyme activities in apple seedlings under drought stress. Plant Growth Regul. 2009, 58, 131–136. [Google Scholar] [CrossRef]
  25. Emami Bistgani, Z.; Siadat, S.A.; Bakhshandeh, A.; Ghasemi Pirbalouti, A.; Hashemi, M. Interactive effects of drought stress and chitosan application on physiological characteristics and essential oil yield of Thymus daenensis Celak. Crop J. 2017, 5, 407–415. [Google Scholar] [CrossRef]
  26. Ali, E.F.; El-Shehawi, A.M.; Ibrahim, O.H.M.; Abdul-Hafeez, E.Y.; Moussa, M.M.; Hassan, F.A.S. A vital role of chitosan nanoparticles in improvisation the drought stress tolerance in Catharanthus roseus (L.) through biochemical and gene expression modulation. Plant Physiol. Biochem. 2021, 161, 166–175. [Google Scholar] [CrossRef] [PubMed]
  27. Wang, A.B.; Li, J.Y.; AL-Huqail, A.A.; AL-Harbi, M.S.; Ali, E.F.; Wang, J.S.; Ding, Z.L.; Rekaby, S.A.; Ghoneim, A.M.; Eissa, M.A. Mechanisms of Chitosan Nanoparticles in the Regulation of Cold Stress Resistance in Banana Plants. Nanomaterials 2021, 11, 2670. [Google Scholar] [CrossRef]
  28. Akanksha, T.S.; James, E.R.; Sagar, S.A. Chitosan Nanoparticles as Seed Priming Agents to Alleviate Salinity Stress in Rice (Oryza sativa L.) Seedlings. Polysaccharides 2023, 4, 129–141. [Google Scholar]
  29. Hafez, Y.; Attia, K.; Alamery, S.; Ghazy, A.; Al-Doss, A.; Ibrahim, E.; Rashwan, E.; El-Maghraby, L.; Awad, A.; Abdelaal, K. Beneficial Effects of Biochar and Chitosan on Antioxidative Capacity, Osmolytes Accumulation, and Anatomical Characters of Water-Stressed Barley Plants. Agronomy 2020, 10, 630. [Google Scholar] [CrossRef]
  30. Geng, W.; Li, Z.; Hassan, M.J.; Peng, Y. Chitosan regulates metabolic balance, polyamine accumulation, and Na+ transport contributing to salt tolerance in creeping bentgrass. BMC Plant Biol. 2020, 20, 506. [Google Scholar] [CrossRef]
  31. Zhang, J.J.; Jiao, Q.J.; Xu, Z.Y.; Fan, L.N.; Jiang, Y.; Song, J.; Hua, D.L.; Li, G.Z.; Lin, D.; Liu, H.T. Efeect of Exogenous Chitosan on Physiological Property, Antioxidant Activity, and Cadmium Uptake of Wheat (Triticum Aestivum L.) Seedlings under Cadmium Stress. Environ. Sci. 2023, 1–16. (In Chinese) [Google Scholar]
  32. Shams Peykani, L.; Farzami Sepehr, M. Effect of chitosan on antioxidant enzyme activity, proline, and malondialdehyde content in Triticum aestivum L. and Zea maize L. under salt stress condition. Iran. J. Plant Physiol. 2018, 9, 2661–2670. [Google Scholar]
  33. Liu, H.T.; Yuan, Q.S.; Wei, C.; Jiao, Q.J.; Xu, Z.Y.; Zhang, J.J.; Li, G.Z.; Zhang, X.H.; Zhang, B.B.; Jiang, Y. Effect of exogenous chitosan on maize root architecture classification and physiological parameters under drought stress. J. Henan Agric. Univ. 2023, 57, 646–656. (In Chinese) [Google Scholar]
  34. Qu, D.Y.; Gu, W.R.; Li, L.J.; Li, J.; Li, C.F.; Wei, S. Regulation of chitosan on the ascorbate-gluthione cycle in Zea mays seedlings leaves under cadmium stress. Plant Sci. J. 2018, 36, 291–299. (In Chinese) [Google Scholar]
  35. Qu, D.Y.; Gu, W.R.; Zhang, L.G.; Chen, X.C.; Li, J.; Li, C.F.; Wei, S. Effect of Exogenous Chitosan on Antioxidant Enzyme Activities and Endogenous Hormones in Maize Seedlings Root under Cadmium Stress. Acta Bot. Boreal.-Occident. Sin. 2017, 37, 719–727. (In Chinese) [Google Scholar]
  36. Wei, C.; Jiao, Q.J.; Agathokleous, E.; Liu, H.T.; Li, G.Z.; Zhang, J.J.; Fahad, S.; Jiang, Y. Hormetic effects of zinc on growth and antioxidant defense system of wheat plants. Sci. Total Environ. 2022, 807, 150992. [Google Scholar] [CrossRef] [PubMed]
  37. Liu, H.T.; Jiao, Q.J.; Fan, L.N.; Jiang, Y.; Alyemeni, M.N.; Ahmad, P.; Chen, Y.L.; Zhu, M.; Liu, H.P.; Zhao, Y.; et al. Integrated physio-biochemical and transcriptomic analysis revealed mechanism underlying of Si-mediated alleviation to cadmium toxicity in wheat. J. Hazard. Mater. 2023, 452, 131366. [Google Scholar] [CrossRef]
  38. Shi, H.T. Experimental Guidance in Plant Stress Physiology, 1st ed.; Science Press: Beijing, China, 2016. (In Chinese) [Google Scholar]
  39. Hniličková, H.; Hnilička, F.; Orsák, M.; Hejnák, V. Effect of salt stress on growth, electrolyte leakage, Na+ and K+ content in selected plant species. Plant Soil Environ. 2019, 65, 90–96. [Google Scholar] [CrossRef]
  40. Draper, H.; Squires, E.; Mahmoodi, H.; Wu, J.; Agarwal, S.; Hadley, M. A comparative evaluation of thiobarbituric acid methods for the determination of malondialdehyde in biological materials. Free. Radic. Biol. Med. 1993, 15, 353–363. [Google Scholar] [CrossRef]
  41. Mukherjee, S.P.; Choudhuri, M.A. Implications of water stress-induced changes in the levels of endogenous ascorbic acid and hydrogen peroxide in Vigna seedlings. Physiol. Plant. 1983, 58, 166–170. [Google Scholar] [CrossRef]
  42. Bradford, M.M. A rapid and sensitive method for the quantitation of microgram quantities of protein utilizing the principle of protein-dye binding. Anal. Biochem. 1976, 72, 248–254. [Google Scholar] [CrossRef] [PubMed]
  43. Beauchamp, C.; Fridovich, I. Superoxide dismutase: Improved assays and an assay applicable to acrylamide gels. Anal. Biochem. 1971, 44, 276–287. [Google Scholar] [CrossRef] [PubMed]
  44. Aebi, H. Catalase in vitro. Methods Enzym. 1984, 105, 121–126. [Google Scholar]
  45. Maehly, A.C.; Chance, B. The assay of catalases and peroxidases. Methods Biochem. Anal. 1954, 1, 357–424. [Google Scholar] [PubMed]
  46. Nakano, Y.; Asada, K. Hydrogen Peroxide is Scavenged by Ascorbate-specific Peroxidase in Spinach Chloroplasts. Plant Cell Physiol. 1981, 22, 867–880. [Google Scholar] [CrossRef]
  47. Tejera, N.; Soussi, M.; Lluch, C. Physiological and nutritional indicators of tolerance to salinity in chickpea plants growing under symbiotic conditions. Environ. Exp. Bot. 2006, 58, 17–24. [Google Scholar] [CrossRef]
  48. Tuteja, N. Mechanisms of high salinity tolerance in plants. Methods Enzym. 2007, 428, 419–438. [Google Scholar]
  49. Sun, C.X.; Gao, X.X.; Fu, J.Q.; Zhou, J.H.; Wu, X.F. Metabolic response of maize (Zea mays L.) plants to combined drought and salt stress. Plant Soil 2015, 388, 99–117. [Google Scholar] [CrossRef]
  50. Miao, Y.X.; Luo, X.Y.; Gao, X.X.; Wang, W.J.; Li, B.; Hou, L.P. Exogenous salicylic acid alleviates salt stress by improving leaf photosynthesis and root system architecture in cucumber seedlings. Sci. Hortic. 2020, 272, 109577. [Google Scholar] [CrossRef]
  51. Tabassum, M.; Noreen, Z.; Aslam, M.; Shah, A.N.; Usman, S.; Waqas, A.; Alsherif, E.A.; Korany, S.M.; Nazim, M. Chitosan modulated antioxidant activity, inorganic ions homeostasis and endogenous melatonin to improve yield of Pisum sativum L. accessions under salt stress. Sci. Hortic. 2024, 323, 112509. [Google Scholar] [CrossRef]
  52. Sofy, A.R.; Dawoud, R.A.; Sofy, M.R.; Mohamed, H.I.; Hmed, A.A.; El-Dougdoug, N.K. Improving Regulation of Enzymatic and Non-Enzymatic Antioxidants and Stress-Related Gene Stimulation in Cucumber mosaic cucumovirus-Infected Cucumber Plants Treated with Glycine Betaine, Chitosan and Combination. Molecules 2020, 25, 2341. [Google Scholar] [CrossRef]
  53. van Zelm, E.; Bugallo-Alfageme, S.; Behrouzi, P.; Meyer, A.J.; Testerink, C.; Gommers, C.M.M. Natural variation in salt-induced root growth phases and their contribution to root architecture plasticity. Plant Cell Environ. 2023, 46, 2174–2186. [Google Scholar] [CrossRef]
  54. Julkowska, M.M.; Hoefsloot, H.C.; Mol, S.; Feron, R.; de Boer, G.-J.; Haring, M.A.; Testerink, C. Capturing Arabidopsis Root Architecture Dynamics with root-fit Reveals Diversity in Responses to Salinity. Plant Physiol. 2014, 166, 1387–1402. [Google Scholar] [CrossRef]
  55. Mahajan, S.; Tuteja, N. Cold, salinity and drought stresses: An overview. Arch. Biochem. Biophys. 2005, 444, 139–158. [Google Scholar] [CrossRef]
  56. Fan, L.; Dalpé, Y.; Fang, C.Q.; Dubé, C.; Khanizadeh, S. Influence of arbuscular mycorrhizae on biomass and root morphology of selected strawberry cultivars under salt stress. Botany 2011, 89, 397–403. [Google Scholar] [CrossRef]
  57. Altaf, M.A.; Shahid, R.; Ren, M.-X.; Altaf, M.M.; Khan, L.U.; Shahid, S.; Jahan, M.S. Melatonin alleviates salt damage in tomato seedling: A root architecture system, photosynthetic capacity, ion homeostasis, and antioxidant enzymes analysis. Sci. Hortic. 2021, 285, 110145. [Google Scholar] [CrossRef]
  58. Zong, H.Y.; Liu, S.; Xing, R.E.; Chen, X.L.; Li, P.C. Protective effect of chitosan on photosynthesis and antioxidative defense system in edible rape (Brassica rapa L.) in the presence of cadmium. Ecotoxicol. Environ. Saf. 2017, 138, 271–278. [Google Scholar] [CrossRef] [PubMed]
  59. Shehzad, M.A.; Nawaz, F.; Ahmad, F.; Ahmad, N.; Masood, S. Protective effect of potassium and chitosan supply on growth, physiological processes and antioxidative machinery in sunflower (Helianthus annuus L.) under drought stress. Ecotoxicol. Environ. Saf. 2020, 187, 109841. [Google Scholar] [CrossRef] [PubMed]
  60. Zhang, G.; Wang, Y.H.; Wu, K.; Zhang, Q.; Feng, Y.N.; Miao, Y.; Yan, Z.M. Exogenous Application of Chitosan Alleviate Salinity Stress in Lettuce (Lactuca sativa L.). Horticulturae 2021, 7, 342. [Google Scholar] [CrossRef]
  61. ALKahtani, M.D.F.; Attia, K.A.; Hafez, Y.M.; Khan, N.; Eid, A.M.; Ali, M.A.M.; Abdelaal, K.A.A. Chlorophyll Fluorescence Parameters and Antioxidant Defense System Can Display Salt Tolerance of Salt Acclimated Sweet Pepper Plants Treated with Chitosan and Plant Growth Promoting Rhizobacteria. Agronomy 2020, 10, 1180. [Google Scholar] [CrossRef]
  62. Quitadamo, F.; De Simone, V.; Beleggia, R.; Trono, D. Chitosan-Induced Activation of the Antioxidant Defense System Counteracts the Adverse Effects of Salinity in Durum Wheat. Plants 2021, 10, 1365. [Google Scholar] [CrossRef]
  63. Liu, Z.Q.; Liu, T.; Liang, L.L.; Li, Z.; Hassan, M.J.; Peng, Y.; Wang, D. Enhanced photosynthesis, carbohydrates, and energy metabolism associated with chitosan-induced drought tolerance in creeping bentgrass. Crop Sci. 2020, 60, 1064–1076. [Google Scholar] [CrossRef]
  64. Razavizadeh, R.; Adabavazeh, F.; Komatsu, S. Chitosan effects on the elevation of essential oils and antioxidant activity of Carum copticum L. seedlings and callus cultures under in vitro salt stress. J. Plant Biochem. Biotechnol. 2020, 29, 473–483. [Google Scholar] [CrossRef]
  65. Ávila, R.G.; Magalhães, P.C.; Vitorino, L.C.; Bessa, L.A.; de Souza, K.R.D.; Queiroz, R.B.; Jakelaitis, A.; Teixeira, M.B. Chitosan Induces Sorghum Tolerance to Water Deficits by Positively Regulating Photosynthesis and the Production of Primary Metabolites, Osmoregulators, and Antioxidants. J. Soil Sci. Plant Nutr. 2022, 23, 1156–1172. [Google Scholar] [CrossRef]
  66. Jiao, Z.L.; Li, Y.; Li, J.J.; Xu, X.Y.; Li, H.; Lu, D.Q.; Wang, J.Y. Effects of Exogenous Chitosan on Physiological Characteristics of Potato Seedlings Under Drought Stress and Rehydration. Potato Res. 2012, 55, 293–301. [Google Scholar] [CrossRef]
  67. Younas, H.S.; Abid, M.; Ashraf, M. Ameliorating detrimental effects of water deficit stress in maize by foliarally applied silicon and chitosan. Pak. J. Bot. 2022, 54, 393–400. [Google Scholar] [CrossRef]
  68. Younas, H.S.; Abid, M.; Ashraf, M.; Shaaban, M. Seed priming with silicon and chitosan for alleviating water stress effects in maize (ZEA MAYS L.) by improving antioxidant enzyme activities, water status and photosynthesis. J. Plant Nutr. 2022, 45, 2263–2276. [Google Scholar] [CrossRef]
  69. Attia, M.S.; Osman, M.S.; Mohamed, A.S.; Mahgoub, H.A.; Garada, M.O.; Abdelmouty, E.S.; Latef, A.A.H.A. Impact of Foliar Application of Chitosan Dissolved in Different Organic Acids on Isozymes, Protein Patterns and Physio-Biochemical Characteristics of Tomato Grown under Salinity Stress. Plants 2021, 10, 388. [Google Scholar] [CrossRef]
Figure 1. Effect of exogenous chitosan (CTS) on maize seedlings growth phenotype and root morphology under salt stress. CK: control; CTS: 75 mg L−1 CTS; S: 150 mM NaCl; CTS + S: 75 mg L−1 CTS + 150 mM NaCl.
Agriculture 14 00304 g001
Figure 2. Effect of exogenous chitosan (CTS) on maize seedlings percentage of root morphology (RL, SA, RV) under salt stress. CK: control; CTS: 75 mg L−1 CTS; S: 150 mM NaCl; CTS + S: 75 mg L−1 CTS + 150 mM NaCl.
Agriculture 14 00304 g002
Figure 3. Effect of exogenous chitosan (CTS) on Na concentration in leaf (A) and root (B) of maize seedlings under salt stress. The significance differences between treatments were assessed using one-way ANOVA. Lowercase letters positioned above bars indicated the significant difference among treatments at the level of p < 0.05. CK: control; CTS: 75 mg L−1 CTS; S: 150 mM NaCl; CTS + S: 75 mg L−1 CTS + 150 mM NaCl.
Agriculture 14 00304 g003
Figure 4. Effect of chitosan (CTS) on photosynthetic parameters (Pn (A), Gs (B), Ci (C), Tr (D)), Ls (E) and chlorophyll content (Chla (F), Chlb (G), TChl (H)) of maize seedling under salt stress. The significance differences between treatments were assessed using one-way ANOVA. Lowercase letters positioned above bars indicated the significant difference among treatments at the level of p < 0.05. CK: control; CTS: 75 mg L−1 CTS; S: 150 mM NaCl; CTS + S: 75 mg L−1 CTS + 150 mM NaCl.
Agriculture 14 00304 g004
Figure 5. Effect of chitosan (CTS) on relative electrolyte conductivity (A,B) and malondialdehyde (MDA) (C,D) content of maize seedling in leaf and root tissue under salt stress. The significance differences between treatments were assessed using one-way ANOVA. Lowercase letters positioned above bars indicated the significant difference among treatments at the level of p < 0.05. CK: control; CTS: 75 mg L−1 CTS; S: 150 mM NaCl; CTS + S: 75 mg L−1 CTS + 150 mM NaCl.
Agriculture 14 00304 g005
Figure 6. Effect of exogenous chitosan (CTS) on the ascorbate (AsA) content of maize seedling in leaf (A) and root (B) tissue under salt stress. The significance differences between treatments were assessed using one-way ANOVA. Lowercase letters positioned above bars indicated the significant difference among treatments at the level of p < 0.05. CK: control; CTS: 75 mg L−1 CTS; S: 150 mM NaCl; CTS + S: 75 mg L−1 CTS + 150 mM NaCl.
Agriculture 14 00304 g006
Figure 7. Effect of exogenous chitosan (CTS) on soluble protein content (A,B) and the SOD (C,D), CAT (E,F), APX (G,H), and POD (I,J) activities of maize seedling in leaf and root tissue under salt stress. The significance differences between treatments were assessed using one-way ANOVA. Lowercase letters positioned above bars indicated the significant difference among treatments at the level of p < 0.05. CK: control; CTS: 75 mg L−1 CTS; S: 150 mM NaCl; CTS + S: 75 mg L−1 CTS + 150 mM NaCl.
Agriculture 14 00304 g007
Figure 8. The primary component of primary component analysis (PCA) of indexes of maize seedlings induced by exogenous chitosan (CTS) under salt stress. In there symbols, “triangle” displayed the CK treatment, “plus” presented the CTS group, “x” showed the S treatment, “square” exhibited the CTS + S group. CK: control; CTS: 75 mg L−1 CTS; S: 150 mM NaCl; CTS + S: 75 mg L−1 CTS + 150 mM NaCl.
Agriculture 14 00304 g008
Figure 9. Primary component analysis (PCA) results of treatments (A) and indexes (B) of maize seedlings induced by exogenous chitosan (CTS) under salt stress. Shoot FW: shoot fresh weight; Root FW: root fresh weight; Shoot DW: shoot dry weight; Root DW: root dry weight; Shoot Ti: shoot tolerance index; Root Ti: root tolerance index; RL: total root length; SA: root surface area; RD: root average diameter; RV: root volume; RT: root tips; RF: root forks; I: 0 < RD < 0.5 mm; II: 0.5 < RD < 1.0 mm; III: 1.0 < RD < 1.5 mm; IV: RD > 1.5 mm; Chla: chlorophyll a; Chlb: chlorophyll b; TChl: total chlorophyll; Pn: photosynthetic rate; Gs: stomatal conductance; Ci: intercellular CO2 concentration; Tr: transpiration rate; Ls: stomatal limitation; REC: relative electrolyte conductivity; MDA: malondialdehyde; AsA: ascorbate; SOD: superoxide dismutase; CAT: catalase; APX: ascorbate peroxidase; POD: peroxidase; CK: control; CTS: 75 mg L−1 CTS; S: 150 mM NaCl; CTS + S: 75 mg L−1 CTS + 150 mM NaCl.
Agriculture 14 00304 g009
Figure 10. Correlation analysis depicting the relationship between various indices of maize seedlings subjected to exogenous CTS under salt stress condition. Shoot FW: shoot fresh weight; Root FW: root fresh weight; Shoot DW: shoot dry weight; Root DW: root dry weight; Shoot Ti: shoot tolerance index; Root Ti: root tolerance index; RL: total root length; SA: root surface area; RD: root average diameter; RV: root volume; RT: root tips; RF: root forks; I: 0 < RD < 0.5 mm; II: 0.5 < RD < 1.0 mm; III: 1.0 < RD < 1.5 mm; IV: RD > 1.5 mm; Chla: chlorophyll a; Chlb: chlorophyll b; TChl: total chlorophyll; Pn: photosynthetic rate; Gs: stomatal conductance; Ci: intercellular CO2 concentration; Tr: transpiration rate; Ls: stomatal limitation; REC: relative electrolyte conductivity; MDA: malondialdehyde; AsA: ascorbate; SOD: superoxide dismutase; CAT: catalase; APX: ascorbate peroxidase; POD: peroxidase.
Agriculture 14 00304 g010
Figure 11. Heatmap analysis depicting the response of maize seedlings to exogenous CTS under salt stress condition. Shoot FW: shoot fresh weight; Root FW: root fresh weight; Shoot DW: shoot dry weight; Root DW: root dry weight; Shoot Ti: shoot tolerance index; Root Ti: root tolerance index; RL: total root length; SA: root surface area; RD: root average diameter; RV: root volume; RT: root tips; RF: root forks; I: 0 < RD < 0.5 mm; II: 0.5 < RD < 1.0 mm; III: 1.0 < RD < 1.5 mm; IV: RD > 1.5 mm; Chla: chlorophyll a; Chlb: chlorophyll b; TChl: total chlorophyll; Pn: photosynthetic rate; Gs: stomatal conductance; Ci: intercellular CO2 concentration; Tr: transpiration rate; Ls: stomatal limitation; REC: relative electrolyte conductivity; MDA: malondialdehyde; AsA: ascorbate; SOD: superoxide dismutase; CAT: catalase; APX: ascorbate peroxidase; POD: peroxidase; CK: control; CTS: 75 mg L−1 CTS; S: 150 mM NaCl; CTS + S: 75 mg L−1 CTS + 150 mM NaCl.
Agriculture 14 00304 g011
Figure 12. Application of random forest analysis to assess the response of maize seedlings to exogenous CTS under salt stress conditions. RL: total root length; SA: root surface area; RD: root average diameter; RV: root volume; II: 0.5 < RD < 1.0 mm; III: 1.0 < RD < 1.5 mm; IV: RD > 1.5 mm; TChl: total chlorophyll; MDA: malondialdehyde; AsA: ascorbate; CK: control; CTS: 75 mg L−1 CTS; S: 150 mM NaCl; CTS + S: 75 mg L−1 CTS + 150 mM NaCl.
Agriculture 14 00304 g012
Figure 13. The variable importance for projection (VIP) values derived from the partial least squares (PLS) model and the key factors influencing shoot tolerance (A) and root tolerance (B) in maize seedlings subjected to exogenous CTS under salt stress condition. RL: total root length; SA: root surface area; RD: root average diameter; RV: root volume; RT: root tips; RF: root forks; I: 0 < RD < 0.5 mm; II: 0.5 < RD < 1.0 mm; III: 1.0 < RD < 1.5 mm; IV: RD > 1.5 mm; Chla: chlorophyll a; Chlb: chlorophyll b; TChl: total chlorophyll; Pn: photosynthetic rate; Gs: stomatal conductance; Ci: intercellular CO2 concentration; Tr: transpiration rate; Ls: stomatal limitation; REC: relative electrolyte conductivity; MDA: malondialdehyde; AsA: ascorbate; SOD: superoxide dismutase; CAT: catalase; APX: ascorbate peroxidase; POD: peroxidase.
Agriculture 14 00304 g013
Table 1. Effect of chitosan (CTS) on growth parameter and tolerance index of maize seedlings under salt stress. Lowercase letters positioned above bars indicate the significant difference between treatments at the level of 0.05 (p < 0.05). CK: control; CTS: 75 mg L−1 CTS; S: 150 mM NaCl; CTS + S: 75 mg L−1 CTS + 150 mM NaCl.
TreatmentCKCTSSCTS + S
Shoot height (cm)51.03 ± 1.70 a46.6 ± 0.26 b21.43 ± 0.49 d31.67 ± 1.00 c
Main root length (cm)30.63 ± 1.21 a32.8 ± 3.30 a18.57 ± 1.29 b20.23 ± 0.25 b
Shoot FW (g plant−1)4.93 ± 0.37 a5.01 ± 0.45 a1.28 ± 0.05 c2.16 ± 0.05 b
Root FW (g plant−1)1.62 ± 0.12 ab1.78 ± 0.13 a1.00 ± 0.03 c1.48 ± 0.11 b
Shoot DW (g plant−1)0.34 ± 0.02 a0.30 ± 0.01 b0.12 ± 0.00 d0.19 ± 0.01 c
Root DW (g plant−1)0.08 ± 0.00 a0.08 ± 0.01 a0.06 ± 0.00 c0.07 ± 0.00 b
Root/shoot ratio0.24 ± 0.01 c0.26 ± 0.02 c0.48 ± 0.03 a0.37 ± 0.02 b
Shoot tolerance index100.00 ± 7.21 a90.03 ± 2.10 b35.61 ± 1.24 d57.28 ± 2.35 c
Root tolerance index100.00 ± 2.98 a97.74 ± 6.84 a72.04 ± 4.70 c89.10 ± 1.21 b
Table 2. Effect of chitosan (CTS) on root morphology parameters of maize seedlings under salt stress. Lowercase letters indicated the significant difference between treatments at the level of 0.05 (p < 0.05). I: 0 < RD < 0.5 mm; II: 0.5 < RD < 1.0 mm; III: 1.0 < RD < 1.5 mm; IV: RD > 1.5 mm. CK: control; CTS: 75 mg L−1 CTS; S: 150 mM NaCl; CTS + S: 75 mg L−1 CTS + 150 mM NaCl.
TreatmentCKCTSSCTS + S
Total root length (cm)794.67 ± 41.94 b864.74 ± 50.20 a337.73 ± 5.63 d684.86 ± 9.78 c
I616.05 ± 44.13 a665.65 ± 31.47 a248.48 ± 5.62 c533.89 ± 12.54 b
II146.77 ± 4.42 a132.71 ± 0.58 b66.23 ± 8.23 d117.82 ± 2.24 c
III13.53 ± 2.18 b21.33 ± 3.08 a12.54 ± 0.28 b23.39 ± 0.70 a
IV7.57 ± 0.18 c10.75 ± 0.67 b8.79 ± 0.89 c12.34 ± 0.95 a
Root surface area (cm2)93.22 ± 8.08 a98.81 ± 7.39 a49.01 ± 2.08 b88.68 ± 0.54 a
I28.89 ± 1.64 b39.76 ± 2.44 a15.79 ± 0.54 c29.78 ± 3.46 b
II31.86 ± 0.66 a29.87 ± 0.75 b13.25 ± 0.85 d25.29 ± 0.87 c
III5.08 ± 0.80 c6.95 ± 0.67 b4.71 ± 0.13 c8.73 ± 0.20 a
IV6.32 ± 0.29 b7.72 ± 1.25 b7.90 ± 0.89 ab9.54 ± 0.97 a
Root volume (cm3)0.82 ± 0.08 b0.92 ± 0.06 ab0.59 ± 0.01 c0.93 ± 0.02 a
I0.25 ± 0.00 a0.26 ± 0.02 a0.09 ± 0.01 c0.21 ± 0.01 b
II0.61 ± 0.01 a0.53 ± 0.02 b0.22 ± 0.01 d0.48 ± 0.01 c
III0.15 ± 0.02 c0.21 ± 0.02 b0.14 ± 0.01 c0.26 ± 0.01 a
IV0.54 ± 0.02 b0.59 ± 0.07 b0.63 ± 0.04 b0.92 ± 0.07 a
Root diameter (mm)0.35 ± 0.01 c0.36 ± 0.01 c0.46 ± 0.01 a0.42 ± 0.00 b
Root tips1644.33 ± 128.10 a1551.67 ± 26.27 a577 ± 46.68 c1052.33 ± 13.80 b
Root Forks2544.33 ± 288.27 b3232 ± 181.36 a1453.67 ± 109.86 c2676.67 ± 274.80 b
Table 3. Effect of CTS on comprehensive evaluation of salt tolerance index of maize seedlings under salt stress. CK: control; CTS: 75 mg L−1 CTS; S: 150 mM NaCl; CTS + S: 75 mg L−1 CTS + 150 mM NaCl.
ItemS Treatment (mmol L−1)CTS Treatment (mg L−1)Average ValueRank
CK000.801
CTS0750.792
S15000.124
CTS + S150750.533
Disclaimer/Publisher’s Note: The statements, opinions and data contained in all publications are solely those of the individual author(s) and contributor(s) and not of MDPI and/or the editor(s). MDPI and/or the editor(s) disclaim responsibility for any injury to people or property resulting from any ideas, methods, instructions or products referred to in the content.

