Article

Response of Yield Formation of Maize Hybrids to Different Planting Densities

1
Institute for Animal Husbandry, 11080 Belgrade, Serbia
2
Agrounik d.o.o., 11000 Belgrade, Serbia
3
Maize Research Institute “Zemun Polje”, Zemun, 11185 Belgrade, Serbia
*
Author to whom correspondence should be addressed.
Agriculture 2024, 14(3), 351; https://doi.org/10.3390/agriculture14030351
Submission received: 4 January 2024 / Revised: 2 February 2024 / Accepted: 20 February 2024 / Published: 22 February 2024
(This article belongs to the Section Crop Production)

Abstract

:
Crop density is a means that controls grain yield establishment. This study was focused on evaluating the effect of four crop densities (CD1—50,125 plants ha−1, CD2—59,523 plants ha−1, CD3—69,686 plants ha−1, and CD4—79,365 plants ha−1) on yield components, grain yield, sustainable yield index (SYI), and rain use efficiency (RUE) of the maize hybrids ZP 500, NS 5010, and AS 534 during 2016–2018. In 2017, due to unfavorable meteorological conditions, ear length, number of grains per ear, grain weight per ear, 1000-grain weight, grain yield, SYI, and RUE were low compared to 2016 and 2018. The hybrid NS 5010 had the lowest ear length, number of grains per ear, grain weight per ear, 1000-grain weight, grain yield, and SYI. Increasing crop density significantly decreased yield components and increased grain yield, SYI, and RUE. The lowest ear length was recorded in treatments CD3 and CD4, the lowest number of grains per ear, grain weight per ear, and 1000-grain weight in treatment CD4. However, the highest grain yield, SYI, and RUE were recorded in the CD4 treatment because the number of plants per unit area is an essential determinant of the final grain yield.

1. Introduction

Maize (Zea mays L.) is the most produced cereal crop in the world. It is grown on about 206 million ha, with an annual total grain production of 1.2 million tons and an average yield of 5.8 t ha−1 in 2021 [1]. This large arable land use for maize is closely related both to its wide adaptability to different agro-climatic conditions and to the fact that it is a multipurpose crop used for human food, livestock feed, as raw material for industry, and for biofuel. In Serbia, the total production of maize grain in 2022 was 4.3 million tons grown on 952,216 ha, with the average yield being 4.5 t ha−1 [2]. The Vojvodina region covers a total area of 1,488,370 ha of arable land in Serbia on which cereal crops are represented with 932,865 ha. Maize is one of the most important crops grown in this region, with 543,650 ha, an annual total grain production of 2.4 million tons, and an average yield of 4.4 t ha−1 [2]. However, maize growers often have significant grain yield losses because of inadequate crop densities and other agricultural management practices [3,4]. It is estimated that these yield losses are around 20% worldwide, while in Serbia they are from 1.5 to 2.2 t ha−1 due to about 30% plant loss from sowing to harvest [5]. Increasing crop density has a significant role in increasing the grain yield of maize worldwide [6]. It is necessary to determine the optimal crop density for each maize hybrid, in which it achieves the maximum sustainable grain yield [7], because the response of maize to crop density depends on the genotype [8]. Density-tolerant genotypes of maize have a more rational canopy architecture, better photosynthetic capacity, more stable yield, and better use efficiency of water, light, and nutrient resources [9]. Low and high crop densities significantly reduce the grain yield of maize. With increasing crop density, intraspecific competition of plants for space, nutrients, and light increases, causing abiotic stress in plants and thereby decreasing maize productivity and resource use efficiency [10]. Higher crop density over optimal density reduces plant net photosynthetic rate, stomatal conductance, and leaf chlorophyll content of plants, essentially contributing to declining productivity and yield stability [9]. Under these conditions, maize yield components, especially the number of grains and of grain weight per ear are declining linearly, leading to lower grain yields per plant [11,12]. In addition, a higher crop density decreases the harvest index and total biomass per plant [13] and increases ear barrenness and stem lodging [14,15].
For the purpose of this study, we conducted a 3-year field experiment on maize in the Vojvodina region of Serbia to investigate the effects of different hybrids and planting densities on yield components, grain yield, sustainable yield index, and rain use efficiency under dryland conditions. The present study was planned to find optimal crop densities to improve the grain yield of maize hybrids, considering the hypothesis that the hybrids react differently to crop density due to greater or lesser tolerance to density. Moreover, meteorological conditions in Serbia are variable and affect crop yields. Commercial and pre-commercial hybrids of maize have to be tested at various densities and in various environments to provide accurate recommendations [16]. Therefore, the technology of growing maize for maximum grain yield must be determined for local conditions, similar to Djaman et al. [8], who indicated the need for such research.

2. Materials and Methods

2.1. Experimental Trials and Treatments

Field trials with three maize hybrids were carried out in a calcareous chernozem soil type [17] in Serbia, Vojvodina Province, Srem region (latitude: 44°99′ N, longitude: 19°97′ E, altitude; 110 m a.s.l.) during three consecutive growing seasons (2016–2018). The Srem region is characterized by a moderately continental climate with cold winters and hot summers. Three Serbian maize hybrids were used for testing: ZP 500, NS 5010, and AS 534. The soil analysis of the 0–30 cm topsoil layer showed that the soil has a pH in KCL of 7.2 and contained 0.18% total N, 7.99% CaCO3, 3.1% organic matter, 21.01 mg 100 g−1 soil AL-soluble P2O5, and 22.75 mg 100 g−1 soil AL-soluble K2O. Four crop densities, 50,125 (CD1), 59,523 (CD2), 69,686 (CD3), and 79,365 plants ha−1 (CD4) were tested. In 2016, maize was sown on 14 April, in 2017 on 16 April, and in 2018 on 15 April. The sub-plot area was 16.8 m2, being 6 m long by four rows with a 70 cm inter-row spacing and various intra-row spacings (30 cm—CD1, 28 cm—CD2, 24 cm—CD3, and 20 cm—CD4). The treatments were arranged in a completely randomized block system using four replications. In all research years, the preceding crop was winter wheat. The NPK fertilizer (10-30-20) was incorporated before sowing at 300 kg ha−1 into the top 0–30 cm soil depth. Fertilizer KAN—27% was applied at rates of 60 kg ha−1 in two splits at 3 leaves and 7–9 leaves. The commercial biostimulant Slavol S, which contains auxins with concentrations from 0.1 to 1 μg L−1, originating from bacteria Bacillus subtilis and Bacillus megaterium, was used for bacterization seeds. A standard cultivation practice was applied.

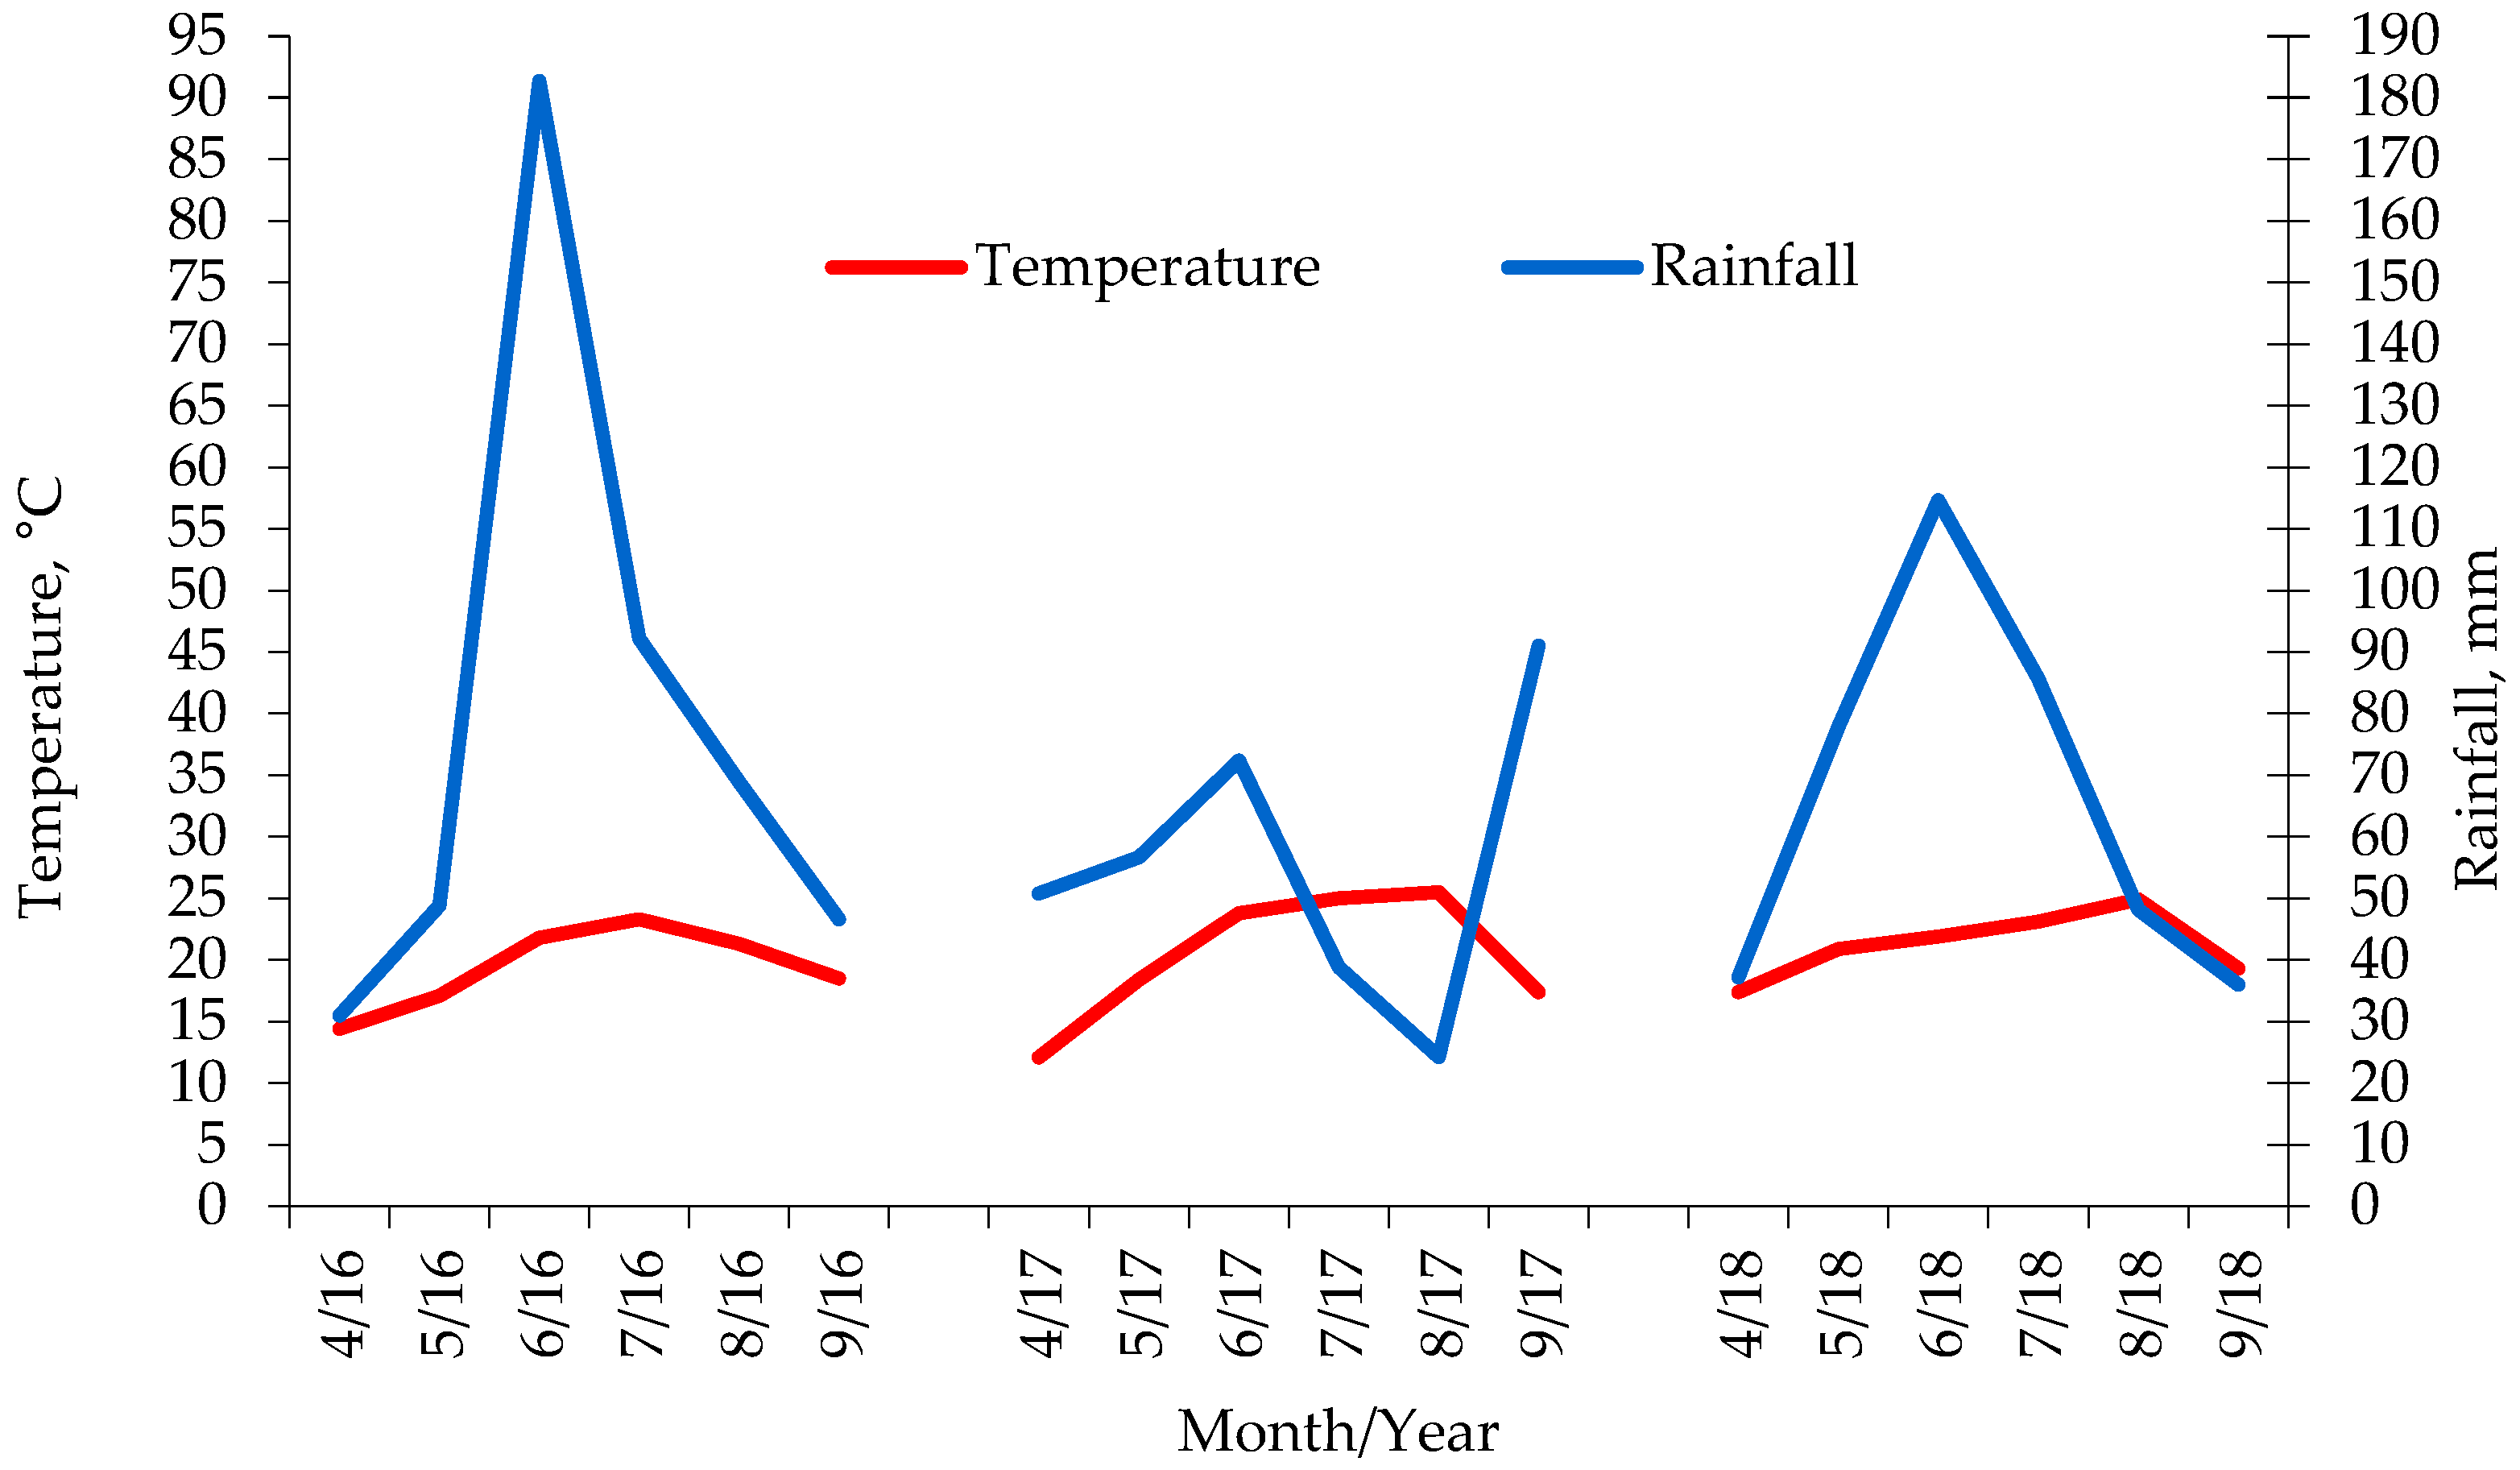
2.2. Meteorological Data

The amount of rainfall and monthly air temperature during the maize growing season (April–September) were the most favorable in 2016 (470.2 mm and 19.4 °C) (Figure 1). Compared to 2016, the average temperature increased by 1 °C in 2017 and 1.9 °C in 2018, while the amount of rainfall decreased by 136.0 mm in 2017 and 70.7 mm in 2018. The climate diagram according to Walter and Lieth [18] showed there was no drought period in 2016. Furthermore, the climate diagram indicates that the drought on site in 2017 started in July at the stage of flowering (pollen shed and silk emergence) and ended in August at the grain-filling stage. In 2018, drought periods were in August at the stage of grain-filling and September during the ripening period.

2.3. Data Collection

In the investigated years, harvesting of maize was performed manually in the first decade of October. The ears from the central two rows of each plot were harvested to determine grain yield, and this was expressed at 14% moisture. Ear length, number of grains per ear, grain weight per ear, and 1000-grain weight were recorded based on ten ears per subplot. The following formula was used to calculate the rain use efficiency (kg ha−1 mm−1):
RUE = grain yield/growing season rainfall (April to September).
The parameter crop yield stability or coefficient of variation (CV, %) was calculated according to the following formula:
CV = standard deviation of the grain yield of a particular treatment (STD (Yt))/particular treatment average yield (AVE (Yt)) × 100.
The sustainable yield index (SYI) was calculated using a formula of Li et al. [19] (2016):
SYI = the average yield of treatment (AVE (Yt)) − standard deviation of the grain yield of a particular treatment (STD (Yt))/the maximum crop yield attained by any treatment (Ymax).

2.4. Statistical Data Analysis

ANOVA was used to analyze the differences among means using the STATISTICA software version 13 (StatSoft, Tulsa, OK, USA), and statistical significance was set at levels p ≤ 0.05 and p ≤ 0.01. The means were compared using Tukey’s test at level p ≤ 0.05. The Shapiro–Wilk test was used for the normality test of the data, and the results were normal. Principal component analysis (PCA) as a dimensionality reduction method was used for the evaluation of interdependence between hybrids and sowing densities regarding measured and calculated parameters (ear length, number of grains per ear, grain weight per ear, 1000-grain weight, and rain use efficiency). Statistical analysis was performed using SPSS for Windows version 15.0.
Also, to determine the stability based on the obtained results, an additive main effect and multiplicative interaction (AMMI) analysis was performed. Combinations of all three observed years and four plant densities were considered as an environment (CD1-4 × 2016, 2017, 2018 = 12 environments). Results are presented graphically via biplots. On the AMMI1 biplot, the ratio of the first principal component (PC1) and the mean value of the observed characteristic is shown, while on the AMMI2 biplot, the ratio of the first and second principal components (PC1 and PC2) is shown. The analysis was performed using the free R software version 4.3.2 [20].
The relationship between two variables was determined by the Pearson correlation coefficient for the average of the three continuous years.

3. Results

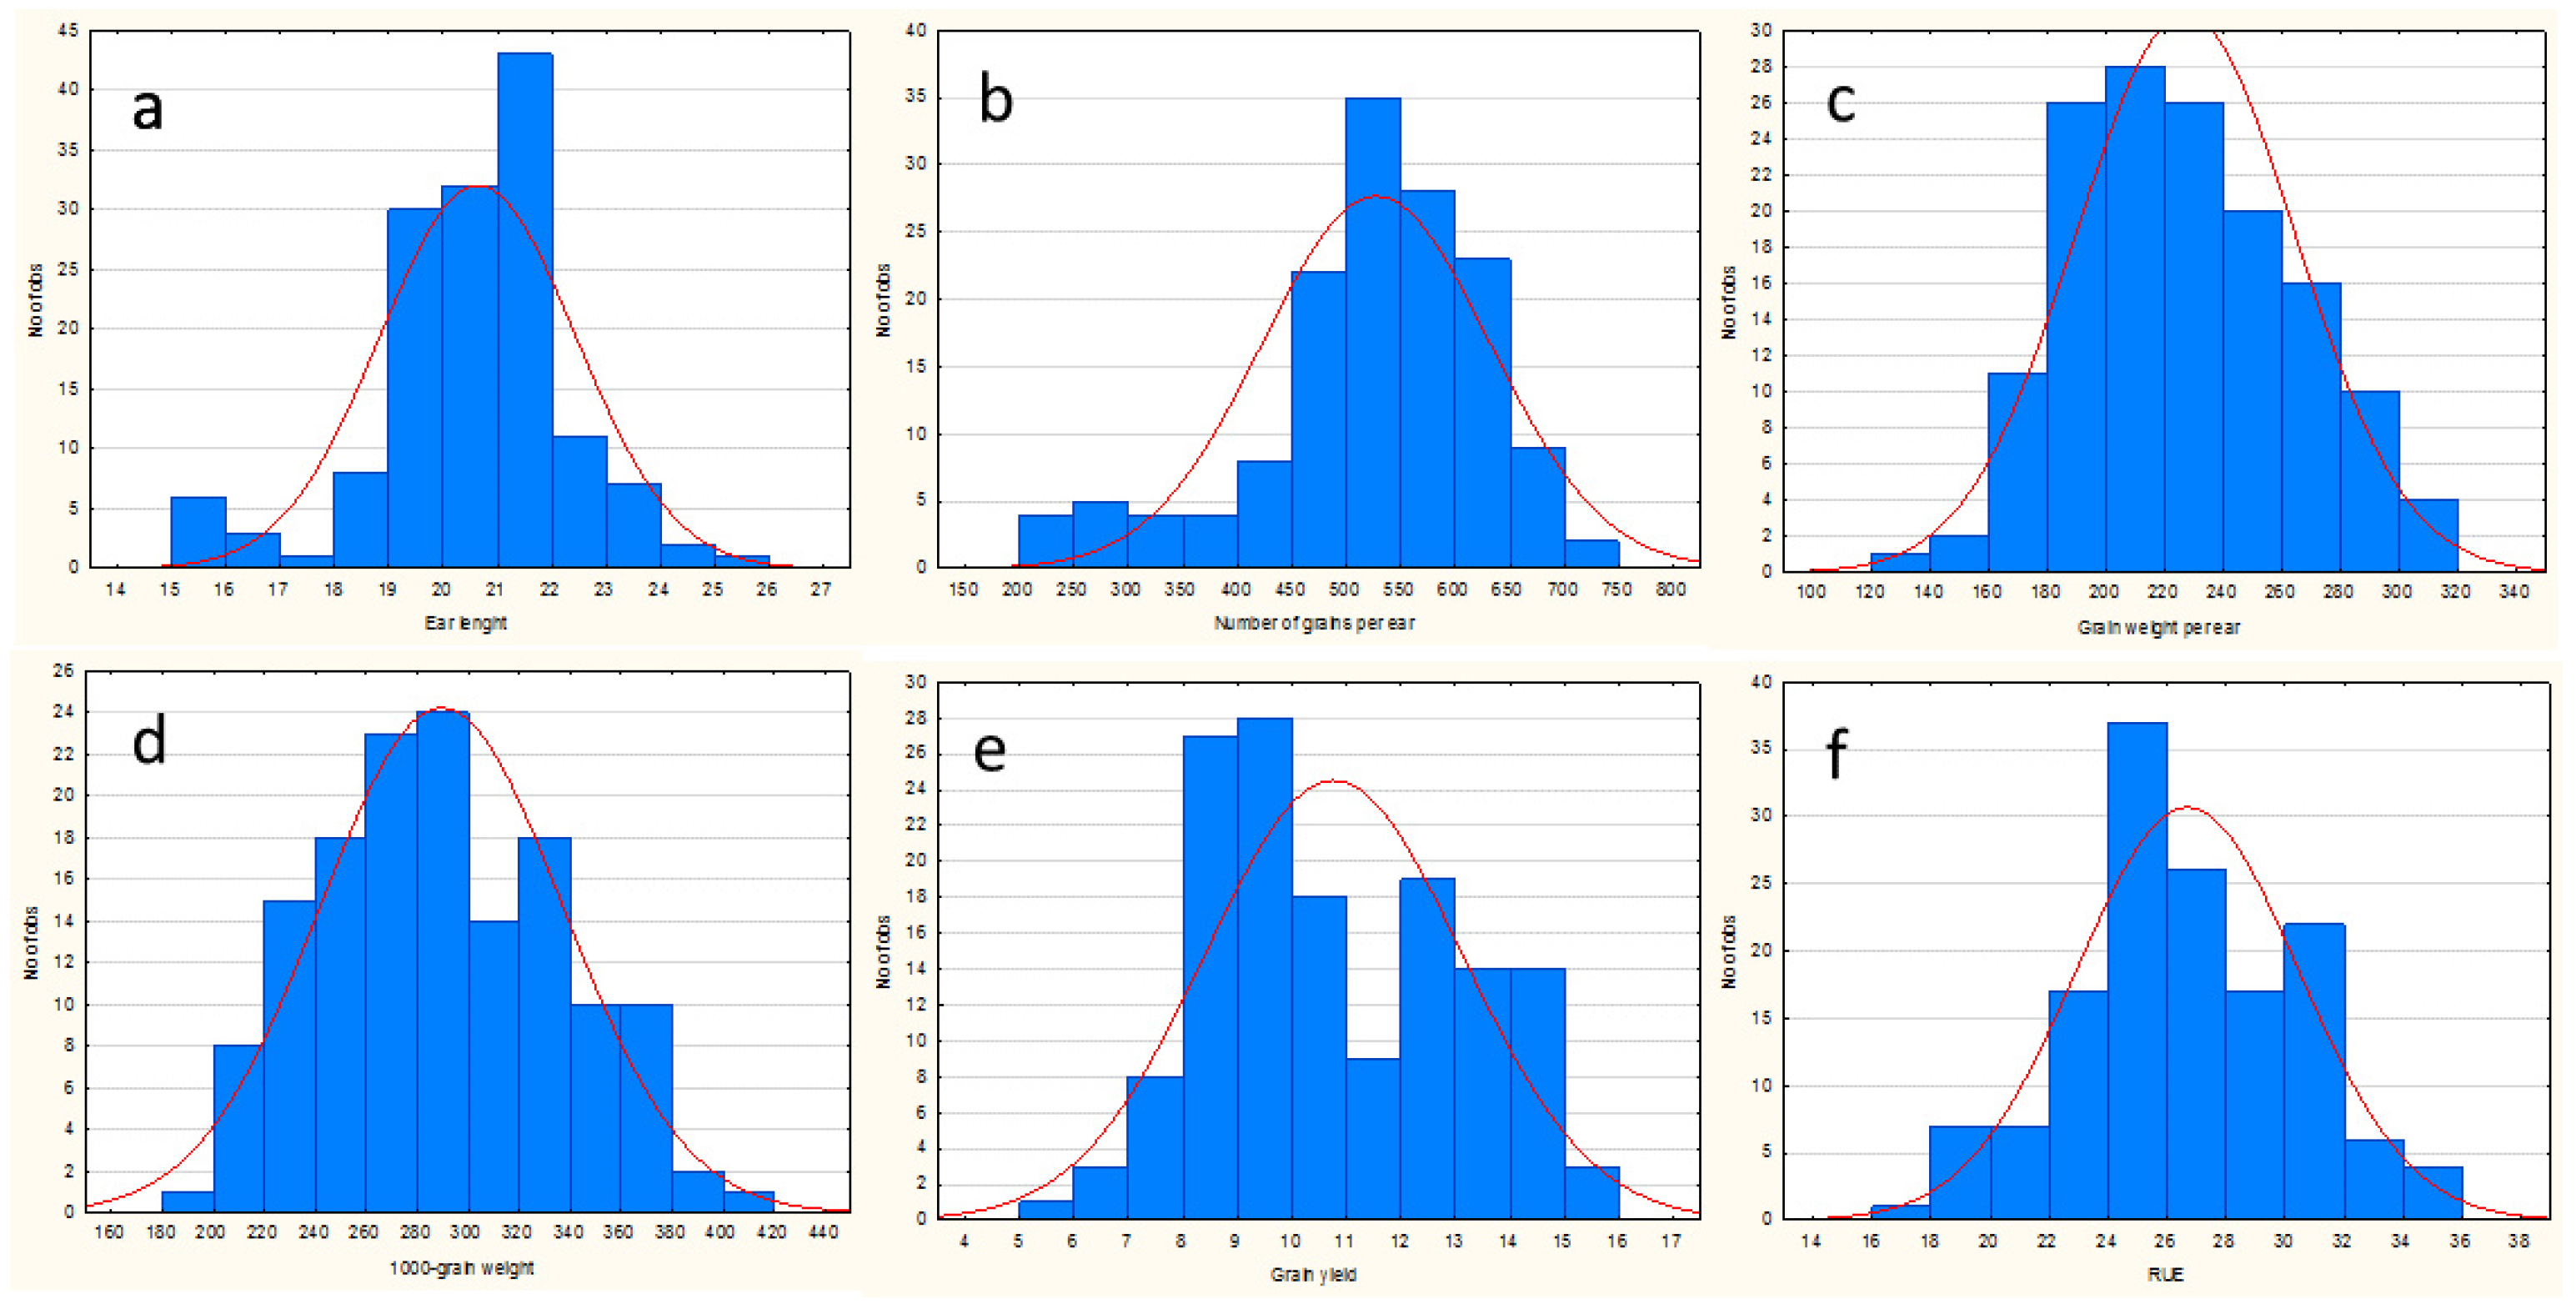
3.1. Descriptive Statistics and Variations in Parameters

Descriptive statistics and variations for yield components, grain yield, and RUE in maize hybrids are shown in Table 1. Frequency distributions of hybrids of investigated parameters are presented in Figure 2. Ear length ranged from 15.1 cm (2017, NS 5010, 69,686 plant ha−1) to 25.2 cm (2016, AS 534, 50,125 plant ha−1) with an average of 20.6 cm, number of grains per ear plant ranged from 230.0 (2017, AS 534, 79,365 plant ha−1) to 712.5 (2016, AS 534, 59,523 plant ha−1) with an average of 525.1, grain weight per ear ranged from 137.6 g (2017, NS 5010, 79,365 plant ha−1) to 314.5 g (2016, AS 534, 50,125 plant ha−1) with an average of 226.4 g, 1000-grain weight ranged from 197.0 g (2017, NS 5010, 69,686 plant ha−1) to 402.9 g (2016, ZP 500, 50,125 plant ha−1) with an average of 288.8 g, grain yield ranged from 5.4 t ha−1 (2017, NS 5010, 50,125 plant ha−1) to 15.9 t ha−1 (2016, ZP 500, 79,365 plant ha−1) with an average of 10.7 t ha−1, and RUE ranged from 16.0 kg ha−1 mm−1 (2017, NS 5010, 50,125 plant ha−1) to 35.2 kg ha−1 mm−1 (2018, NS 5010, 79,365 plant ha−1) with an average of 26.6 kg ha−1 mm−1.

3.2. Yield Components, Grain Yield, and Rain Use Efficiency (RUE)

Among the years, in 2016 and 2018 ear length (21.2 and 21.0 cm) and RUE (27.2 and 27.5 kg ha−1 mm−1) were significantly higher than ear length and RUE in 2017 (19.6 cm and 25.2 kg ha−1 mm−1) (Table 2). The number of grains per ear (593.1), grain weight per ear (251.0 g), 1000-grain weight (328.7 g), and grain yield (12.79 t ha−1) were significantly higher in 2016 compared to 2017 (480.6, 200.1 g, 245.9 g, and 8.42 t ha−1, respectively), and 2018 (501.7, 228.0 g, 291.8 g, and 10.97 t ha−1, respectively).
Maize hybrids expressed large genetic variations for yield component traits when grown at different densities. The hybrid ZP 500 had a higher ear length (20.9 cm), number of grains per ear (538.9), grain weight per ear (233.8 g), 1000-grain weight (306.0 g), grain yield (11.12 t ha−1), and RUE (27.6 kg ha−1 mm−1) compared to NS 5010 (19.7 cm, 508.3, 220.2 g, 260.3 g, 10.36 t ha−1, and 25.8 kg ha−1 mm−1, respectively). No yield components and grain yields differed among the hybrids ZP 500 and AS 534. The hybrids NS 5010 and AS 534 were not statistically different in ear length, number of grains per ear, grain weight per ear, grain yield, and RUE.
With increasing crop density, ear length decreased from 21.8 to 19.7 cm, the number of grains per ear from 585.3 to 405.3, grain weight per ear from 246.6 to 191.5 g, and 1000-grain weight from 306.0 to 265.2 g. On the contrary, grain yield increased from 9 to 11.84 t ha−1, while RUE increased from 22.4 to 29.4 kg ha−1 mm−1.
The results revealed interaction effects of year × hybrid on ear length, grain weight per ear, 1000-grain weight, grain yield, and RUE; interaction effects of year × crop density on ear length, number of grains per ear, grain weight per ear, and grain yield; interaction effects of hybrid × crop density on grain weight per ear; and interaction effects of year × hybrid × crop density on ear length and grain weight per ear.

3.3. Yield Stability Index (CV, %) and Sustainable Yield Index (SYI)

The SYI values in 2016, 2017, and 2018 were 0.66, 0.38, and 0.54, respectively, Table 3. The SYI values for the NS 5010, ZP 500, and AS 534 hybrids were 0.51, 0.55, and 0.53, respectively. Increasing planting density increased the SYI from 0.42 (50,125 plant ha−1) to 0.60 (79,365 plant ha−1).

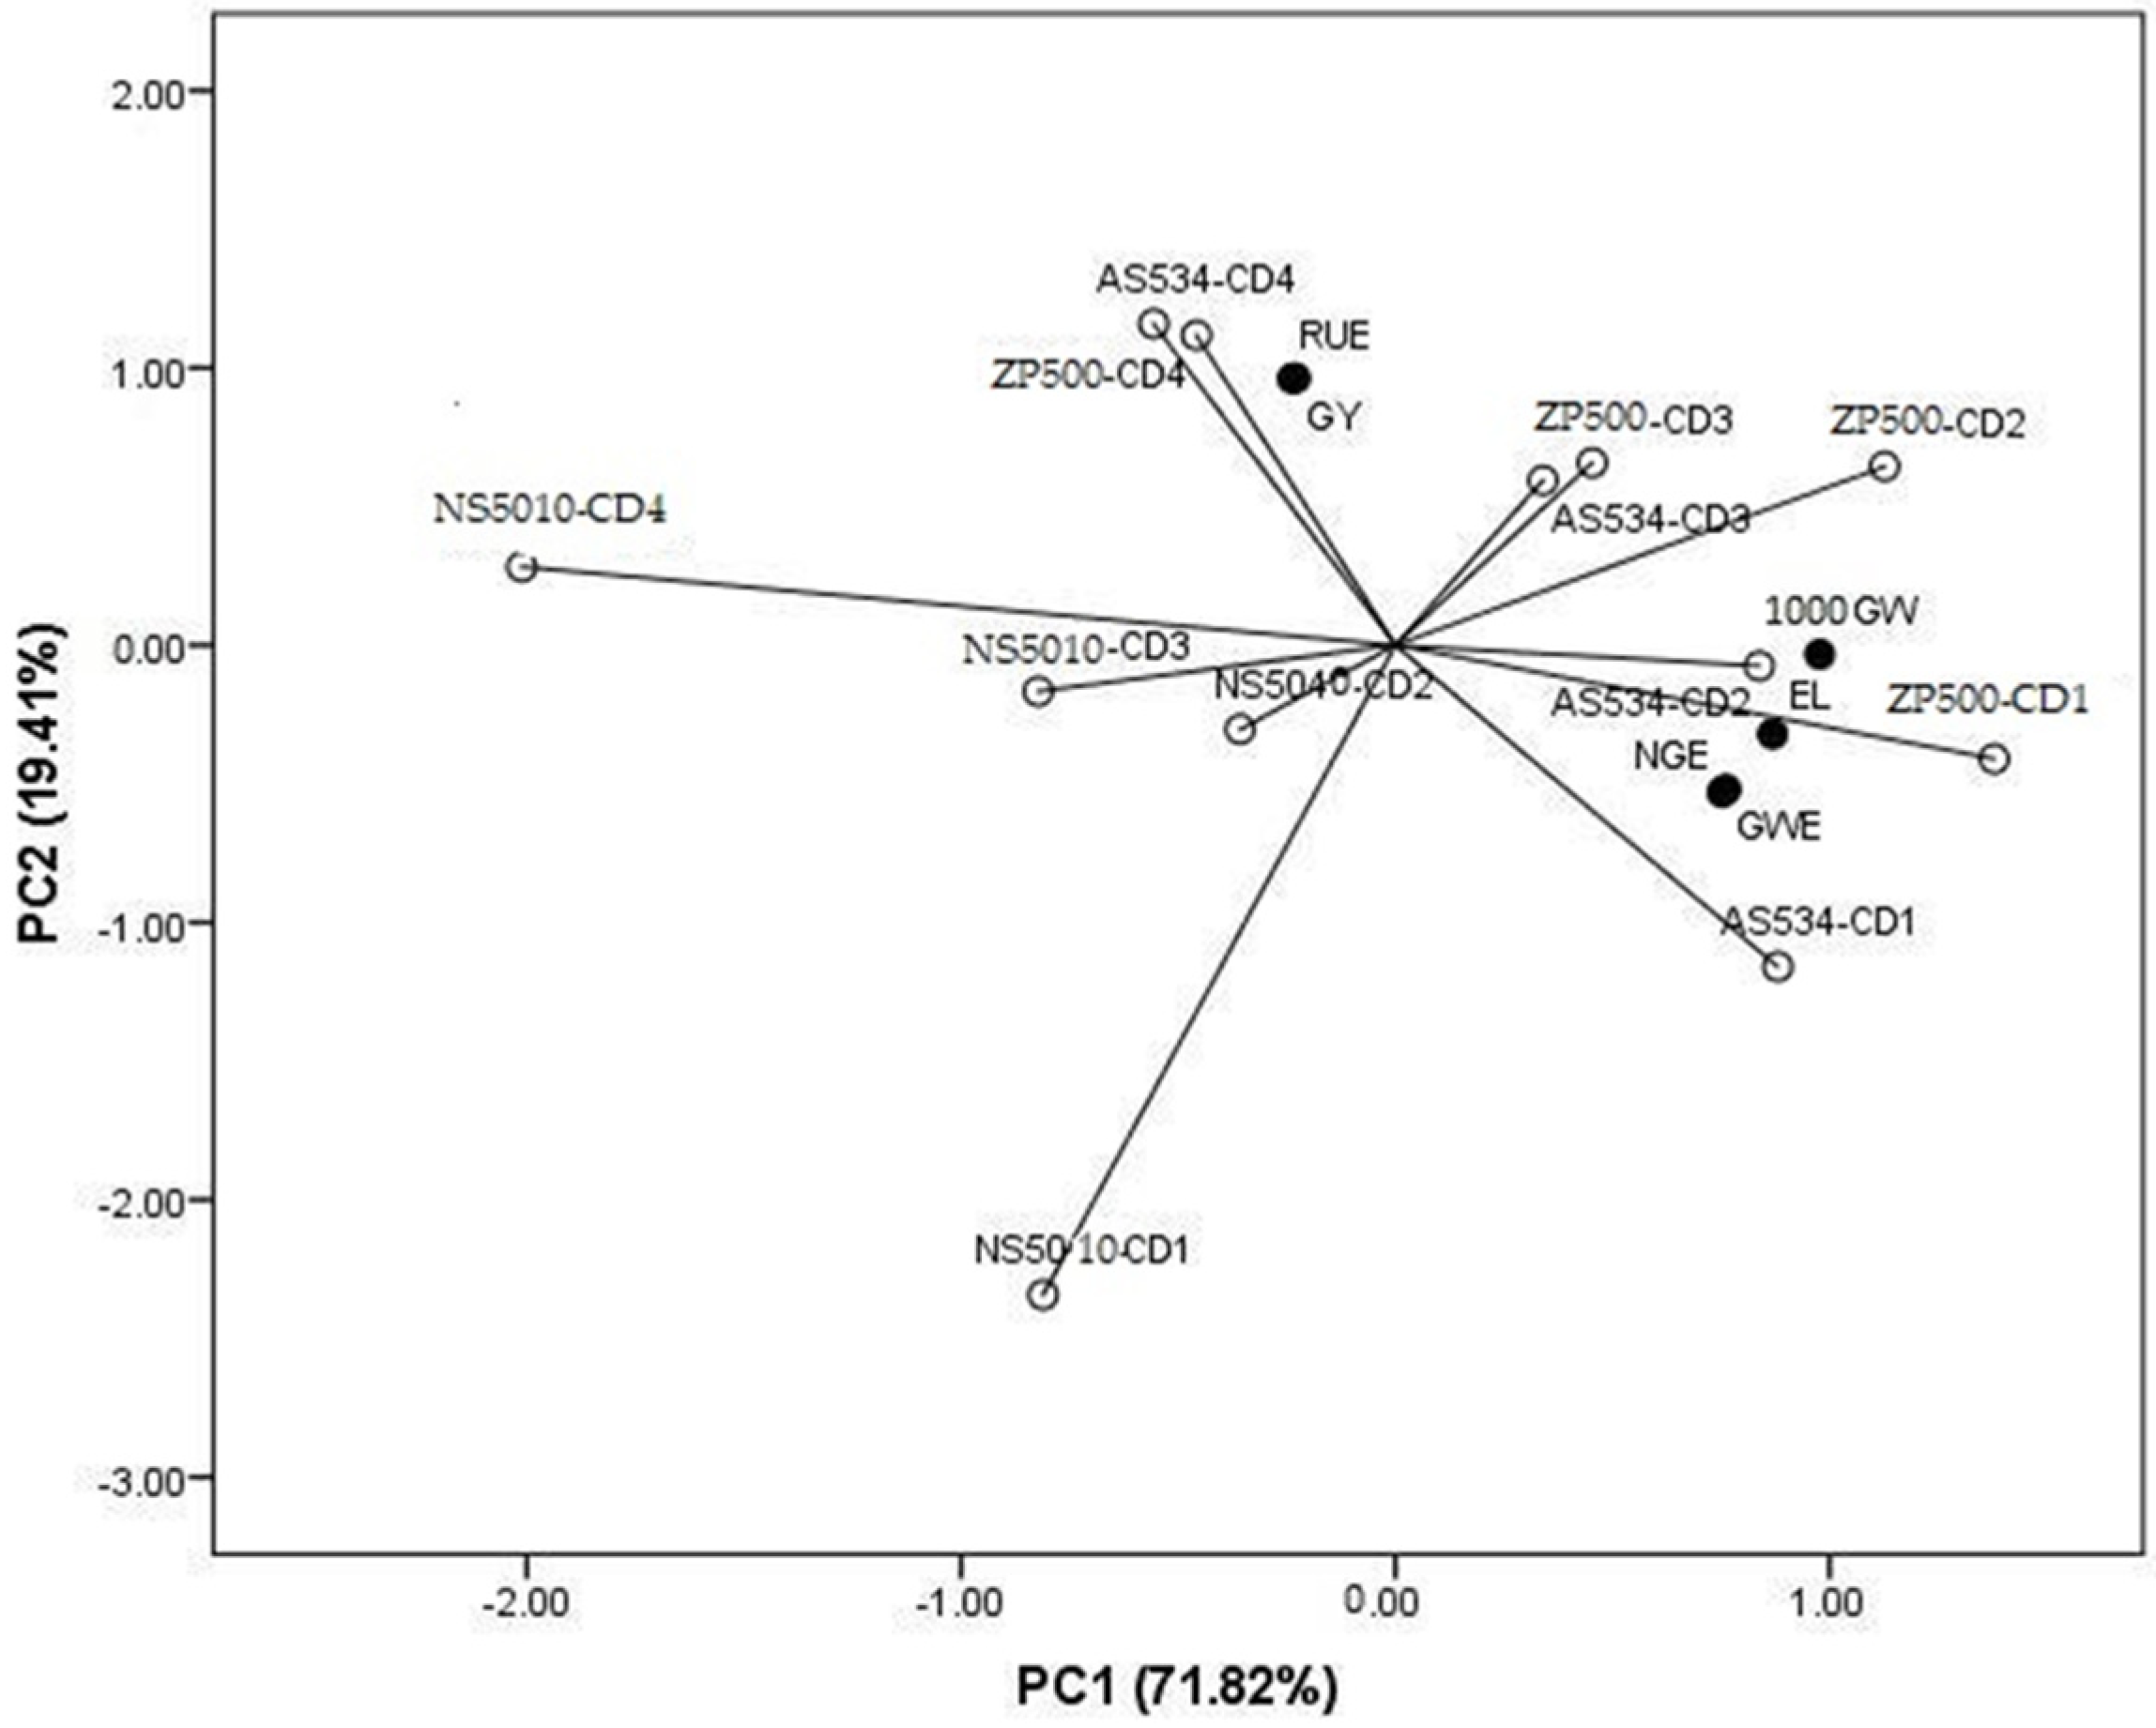
3.4. Principal Component Analysis for Measured and Calculated Parameters and AMMI

Interdependence between tested hybrids, plant densities, and measured parameters was processed by PCA. The first axis contributed with 71.82% in total variability, while the second contributed with 19.41% in total variability (Figure 3). Ear length, number of grains per ear, grain weight per ear and 1000-grain weight correlated significantly and positively with the first axis, whereas grain yield and rain use efficiency correlated significantly and positively with the second axis. It is obvious that the highest variability of grain yield and rain use efficiency were obtained for ZP 500 and AS 534 at CD4 (79,365 plants ha−1), while the highest variability of number of grains per ear and grain weight per ear where obtained for AS 534 at lower densities (50,125 and 59,523 plants ha−1). The highest variability of ear length and 1000-grain weight were also achieved for AS 534 at 59,523 plants ha−1 and ZP 500 at 50,125, and to a lesser extent for ZP 500 at 59,523 plants ha−1.
According to the AMMI analysis, hybrid AS 534 gave the best (most stable) results when grown at a density of 50,125 plants ha−1, both in optimal conditions (2016) and in drought conditions (2017). Hybrid ZP 500 had a stable yield under optimal conditions (2016) when grown at densities of 59,523, 69,686, and 79,365 plants ha−1. Hybrid NS 5010 had stable yields when growing 59,523 plants ha−1 in drier years (2017, 2018). Tables S1–S6 show the results of the ANOVA for the AMMI model for ear length, number of grains per ear, grain weight per ear, 1000-grain weight, grain yield, and rain use efficiency. Figures S1–S6 show the stability of ear length, number of grains per ear, grain weight per ear, 1000-grain weight, grain yield, and rain use efficiency parameters based on the AMMI biplot analysis.

3.5. Correlation between Studied Parameters

Correlations among yield component traits were significantly positive and improved grain yield (Table 4). Grain yield was statistically associated with grain weight per ear (r = 0.28 **), 1000-grain weight (r = 0.48 **), and RUE (r = 0.79 **); ear length with number of grains per ear (r = 0.48 **), grain weight per ear (r = 0.46 **), 1000-grain weight (r = 0.55 **), and RUE (r = 0.79 **); and number of grains per ear with grain weight per ear (r = 0.63 **), 1000-grain weight (r = 0.53 **), and RUE (r = 0.23 **).

4. Discussion

Maize production in the open field is shaped by complex interactions between plants, soil, climate, and applied agro-technical measures. Maximum rainfall use in agriculture is important for agricultural yields [21]. In Serbia, the rainfall is both a primary source of water for crop production and the most valuable water resource.
Meteorological conditions in Serbia are variable and significantly influence crop yield. This study strongly indicates a significant effect of the year on traits of maize and RUE. The highest values of the number of grains per ear, grain weight per ear, 1000-grain weight, and grain yield were recorded in 2016 when there was no drought period according to Walter and Lieth’s diagram. Luo et al. [22] defined drought as a marked lack of rainfall and above-average high temperatures. It usually occurs during July and August in Serbia. Maize is then in the late vegetative and reproductive growth stages essential for determining grain yield. The lower values of the examined parameters in 2017 are undoubtedly the result of a long period of drought that lasted from flowering to the end of the grain-filling period. Unfavorable weather conditions during July in the stages of tasseling, silking, and pollination decreased the number of grains per row and ear length. Poor pollination led to barren ears or unfertilized ovules on the tips of the ears. Maize produced smaller seeds and thus lower 1000-grain weight during drought stress in August at the grain-filling stage. Drought stress during this period shortens the grain-filling period and increases stem lodging and leaf dying [23]. In 2018, drought stress occurred during the grain-filling and ripening stages, which ultimately resulted in a reduced grain yield compared to 2016. In our study, ear length and RUE were significantly higher in 2016 and 2018 compared to 2017. The lower mean RUE values in 2017 (drought conditions across the region) can be explained by a decrease in the specific leaf area and stomatal conductance that limit maximum photosynthesis and growth rate, as stated by Avramova et al. [24].
Maize is sown almost on the entire territory of Serbia. The largest area, about 70% of the total, is located in the lowland part of Serbia up to 300 m altitude (Vojvodina, Mačva, Stig, and river valleys of central and southern Serbia), while 30% reaches up to 700 m altitude. Many small farms still harvest maize in the ear due to outdated mechanization and the fragmentation of arable farms. The hybrids used in this study are medium late with good adaptability to different growing conditions and are suitable for harvesting in ears, grain, and ensiling. Hybrids of the FAO 500 maturity group rapidly release water from the grains and are increasingly included in the sowing structure in Serbia [25]. Modern selection is aimed at creating hybrids with high genetic performance for dry grain yield. Even though a hybrid’s genetic potential is not a limiting factor for increasing the maize yield, the technology of its production does not incorporate the possibility of modern selection. For this reason, the choice of maize hybrids and the application of appropriate agro-technical measures are crucial for the sustainability and productivity of such a system. The ear component traits significantly varied among maize hybrids. The ZP 500 and AS 534 hybrids had significantly greater ear length and 1000-grain weight, and lower RUE than NS 5010. The ZP 500 hybrid had a significantly higher number of grains per ear, grain weight per ear, and grain yield than NS 5010. These phenotypic differences between the hybrids examined under the different crop densities appeared as a result of differences in their genetic constitution, similar to the research of Sah et al. [26]. The ZP 500 and AS 534 hybrids showed better resource use efficiency. Furthermore, Tokatlidis [7] and Solomon et al. [27] concluded that maize genotypes have different productivities, yield stabilities, and resource utilization efficiencies depending on the crop density.
The low grain yield per hectare of maize is also attributed to an inappropriate plant population. Our research showed that plant crop density is a critical agronomic practice because it determines the yield components, grain yield, and RUE. The yield components decreased while grain yield and RUE increased with increased crop density. These findings are in accordance with the conclusions of Zhang et al. [28] and Jia et al. [29]. In the future, it is necessary to direct the modern and sustainable production of maize in the direction of increasing the sowing density. The density of assemblies will continue to expand as one of the possibilities within the contribution of agro-technical solutions to increasing yields. However, increasing crop density has its limitations as well, because exceeding the optimal density can reduce pollination, yield, and yield components such as ear length, number of grains per ear, the weight of grains per ear, and weight of 1000 grains [30,31] and can increase the stress and competition for water, nutrients, and light [32]. It was found that hybrids that are tolerant to a higher density have a better canopy structure and photosynthetic capacity, and a higher yield stability and resource utilization efficiency [9].
Interaction between year and crop density for grain yield indicated that choosing the highest crop density was justified in meteorologically favorable years (2016 and 2018). On the other hand, the 70,000 plants ha−1 crop density was justified in the unfavorable 2017. Considering the cost of hybrid seeds, it is very important to recommend the crop density for each hybrid, especially if they are new hybrids being introduced into production. The hybrids used in this research were registered immediately before setting up the field (AS 534—2016, ZP 500—2016, NS 5010—2014).
In general, when planning the optimal sowing density of maize, many factors (environmental conditions, characteristics of the hybrid, and the level of applied agricultural technologies) should be taken into account to optimize the crop density through complex observation.
Dimension reduction (PCA) silenced environmental impact and thus exposed the response of tested hybrids to sowing at various densities. It is important to underline that the hybrids ZP 500 and AS 534, when sown at the highest density (79,365 plants ha−1), expressed the greatest efficiency toward water usage, with greater RUE and GY, while lower densities (50,125 and 59,523 plants ha−1), again of ZP 500 and AS 534, were more important for number and grain filling. Nevertheless, NS 5010 did not show a positive response to the different sowing densities.
According to the ANOVA and the AMMI analysis, maize hybrids had differences in yield because they had a great variability for the measured and calculated parameters. In addition, the diverse environment had caused most of the changes in grain yield, similar to the research of Yue et al. [33]. To recommend a corn hybrid for sowing in certain outdoor environments, apart from the most similar interaction effect, it is also necessary to achieve the best yields [34]. In our research, it was found that the grain yield of hybrid ZP 500 was highly stable in different environments using these models and could be recommended for cultivation in all plant densities.
SYI is a measure that quantifies the sustainability of an agricultural practice and ranges from 0 to 1 [31]. The higher the value of SYI (>0.55) the better the yield sustainability seems to be [35]. On the contrary, an SYI lower than 0.45 indicates low yield sustainability. Our results indicated that favorable climatic conditions (2016), hybrid ZP 500, and 69,686 and 79,365 plants ha−1 have SYIs higher than 0.55 and thus represent the optimal factors for maintaining the sustainability of maize grain yields. Accordingly, the highest crop density contributed to high and stable yielding. On the other hand, unfavorable climatic conditions, such as in 2017, along with the lowest crop density could indicate unsustainable management practices (SYI < 0.45).
The coefficient of correlations among the yield and yield components is an essential tool to help breeders refine selection procedures in order to improve the functionality of desired traits [36]. The correlations suggest that the rainfall during a vegetation period can limit both maize productivity and some ear traits (ear length and number of grains per ear) under high crop density. Therefore, higher rainfall has a greater positive effect on the productivity of maize. The grain weight per ear, 1000-grain weight, and RUE showed a positive direct effect on grain yield. The results of Chen et al. [37] and Jahangirlou et al. [38] also showed that these traits determined grain yield.

5. Conclusions

Determining the optimal corn crop density should be performed in a complex manner, considering ecological, genetic, and agro-technical factors. Thereby, crop density is one of the decisive factors for the formation of yield components and a prerequisite for a high maize grain yield. This study evaluated the effects of maize hybrids and crop densities on ear characters, grain yield, sustainable yield index, and rainfall use efficiency. Hybrids have different responses to crop density. The hybrid ZP 500 had the highest values per investigated parameters. The increase in crop density improved the grain yield, sustainable yield index, and rainfall use efficiency and decreased the ear characters. The C4 crop density had the best grain yield, sustainable yield index, and rainfall use efficiency, which proves that the number of plants per unit area is an essential determinant of the final grain yield.

Supplementary Materials

The following supporting information can be downloaded at: https://www.mdpi.com/article/10.3390/agriculture14030351/s1, Table S1. Analysis of variance for the AMMI model–ear length. Table S2. Analysis of variance for the AMMI model–number of grains per ear. Table S3. Analysis of variance for the AMMI model–grain weight per ear. Table S4. Analysis of variance for the AMMI model–1000-grain weight. Table S5. Analysis of variance for the AMMI model–grain yield. Table S6. Analysis of variance for the AMMI model–RUE. Figure S1. The stability of ear length based on AMMI-biplot analysis. Figure S2. The stability of number of grains per ear based on AMMI-biplot analysis. Figure S3. The stability of grain weight based on AMMI-biplot analysis. Figure S4. The stability of 1000-grain weight based on AMMI-biplot analysis. Figure S5. The stability of grain yield based on AMMI-biplot analysis. Figure S6. The stability of RUE based on AMMI-biplot analysis.

Author Contributions

Conceptualization, V.M. and S.Đ., methodology, V.M.; investigation, V.M., M.B., V.Ž., M.L., T.K. and V.K.; writing—original draft preparation, V.M. and S.Đ.; writing—review and editing, S.Đ.; supervision, M.B. All authors have read and agreed to the published version of the manuscript.

Funding

This research was funded by the Ministry of Science, Technological Development and Innovation of the Republic of Serbia, based on the Agreement on the realization and financing of scientific research work of SRO No. 451-03-66/2024-03/200022 and Agrounik d.o.o. of the Republic of Serbia.

Acknowledgments

The authors are grateful to Vesna Dragičević and Zdenka Girek for assisting with the statistical analysis.

Conflicts of Interest

Author S.Đ. was employed by company Agrounik d.o.o. The remaining authors declare that the research was conducted in the absence of any commercial or financial relationships that could be construed as a potential conflict of interest.

References

  1. FAO. FAO Statistical Yearbook; Food and Agriculture Organization (FAO) of the United Nations: Rome, Italy, 2021; Available online: https://www.fao.org/faostat/en/#data/QCL (accessed on 29 December 2023).
  2. Statistical Yearbook of the Republic of Serbia, 2023; Statistical Office of the Republic of Serbia: Belgrade, Serbia, 2023.
  3. Haegele, J.W.; Becker, R.J.; Henninger, A.S.; Below, F.E. Row Arrangement, Phosphorus Fertility, and Hybrid Contributions to Managing Increased Plant Density of Maize. Agron. J. 2014, 106, 1838–1846. [Google Scholar] [CrossRef]
  4. Assefa, Y.; Vara Prasad, P.V.; Carter, P.; Hinds, M.; Bhalla, G.; Schon, R.; Jeschke, M.; Paszkiewicz, S.; Ciampitti, I.A. Yield Response to Planting Density for US Modern Corn Hybrids: A Synthesis-Analysis. Crop Sci. 2016, 56, 2802–2817. [Google Scholar] [CrossRef]
  5. Mandić, V.; Bijelić, Z.; Krnjaja, V.; Tomić, Z.; Stanojković-Sebić, A.; Stanojković, A.; Caro-Petrović, V. The Effect of Crop Density on Maize Grain Yield. Biotechnol. Anim. Husb. 2016, 32, 83–90. [Google Scholar] [CrossRef]
  6. Fahad, S.; Hasanuzzaman, M.; Mukhtar, A.; Ullah, H.; Saeed, M.; Khan, A.I.; Adnan, M. Environment, Climate, Plant and Vegetation Growth; Springer: New York, NY, USA, 2020. [Google Scholar] [CrossRef]
  7. Tokatlidis, I.S. Adapting Maize Crop to Climate Change. Agron. Sustain. Dev. 2013, 33, 63–79. [Google Scholar] [CrossRef]
  8. Djaman, K.; Allen, S.; Djaman, D.S.; Koudahe, K.; Irmak, S.; Puppala, N.; Darapuneni, M.K.; Angadi, S.V. Planting Date and Plant Density Effects on Maize Growth, Yield and Water Use Efficiency. Environ. Chall. 2022, 6, 100417. [Google Scholar] [CrossRef]
  9. Zhang, Y.; Xu, Z.; Li, J.; Wang, R. Optimum Planting Density Improves Resource Use Efficiency and Yield Stability of Rainfed Maize in Semiarid Climate. Front. Plant Sci. 2021, 12, 752606. [Google Scholar] [CrossRef] [PubMed]
  10. Du, X.; Wang, Z.; Lei, W.; Kong, L. Increased Planting Density Combined with Reduced Nitrogen Rate to Achieve High Yield in Maize. Sci. Rep. 2021, 11, 358. [Google Scholar] [CrossRef] [PubMed]
  11. Tang, L.; Ma, W.; Noor, M.A.; Li, L.; Hou, H.; Zhang, X.; Zhao, M. Density Resistance Evaluation of Maize Varieties Through New “Density–Yield Model” and Quantification of Varietal Response to Gradual Planting Density Pressure. Sci. Rep. 2018, 8, 17281. [Google Scholar] [CrossRef]
  12. Mylonas, I.; Sinapidou, E.; Remountakis, E.; Sistanis, I.; Pankou, C.; Ninou, E.; Papadopoulos, I.; Papathanasiou, F.; Lithourgidis, A.; Gekas, F.; et al. Improved Plant Yield Efficiency Alleviates the Erratic Optimum Density in Maize. Agron. J. 2020, 112, 1690–1701. [Google Scholar] [CrossRef]
  13. Jiang, X.; Tong, L.; Kang, S.; Li, F.; Li, D.; Qin, Y.; Shi, R.; Li, J. Planting Density Affected Biomass and Grain Yield of Maize for Seed Production in an Arid Region of Northwest China. J. Arid Land 2018, 10, 292–303. [Google Scholar] [CrossRef]
  14. Mandić, V.; Đorđević, S.; Bijelić, Z.; Krnjaja, V.; Ružić Muslić, D.; Petričević, M.; Simić, A. Effect of Intra-Row Spacing and Seed Inoculation on Stem Lodging, Yield and Rain-Use Efficiency of Maize under Different Climatic Conditions. Philipp. Agric. Sci. 2018, 101, 243–250. [Google Scholar]
  15. Ma, D.; Li, S.; Zhai, L.; Yu, X.; Xie, R.; Gao, J. Response of Maize Barrenness to Density and Nitrogen Increases in Chinese Cultivars Released from the 1950s to 2010s. Field Crops Res. 2020, 250, 107766. [Google Scholar] [CrossRef]
  16. Lacasa, J.; Gaspar, A.; Hinds, M.; Don, S.J.; Berning, D.; Ciampitti, I.A. Bayesian Approach for Maize Yield Response to Plant Density from both Agronomic and Economic Viewpoints in North America. Sci. Rep. 2020, 10, 15948. [Google Scholar] [CrossRef]
  17. IUSS Working Group WRB. World Reference Base for Soil Resources International Soil Classification System for Naming Soil and Creating Legends for Soil Maps. In World Soil Resources Reports, 106; FAO: Rome, Italy, 2015. [Google Scholar]
  18. Walter, H.; Lieth, H. Klimadiagram-Weltatlas; VEB Gustav Fischer Verlag: Jena, Germany, 1967. [Google Scholar]
  19. Li, C.X.; Ma, S.C.; Shao, Y.; Ma, S.T.; Lingling, Z. Effects of Long-Term Organic Fertilization on Soil Microbiologic Characteristics, Yield and Sustainable Production of Winter Wheat. Agric. Sci. China 2018, 17, 210–219. [Google Scholar] [CrossRef]
  20. R Development Core Team. R: A Language and Environment for Statistical Computing; R Foundation for Statistical Computing; R Development Core Team: Vienna, Austria, 2023; Available online: https://www.r-project.org (accessed on 29 December 2023).
  21. Bennie, A.T.P.; Hensley, M. Maximizing Precipitation Utilization in Dryland Agriculture in South Africa—A Review. J. Hydrol. 2001, 241, 124–139. [Google Scholar] [CrossRef]
  22. Luo, Y.Q.; Jiang, L.F.; Niu, S.L.; Zhou, X.H. Nonlinear Responses of Land Ecosystems to Variation in Precipitation. New Phytol. 2017, 214, 5–7. [Google Scholar] [CrossRef]
  23. Anami, S.; De Block, M.; Machuka, J.; Van Lijsebettens, M. Molecular Improvement of Tropical Maize for Drought Stress Tolerance in sub-Saharan Africa. Crit. Rev. Plant Sci. 2009, 28, 16–35. [Google Scholar] [CrossRef]
  24. Avramova, V.; AbdElgawad, H.; Zhang, Z.; Fotschki, B.; Casadevall, R.; Vergauwen, L.; Knapen, D.; Taleisnik, E.; Guisez, Y.; Asard, H.; et al. Drought Induces Distinct Growth Response, Protection, and Recovery Mechanisms in the Maize Leaf Growth Zone. Plant Physiol. 2015, 169, 1382–1396. [Google Scholar] [CrossRef]
  25. Videnović, Ž.; Dumanović, Z.; Simić, M.; Srdić, J.; Babić, M.; Dragičević, V. Genetic potential and maize production in Serbia. Genetika 2013, 45, 667–678. [Google Scholar] [CrossRef]
  26. Sah, R.P.; Chakraborty, M.; Prasad, K.; Pandit, M.; Tudu, V.K.; Chakravarty, M.K.; Narayan, S.C.; Rana, M.; Moharana, D. Impact of Water Deficit Stress in Maize: Phenology and Yield Components. Sci. Rep. 2020, 10, 2944. [Google Scholar] [CrossRef]
  27. Solomon, K.F.; Chauhan, Y.; Zeppa, A. Risks of Yield Loss Due to Variation in Optimum Density for Different Maize Genotypes under Variable Environmental Conditions. J. Agron. Crop Sci. 2017, 203, 519–527. [Google Scholar] [CrossRef]
  28. Zhang, M.; Song, Z.W.; Chen, T.; Yan, X.G.; Zhu, P.; Ren, J. Differences in Responses of Biomass Production and Grain-Filling to Planting Density Between Spring Maize Cultivars. J. Maize Sci. 2015, 23, 57–65. [Google Scholar]
  29. Jia, Q.; Sun, L.; Mou, H.; Shahzad, A.; Liu, D.; Zhang, Y.; Zhang, P.; Ren, X.; Jia, Z. Effects of Planting Patterns and Sowing Densities on Grain-Filling, Radiation Use Efficiency and Yield of Maize (Zea mays L.) in Semi-Arid Regions. Agric. Water Manag. 2018, 201, 287–298. [Google Scholar] [CrossRef]
  30. Cerrudo, D.; Hernández, M.; Tollenaar, M.; Vega, C.R.C.; Echarte, L. Kernel Number Response to Plant Density in Tropical, Temperate, and Tropical × Temperate Maize Hybrids. Crop Sci. 2020, 60, 381–390. [Google Scholar] [CrossRef]
  31. Berzsenyi, Z.; Tokatlidis, I.S. Density-Dependence Rather Maturity Determines Hybrid Selection in Dryland Maize Production. Agron. J. 2012, 104, 331–336. [Google Scholar] [CrossRef]
  32. Singh, R.P.; Das, S.K.; Bhaskara, R.U.M.; Narayana, R.M. Towards Sustainable Dryland Agricultural Practices; Research Bulletin; Central Research Institute for Dryland Agriculture: Hyderabad, India, 1990; p. 106. [Google Scholar]
  33. Yue, H.; Gauch, H.G.; Wei, J.; Xie, J.; Chen, S.; Peng, H.; Bu, J.; Jiang, X. Genotype by Environment Interaction Analysis for Grain Yield and Yield Components of Summer Maize Hybrids across the Huanghuaihai Region in China. Agriculture 2022, 12, 602. [Google Scholar] [CrossRef]
  34. Babić, V.; Babić, M.; Ivanović, M.; Kraljević-Balalić, M.; Dimitrijević, M. Understanding and Uutilization of Genotype-by-Environment Interaction in Maize Breeding. Genetika 2010, 42, 79–90. [Google Scholar] [CrossRef]
  35. Li, Z.F.; Xu, M.G.; Zhang, H.M.; Zhang, S.X.; Zhang, W.J. Sustainability of Crop Yields in China under Long-Term Fertilization and Different Ecological Conditions. Ying Yong Sheng Tai Xue Bao 2010, 21, 1264–1269. (In Chinese) [Google Scholar]
  36. Silva, T.N.; Moro, G.V.; Moro, F.V.; Santos, D.M.M.D.; Buzinaro, R. Correlation and path analysis of agronomic and morphological traits in maize. Rev. Cienc. Agron. 2016, 47, 351–357. [Google Scholar] [CrossRef]
  37. Chen, K.; Camberato, J.; Tony, J. Maize Grain Yield and Kernel Component Relationships to Morphophysiological Traits in Commercial Hybrids Separated by Four Decades. Crop Sci. 2017, 57, 1641–1657. [Google Scholar] [CrossRef]
  38. Jahangirlou, R.M.; Akbari, G.A.; Alahdadi, I.; Soufizadeh, S.; Kumar, U.; Parsons, D. Phenotypic Traits, Grain Yield and Yield Components of Maize Cultivars under Combinations of Management Practices in Semi-arid Conditions of Iran. Int. J. Plant Prod. 2021, 15, 459–471. [Google Scholar] [CrossRef]
Figure 1. Climate diagram according to Walter and Lieth [18] for the period 2016–2018.
Agriculture 14 00351 g001
Figure 2. Frequency distribution curve for ear length (a), number of grains per ear (b), grain weight per ear (c), 1000-grain weight (d), grain yield (e), and rain use efficiency (RUE) (f).
Agriculture 14 00351 g002
Figure 3. A principal component analysis of the maize ear length (EL), number of grains per ear (NGE), grain weight per ear (GWE), 1000-grain weight (1000-GW), grain yield (GY), and rain use efficiency (RUE) influenced by hybrids (ZP 500, NS 5010, and AS 534) and crop densities (CD1—50,125 plants ha−1, CD2—59,523 plants ha−1, CD3—69,686 plants ha−1, and CD4—79,365 plants ha−1).
Agriculture 14 00351 g003
Table 1. Descriptive statistics of yield components, grain yield, and RUE of maize hybrids in different plant densities.
ParametersMeanMinimumMaximumSDCV, %
Ear length (cm)20.615.125.21.88.7
Number of grains per ear525.1230.3712.5103.819.8
Grain weight per ear (g)226.4137.6314.537.216.4
1000-grain weight (g)288.8197.0402.947.416.4
Grain yield (t ha−1) 10.75.415.92.321.5
Rain use efficiency
(RUE; kg ha−1 mm−1)
26.616.035.23.713.9
SD—standard deviation; CV—coefficient of variation.
Table 2. Maize yield components traits, grain yield, and RUE as a function of crop density.
FactorELNGEGWE1000-GWGYRUE
Year (Y)
201621.2 a593.1 a251.0 a328.7 a12.79 a27.2 a
201719.6 b480.6 b200.1 c245.9 c8.42 c25.2 b
201821.0 a501.7 b228.0 b291.8 b10.97 b27.5 a
Anova (p values)0.000 **0.000 **0.000 **0.000 **0.000 **0.000 **
Hybrid (H)
NS 501019.7 b508.3 b220.2 b260.3 b10.36 b25.8 b
ZP 50020.9 a538.9 a233.8 a306.0 a11.12 a27.6 a
AS 53421.2 a528.2 ab225.1 ab300.2 a10.70 ab26.5 b
Anova (p values)0.000 **0.000 **0.002 **0.000 **0.000 **0.001 **
Crop density (CD)
50125 plant ha−121.8 a585.3 a246.6 a306.0 a9.00 c22.4 c
59523 plant ha−121.0 b569.5 a239.4 ab298.4 a10.79 b26.8 b
69686 plant ha−120.0 c540.6 b228.0 b285.7 b11.28 ab27.9 b
79365 plant ha−119.7 c405.3 c191.5 c265.2 c11.84 a29.4 a
Anova (p values)0.000 **0.000 **0.000 **0.000 **0.000 **0.000 **
Y × H0.000 **0.511 ns0.000 **0.001 **0.008 **0.013 *
Y × CD0.000 **0.000 **0.006 **0.084 ns0.004 **0.171 ns
H × CD0.868 ns0.602 ns0.024 *0.408 ns0.199 ns0.157 ns
Y × H × F0.000 **0.002 **0.218 ns0.637 ns0.612 ns0.602 ns
EL—ear length (cm); NGE—number of grains per ear; GWE—grain weight per ear (g); 1000-GW—1000-grain weight (g); GY—grain yield (t ha−1); RUE—rain use efficiency (kg ha−1 mm−1); average values followed by the different letters in rows (a, b, c) are significantly different based on the LSD level of 0.05; *, ** = significant LSD test at 0.05 and 0.01 level of probability, respectively, ns = not significant.
Table 3. Yield stability index (CV, %) and sustainable yield index (SYI) of dryland maize in different plant densities.
FactorGrain
Yield
(t ha−1)
Standard
Deviation
Maximum
Yield
(t ha−1)
Crop Yield
Stability
(CV; %)
Sustainable
Yield Index
(SYI)
201612.792.315.9414.70.66
20178.4211.80.38
201810.9714.00.54
NS 501010.3622.30.51
ZP 50011.1219.70.55
AS 53410.723.40.53
50,125 plant ha−19.0017.60.42
59,523 plant ha−110.7920.10.53
69,686 plant ha−111.2820.30.56
79,365 plant ha−111.8419.50.60
Table 4. Pearson correlation coefficients (r) for the relation of yield component traits, grain yield, and rain use efficiency.
ParametersELNGEGWE1000-GWGY
NGE0.48 **
GWE0.46 **0.63 **
1000-GW 0.55 **0.53 **0.72 **
GY0.14 ns0.14 ns0.28 **0.48 **
RUE−0.13 ns0.23 **−0.10 ns0.06 ns0.79 **
EL—ear length; NGE—number of grains per ear; GWE—grain weight per ear; 1000-GW—1000-grain weight; GY—grain yield; RUE—rain use efficiency; **—significant at 1% level of probability and ns—not significant.
Disclaimer/Publisher’s Note: The statements, opinions and data contained in all publications are solely those of the individual author(s) and contributor(s) and not of MDPI and/or the editor(s). MDPI and/or the editor(s) disclaim responsibility for any injury to people or property resulting from any ideas, methods, instructions or products referred to in the content.

