Article

Digital Image Analysis of Low-Temperature Responses in Sweet Corn Hybrid Seedlings

1
Department of Agronomy, Iowa State University, Ames, IA 50011-1051, USA
2
Gangwon-do Agricultural Research and Extension Services, Maize Research Institute, Hongcheon 25160, Republic of Korea
3
Department of Plant Agriculture, University of Guelph, Guelph, ON N1G 2W1, Canada
4
Department of Industrial Plant Science and Technology, Chungbuk National University, Cheongju 28644, Republic of Korea
5
Department of Crop Science, Chungbuk National University, Cheongju 28644, Republic of Korea
*
Authors to whom correspondence should be addressed.
Agriculture 2024, 14(3), 360; https://doi.org/10.3390/agriculture14030360
Submission received: 10 January 2024 / Revised: 18 February 2024 / Accepted: 20 February 2024 / Published: 23 February 2024
(This article belongs to the Section Crop Genetics, Genomics and Breeding)

Abstract

:
Breeding for stress-tolerant hybrids begins with screening germplasm for tolerant genotypes. We employed a non-destructive and objective method to evaluate the low-temperature response of sweet corns at the seedling stage, using a digital image analysis. It was estimated using summed leaf area, a new parameter defined as the sum of the leaf area measured from images taken at different angles. The summed leaf area, SPAD, shoot and root fresh weight, and total root length were significantly different among hybrids. The group mean of sugary endosperm type was significantly higher than that of shrunken type for all traits but SPAD. For the summed leaf area, the top three ranked hybrids were from the sugary type, but the area for the following three hybrids from the shrunken type did not differ from that for the first three hybrids. The summed leaf area was correlated with SPAD (r = 0.49 **), shoot (r = 0.99 **) and root (r = 0.93 **) fresh weight, and total root length (r = 0.76 **). Phytoglycogen in seeds only had a significant correlation (r = 0.46 **) with the area. The summed leaf area of only one hybrid differed between normal- and low-temperature conditions. The low-temperature response based on the summed leaf area was reflected in the field condition, with a few exceptions. The results suggest that the summed leaf area via digital image analysis can be used to evaluate low-temperature response in sweet corns.

1. Introduction

Sweet corn (Zea mays L.), which is consumed as a fresh ear, is a specialty crop that accumulates sugars due to a mutation in the starch synthesis process [1]. It has become popular as a high-income crop owing to the Westernization of eating habits. The cultivation area is mainly located in the warmer southern region [2,3]. Early planting of sweet corn in this area ensures relatively high price competitiveness due to early shipments to the fresh market [2]. On the other hand, early planting may result in cold stress during the germination and seedling stages [4].
Corn is sensitive to low temperatures [5]. In particular, sweet corn germination and early vigor are affected by low temperature and high soil humidity, thereby influencing the final production [6]. The low starch content in sweet corn endosperm affects the germination rate and early vigor, which both lead to decreased yields [6]. This is due to (i) insufficient germination energy due to low starch content in seeds, (ii) cell membrane damage due to high osmotic potential caused by high sugar concentration in seeds, (iii) excessive water flow into thin and damaged pericarps, and (iv) germination and growth delay caused by fungi and pathogens [7,8]. Low temperature causes leaf pigmentation, oxidative stress, decreased photosynthetic capacity, cell-membrane structural changes, and changes to the composition of the thylakoid membrane [9,10,11], as well as morphological changes, such as necrosis and chlorosis [12]. Wijewardana et al. (2016) observed that the changes to and destruction of the cell membrane structure under low temperatures cause a decrease in electrolytes, leading to cell death [11]. As a result, the number of cells reduces, and cell number is closely related to cold tolerance. The development of aerial and subterranean parts of plants in early growth is influenced by soil temperature. Reductions in subterranean growth leads to less nutrient absorption, which affects the development of the plant’s aerial organs [13]. Imran et al. (2013) showed that the solubility and availability of nutrients and root activity are limited at low soil temperatures, and that low temperatures induce increased water viscosity and a decreased rate of water and nutrient absorption in the roots [14]. The aforementioned study also reported that root respiration is dependent upon changes in enzyme and substrate activity that vary with temperature [15].
There are two major mechanisms of cold tolerance in crops [16]. First, plants may regulate cell metabolism depending on temperature changes [16,17], before trying to improve resistance mechanisms in connection with various metabolic processes [18,19]. Many physiological traits that are related to metabolic processes, such as photosynthetic ability, cell membrane stiffness, and enzyme activity, are also affected by cold temperatures [20]. Low germination rate, delayed germination, and chlorosis are induced by cold stress. Cold tolerance is considered an important trait in the development and introduction of new crop cultivars [4,11]. Diverse morphological traits are used to measure cold tolerance in crops, and physiological traits are also emphasized [11]. Therefore, screening the cold responses of crops during the introduction of new germplasms is important for breeders and producers [11].
A phenotypic analysis using an image analysis is a good alternative method to existing destructive, subjective, and complex methods. One of the advantages of image analysis is that the analysis process is non-destructive, objective, and low-cost [4]. Moreover, experimental errors caused by environmental variation can be minimized. Various programs based on image analysis have been developed for the phenotypic analysis of crops [21,22]. Due to this convenience, image analysis technology has become an essential technology for researchers, and studies using image analysis are common [23].
The objectives of this study were to (i) introduce the summed leaf area as a new parameter to measure and evaluate the low-temperature response of sweet corn at the seedling stage, using a digital image analysis; (ii) compare the new trait with other agronomic traits; and (iii) select for cold-tolerant germplasms to initiate a new sweet corn breeding program. During the study, we also tried to investigate the relationship between low-temperature response and the saccharide contents of different sweet corn hybrids and validate the performance of selected tolerant and susceptible cultivars in the field condition.

2. Materials and Methods

2.1. Plant Materials and Growing Conditions

A total of 35 commercial sweet corn hybrids were collected from the USA, the Republic of Korea, and Japan (Supplementary Materials Table S1). The seeds were visually examined to classify the hybrids for endosperm types. The number of cultivars with sh2 and su endosperm type was twenty-nine and six, respectively. Four su endosperm-type hybrids were claimed to be cold tolerant based on a company reference chart. Average 100-kernel weight across all cultivars was 15.05 g, with a standard deviation of 3.58 g. The heaviest 100-kernel weight among the collected cultivars was 25.5 g, and the lightest was 8.82 g. Days to silking was measured in a field performance trial, Choengju, Republic of Korea, which ranged from 54 to 65 days, with a mean of 59 days. The fastest silking varieties were su_01, su_04, and su_06, at 54 days; and the slowest one was sh_23, at 65 days.
Seeds were planted in mini pots (6 × 6 × 6.5 cm), with a planting depth of 2 cm and tip caps toward the bottom of the pot. Two seeds were planted per pot. Pots were then placed in a growth chamber. To synchronize the growth, pots with same-day emergence were selected for each cultivar and were thinned to one. One mini-pot of each cultivar was randomly placed in a mini-pot tray (5 × 7), and there were total of six trays. The tray was considered as a block for randomized complete block design with six replications. The growth chamber condition for low-temperature treatment was as follows: the temperature was set at 17 °C during the 14 h of daytime, while it was set at 13 °C during the 10 h of nighttime, with 40% humidity. For comparison, it was repeated for the normal growth-temperature condition as 29/21 °C (day/night). The trays were turned 180° every day to prevent phototropism.

2.2. Trait Measurements

The following morphological traits were measured: chlorophyll content (SPAD), shoot fresh weight (g plant−1), root fresh weight (g plant−1), total root length (cm), and summed leaf area (cm2). SPAD values were measured with a SPAD meter (SPAD–502 Plus, Konica Minolta, Tokyo, Japan), and three SPAD readings on the first leaf were averaged. Roots from each seedling were cut from the aerial part, and all soil and dirt were completely washed off. Primary and lateral roots were flattened with a transparent glass, and a digital picture was taken with a scale bar. Images were transferred to ImageJ software on a personal computer, and the total root length was measured by tracing the roots on the image [24].
A new parameter to screen the low-temperature response of corn seedlings had to be undisruptive so that we could make use of the selected seedlings for further breeding activities and for unmanned automation in the future. An aerial image was not suitable since, as the plant grows, the top leaf covers up the lower leaves. Since corn seedlings are asymmetrically shaped from the side view, pictures taken from different side-view angles were needed to reduce errors in measuring the area. We built an image-acquisition station with illumination (Figure 1A,B) and a turntable for an easy setup of the seedling pot angled toward camera lens (Figure 1C). A Nikon D5000 DSLR camera with Nikkor 17–15 mm 1:2.8 GED lens was connected to a personal computer with a free software DigiCamControl (https://digicamcontrol.com, accessed on 9 January 2024) (Figure 1D,E). The camera setup was as follows: aperture f11, ISO400, shutter speed of 1/100 s, focal length of 55 mm (82 mm in 35 mm equivalent format), and 4288 × 2848 pixel resolution. All settings and the taking of pictures were controlled via DigiCamControl software on the computer. This ensured that the camera was untouched for the entire process of image acquisition. Once a picture was taken, the image was automatically transferred to the computer for review.
Corn seedling in a mini pot were placed in such a way that the mid-rib on the first leaf was as parallel to the camera’s image plane as possible. This was considered angle 0. Images for the analysis in this experiment were taken from six different angles, starting from 30 degrees, with a 30-degree interval (Figure 1G). Raw images were reviewed, and the areas with mini pots were cropped, leaving only the seedling parts in the images. The cropped images were then processed with ImageJ software as follows: (1) The cropped RGB image was converted to 8-bit grayscale image. (2) The threshold value was adjusted to contain only the seedling area. (3) We then obtained an area measurement by analyzing particles in ImageJ (Figure 1H). We also developed a macro program to be used in ImageJ for a batch processing of a large number of images. There were a total of 2520 pictures analyzed (6 angles × 35 hybrids × 6 replications × 2 temperature regimes). The areas measured from 6 different angles from an individual seedling were summed up as the summed leaf area (cm2) to represent a growth response to low temperature and used as a new parameter to screen among hybrids.
We measured the summed leaf area at 30 days after planting for low-temperature response, and the growing degree unit was 150 degrees. To compare with the growth response at normal temperature, another set of materials was planted and was grown for 10 days, and the growing degree unit was as same as that for the low-temperature study.

2.3. Various Saccharide Contents in Seeds

Saccharide contents were determined by the Carbohydrate Bioproduct Research Center at Sejong university, Seoul, Republic of Korea. Starch, phytoglycogen, glucose, fructose, and sucrose were determined for each cultivar, and total sugar was computed as the sum of the glucose, fructose, and sucrose contents. All contents were expressed as gram per seed since each individual seedling’s performance was thought to be more related to single seed-based saccharide contents.
For each cultivar, 40 g of kernels was homogenized to estimate the starch concentration. Kernels were soaked for 2 h, before 50 mL of distilled water was added in a blender. The homogenized sample solution was filtered through a 200 mm mesh sieve, and the substance remaining on the mesh sieve was washed with distilled water more than three times. The filtered liquid was moved to a centrifuge tube and was centrifuged (Hanil Combi-514R, Hanil Science, Daejeon, Republic of Korea) for 20 min at 3000× g. During this process, the oily band above the supernatant was removed using a spatula [25]. The precipitate remaining in the centrifuge tube was used to analyze the starch contents after drying.
For phytoglycogen separation, the supernatant obtained from centrifugation in the starch separation process was centrifuged for 20 min at 3000× g, with 100% EtOH, in a 3:7 ratio. The precipitated sediment in the centrifuge tube was dried and utilized as a sample for the phytoglycogen analysis.
To determine glucose, fructose, and sucrose contents, the sample was concentrated until the supernatant gained after centrifugation in the phytoglycogen separation process was less than 20 mL, using a rotary evaporator (CA-1112/NE-2001, EYELA, Shanghai, China). The concentrated solution was dissolved in 50 mL, using a volumetric flask, before being filtered through a 0.2 µm syringe filter and analyzed using HPAEC-PAD (ThermoFisher Scientific Korea Ltd., Seoul, Republic of Korea). Analysis conditions were CarboPac PA1 Column (4 × 250 mm) for column, A: 36 mM NaOH, B: 200 mM NaOH for eluent, a flow rate of 1.0 mL min−1, column temperature of 30 °C, and a 20 µL injection volume.

2.4. Field Validation

Three low-temperature-tolerant and susceptible cultivars were selected based on the summed leaf area from growth chamber study for field validation. Sugary endosperm-type cultivars were excluded for selection for future breeding purposes. One hundred seeds per cultivar were sown in a 2 m long single row as a replication. In total, 6 cultivars were arranged in a randomized complete block with 3 replications. Newly emerged seedlings were identified at 9~10 AM, and the number of new emergences was recorded every day until no new seedlings emerged.

2.5. Statistical Analyses

R script was used to carry out all statistical analyses (R Core Development Team, Vienna, Austria, 2015). Analysis of variance (ANOVA) was performed to examine any significant interactions between normal- and low-temperature treatments and the differences among varieties. Tukey’s honestly significant different tests (Tukey’s HSD) were employed for post hoc analysis. A correlation analysis was used to determine relationships among agronomic traits and saccharide contents. t-tests were carried out to compare traits between cultivars based on endosperm types.

3. Results

3.1. Growth Response to Low-Temperature Treatment

The ANOVA indicated that all the morphological traits measured under the low-temperature condition differed significantly among the sweet corn hybrids (Supplementary Materials Table S2). Significant differences were also observed among replications for all aerial-part traits, indicating that even the growth-chamber environment could have a substantial locational effect.
The summed leaf area of 35 sweet corn cultivars grown for 30 days after planting at 17/13 °C (14 h day/10 h night) low temperature condition had the average of 29.5 cm2 and the standard deviation of 13.29 cm2 with the range from 7.6 cm2 to 64.2 cm2 (Table 1). Summed leaf area, shoot and root fresh weight had similarly high coefficient of variation (CV) while SPAD was relatively low CV. When the response to low temperature was compared by observed endosperm types, hybrids with sugary endosperm type had significantly better performance in average expect for SPAD.
When summed, the leaf areas were displayed in descending order (Figure 2), and the difference among the sweet corn hybrids in response to the low-temperature condition was more obvious. The largest summed leaf area was 64.2 cm2 in the su_05 hybrid, and the smallest one was 7.6 cm2 in the sh_26 hybrid. Among the top three hybrids was the sugary (su) endosperm type, while the following three were of the shrunken (sh2) endosperm type. Although the difference in summed leaf area of the first- and sixth-ranked hybrid was 22.5 cm2, much greater than one standard deviation of 13.29 cm2, no statistical difference among the top six hybrids was detected by Tukey’s method. It was unclear if this was due to a significant replication effect or the property of the summed leaf area for which the asymmetrically shaped corn seedling area was measured at different angles and summed. There were four hybrids (su_01, su_04, su_05, and su_06) claimed to be cold tolerant by the seed company, which all happened to have sugary endosperm. While three of the hybrids had a relatively large significant summed leaf area, the su_04 hybrid remained intermediate (26.1 cm2).

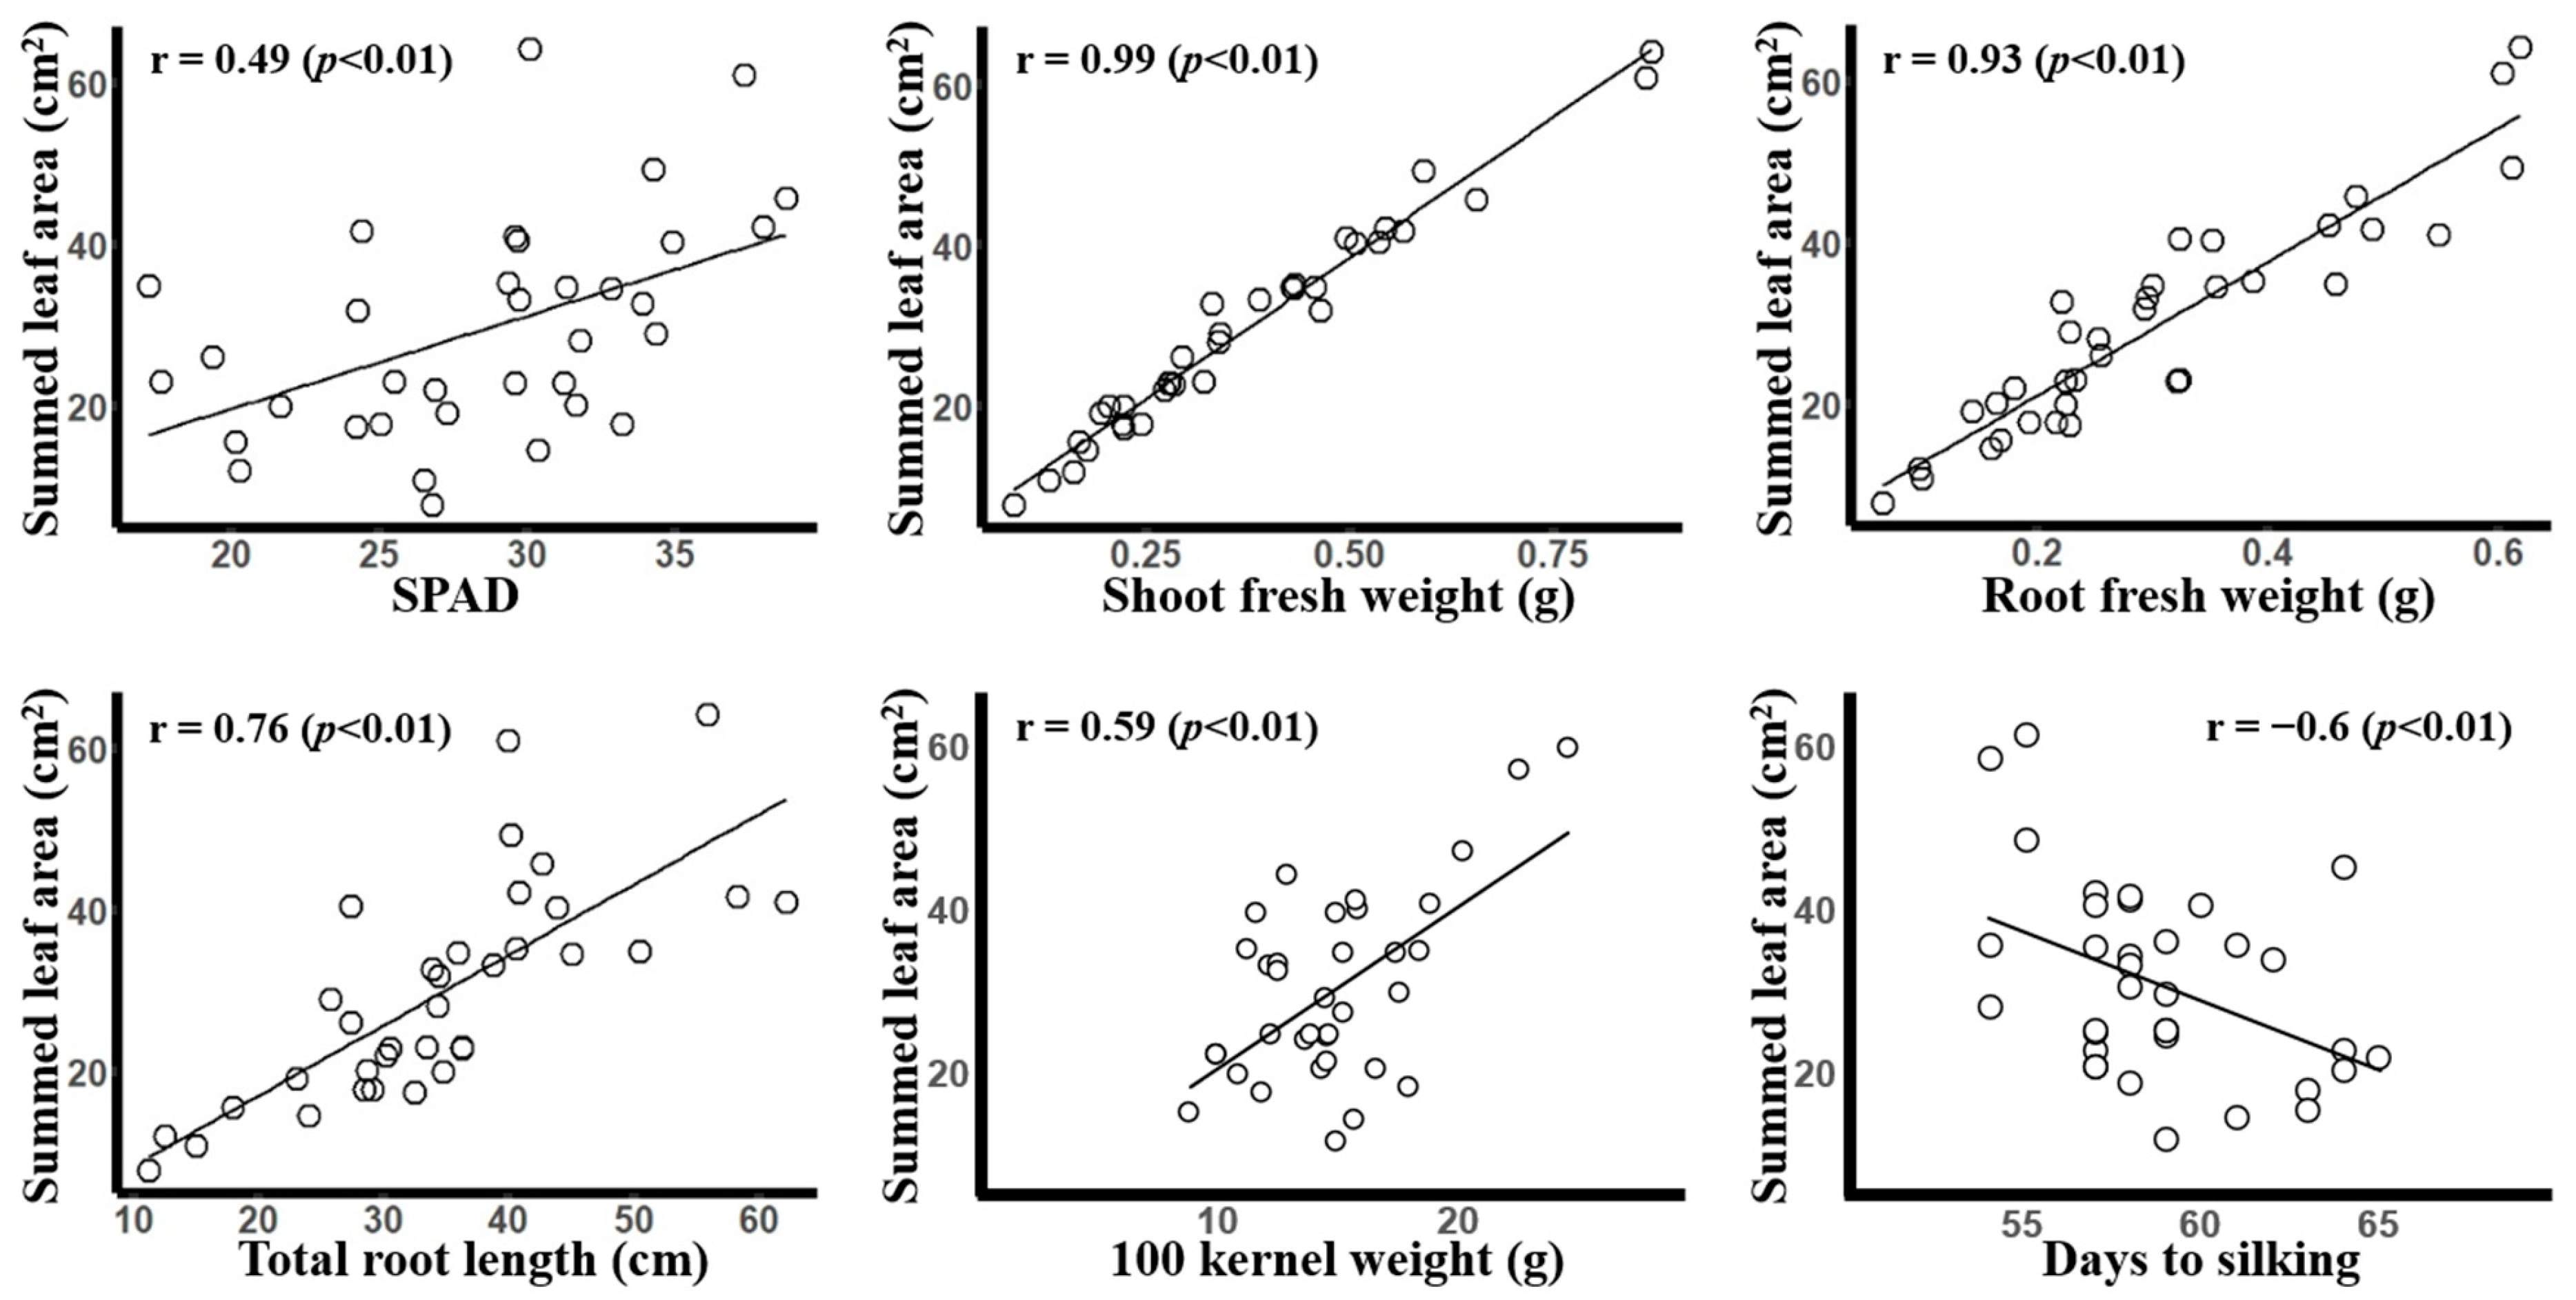
3.2. Correlation of Summed Leaf Area with Other Agronomic Traits

A correlation analysis was conducted to investigate the relationship of the summed leaf area with other traits (Figure 3). The SPAD value was moderately correlated with the summed leaf area (r = 0.49, p < 0.01). There was a strong positive correlation between the summed leaf area and shoot fresh weight (r = 0.99, p < 0.01), and root fresh weight (r = 0.93, p < 0.01). A positive correlation was also observed between the summed leaf area and total root length (r = 0.76, p < 0.01). One-hundred kernel weight (r = 0.59, p < 0.01) was positively correlated, while the days to silking (r = −0.6, p < 0.01) was negatively correlated, with the summed leaf are

3.3. Saccharide Contents in Seeds by Endosperm Types

We did not delve into detail regarding the difference among sweet corn hybrids on the composition of various saccharides comprising the seeds since it was not the main subject of interest in this study. We, however, compared each saccharide content by endosperm types, since it is, in general, known that the sugary endosperm type has better germination and seedling vigor than the shrunken endosperm type (Figure 4). Starch, fructose, and sucrose were not significantly different between the two endosperm types, but sugary endosperm had significantly greater phytoglycogen, glucose, and total sugar on average.

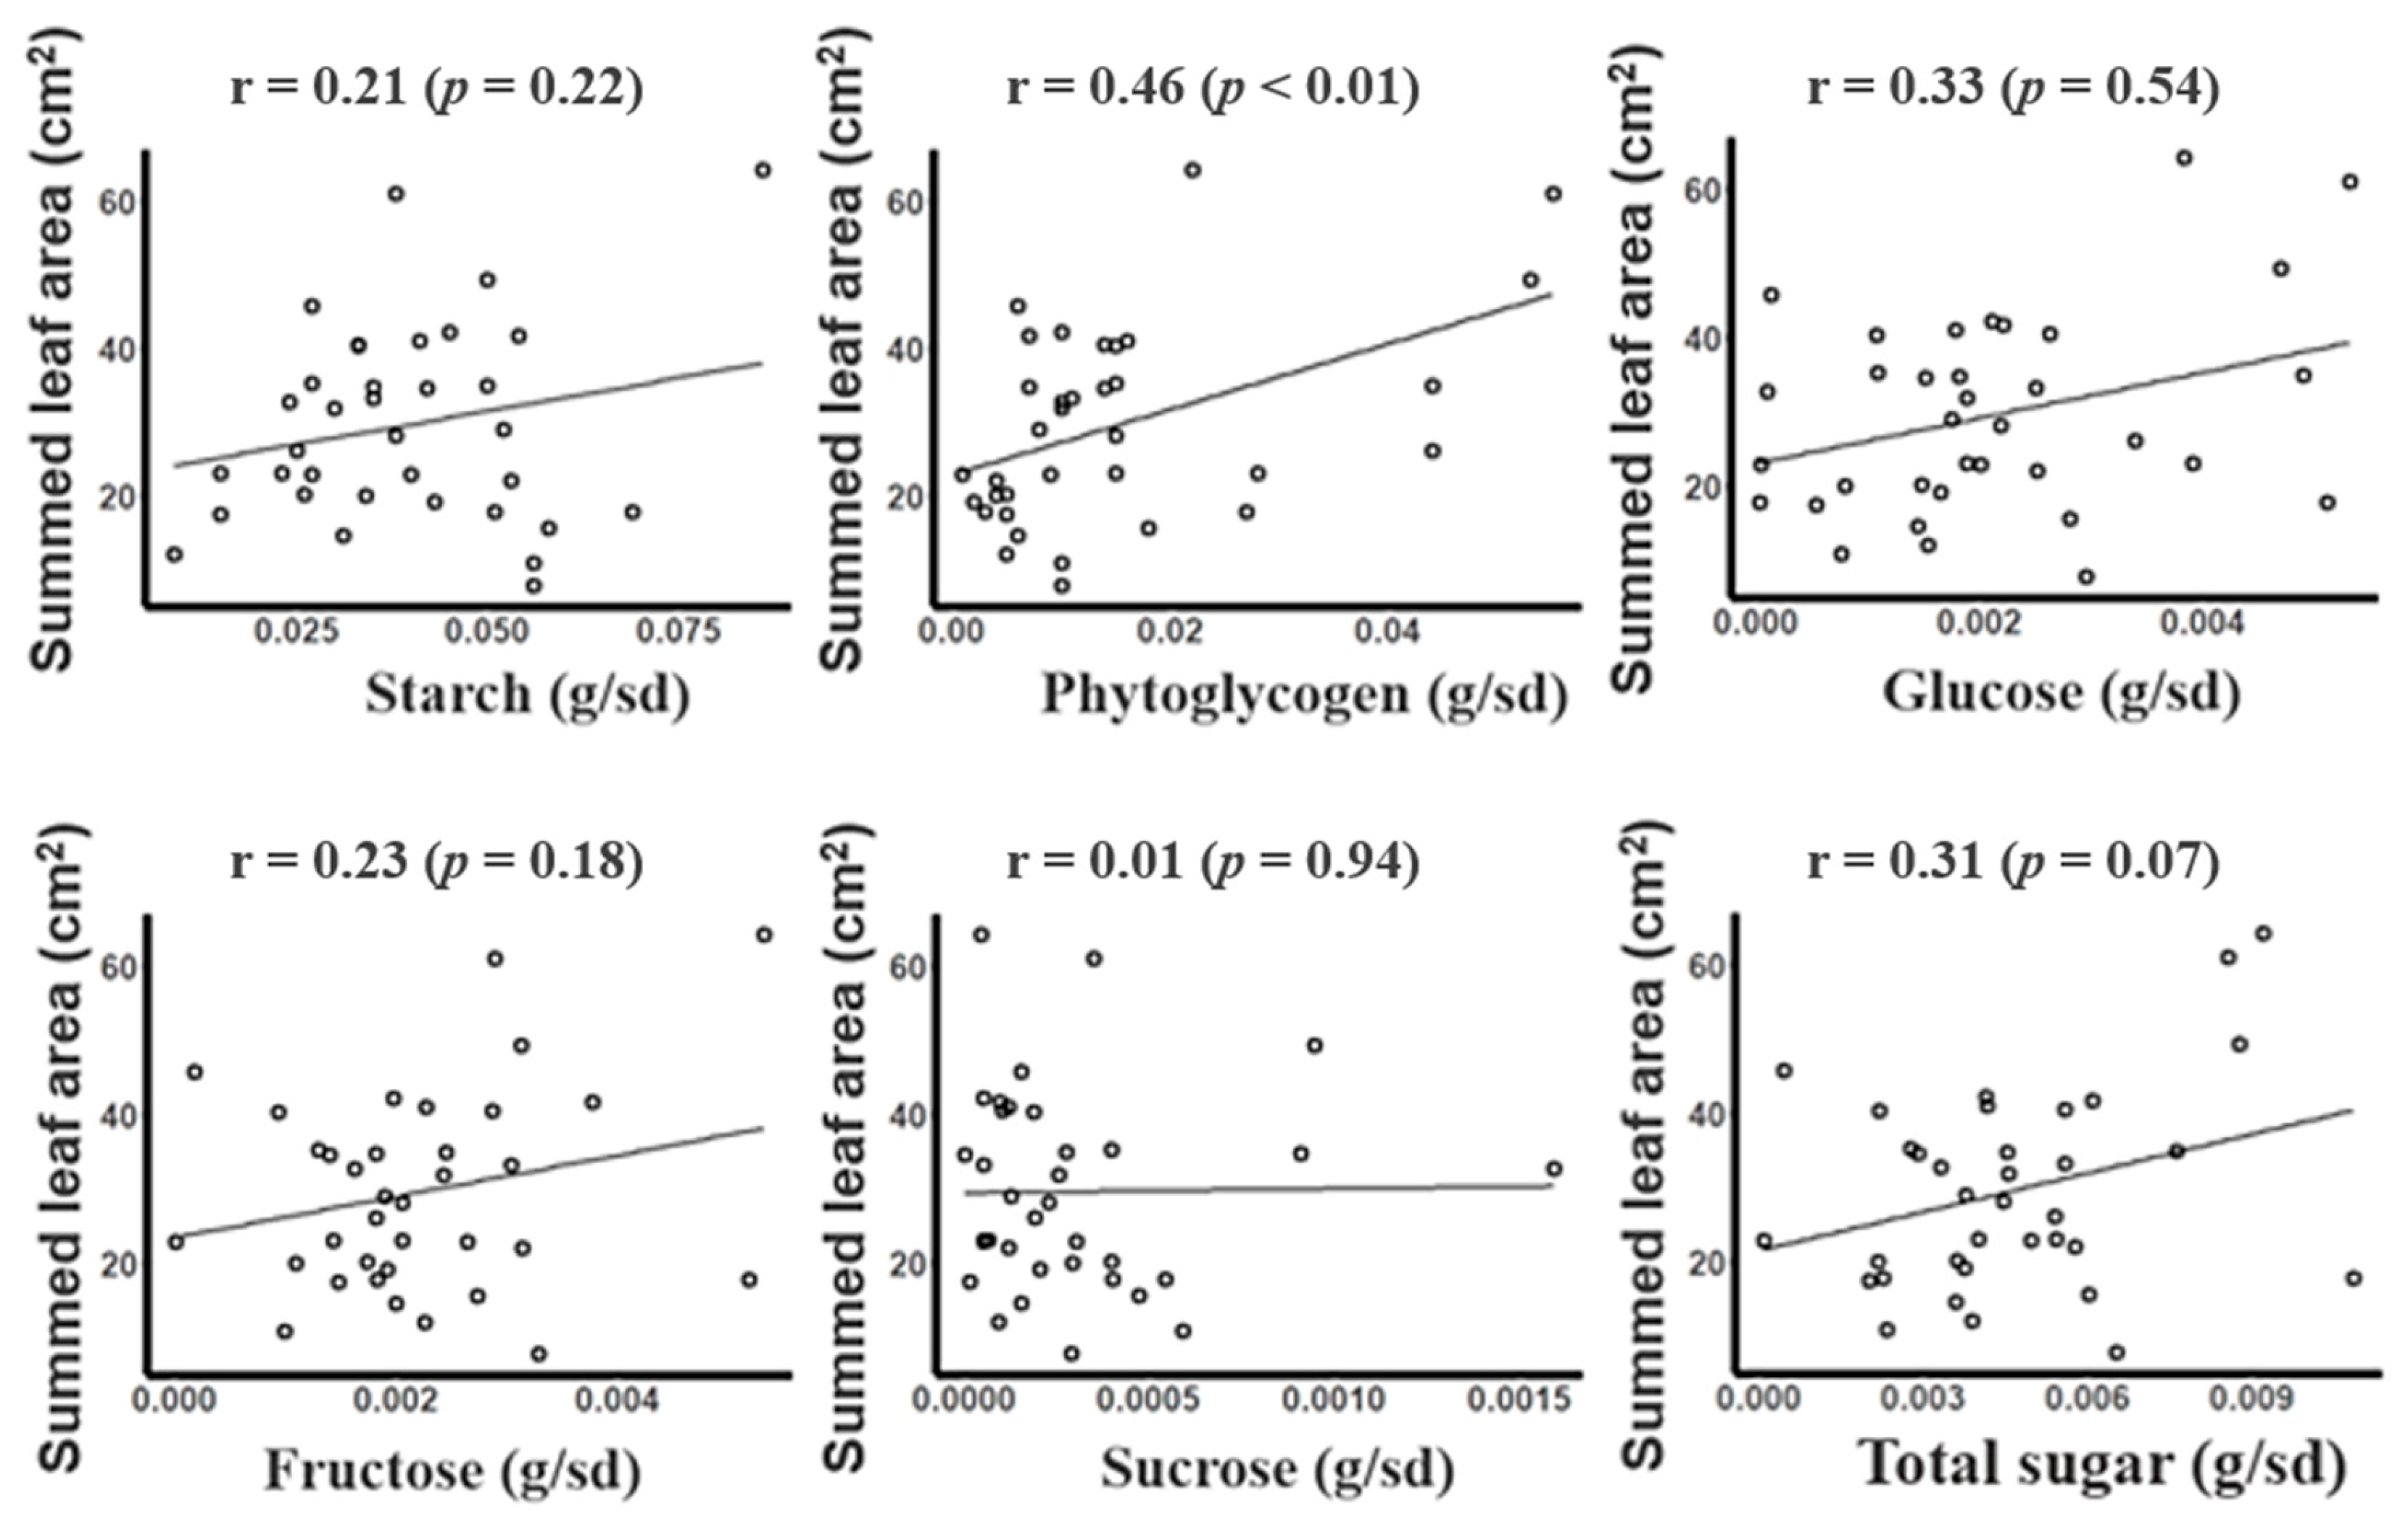
3.4. Relationship between Summed Leaf Area and Saccharide Contents under Low-Temperature Condition

A correlation analysis was performed to examine the linear relationship between the summed leaf area and various saccharide contents in sweet corn hybrid seeds (Figure 5). A positive correlation was detected between the summed leaf area and phytoglycogen (r = 0.46, p < 0.01), and all the other saccharides were found insignificant with the summed leaf area. The phytoglycogen content was one of the saccharides that was significantly different between the two endosperm types. We further performed the correlation analysis for each endosperm type separately and found that no saccharides were correlated with the summed leaf area in shrunken endosperm types, while fructose (r = 0.86, p = 0.029) and total sugar content (r = 0.92, p < 0.01) were the only two saccharides with significant correlation in the sugary endosperm type.

3.5. Comparison of Growth Response in Low-Temperature and Normal-Temperature Conditions

From a plant breeder’s perspective, not only is the relative difference of performance among breeding lines in the low-temperature condition important for selection, but it is also crucial for superior genotypes in normal condition to withstand stressed conditions such as cold temperatures. This is perhaps why various methods have been attempted to measure cold tolerance by growth reductions under low temperatures from normal condition [4,26,27]. In the present study, we attempted to grow the 35 sweet corn hybrids in normal-temperature condition, at 29/21 °C (14 h day/10 h night), for the duration of same growing degree unit as the low-temperature condition.
The combined analysis of variance showed a significant interaction effect between temperature treatment and the sweet corn cultivars on the summed leaf area, SPAD, shoot, and root fresh weight (Table 2). The total root length had no significant interaction.
Despite the significant interaction effect, there was only one hybrid, su_02, that had a significantly different growth response between the low-temperature condition (23.05 cm2) and its normal counterpart (42.11 cm2) by Tukey’s HSD test when the hybrids’ low-temperature growth was compared to the corresponding response under the normal temperature by the summed leaf area (Supplementary Material Table S3). Only the root fresh weight of su_06 responded differently. The shoot fresh weight and total root length did not have any significantly different growth response between the two temperature regimes. SPAD, however, had twelve cultivars with a significantly higher value in the normal-temperature than in the low-temperature condition.

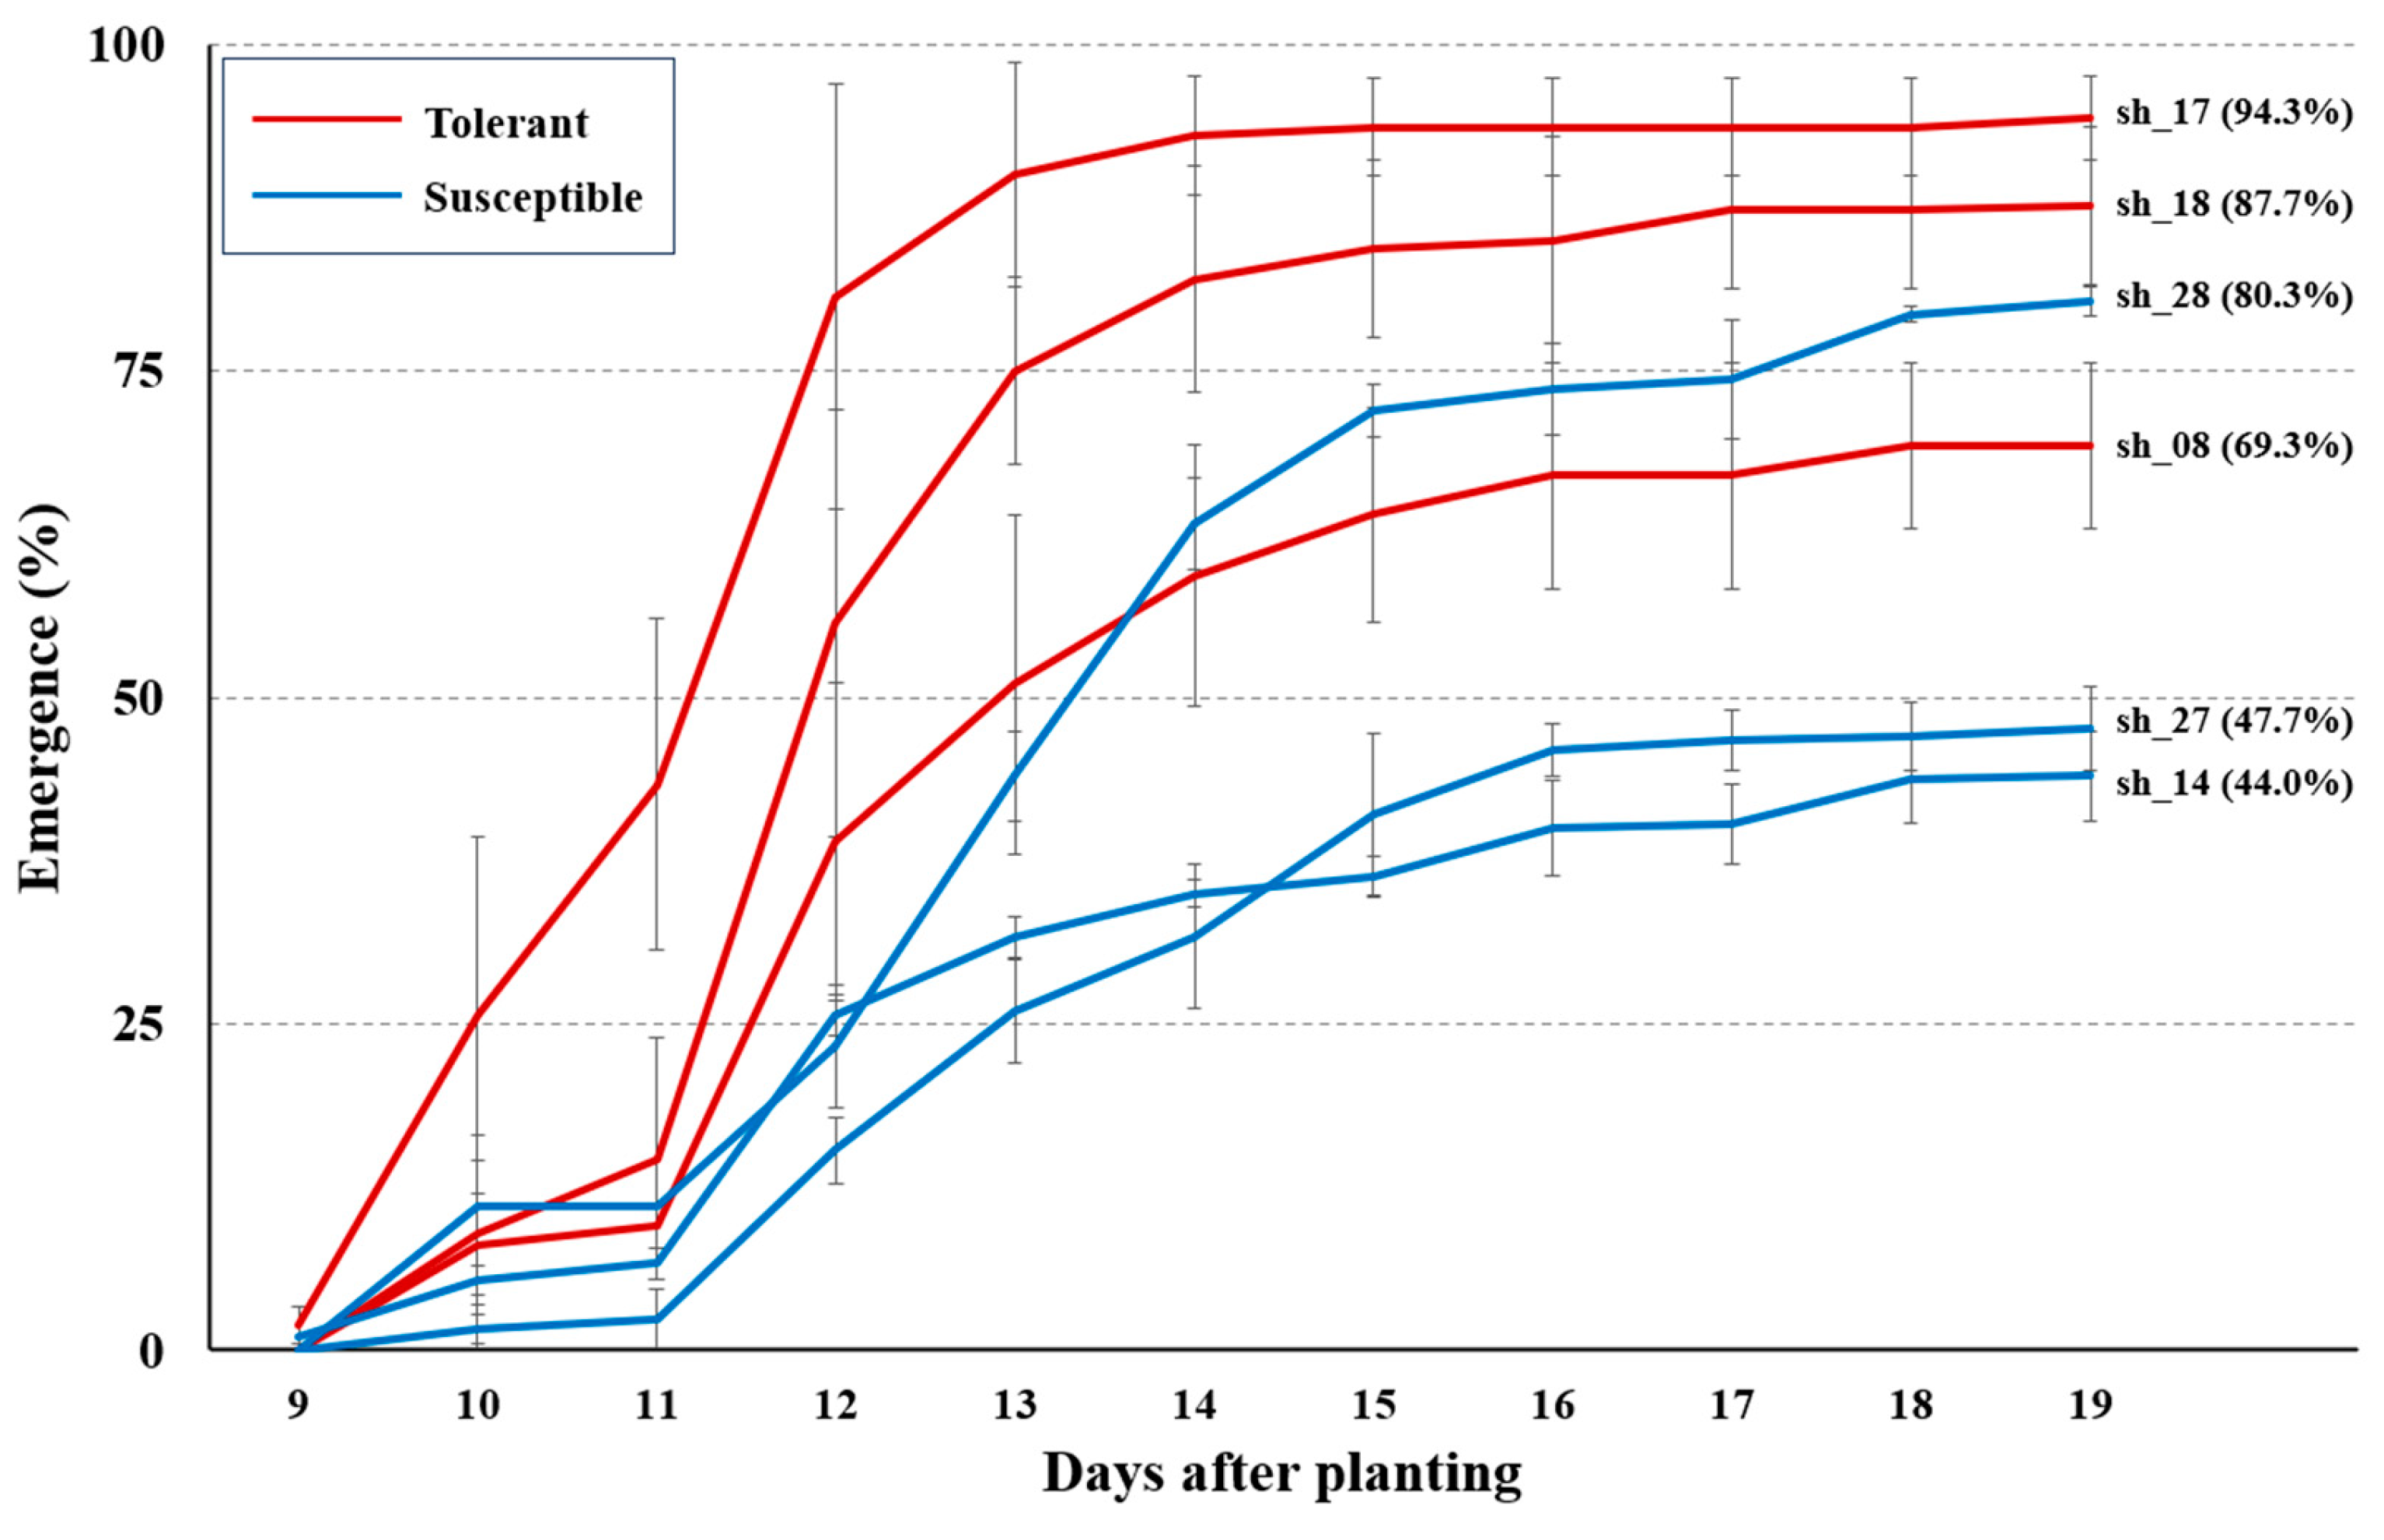
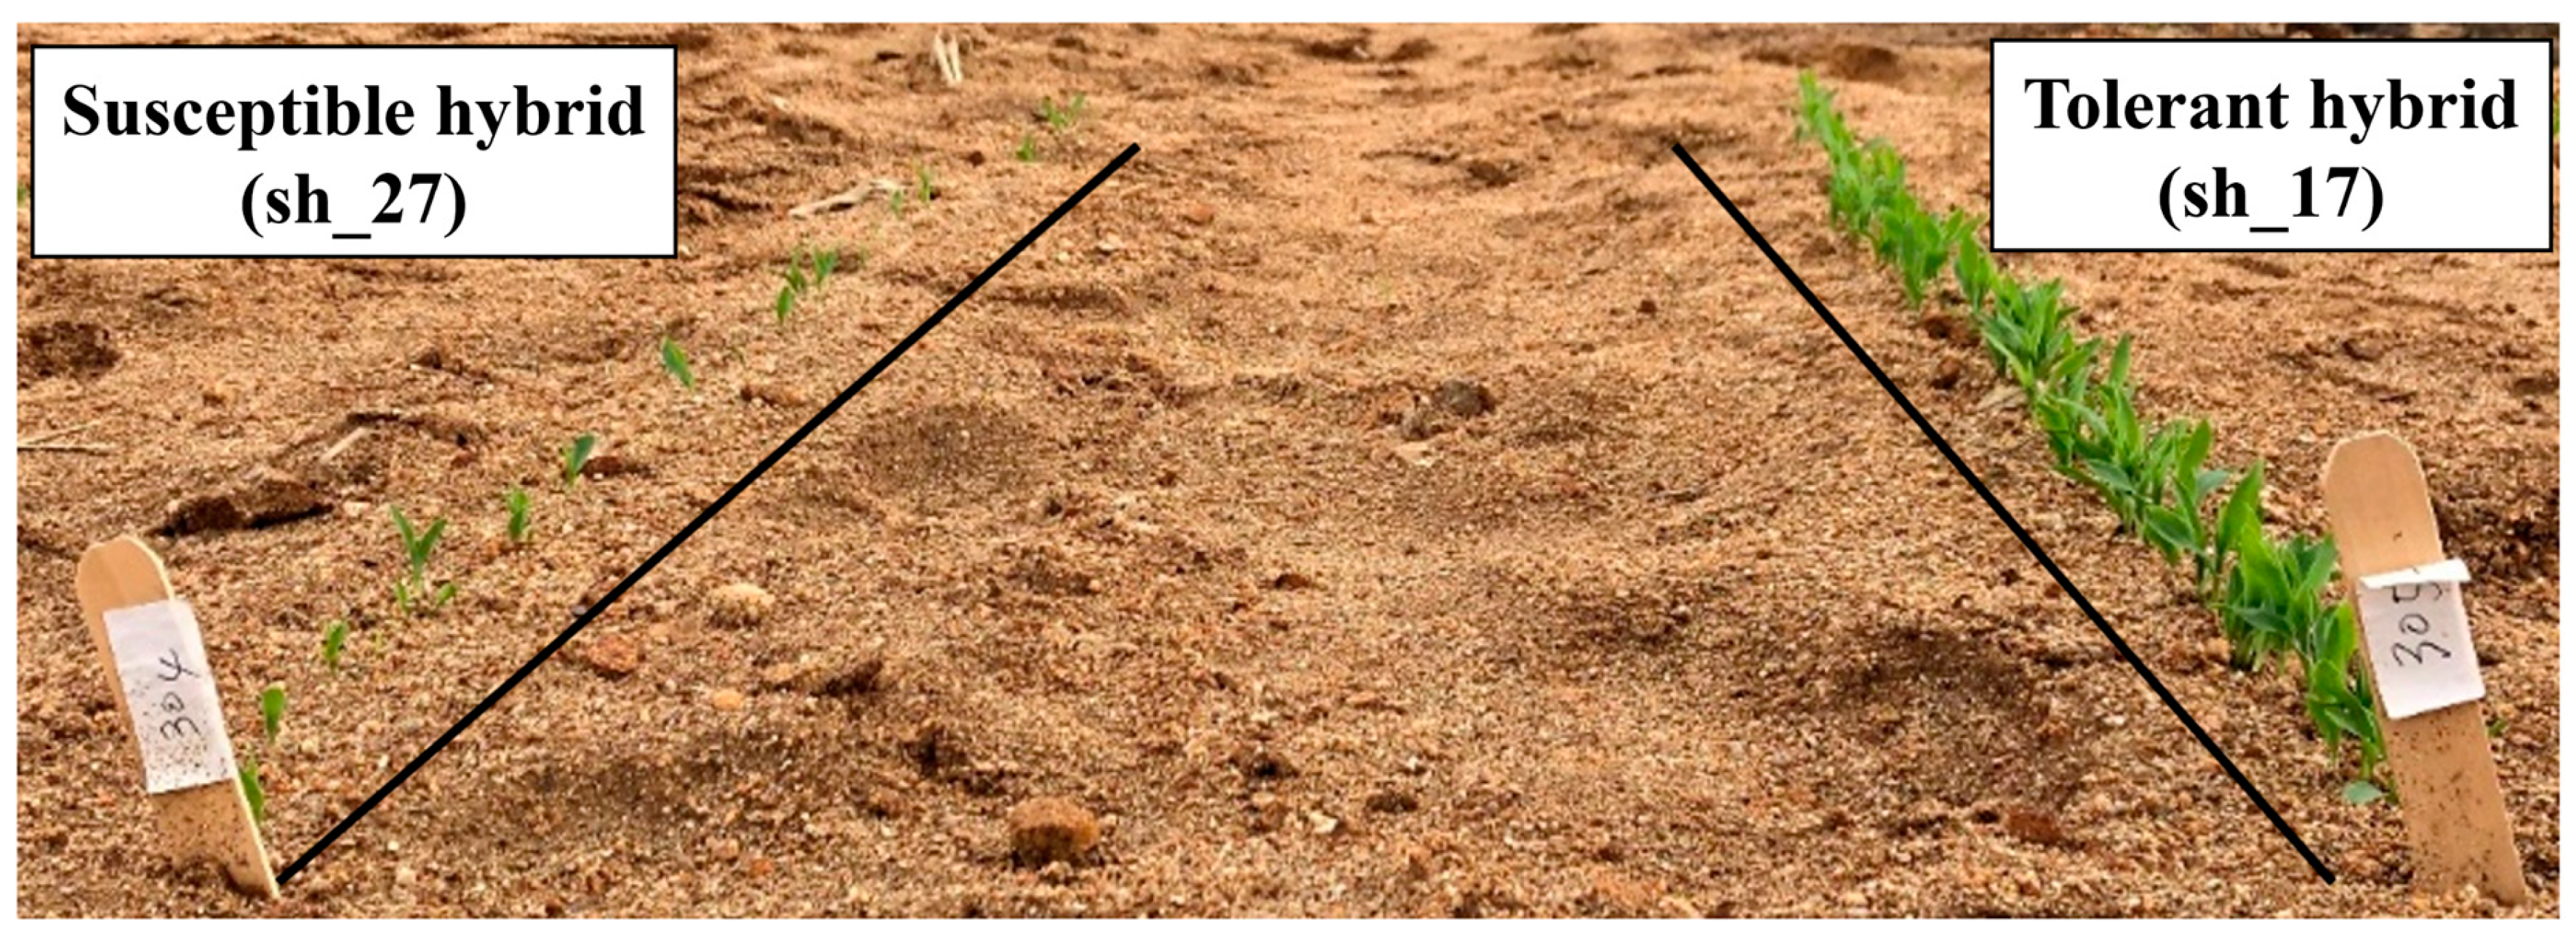
3.6. Validation of Selected Sweet Corn Hybrids in Field Condition

Shrunken endosperm-type hybrids were considered for field validation. There were three low-temperature-tolerant hybrids (sh_07 = 40.32 cm2, sh_17 = 42.16 cm2, and sh_18 = 40.42 cm2) and three susceptible hybrids (sh_14 = 17.74 cm2, sh_27 = 11.85 cm2, and sh_28 = 17.3 cm2) based on the summed leaf area as a selection criterion. The average temperature during the field test period was 14.2 °C, which was close to the mean temperature of 15 °C for the low-temperature condition of the growth chamber experiment (Figure 6). During nineteen days of field tests, the maximum and minimum of the daily maximum temperature were 29.8 °C and 10.3 °C, with an average of 19.7 °C, while those for the daily minimum temperature were 15.8 °C and 3.8 °C, with an average of 9.2 °C. The maximum and minimum of the average daily temperature were 21 °C and 8.2 °C, respectively.
Initial emergence took 9~10 days after planting regardless of the level of low-temperature response based on the summed leaf area (Figure 7). The tolerant hybrid sh_17 had 25.6% emergence on the 2nd day from the first emergence, but all the other hybrids’ emergence rate was below 10% on the same day. On the 4th day (12 DAP), the emergence of the three tolerant hybrids outperformed all three susceptible hybrids. The hybrid, sh_17 reached 90% emergence on the 5th day. On the other hand, the susceptible hybrid sh_28 began to emerge slowly and started to catch up starting from the 6th day. It eventually outperformed one of the tolerant hybrids, sh_08, at the end, with a final emergence rate of 80.3%. The other two susceptible hybrids had a final emergence rate below 50%.

4. Discussion

A total of thirty-five sweet corn hybrids were grown for 30 days at 17/13 °C (14 h day/10 h night) low-temperature conditions. There were substantial differences among hybrids with regards to SPAD, shoot and root fresh weight, and total root length, as well as summed leaf area, a new parameter introduced here in this study via the digital image analysis (Supplementary Materials Table S2). There was a more than 8-fold difference in summed leaf area between the maximum (64.2 cm2) and minimum (7.6 cm2) hybrid, successfully ranging the sweet corn hybrids in a wide spectrum of low-temperature response.
Strong positive relationships between the summed leaf area and shoot and root weight were confirmed by the correlation analysis (Figure 3). Destructive methods are required to measure root traits. The results showed that the summed leaf area can be used to estimate the root traits. Hund et al. (2008) studied a correlation between the root length and photosynthesis among inbred lines and suggested that inbred lines with high root vigor should be selected for cold tolerance [13]. In the present study, root vigor could be indirectly determined using the summed leaf area from the digital image analysis instead of measuring the root traits destructively. Wu et al. (2016) observed that nutrition uptake by roots was increased with root surface expansion [27]. The development of the root system also affects the aerial parts of the plant, as it facilitates water and nutrient absorption [28]. Therefore, as demonstrated through a correlation analysis, both the destructively measured shoot fresh weight and root fresh weight can be estimated in a non-destructive way, such as through the summed leaf area via a digital image analysis.
Starch is used as an energy source during germination and early growth [29,30]. While various studies have demonstrated how starch is involved in the germination process and early growth, research on the amount of starch required for early growth is still lacking [31]. Soluble sugars such as glucose, sucrose, and fructose affect germination and early growth in crops too [32]. They are also involved in gene expression and hormone biosynthesis in plants [33,34]. Glucose and sucrose are utilized as osmotic substances to maintain cellular respiration and homeostasis, and it has also been reported that they are involved in cell protection and secondary metabolite synthesis during osmotic stress [35,36]. Sucrose is known to be involved in cold tolerance, as it decomposes into glucose and fructose during germination and protects the thylakoid membrane by forming crystals [37]. Phytoglycogen is a polysaccharide that exists in a high-density form to store glucose, which is used as an energy source in plants [38]. Doehlert et al. (1993) noted that seed phytoglycogen content was associated with increased recessive homogeneous su gene transcription, which inhibits the activity of the debranching enzyme pullulanase [39]. While all the saccharides in this study are used directly or indirectly in seed germination and early growth, the level of phytoglycogen in seeds was the only characteristic that was correlated moderately with the level of growth response at a low temperature, represented by the summed leaf area. Hence, it appears that glucose, fructose, sucrose, and starch contents in seeds do not seem to affect seedling vigor at least among the hybrids studied. There may be other mechanisms for sweet corn seedling vigor at low temperatures.
The variation among the sweet corn hybrids in low-temperature treatment is important in selecting tolerant hybrids as breeding materials. While we still consider this variation as tolerance to susceptibility, this type of relative difference among hybrids in response to low temperature, however, may not reflect a practical level of tolerance, meaning that a tolerant hybrid has less reduction in vigor when exposed to unfavorable lower temperatures than optimal. We then set a hypothesis that the summed leaf area of a hybrid measured from seedlings grown at a normal temperature would not be any different from those grown at a low temperature. We set the normal temperature condition at 29/21 °C (14 h day/10 h night) and had the same experiment conducted at this condition, but the growing period was synchronized with the low-temperature experiment at a growing degree unit of 150 degrees.
The combined analysis of variance indicated that the temperature by cultivar interaction effect was highly significant for all morphological traits, except for the total root length. Tukey’s HSD post hoc test of the difference between the low and normal temperature for each hybrid indicated that there was only one significant hybrid for the summed leaf area. In other words, 34 out of 35 hybrids did not differ in regard to their summed leaf area when grown either in low- or normal-temperature conditions for a growing degree unit of 150 degree. The results were somewhat surprising and challenging in regard to interpreting the observations.
The results imply that the classification of hybrids for tolerance to low temperatures may change depending on the point of view. If we consider that less reduction in growth under the low-temperature condition is a tolerant response [39], then our results indicate that most of the hybrids studied did not possess any tolerance to low-temperature stress. In this case, the tolerance could be defined as a plant’s ability to withstand or defend against the stress it is exposed to [39,40]. Stability could be another term for this type of tolerance.
Nevertheless, it was in fact true that the hybrids with a larger summed leaf area had better seedling vigor than those with a smaller summed leaf area, thus having relative tolerance to low-temperature stress. In this case, the tolerance is relative among hybrids. We do not know if this type of relative difference in seedling vigor at a low temperature would result in differences in yield and yield components at the end. One of the main objectives of this study was to develop a non-destructive and objective method to screen seedling vigor via a digital image analysis. Hence, further studies are required to investigate the difference in yield relative to the level of seedling vigor represented by the summed leaf area.
We, however, investigated further by verifying our selection from the digital image analysis results in the field condition.
The field condition was close to the low-temperature growth chamber condition in regard to average temperature. The initial emergence date from planting was similar for all tolerant and susceptible hybrids at 9~10 days. At the end of the field evaluation, the three hybrids classified as tolerant according to their summed leaf area had germination rates of 94.3%, 87.7%, and 69.3%, respectively, while the other three hybrids classified as susceptible had 80.3%, 47.7%, and 44.0%, respectively. Figure 8 shows the striking difference in germination rate and seedling vigor in the low-temperature field condition between the tolerant and susceptible hybrid.
In the field validation, one susceptible hybrid (sh_28) outperformed one tolerant hybrid (sh_08) in the field. We measured the germination rate, but the vigor was visually inspected in the field. In fact, for the growth chamber experiment, we tried to avoid any missing plots by germinating more than six mini pots and selecting six mini pots that uniformly emerged for image-taking purposes, although the germination took place at the same temperature condition as the growing condition. Thus, the growth chamber experiment and summed leaf area from the digital image analysis did not take into account any difference among hybrids according to the germination rate.
Overall, the summed leaf area from the digital image analysis could be used to screen seedling vigor under the low-temperature condition. The authors believe that this method with summed leaf area could be further integrated into an automated phenotyping system wherein acquiring digital images and processing them to come up with a final selection result would not depend on trained personnels.

5. Conclusions

In this study, we employed a non-destructive and objective method to measure and evaluate the low-temperature response of sweet corns at the seedling stage, using a digital image analysis. The summed leaf area as a new parameter was compared with SPAD, shoot and root fresh weight, and total root length. Based on the summed leaf area measured from the growth chamber experiment, tolerant and susceptible hybrids were selected, and the selection was verified in a field evaluation. The research conclusions are as follows:
(1)
There was a substantial difference among sweet corn hybrids on summed leaf area, SPAD, shoot and root fresh weight, and total root length at the seedling stage germinated and grown under low-temperature conditions.
(2)
The group mean of the sugary endosperm type was significantly higher than that of the shrunken endosperm type for all traits but SPAD.
(3)
For the summed leaf area, the top three ranked hybrids were all from the sugary endosperm type, but the area for the following three hybrids (4th~6th rank) from the shrunken endosperm type did not differ significantly from that for the first three hybrids.
(4)
The summed leaf area was positively correlated with SPAD, shoot and root fresh weight, and total root length.
(5)
The phytoglycogen content in seeds of sweet corn hybrids was the only saccharide that had a significant correlation with the summed leaf area.
(6)
When low-temperature stress was compared to normal-temperature growing condition for the same growing degree unit, the summed leaf area of 34 out of 35 hybrids examined did not differ between the two temperature conditions.
(7)
The level of low-temperature response based on the summed leaf area was reflected in the low-temperature field condition, with a few exceptions.

Supplementary Materials

The following supporting information can be downloaded at https://www.mdpi.com/article/10.3390/agriculture14030360/s1, Table S1: List of commercial F1 sweet corn hybrids used in this study; Table S2: Analysis of variance for summed leaf area, SPAD, shoot weight, root weight, and total root length of seedlings of 35 sweet corn cultivars under low-temperature condition; Table S3: Tukey’s HSD post hoc test result on the differences of measured trait between normal and low-temperature condition.

Author Contributions

Conceptualization, T.-C.P. and Y.-S.S.; methodology, T.-C.P. and Y.-S.S.; formal analysis, T.-C.P.; writing—original draft preparation, T.-C.P.; writing—review and editing, S.W., J.K., M.K., J.-W.C. and Y.-S.S.; visualization, T.-C.P.; supervision, J.-W.C. and Y.-S.S. All authors have read and agreed to the published version of the manuscript.

Funding

This research was supported by Chungbuk National University Korea National University Development Project (2021).

Institutional Review Board Statement

Not applicable.

Data Availability Statement

The original contributions presented in the study are included in the article/Supplementary Material, further inquiries can be directed to the corresponding authors.

Acknowledgments

We thank all the staffs of the agricultural research farm of Chungbuk National University for their help in management of the experiment.

Conflicts of Interest

The authors declare no conflicts of interest.

References

  1. Lertrat, K.; Pulam, T. Breeding for Increased Sweetness in Sweet Corn. Int. J. Plant Breed. 2007, 1, 27–30. [Google Scholar]
  2. Lee, J.-S.; Jung, T.-W.; Son, B.-Y.; Kim, J.-T.; Jung, G.-H.; Shin, S.-H.; Kim, S.-K.; Seo, J.-H.; Lee, J.-E.; Baek, S.-B. A New Sweet Corn Hybrid with Good Eating Quality and High Sugar Content, ‘Guseulok’. Korean J. Breed. Sci. 2013, 45, 416–419. [Google Scholar] [CrossRef]
  3. Lee, J.-S.; Jung, T.-W.; Son, B.-Y.; Shin, S.-H.; Kim, J.-T.; Bae, H.-H.; Baek, S.-B.; Ku, J.-H.; Hwang, J.-J.; Kim, S.-L. A Yellow Sweet Corn Hybrid with High Sugar Content and Lodging Tolerance, ‘Godangok’. Korean J. Breed. Sci. 2014, 46, 476–480. [Google Scholar] [CrossRef]
  4. Enders, T.A.; St Dennis, S.; Oakland, J.; Callen, S.T.; Gehan, M.A.; Miller, N.D.; Spalding, E.P.; Springer, N.M.; Hirsch, C.D. Classifying Cold-Stress Responses of Inbred Maize Seedlings Using RGB Imaging. Plant Direct 2019, 3, 104. [Google Scholar] [CrossRef]
  5. Sellschop, J.P.F.; Salmon, S.C. The Influence of Chilling, above the Freezing Point, on Certain Crop Plants. J. Agric. Res. 1928, 37, 315–338. [Google Scholar]
  6. Revilla, P.; Hotchkiss, J.R.; Tracy, W.F. Cold Tolerance Evaluation in a Diallel among Open-Pollinated Sweet Corn Cultivars. HortScience 2003, 38, 88–91. [Google Scholar] [CrossRef]
  7. Azanza, F.; Bar-Zur, A.; Juvik, J.A. Variation in Sweet Corn Kernel Characteristics Associated with Stand Establishment and Eating Quality. Euphytica 1996, 87, 7–18. [Google Scholar] [CrossRef]
  8. Hassell, R.L.; Dufault, R.J.; Phillips, T.L. Low-Temperature Germination Response of Su, Se, and Sh2 Sweet Corn Cultivars. HortTechnology 2003, 13, 136–141. [Google Scholar] [CrossRef]
  9. Simon, E.W. Plant Membranes under Dry Conditions. Pestic. Sci. 1978, 9, 169–172. [Google Scholar] [CrossRef]
  10. Huner, N.; Elfman, B.; Król, M.; Mcintosh, A. Growth and Development at Cold-Hardening Temperatures. Chloroplast Ultrastructure, Pigment Content, and Composition. Can. J. Bot. 1984, 62, 53–60. [Google Scholar] [CrossRef]
  11. Wijewardana, C.; Henry, W.B.; Hock, M.W.; Reddy, K.R. Growth and Physiological Trait Variation among Corn Hybrids for Cold Tolerance. Can. J. Plant Sci. 2016, 96, 639–656. [Google Scholar] [CrossRef]
  12. Ruelland, E.; Zachowski, A. How Plants Sense Temperature. Environ. Exp. Bot. 2010, 69, 225–232. [Google Scholar] [CrossRef]
  13. Hund, A.; Fracheboud, Y.; Soldati, A.; Stamp, P. Cold Tolerance of Maize Seedlings as Determined by Root Morphology and Photosynthetic Traits. Eur. J. Agron. 2008, 28, 178–185. [Google Scholar] [CrossRef]
  14. Imran, M.; Mahmood, A.; Römheld, V.; Neumann, G. Nutrient Seed Priming Improves Seedling Development of Maize Exposed to Low Root Zone Temperatures during Early Growth. Eur. J. Agron. 2013, 49, 141–148. [Google Scholar] [CrossRef]
  15. Yadav, S.K. Cold Stress Tolerance Mechanisms in Plants BT—Sustainable Agriculture Volume 2; Lichtfouse, E., Hamelin, M., Navarrete, M., Debaeke, P., Eds.; Springer: Dordrecht, The Netherlands, 2011; pp. 605–620. ISBN 978-94-007-0394-0. [Google Scholar]
  16. Kubien, D.S.; von Caemmerer, S.; Furbank, R.T.; Sage, R.F. C4 Photosynthesis at Low Temperature. A Study Using Transgenic Plants with Reduced Amounts of Rubisco. Plant Physiol. 2003, 132, 1577–1585. [Google Scholar] [CrossRef] [PubMed]
  17. Guy, C.L. Cold Acclimation and Freezing Stress Tolerance: Role of Protein Metabolism. Annu. Rev. Plant Physiol. Plant Mol. Biol. 1990, 41, 187–223. [Google Scholar] [CrossRef]
  18. Thomashow, M.F. Pant Cold Acclimation: Freezing Tolerance Genes and Regulatory Mechanisms. Annu. Rev. Plant Physiol. Plant Mol. Biol. 1999, 50, 571–599. [Google Scholar] [CrossRef] [PubMed]
  19. Marocco, A.; Lorenzoni, C.; Fracheboud, Y. Chilling Stress in Maize. Maydica 2005, 50, 571–580. [Google Scholar]
  20. Hartmann, A.; Czauderna, T.; Hoffmann, R.; Stein, N.; Schreiber, F. HTPheno: An Image Analysis Pipeline for High-Throughput Plant Phenotyping. BMC Bioinform. 2011, 12, 148. [Google Scholar] [CrossRef] [PubMed]
  21. Fahlgren, N.; Feldman, M.; Gehan, M.A.; Wilson, M.S.; Shyu, C.; Bryant, D.W.; Hill, S.T.; McEntee, C.J.; Warnasooriya, S.N.; Kumar, I. A Versatile Phenotyping System and Analytics Platform Reveals Diverse Temporal Responses to Water Availability in Setaria. Mol. Plant 2015, 8, 1520–1535. [Google Scholar] [CrossRef] [PubMed]
  22. Lobet, G. Image Analysis in Plant Sciences: Publish Then Perish. Trends Plant Sci. 2017, 22, 559–566. [Google Scholar] [CrossRef] [PubMed]
  23. Schneider, C.A.; Rasband, W.S.; Eliceiri, K.W. NIH Image to ImageJ: 25 Years of Image Analysis. Nat. Methods 2012, 9, 671–675. [Google Scholar] [CrossRef] [PubMed]
  24. Hong*, S.-T.; Jeong, Y.-S.; Kim, J.-W.; Lee, E.-S.; Han, Y.-Y.; Gil, N.-Y.; Lee, M.-J.; Lee, G.-H. Studies on Physico-Chemical Characterization of Starch Extracted from Domestic Barley Cultivars. Food Eng. Prog. 2013, 17, 203–211. [Google Scholar]
  25. Hatfield, J.L.; Prueger, J.H. Temperature Extremes: Effect on Plant Growth and Development. Weather Clim. Extrem. 2015, 10, 4–10. [Google Scholar] [CrossRef]
  26. Wijewardana, C.; Hock, M.; Henry, B.; Reddy, K.R. Screening Corn Hybrids for Cold Tolerance Using Morphological Traits for Early-Season Seeding. Crop Sci. 2015, 55, 851–867. [Google Scholar] [CrossRef]
  27. Wu, Q.; Pagès, L.; Wu, J. Relationships between Root Diameter, Root Length and Root Branching along Lateral Roots in Adult, Field-Grown Maize. Ann. Bot. 2016, 117, 379–390. [Google Scholar] [CrossRef]
  28. Sun, J.; Wu, D.; Xu, J.; Rasmussen, S.K.; Shu, X. Characterisation of Starch during Germination and Seedling Development of a Rice Mutant with a High Content of Resistant Starch. J. Cereal Sci. 2015, 62, 94–101. [Google Scholar] [CrossRef]
  29. Zhao, M.; Zhang, H.; Yan, H.; Qiu, L.; Baskin, C.C. Mobilization and Role of Starch, Protein, and Fat Reserves during Seed Germination of Six Wild Grassland Species. Front. Plant Sci. 2018, 9, 234. [Google Scholar] [CrossRef]
  30. Andriotis, V.M.E.; Rejzek, M.; Barclay, E.; Rugen, M.D.; Field, R.A.; Smith, A.M. Cell Wall Degradation Is Required for Normal Starch Mobilisation in Barley Endosperm. Sci. Rep. 2016, 6, 33215. [Google Scholar] [CrossRef]
  31. Dirk, L.M.A.; van der Krol, A.R.; Vreugdenhil, D.; Hilhors, H.W.M.; Bewley, J.D. Galactomannan, Soluble Sugar and Starch Mobilization Following Germination of Trigonella Foenum-Graecum Seeds. Plant Physiol. Biochem. 1999, 37, 41–50. [Google Scholar] [CrossRef]
  32. Rosa, M.; Prado, C.; Podazza, G.; Interdonato, R.; González, J.A.; Hilal, M.; Prado, F.E. Soluble Sugars-Metabolism, Sensing and Abiotic Stress a Complex Network in the Life of Plants. Plant Signal. Behav. 2009, 4, 388–393. [Google Scholar] [CrossRef] [PubMed]
  33. Rognoni, S.; Teng, S.; Arru, L.; Smeekens, S.C.M.; Perata, P. Sugar Effects on Early Seedling Development in Arabidopsis. Plant Growth Regul. 2007, 52, 217–228. [Google Scholar] [CrossRef]
  34. Yan, D.; Duermeyer, L.; Leoveanu, C.; Nambara, E. The Functions of the Endosperm During Seed Germination. Plant Cell Physiol. 2014, 55, 1521–1533. [Google Scholar] [CrossRef] [PubMed]
  35. Tarkowski, Ł.P.; Van den Ende, W. Cold Tolerance Triggered by Soluble Sugars: A Multifaceted Countermeasure. Front. Plant Sci. 2015, 6, 203. [Google Scholar] [CrossRef] [PubMed]
  36. Koster, K.L.; Leopold, A.C. Sugars and Desiccation Tolerance in Seeds 1. Plant Physiol. 1988, 88, 829–832. [Google Scholar] [CrossRef]
  37. Nickels, J.D.; Atkinson, J.; Papp-Szabo, E.; Stanley, C.; Diallo, S.O.; Perticaroli, S.; Baylis, B.; Mahon, P.; Ehlers, G.; Katsaras, J. Structure and Hydration of Highly-Branched, Monodisperse Phytoglycogen Nanoparticles. Biomacromolecules 2016, 17, 735–743. [Google Scholar] [CrossRef]
  38. Doehlert, D.C.; Kuo, T.M.; Juvik, J.A.; Beers, E.P.; Duke, S.H. Characteristics of Carbohydrate Metabolism in Sweet Corn (Sugary-1) Endosperms. J. Am. Soc. Hortic. Sci. 2019, 118, 661–666. [Google Scholar] [CrossRef]
  39. Zhou, X.; Muhammad, I.; Lan, H.; Xia, C. Recent Advances in the Analysis of Cold Tolerance in Maize. Front. Plant Sci. 2022, 13, 866034. [Google Scholar] [CrossRef]
  40. Zhao, X.; Ge, S.; Wei, Y.; Xu, X.; Ding, D.; Liu, M. Analysis of root physiology and related gene expression in maize (Zea mays) under low temperature stress. J. Agric. Biotechnol. 2020, 28, 32–41. [Google Scholar]
Figure 1. From image acquisition to processing. (A,B) Image-acquisition station, (C) turntable, (D) camera set up to computer, (E) front view, (F) a sample of a raw image, (G) angle of corn seedling toward camera lens, and (H) image-processing flow for area measurement.
Agriculture 14 00360 g001
Figure 2. Summed leaf area of 35 sweet corn cultivars in descending order. The same letters above bar indicate no significant difference according to Tukey’s pair-wise comparison.
Agriculture 14 00360 g002
Figure 3. Correlation analyses of summed leaf area with SPAD, shoot fresh weight, root fresh weight, total root length, 100 kernel weight, and days to silking (n = 35).
Agriculture 14 00360 g003
Figure 4. Boxplots of various saccharide contents by observed endosperm types. Total sugar is the sum of glucose, fructose, and sucrose. *** A statistical difference at α = 0.001 according to t-test; ns, not significant.
Agriculture 14 00360 g004
Figure 5. Correlation analyses of summed leaf area with various saccharide contents in sweet corn hybrid seeds. All saccharide contents are expressed in gram per seed.
Agriculture 14 00360 g005
Figure 6. Daily maximum, minimum, and mean temperature during the field validation.
Agriculture 14 00360 g006
Figure 7. Cumulative emergence percentage of selected sweet corn hybrids. Error bars represent standard deviation.
Agriculture 14 00360 g007
Figure 8. Different growth responses of selected cultivars under low-temperature field conditions.
Agriculture 14 00360 g008
Table 1. Summary statistics of morphological traits under low-temperature condition.
n = 35Summed
Leaf Area (cm2)
SPADShoot Weight
(g plant−1)
Root Weight
(g plant−1)
Total Root Length (cm)
AVG ± STD29.5 ± 13.2928.5 ± 5.610.37 ± 0.190.3 ± 0.1534.3 ± 11.61
Max64.245.71.220.97103.6
Min7.60.40.040.040.36
C.V.45.1%19.7%51.4%50.0%33.8%
By endosperm type (AVG ± STD)
Shrunken (n = 29)26.7 ± 10.83 a29.1 ± 4.81 a0.33 ± 0.15 a0.27 ± 0.12 a32.8 ± 11.66 a
Sugary (n = 6)43.1 ± 17.67 b26.0 ± 9.01 a0.57 ± 0.26 b0.48 ± 0.16 b41.7 ± 10.18 b
Means followed by same letter within a column are not significantly different according to t-tests at p < 0.01.
Table 2. Analysis of variance to identify the effects of temperature, cultivar, and their interaction on summed leaf area, SPAD, shoot weight, root weight, and total root length.
Source of
Variation
dfSummed
Leaf Area (cm2)
SPADShoot Weight
(g plant−1)
Root Weight
(g plant−1)
Total Root
Length (cm)
Temperature (T)1ns***ns*ns
Replication5
Cultivar (C)34***************
T × C34************ns
Experiment error345
Total419
*, *** Significance at the 0.05 and 0.001 probability levels, respectively; ns = not significant.
Disclaimer/Publisher’s Note: The statements, opinions and data contained in all publications are solely those of the individual author(s) and contributor(s) and not of MDPI and/or the editor(s). MDPI and/or the editor(s) disclaim responsibility for any injury to people or property resulting from any ideas, methods, instructions or products referred to in the content.

