Abstract
The presence of microplastics in soil has become a significant global concern, posing a threat to environmental, agricultural, and human health. However, the use of various detection methods has led to significant discrepancies in the statistics reported for the abundance of soil microplastics across the available literature, resulting in poor comparability across the available literature. Studies have shown that plastic film residue is among the main primary sources of microplastics in farmland soils. Therefore, we manufactured and selected polyethylene microplastics (PE-MPs) from plastic film and combined them with soil samples after density separation treatment, forming a spiked test soil sample, which was subjected to density separation and extraction using a ZnCl2 solution. The experiment used visual inspection by stereo microscopy, micro-Fourier transform infrared spectroscopy, micro-Raman spectrometry, laser direct infrared imaging, and pyrolysis-gas chromatography–mass spectroscopy for the quantitative analysis of spiked soil. This study systematically assessed and compared these five common soil microplastic detection methods. The results revealed different quantitative detection accuracies across various particle size ranges. Micro-Fourier transform infrared spectroscopy showed a broader applicable particle size range (20–5000 μm) and higher detection rate (91%), while the detection range (>50 μm) and rate (70%) of visual inspection through stereo microscopy were lower. For the identification of microplastic morphology, laser direct infrared imaging performed better, whereas micro-Fourier transform infrared spectroscopy had the advantage in determining the types of polymers present over micro-Raman spectrometry. The advantages, disadvantages, and detection rates of the above five detection methods were clarified during the detection process. Considering these findings and similar studies, we suggest three combinations of the evaluated methods to optimize the detection of PE-MPs.
1. Introduction
Microplastics are defined as plastic particles that have a diameter of <5000 μm, which can be categorized as small (<1000 μm) or large (1000–5000 μm) []. Furthermore, microplastics can be categorized according to the particle shape, which includes fibers, fragments, and granules [,]. Microplastics are a newly emerging group of persistent pollutants affecting all regions and environments worldwide, resulting in significant attention from the scientific community []. The persistence and permeability of microplastics not only threaten soil fertility and crop safety, but their enrichment in the food chain may also pose potential hazards to human health []. However, the types and forms of microplastics vary considerably, and their combination with humus and other organic substances in the soil through adsorption will significantly affect the analysis results of microplastics []. Therefore, the quantitative analysis of microplastic volume or particle quantity in different environments has been a central research focus [,]. However, the limit of detection (the minimum microplastic particle size or minimum limit that can be quantitatively detected) and application scope (applicable microplastic particle size range or specific scenarios) of different detection methods have not been explicit in the analysis and identification of soil microplastics, with this lack of method standardization impeding the quantitative comparison of microplastics data from previous studies on different soil types [].
Plastic film mulching has been proven to provide significant agricultural advantages, increasing crop growth and yield []. However, with the increasing use of plastic films, residual film has gradually accumulated in farmland soils and the surrounding environment []. This has become an issue that requires more research attention [,]. Currently, the main type of mulch film used in farmland is low-density polyethylene [,]. Studies have found that microplastics in the soil of continuously mulched farmland mainly originated from the fragmentation of mulches [,]. Generally, the analysis of soil microplastics requires the initial separation and extraction of microplastic particles from the soil, followed by the detection and analysis of microplastics. At present, the main method used for microplastic extraction from soil is density separation, which employs the difference in density between soil and microplastics to achieve separation. The techniques commonly applied for the identification of microplastics can be classified as either particle-based or mass-based methods. Particle-based methods include direct observation, optical microscopy, and scanning electron microscopy [], while mass-based methods include Fourier transform infrared spectroscopy, Raman spectroscopy, thermal gravimetric analysis-Fourier transform infrared spectroscopy, and gas chromatography–mass spectrometry [,].
Selecting a suitable identification method for the rapid and accurate quantitative analysis of microplastics in soil remains a challenging aspect of research on soil microplastics. Previous studies have employed various methods to quantitatively determine the microplastic content of soils in different regions. For example, Zhang and Liu [] combined density separation and FTIR spectroscopy to quantify polyester microplastics ranging from 5 to 250 μm in soils from southwest China. The study has an emphasis on the detection and quantification of microplastics of smaller size fractions, and less attention is paid to larger microplastics exceeding the analytical scope. In another study, Zhou et al. [] imaged the microplastic morphology in soils using microscopy and scanning electron microscopy and found film microplastics were predominant. The study utilized a analytical approach combining two detection techniques, which led to more comprehensive and informative analytical findings. Furthermore, Qian et al. [] analyzed the abundance of microplastics in coastal beach soils from Shandong province (China), utilizing stereo microscopy, Fourier spectroscopy, and scanning electron microscopy to assess the morphology of collected microplastics. However, due to the differences in methods used in soil microplastics research for microplastic separation, sample treatment, and detection, with varying test parameters applied, it is difficult to directly compare data on the abundance of microplastics in different regions.
Based on the above research, to investigate the potential application scope and accuracy of quantitative methods for the identification and analysis of polyethylene microplastics (PE-MPs) in soil samples, five commonly applied methods were compared. The selected methods included visual inspection by stereo microscopy, micro-Fourier transform infrared spectroscopy, micro-Raman spectroscopy, laser direct infrared imaging, and pyrolysis–gas chromatography–mass spectroscopy.
2. Materials and Methods
2.1. Sample Preparation
2.1.1. Soil Collection and Pretreatment
The soil used in all experiments was obtained from irrigated farmland in the Seventh Regiment of Alar City (First Division of the Xinjiang Production and Construction Corps, Alar, China), and the soil parameters tested are presented in Table 1. To minimize background levels of PE-MPs in the sample soil, five sampling points were randomly selected at a depth of 70–90 cm below the soil surface of farmland that had not been exposed to plastic film mulching. At each sampling point, 500 g of soil was collected, for a total sampled amount of 2500 g. The soil from the five sampling points was thoroughly mixed to create a homogeneous composite sample for use in the experiments. Extraneous coarse particulate matter was removed manually, and the homogenized soil samples were stored in cloth bags and transported to the laboratory for further analysis. The soil samples were dried and crushed and then passed through a 2000 μm mesh sieve (Shaoxing Shangyu District Huafeng Hardware Instrument Co., Ltd., Shaoxing, China) to form a homogeneous sample.

Table 1.
Details of soil parameters tested.
To minimize background interference, the density separation method was employed for the removal of PE-MPs present in the homogenized sample soil. A 734.4 g sample of zinc chloride (ZnCl2, analytically pure, Sinopharm Chemical Reagent Co., Ltd., Beijing, China) was dissolved in 1 L deionized water, forming a ZnCl2 solution with a density of 1.53 g·cm−3. A 100 g sample of the standard soil was placed into a clean 250 mL beaker, to which the ZnCl2 solution was introduced and thoroughly stirred with a glass rod. The residual PE-MPs remaining on the glass rod were rinsed into the beaker using a 100 mL ZnCl2 solution. The beaker was placed in an opaque closed box and allowed to stand for 10 h at an average room temperature of 25 °C. After solid–liquid separation, the supernatant was collected and discarded. The soil sample in the beaker was dried for 12 h in a drying chamber at a constant temperature of 40 °C, and then 10 g of soil was measured using an electronic balance (JM-BL5003, Ningbo Jiming Weighing Equipment Co., Ltd., Ningbo, China) and placed into a clean 250 mL beaker. It should be noted that some zinc chloride may remain in the soil sample after density separation. Finally, three pretreated test soil samples with a mass of 10 g each were obtained after density separation. The 10 g soil sample size used is suitable for examining the recovery of spiked microplastics. The subsoil was selected for the study in order to minimize the interference of microplastic background values and more accurately simulate the detection of microplastics in the natural environment. In addition, the samples were treated by density separation, which could effectively avoid the interference of organic matter content between the subsoil and topsoil. It should also be noted that for environmental soil samples, it is necessary to collect a sufficiently large and representative sample, typically 50–100 g, to account for soil heterogeneity and ensure an accurate assessment of microplastic contamination levels [].
2.1.2. Preparation of Polyethylene Microplastics
The sample of PE-MPs was prepared using commercially available mulch made of polyethylene (PE) plastic (Shengshida Film Factory Co., Ltd., Aksu, China) (Table 2) that was subsequently spiked into the pretreated test soil. During the test, PE-MPs were categorized based on their longest dimension, which is commonly used as the representative particle size for irregularly shaped PE-MPs. The mulch was thoroughly washed and left to dry in the shade. The drying temperature was 25 °C, and the drying time was 48 h. The dried mulch film was crushed using a small low-temperature crusher (SM-3C, Taiwan Xiangtai Co., Ltd., Taipei, China), and the crushed PE-MPs were preliminarily screened using a 5000 μm screen installed on a vibrating screen (SYS, Xinxiang Lingang Machinery Equipment Co., Ltd., Xinxiang, China). A stereo microscope (TD-2KHU, Shenzhen Sanqiang TEDA Optical Instrument Co., Ltd., Shenzhen, China) was utilized to categorize the shape of PE-MPs into three types, fiber (with an aspect ratio of >5 and filament shape), fragment (with an aspect ratio of <5 and obvious edges), and granules (with an approximate aspect ratio of 1 and round or oval shape), as illustrated in the representative stereomicrographs in Figure 1. The size of individual PE-MPs was determined by using the measurement function built into the software of the stereo microscope.
Table 2.
Details of the parameters of the tested mulch film.
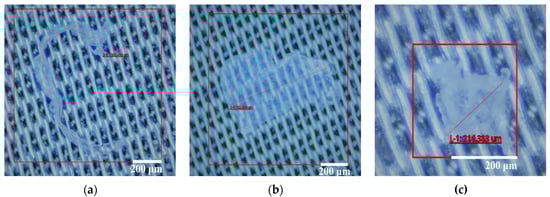
Figure 1.
Selection of different shapes of PE-MPs under a stereo microscope: (a) fiber microplastics; (b) fragment microplastics; (c) particle microplastics.
Eighty PE-MPs were counted for each group. A total of three groups of PE-MPs were obtained in this manner. Each group of PE-MPs was weighed with a precision balance (0.01 mg precision, QUINTIX35-1CN, Beijing Seidolis Scientific Instruments Co., Ltd., Beijing, China), showing that the masses of the three samples G1, G2, and G3 were 0.98 mg, 1.21 mg and 0.98 mg, respectively. The particle size and shape distribution for all three sample groups are shown in Figure 2. The proportion of PE-MPs with three different shapes in each group of samples is similar, with fibers accounting for 30–35%, granules accounting for 33–37%, and fragments accounting for 31–32%. The three particle size ranges are distributed between 100 and 5000 μm, and the detailed data are stored in Table S1 (Supplementary Material).
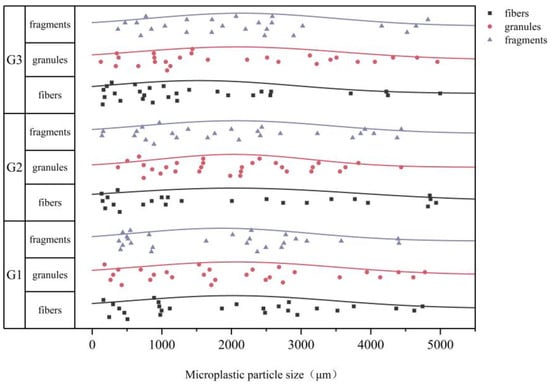
Figure 2.
Detailed distribution of particle sizes and shapes in spiked samples.
2.1.3. Test Sample Pretreatment
The PE-MPs were first mixed with 10 g of soil in a 250 mL beaker to prepare spiked samples. A 10 g sample of soil and about 1 mg of PE-MPs were selected to simulate a certain degree of the microplastic pollution level in agricultural field soils, conforming to the actual situation, and a 10 g soil sample was selected to facilitate subsequent experimental operations. The spiked sample was taken, the moisture content was controlled to be 20%, and it was incubated in an incubator with a constant temperature of 25 °C for 1 week, to simulate the interaction process between soil and microplastics in real agricultural field environments. Through incubation, microplastics come into full contact and combine with soil particles, forming aggregates that are closer to the natural state. These spiked samples were produced using a 200 mL ZnCl2 solution to dissociate PE-MPs from the soil matrix, and the extracted solution was filtered through a 1.3 μm 304 stainless steel filter (Shaoxing Shangyu Shengchao Instrument and Equipment Co., Ltd., Shaoxing, China) to collect PE-MPs. To remove organic impurities, the filtered samples underwent digestion in a 30% H2O2 solution (analytically pure, National Pharmaceutical Group Chemical Reagent Co., Ltd., Beijing, China) at 61 °C. Finally, the digested solution was transferred to a new beaker for standby. A detailed description of the experimental process is shown in Figure 3. Since the selected detection methods are based on different principles, the experiment adopted the recovery rate to horizontally compare the different detection methods. The recovery rate refers to the number (or mass) of PE-MPs identified by the method/the total number (or mass) of PE-MPs spiked into the sample. During the experiment, visual inspection by stereo microscopy, micro-Fourier transform infrared spectroscopy, micro-Raman spectrometry, and laser direct infrared imaging were used to detect the particle size and shape of PE-MPs. Micro-Fourier transform infrared spectroscopy, micro-Raman spectrometry, laser direct infrared imaging, and pyrolysis-gas chromatography–mass spectrometry were used to analyze the types of PE-MPs.
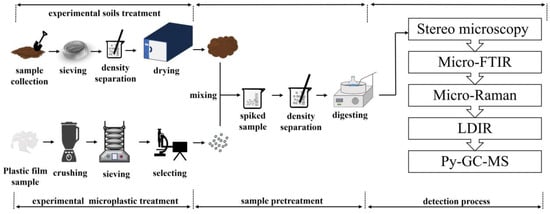
Figure 3.
Schematic diagram illustrating the sample preparation and test process.
2.2. Detection Methods
2.2.1. Visual Inspection by Stereo Microscopy
Visual inspection by stereo microscopy (visual inspection) (TD-2 KHU, Shenzhen Sanqiang TEDA Optical Instrument Co., Ltd., Shenzhen, China) was used to detect PE-MPs in the extracted solution. The specific method was as follows. The observation background of the stereo microscope was set to black for easy observation, and the measurement software of the calibration microscope was used to measure the particle size of microplastics. The microplastic solution was transferred to a glass slide using a glass syringe, and then the number, shape, and particle size of microplastics were observed by visual inspection and recorded. After observation, distilled water was used to wash the solution from the glass slide into a clean beaker. After each sample solution had been observed, the inner surfaces of the glass syringe and sample beaker were rinsed with distilled water using the stereo microscope to detect PE-MPs in the rinse solution, and the results were recorded. This process was repeated 2–3 times until no microplastic residues could be detected in the rinse solution. Finally, all solutions harboring microplastics were harvested for subsequent density separation and micro-FTIR detection.
2.2.2. Micro-Fourier Transform Infrared Spectroscopy
Micro-Fourier transform infrared spectroscopy (micro-FTIR) integrates optical microscopy with infrared spectrum analysis. The infrared spectrum of a specimen is acquired utilizing an infrared spectrometer, while the microstructure is examined by optical microscopy [,]. The harvested solution was concentrated via vacuum filtration (VP-15S Qunan Experimental Instrument Co., Ltd., Huzhou, China) onto an MCE filter membrane (0.45 μm, National Pharmaceutical Group Chemical Reagent Co., Ltd., Shanghai, China). Subsequently, the filter was positioned directly on the sample stage for full area scanning. The microscopic Fourier transform infrared spectrometer (Nicolet iS50, Thermo Fisher Scientific, Waltham, MA, USA) was operated in ATR mode (50× objective, 0.7 numerical aperture) across a wavenumber range of 6400 cm−1 to 200 cm−1, with 32 scans and a spectral resolution of 0.09 cm−1. Publicly available Polymer Additives and Polymers ATR-FTIR spectral libraries were utilized for matching, including the Polymer Additives and Plasticizers library, the Aldrich FT-IR Collection Edition, and other analogous spectral databases. A spectral match exceeding a 65% hit score was employed as the benchmark for reliable identification of the plastic type.
2.2.3. Micro-Raman Spectrometry
Micro-Raman spectrometry (micro-Raman) combines Raman spectroscopy with microscopic techniques, providing Raman spectroscopy that is complementary to Fourier spectroscopy [,]. The MCE filter membrane containing the sample after micro-FTIR detection was transferred to the micro-Raman for subsequent analysis. Samples were identified individually using a confocal laser Raman spectrometer (Dxr2x, Thermo Fisher Scientific, United States). Laser excitation was set to 532 nm, with a spectral acquisition range of 200–3700 cm−1, the band was 532 nm, the integration time was 5 s, and the laser intensity was set at 15% to protect samples from damage. The overall scanning area was determined by the microscope stage range, which was approximately 100 mm × 100 mm for the instrument used. The window was fully scanned to cover the entire distribution area of microplastics. The lateral and vertical resolution was limited by the microscope objective and laser spot size. A 50× long working distance objective was used, limiting the particle size to >1 μm. The characteristic peak identification of the spectrum is mainly accomplished through matching with the known spectrum in the standard library and using the spectral library search function in Omnic 9.8. The unknown spectrum is determined to contain the matching standard component when their spectrum matching degree is >0.65.
2.2.4. Laser Direct Infrared Imaging
The Laser direct infrared imaging (LDIR) was equipped with an adjustable QCL quantum cascade laser, which is more rapid than traditional infrared imaging technologies and has a tenfold increase in spatial resolution, reaching 1 μm []. The detection range of the LDIR for the particle size of microplastics is 20–500 μm. For microplastics beyond the particle size range, a stereo microscope was used for auxiliary detection. The MCE filter membrane was immersed in an ethanol solution, sonicated for 10 min, removed, and rinsed thoroughly. The combined ethanol solutions were further concentrated by evaporation and then dripped onto a glass slide and measured by LDIR after drying. The automated LDIR imaging system (8700 LDIR, Agilent Technologies, Santa Clara, CA, USA) was operated in particle analysis mode using the automatic test method, with a matching degree of >0.65 and a size range of 20–500 μm.
2.2.5. Pyrolysis–Gas Chromatography–Mass Spectroscopy
The pyrolysis–gas chromatography–mass spectroscopy system (Py-GC/MS) simultaneously combines gas chromatography and mass spectrometry []. This process is destructive to the sample, gradually increasing the temperature of the polymer in order to release short-chain small oligomers monomers and then passing the product fragments to the GC/MS to determine their mass–charge ratio and ultimately infer the polymer type [,]. The slides after LDIR detection were placed in absolute ethanol, and the microplastics were extracted by sonication, with the original extraction vial rinsed with ethanol absolute to ensure complete transfer of the sample. The microplastic extract was concentrated on a 0.2 μm Anodisc filter (6809–7023, Whatman, Maidstone, UK), and 50 μL of 0.1 μg/μL anthracene internal standard solution was added to the filter sample. After freeze-drying, it was examined by gas chromatography–mass spectrometry (7890B-5977A, Agilent Technologies, Santa Clara, CA, USA). A single-shot pyrolyzer (Frontier PY-3030D, Frontier Laboratories Ltd., Koriyama, Japan) was used. The temperature of the pyrolyzer was set to 600 °C, with a pyrolysis time of 0.2 min and an interface temperature of 300 °C. The gas chromatograph was equipped with an HP-5MS chromatographic column with a column length of 30 m, an inner diameter of 250 μm, and a film thickness of 0.25 μm. The initial temperature was set to 70 °C and then increased to 300 °C at a heating rate of 20 °C·min−1 and maintained for 10 min. The main pyrolysis products and their corresponding retention indices (RI) include n-Eicosane (RI = 1985), 2,4-Dimethylhept-1-ene (RI = 829), Benzene (RI = 685), ε-Caprolactam (RI = 1221), and other compounds. The system was operated in full scan mode, and the NIST library database was used for mass spectra identification. Standard solutions of different microplastic types were prepared at five concentration levels of 0.01 μg/μL, 0.1 μg/μL, 1 μg/μL, 10 μg/μL, and 50 μg/μL, and 50 μL of each standard solution was concentrated on a filter membrane for py-GC/MS analysis to determine the standard curve. The limits of quantification (LOQ) for the polymers analyzed were as follows: polyethylene, 0.5 μg; polypropylene, 1.2 μg; polyamide, 0.6 μg; polyvinyl chloride, 1.5 μg.
2.3. Quality Control and Data Analysis
During the process of soil collection and analysis, contact between samples and plastic equipment or surfaces was prevented at all times, with glass and metal equipment used during treatment. Furthermore, all sample collection containers were washed with an ethanol solution prior to use. Two controls were designed in this experiment: an environmental blank control and a method blank control. The environmental blank control was a clean conical flask, which was placed around the samples throughout the experiment to detect possible PE-MP interference from the ambient environment. The method of blank control was treated the same as the experimental from soil sampling to sample processing, with the only difference being that no PE-MPs were added during mixing.
For this study, Excel 2016 and SPSS Statistics v. 26 software were used to calculate the mean recovery rate (number of PE-MPs detected/number of PE-MPs added × 100%) and standard deviations, with results expressed as mean values ± standard deviation (n = 3). Charts were prepared using Origin 2022. Since the stereo microscopy visual inspection method relies on the inspector and cannot identify the MP material type, visual inspection by stereo microscopy was not included in the analysis of the MP material type. In addition, py-GC/MS could not provide information on the particle size or shape of MP and was not included in the analysis of MP size and shape.
3. Results and Discussion
3.1. Particle Size Identification and Recovery of Polyethylene Microplastics in Soil
The results of visual inspection, micro-FTIR, and micro-Raman are shown in Figure 4. For microplastic PE-MPs with particle sizes of 100–5000 μm, visual inspection by stereo microscopy showed the lowest recovery rate among all tested methods, at only 65%, with the observed error significantly increasing for smaller particle sizes. Recent studies also suggest that visual inspection can only detect larger PE-MPs (>500 μm), while smaller particles are likely underestimated [,,]. Overall, visual inspection is limited by the experience of the researchers and can be highly subjective. In contrast, the highest recovery rate was obtained using micro-FTIR, achieving a PE-MP recovery rate of 85 ± 4%, followed by 77 ± 5% using LDIR (100–500 μm) and 75 ± 6% using the micro-Raman technique. At the same time, the recovery rate of py-GC/MS was 86 ± 1% by mass determination (PE-MPs recovered/the mass of spiked PE-MPs). Based on the detection process of all five methods, the results showed that the accurate PE-MP detection range for visual inspection by stereo microscopy was particles > 50 μm, while for micro-FTIR, it was particle sizes > 20 μm; for micro-Raman, it was particle sizes of >1 μm and for LDIR, it was particle sizes ranging from 20–500 μm. The PE-MPs detection limit of py-GC/MS was 0.5 μg. Figure 5 shows the recommended optimal particle size range for PE-MPs for different test methods using the same spiked soil sample and pretreatment conditions.
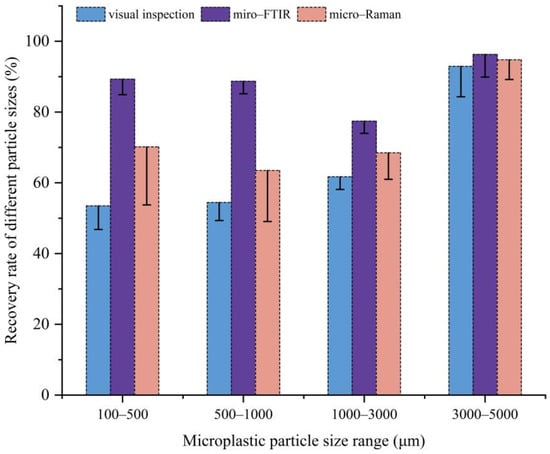
Figure 4.
Comparative recovery rates of polyethylene microplastics across the 100–5000 μm size range by the visual inspection, micro-FTIR, and micro-Raman methods.
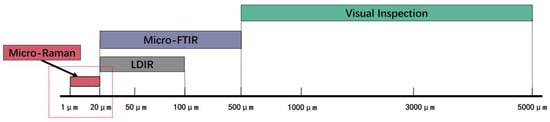
Figure 5.
Advantageous particle size ranges of different microplastic detection methods.
The PE-MPs added during sample preparation ranged from 100 to 5000 μm. However, particles in the size range of 1–100 μm were also detected in the samples. Microplastics of small dimensions can be translocated below the plow layer through various mechanisms, including water flow from irrigation and bioturbation. The MPs ranging in size from 1 to 100 μm in samples can be attributed to incomplete removal during density separation in the sample preparation process, as well as the fragmentation of larger PE-MPs due to mechanical forces exerted during sample processing. The numbers of 1–100 μm particles detected by each method are shown in Table 3. LDIR achieved the highest detection rate for 20–100 μm PE-MPs, while micro-Raman produced the highest count for PE-MPs smaller than 20 μm.
Table 3.
Detection results of different detection methods in the microplastic particle size range of 1–100 μm.
3.2. Soil Polyethylene Microplastic Shape Recognition
Despite previous studies having shown that fiber particles are the most common form of PE-MPs, spherical PE-MP standards are generally used experimentally to determine the PE-MP recognition rate of a method []. The length of PE-MP fibers in the soil ranges from 2000 to 5000 μm, although the width of these fibers is typically between 5 and 30 μm []. This variation in the shape of PE-MPs will undoubtedly affect their separation and detection [,]. Furthermore, PE-MP particles that cannot be classified as either fiber, fragment, or granule shape are considered to have an irregular shape. The recognition performance of all four tested methods for the identification of different soil PE-MPs shape is shown in Figure 6.
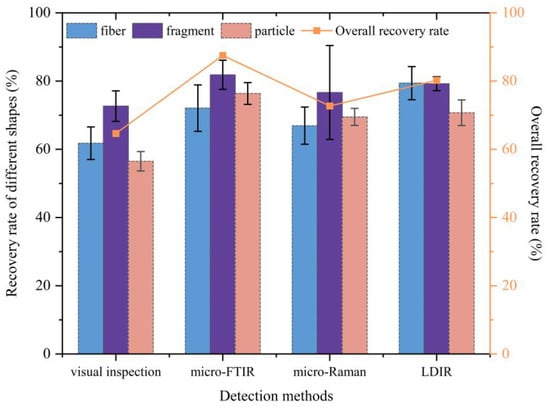
Figure 6.
Recovery rates of polyethylene microplastics by shape using the visual inspection, micro-FTIR, micro-Raman, and LDIR detection methods (the bar chart shows the recovery rate for different shapes, and the line chart shows the overall recovery rate for different methods).
Among the five detection methods involved in the test, GC/MS was not discussed further as it cannot provide information on the particle size or shape. In Figure 6, the recovery rate of different shapes on the left axis represents the number of microplastics of this shape that were actually detected divided by the number of microplastics of this shape added to the sample; the right axis represents the overall recovery rate for PE-MPs for each detection method. Results showed that the recovery rates of all other methods were low for fibers, ranging from 57% (visual inspection) to 84% (LDIR). In contrast, the recovery rate of fragment PE-MPs was slightly higher overall, ranging from 68% and 88%. Combining the recoveries of all methods, the results show that the recovery rate of LDIR is slightly higher for different shapes and can quickly distinguish different PE-MP shapes. Although there are some numerical differences in the rate of microplastic recovery, statistical analysis shows that these differences between detection methods and shape types are not significant (p > 0.05). During the process of PE-MP detection by LDIR, the detection software interface allows the length and width of PE-MPs to be rapidly determined, along with detailed spectral information. Using this approach, PE-MP contours can be accurately demarcated and shape identified, even when PE-MPs partially overlap (Figure 7).
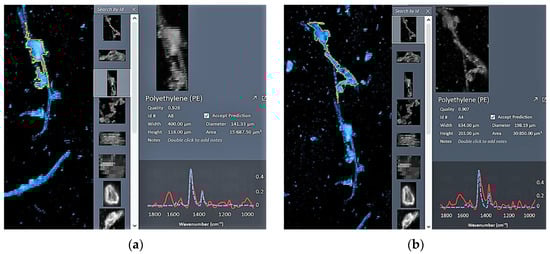
Figure 7.
LDIR recognition process of microplastic shape at the same location (example of connected microplastic particles (a,b) showcasing partially overlapping microplastics in the same region).
3.3. Other Microplastics Detected during Analysis
During the quantitative analysis of microplastics, it is important to determine the microplastic material type. The organic compounds present in samples other than polyethylene were determined by different identification methods. The environmental blank was quantitatively analyzed by py-GC/MS, and the microplastics did not reach the detection limit; therefore, the contamination of the microplastics during the test was ruled out. As shown in Figure 8, the masses of different microplastic classes are used for uniform comparison of the detection methods used in the test, and for particle-based detection methods such as LDIR, the mass is calculated using the area of the particle [].
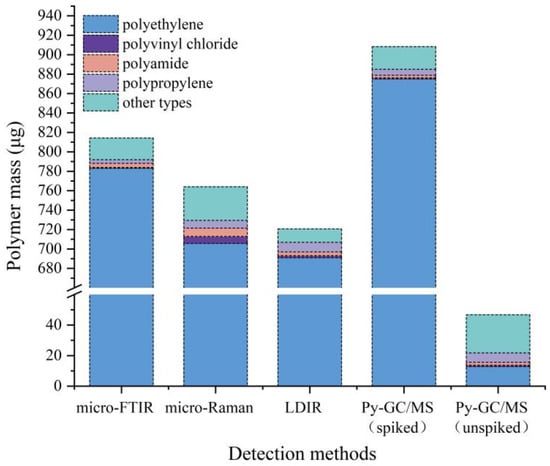
Figure 8.
Polymer mass recovery for different types of microplastics (except for polyethylene) in G1, G2, G3 samples using micro-FTIR, micro-Raman, LDIR, and Py-GC-MS methods.
In this study, the presence of other microplastic material types was considered to be due to background microplastics remaining in the soil after density separation and purification or impurities contained in the polyethylene mulching film sample. In order to compare the detection results of different detection methods, the detection results of other types of microplastics except polyethylene in the three samples are shown in Figure 9. The main types of microplastics detected in the samples were polyethylene, polyvinyl chloride, polyamide, and polypropylene, and the other types of microplastics besides these were below the LOQ and could not be accurately measured. Their possible routes into farmland are as follows. Polyvinyl chloride is widely used for the production of various packaging materials, irrigation pipes, and agricultural films, resulting in the common detection of polyvinyl chloride soil microplastics. Polyamide is used in the production of nylon, industrial cloth, knitwear, fertilizer, and agricultural production, resulting in it being one of the main sources of soil microplastics. Polypropylene is widely used for various forms of agricultural products, including agricultural tools, equipment, and packaging [].
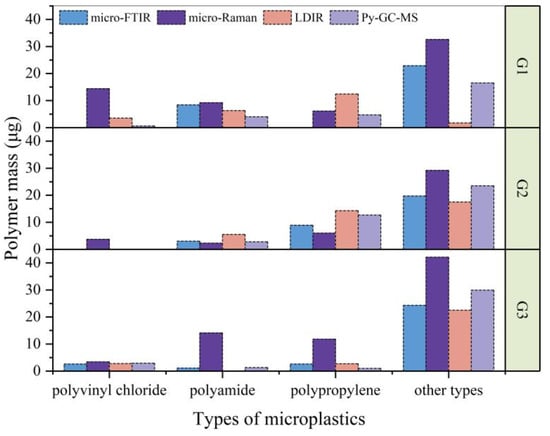
Figure 9.
Polymer mass recovery of different types of microplastics using micro-FTIR, micro-Raman, LDIR, and Py-GC-MS with controlled Py-GC-MS analysis for unspiked samples.
Using the results of py-GC/MS analysis as a reference, a comparison of all data allowed the following conclusions to be drawn. Among all the spectral methods tested, micro-Raman has the greatest difference between the reference results obtained. The detection results can be affected by organic compounds present in the soil. Raman spectrometry collects extraneous information, including electrical noise, sample background, and stray light [], which is not useful for microplastic analysis. Complex soil conditions and variable test parameters can introduce interference peaks in Raman spectra, requiring adjustments based on the specific application. In contrast, the results showed that micro-FTIR achieved the closest results to the reference results in the determination of microplastic material types as compared with micro-Raman and LDIR analysis.
3.4. Comprehensive Comparison of Different Microplastic Detection Methods
The detection rate refers to the number (or mass) of PE-MPs identified by the method divided by the number (or mass) of PE-MPs obtained after density separation. The separation efficiency of the density separation method for soil pretreatment was determined to be 93 ± 2% through preliminary experiments in this study. This is consistent with previous studies [,] and was deemed adequate for accurately calculating the detection capabilities of various microplastic analytical methods used in this work. Since all methods detected microplastics in the same soil samples and particle size and shape distributions were relatively consistent across methods, the use of the same samples helps mitigate potential bias caused by inherent variations in the microplastics. Based on the experimental results and error transfer formula (, where Ed means the error of detection rate, Er means the error of recovery rate, and Es means the error of density separation), the detection rates of stereo microscopy visual inspection, micro-FTIR, micro-Raman, LDIR, and Py-GC/MS analysis were 70 ± 6%, 91 ± 5%, 79 ± 7%, 79 ± 6% and 93 ± 3%, respectively, while the detection rates and trends of different detection methods are consistent with related studies [,]. Table 4 provides a comprehensive overview of the detection accuracy, advantages, and disadvantages of all five compared detection methods.
Table 4.
Minimum limit of quantitative detection and advantages and disadvantages of different detection methods for PE-MPs.
In recent studies, the combination of visual inspection and micro-FTIR has been commonly used for the detection and quantification of microplastics. The results achieved by these two methods can be compared with each other. However, combinations of other analytical methods have been gradually becoming more frequently used. For example, Krekelbergh et al. [] used a combination of fluorescence microscopy and Raman spectroscopy to directly visualize 1–2 μm fluorescently labeled microplastics in soil. Furthermore, the study by Jia et al. [] demonstrates the advantages of combining laser direct infrared imaging technology (LDIR) with FTIR. LDIR can quickly identify the physical morphology of microplastics, while FTIR provides accurate information about the composition of microplastics. The combination of the two not only improves the detection accuracy but also expands the detection capability, making the qualitative and quantitative analysis of microplastics more comprehensive. This study provides strong support for similar combination detection schemes proposed in this article. The work of Cheng et al. [] validated the superiority of LDIR over FTIR in detection efficiency. LDIR can quickly complete imaging analysis of large-area samples, saving a lot of time. This feature makes LDIR more suitable for rapid initial screening and large-scale sample detection, which cannot be compared to FTIR. According to the characteristics of soil microplastics, the available literature, and the results of this analysis, three different detection methods can be proposed for the analysis of farmland soil microplastics under different scenarios.
(1) Visual inspection by stereo microscopy combined with micro-Fourier transform infrared spectroscopy: this approach allows the rapid and non-destructive detection of soil microplastics, providing a simple and economical method for the accurate detection of soil microplastics, which is suitable for the initial inspection of microplastics with particle sizes > 50 μm.
(2) Laser direct infrared imaging combined with micro-Fourier transform infrared spectroscopy: this approach can accurately establish the abundance, particle size, shape, and material type of soil microplastics, with applicability over a wide particle size range of >20 μm.
(3) Pyrolysis–gas chromatography combined with laser direct infrared imaging: this approach has the highest accuracy for the determination of soil microplastic abundance and composition. Thermal cracking can be used to accurately establish the molecular composition of microplastics, while laser direct infrared imaging clearly displays the size and shape of microplastics. This approach is applicable to the analysis of small microplastic particles (>10 μm) and provides high-accuracy data, although it has a high cost and requires complex operational procedures.
4. Conclusions
This study systematically evaluated and compared five common soil microplastic detection methods, including visual inspection by stereo microscopy, micro-Fourier transform infrared spectroscopy, micro-Raman spectrometry, laser direct infrared imaging, and pyrolysis–gas chromatography–mass spectrometry. The results showed that these methods differed in quantitative detection accuracy across various particle size ranges. Among them, micro-Fourier transform infrared spectroscopy demonstrated a wider applicable particle size range (20–5000 μm) and a higher detection rate (91%), while visual inspection by stereo microscopy had a narrower detection range (>50 μm) and a lower detection rate (70%). To identify microplastic shapes, laser direct infrared imaging performed better, and to determine polymer types, micro-Fourier transform infrared spectroscopy was superior to micro-Raman spectroscopy.
The innovation of the research is that based on the detection performance of each method, three combined detection schemes are proposed, which effectively overcome the shortcomings of a single method and can realize the quantitative analysis of soil microplastics in several different scenarios: rapid primary screening, morphological characterization, and accurate component analysis. Visual inspection was integrated with micro-FTIR for swift and cost-efficient detection, LDIR was conjoined with micro-FTIR for in-depth characterization, and py-GC/MS was amalgamated with LDIR for high-precision compositional analysis. The above three combinations can cover most of the common microplastic particle size ranges and complete the qualitative and quantitative analysis of microplastics in a comprehensive and efficient manner.
Although this study focused on polyethylene (PE) microplastics, the established detection techniques and analytical procedures share many commonalities with other plastic types in terms of sample preparation, detection process, microplastic morphological characteristics, and spectral features. Based on these commonalities, after appropriate optimization and adjustment, the detection methods evaluated in this study can be completely extended and applied to the identification and quantitative analysis of other microplastic types present in soil. More importantly, the research results have established a reference for standardized detection, which helps to explain and standardize microplastic data generated using different analytical techniques, improving the comparability of detection results.
Supplementary Materials
The following supporting information can be downloaded at https://www.mdpi.com/article/10.3390/agriculture14040554/s1. Table S1: Details of spiked microplastics in test samples.
Author Contributions
Analysis, Z.W., X.W. and C.H.; Writing, Z.W. and X.W.; Investigation Z.W., Y.Z., and J.X.; Conceptualization, project administration, resources, and supervision, L.W., T.G., and X.H.; Conceptualization, project administration, resources, funding acquisition, supervision, and writing review/editing, C.H. and X.W. All authors have read and agreed to the published version of the manuscript.
Funding
This work was funded by the Bintuan Science and Technology Program (Can Hu, Grant No. 2021CB010), the National Natural Science Foundation of China (Can Hu, grant number 32060288), the National Natural Science Foundation of China (Xufeng Wang, grant number 32160300), Joint scientific research fund project of Nanjing Agricultural University and Tarim University (Can Hu, Grant No. NNLH202201), and Tarim University Graduate Student Innovation Project “Study on the Effect of Soil Microplastics on Cotton Root Growth” (Zaibin Wang, Grant No. TDGRI202245). The authors sincerely thank all the above-listed funding agencies for their generous support enabling this research.
Institutional Review Board Statement
Not applicable.
Data Availability Statement
The data that support the findings of this study are available from the corresponding author upon reasonable request.
Acknowledgments
The authors would like to thank Master Zhang of Tarim University for helpful discussions on topics related to this work.
Conflicts of Interest
The authors declare that they have no known competing financial interests or personal relationships that could have appeared to influence the work reported in this paper.
References
- Qi, R.; Jones, D.; Li, Z.; Liu, Q.; Yan, C. Behavior of Microplastics and Plastic Film Residues in the Soil Environment: A Critical Review. Sci. Total Environ. 2020, 703, 134722. [Google Scholar] [CrossRef] [PubMed]
- Hartmann, N.B.; Hüffer, T.; Thompson, R.C.; Hassellöv, M.; Verschoor, A.; Daugaard, A.E.; Rist, S.; Karlsson, T.; Brennholt, N.; Cole, M.; et al. Are We Speaking the Same Language? Recommendations for a Definition and Categorization Framework for Plastic Debris. Environ. Sci. Technol. 2019, 53, 1039–1047. [Google Scholar] [CrossRef] [PubMed]
- Qi, R. Characteristics and Ecological Effects of Soil Microplastics in Typical Film Mulching Areas of China. Ph.D. Thesis, Chinese Academy of Agricultural Sciences, Beijing, China, 2021. [Google Scholar]
- Zhang, B.; Yang, X.; Chen, L.; Chao, J.; Teng, J.; Wang, Q. Microplastics in Soils: A Review of Possible Sources, Analytical Methods and Ecological Impacts. J. Chem. Technol. Biotechnol. 2020, 95, 2052–2068. [Google Scholar] [CrossRef]
- Mahmud, A.; Wasif, M.M.; Roy, H.; Mehnaz, F.; Ahmed, T.; Pervez, M.N.; Naddeo, V.; Islam, M.S. Aquatic Microplastic Pollution Control Strategies: Sustainable Degradation Techniques, Resource Recovery, and Recommendations for Bangladesh. Water 2022, 14, 3968. [Google Scholar] [CrossRef]
- Lu, Y.; Zhou, J.; Yang, Y.; Zang, H.; Hu, Y.; Zeng, Z. The impact of microplastics on farmland ecosystems: Research status and prospects. Chin. J. Eco-Agric. 2022, 30, 1–14. [Google Scholar] [CrossRef]
- Miller, E.; Sedlak, M.; Lin, D.; Box, C.; Holleman, C.; Rochman, C.M.; Sutton, R. Recommended Best Practices for Collecting, Analyzing, and Reporting Microplastics in Environmental Media: Lessons Learned from Comprehensive Monitoring of San Francisco Bay. J. Hazard. Mater. 2021, 409, 124770. [Google Scholar] [CrossRef] [PubMed]
- Prata, J.C.; da Costa, J.P.; Duarte, A.C.; Rocha-Santos, T. Methods for Sampling and Detection of Microplastics in Water and Sediment: A Critical Review. Trac. Trends. Anal. Chem. 2019, 110, 150–159. [Google Scholar] [CrossRef]
- Junhao, C.; Xining, Z.; Xiaodong, G.; Li, Z.; Qi, H.; Siddique, K.H.M. Extraction and Identification Methods of Microplastics and Nanoplastics in Agricultural Soil: A Review. J. Environ. Manag. 2021, 294, 112997. [Google Scholar] [CrossRef] [PubMed]
- Li, F.-M.; Song, Q.-H.; Jjemba, P.K.; Shi, Y.-C. Dynamics of Soil Microbial Biomass C and Soil Fertility in Cropland Mulched with Plastic Film in a Semiarid Agro-Ecosystem. Soil. Biol. Biochem. 2004, 36, 1893–1902. [Google Scholar] [CrossRef]
- Rochman, C.M.; Brookson, C.; Bikker, J.; Djuric, N.; Earn, A.; Bucci, K.; Athey, S.; Huntington, A.; McIlwraith, H.; Munno, K.; et al. Rethinking Microplastics as a Diverse Contaminant Suite. Environ. Toxicol. Chem. 2019, 38, 703–711. [Google Scholar] [CrossRef]
- He, G.; Wang, Z.; Li, S.; Malhi, S.S. Plastic Mulch: Tradeoffs between Productivity and Greenhouse Gas Emissions. J. Clean. Prod. 2018, 172, 1311–1318. [Google Scholar] [CrossRef]
- Steinmetz, Z.; Wollmann, C.; Schaefer, M.; Buchmann, C.; David, J.; Tröger, J.; Muñoz, K.; Frör, O.; Schaumann, G.E. Plastic Mulching in Agriculture. Trading Short-Term Agronomic Benefits for Long-Term Soil Degradation? Sci. Total Environ. 2016, 550, 690–705. [Google Scholar] [CrossRef] [PubMed]
- Steinmetz, Z.; Löffler, P.; Eichhöfer, S.; David, J.; Muñoz, K.; Schaumann, G.E. Are Agricultural Plastic Covers a Source of Plastic Debris in Soil? A First Screening Study. SOIL Discuss. 2022; 8, 31–47. [Google Scholar] [CrossRef]
- Xu, Z.; Hu, C.; Wang, X.; Wang, L.; Xing, J.; He, X.; Wang, Z.; Zhao, P. Distribution Characteristics of Plastic Film Residue in Long-Term Mulched Farmland Soil. Soil. Ecol. Lett. 2023, 5, 220144. [Google Scholar] [CrossRef]
- Li, S. Macro- and Micro-Plastic Accumulation in Soil after the Use of Traditional and Biodegradable Film Mulch. Master’s Thesis, Shenyang Agricultural University, Shenyang, China, 2022. [Google Scholar]
- Wang, Z.-M.; Wagner, J.; Ghosal, S.; Bedi, G.; Wall, T. distribution of microplastics in soil aggregate fractions SEM/EDS and Optical Microscopy Analyses of Microplastics in Ocean Trawl and Fish Guts. Sci. Total Environ. 2017, 603–604, 616–626. [Google Scholar] [CrossRef] [PubMed]
- Shim, W.J.; Hong, S.H.; Eo, S.E. Identification Methods in Microplastic Analysis: A Review. Anal. Methods 2017, 9, 1384–1391. [Google Scholar] [CrossRef]
- He, Y. Research on Detection Methods of Microplastics. Master’s Thesis, Beijing University of Chemical Technology, Beijing, China, 2021. [Google Scholar]
- Zhang, G.S.; Liu, Y.F. The Distribution of Microplastics in Soil Aggregate Fractions in Southwestern China. Sci. Total Environ. 2018, 642, 12–20. [Google Scholar] [CrossRef] [PubMed]
- Zhou, Q.; Tu, C.; Fu, C.; Li, Y.; Zhang, H.; Xiong, K.; Zhao, X.; Li, L.; Waniek, J.J.; Luo, Y. Characteristics and Distribution of Microplastics in the Coastal Mangrove Sediments of China. Sci. Total Environ. 2020, 703, 134807. [Google Scholar] [CrossRef] [PubMed]
- Zhou, Q.; Zhang, H.; Fu, C.; Zhou, Y.; Dai, Z.; Li, Y.; Tu, C.; Luo, Y. The Distribution and Morphology of Microplastics in Coastal Soils Adjacent to the Bohai Sea and the Yellow Sea. Geoderma 2018, 322, 201–208. [Google Scholar] [CrossRef]
- Zhang, F.; Yang, X.; Zhang, Z. Effects of Soil Properties and Land Use Patterns on the Distribution of Microplastics: A Case Study in Southwest China. J. Environ. Manag. 2024, 356, 120598. [Google Scholar] [CrossRef]
- Chen, Y.; Wen, D.; Pei, J.; Fei, Y.; Ouyang, D.; Zhang, H.; Luo, Y. Identification and Quantification of Microplastics Using Fourier-Transform Infrared Spectroscopy: Current Status and Future Prospects. Curr. Opin. Environ. Sci. Health 2020, 18, 14–19. [Google Scholar] [CrossRef]
- De Frond, H.; Rubinovitz, R.; Rochman, C.M. μATR-FTIR Spectral Libraries of Plastic Particles (FLOPP and FLOPP-e) for the Analysis of Microplastics. Anal. Chem. 2021, 93, 15878–15885. [Google Scholar] [CrossRef] [PubMed]
- Krekelbergh, N.; Li, J.; Hu, J.; Sleutel, S.; Parakhonskiy, B.; Skirtach, A.; Neve, S.D. Fluorescence Microscopy versus Raman Spectroscopy for Direct Identification of Small (<2 mm) Microplastics in Soils. arXiv 2022. [Google Scholar] [CrossRef]
- Xu, G.; Cheng, H.; Jones, R.; Feng, Y.; Gong, K.; Li, K.; Fang, X.; Tahir, M.A.; Valev, V.K.; Zhang, L. Surface-Enhanced Raman Spectroscopy Facilitates the Detection of Microplastics < 1 Μm in the Environment. Environ. Sci. Technol. 2020, 54, 15594–15603. [Google Scholar] [CrossRef] [PubMed]
- Jia, W.; Karapetrova, A.; Zhang, M.; Xu, L.; Li, K.; Huang, M.; Wang, J.; Huang, Y. Automated Identification and Quantification of Invisible Microplastics in Agricultural Soils. Sci. Total Environ. 2022, 844, 156853. [Google Scholar] [CrossRef] [PubMed]
- Lou, F.; Wang, J.; Sun, C.; Song, J.; Wang, W.; Pan, Y.; Huang, Q.; Yan, J. Influence of Interaction on Accuracy of Quantification of Mixed Microplastics Using Py-GC/MS. J. Environ. Chem. Eng. 2022, 10, 108012. [Google Scholar] [CrossRef]
- Peñalver, R.; Arroyo-Manzanares, N.; López-García, I.; Hernández-Córdoba, M. An Overview of Microplastics Characterization by Thermal Analysis. Chemosphere 2020, 242, 125170. [Google Scholar] [CrossRef]
- Picó, Y.; Barceló, D. Pyrolysis Gas Chromatography-Mass Spectrometry in Environmental Analysis: Focus on Organic Matter and Microplastics. Trac. Trends Anal. Chem. 2020, 130, 115964. [Google Scholar] [CrossRef]
- Maes, T.; Jessop, R.; Wellner, N.; Haupt, K.; Mayes, A.G. A Rapid-Screening Approach to Detect and Quantify Microplastics Based on Fluorescent Tagging with Nile Red. Sci. Rep. 2017, 7, 44501. [Google Scholar] [CrossRef]
- Prata, J.C.; Silva, A.L.P.; Da Costa, J.P.; Mouneyrac, C.; Walker, T.R.; Duarte, A.C.; Rocha-Santos, T. Solutions and Integrated Strategies for the Control and Mitigation of Plastic and Microplastic Pollution. IJERPH 2019, 16, 2411. [Google Scholar] [CrossRef]
- Prata, J.C.; Reis, V.; da Costa, J.P.; Mouneyrac, C.; Duarte, A.C.; Rocha-Santos, T. Contamination Issues as a Challenge in Quality Control and Quality Assurance in Microplastics Analytics. J. Hazard. Mater. 2021, 403, 123660. [Google Scholar] [CrossRef]
- Liu, M.; Lu, S.; Song, Y.; Lei, L.; Hu, J.; Lv, W.; Zhou, W.; Cao, C.; Shi, H.; Yang, X.; et al. Microplastic and Mesoplastic Pollution in Farmland Soils in Suburbs of Shanghai, China. Environ. Pollut. 2018, 242, 855–862. [Google Scholar] [CrossRef] [PubMed]
- Anger, P.M.; von der Esch, E.; Baumann, T.; Elsner, M.; Niessner, R.; Ivleva, N.P. Raman Microspectroscopy as a Tool for Microplastic Particle Analysis. TrAC Trends. Anal. Chem. 2018, 109, 214–226. [Google Scholar] [CrossRef]
- Cai, L.; Wang, J.; Peng, J.; Wu, Z.; Tan, X. Observation of the Degradation of Three Types of Plastic Pellets Exposed to UV Irradiation in Three Different Environments. Sci. Total Environ. 2018, 628–629, 740–747. [Google Scholar] [CrossRef] [PubMed]
- Primpke, S.; Fischer, M.; Lorenz, C.; Gerdts, G.; Scholz-Böttcher, B.M. Comparison of Pyrolysis Gas Chromatography/Mass Spectrometry and Hyperspectral FTIR Imaging Spectroscopy for the Analysis of Microplastics. Anal. Bioanal. Chem. 2020, 412, 8283–8298. [Google Scholar] [CrossRef] [PubMed]
- Sa’adu, I.; Farsang, A. Plastic Contamination in Agricultural Soils: A Review. Environ. Sci. Eur. 2023, 35, 13. [Google Scholar] [CrossRef]
- Schuhmann, W.; Öhl, D.; Morales, D.M. Operando Electrochemical Raman Spectroscopy. In Springer Handbook of Advanced Catalyst Characterization; Wachs, I.E., Bañares, M.A., Eds.; Springer Handbook; Springer International Publishing: Cham, Switzerland, 2023; pp. 189–211. ISBN 978-3-031-07125-6. [Google Scholar]
- Nabi, I.; Bacha, A.-U.-R.; Zhang, L. A Review on Microplastics Separation Techniques from Environmental Media. J. Clean. Prod. 2022, 337, 130458. [Google Scholar] [CrossRef]
- Rodrigues, M.O.; Gonçalves, A.M.M.; Gonçalves, F.J.M.; Abrantes, N. Improving Cost-Efficiency for MPs Density Separation by Zinc Chloride Reuse. MethodsX 2020, 7, 100785. [Google Scholar] [CrossRef] [PubMed]
- Schymanski, D.; Goldbeck, C.; Humpf, H.-U.; Fürst, P. Analysis of Microplastics in Water by Micro-Raman Spectroscopy: Release of Plastic Particles from Different Packaging into Mineral Water. Water Res. 2018, 129, 154–162. [Google Scholar] [CrossRef]
- Yang, S.; Feng, W.; Cai, Z.; Wang, Q. Study on Rapid Recognition of Marine Microplastics Based on Raman Spectroscopy. Spectrosc. Spectr. Anal. 2021, 41, 2469–2473. [Google Scholar] [CrossRef]
- Song, Y.K.; Hong, S.H.; Eo, S.; Shim, W.J. A Comparison of Spectroscopic Analysis Methods for Microplastics: Manual, Semi-Automated, and Automated Fourier Transform Infrared and Raman Techniques. Mar. Pollut. Bull. 2021, 173, 113101. [Google Scholar] [CrossRef]
- Cabernard, L.; Roscher, L.; Lorenz, C.; Gerdts, G.; Primpke, S. Comparison of Raman and Fourier Transform Infrared Spectroscopy for the Quantification of Microplastics in the Aquatic Environment. Environ. Sci. Technol. 2018, 52, 13279–13288. [Google Scholar] [CrossRef] [PubMed]
- Wang, S.; Chen, H.; Zhou, X.; Tian, Y.; Lin, C.; Wang, W.; Zhou, K.; Zhang, Y.; Lin, H. Microplastic Abundance, Distribution and Composition in the Mid-West Pacific Ocean. Environ. Pollut. 2020, 264, 114125. [Google Scholar] [CrossRef] [PubMed]
- Cheng, Y.-L.; Zhang, R.; Tisinger, L.; Cali, S.; Yu, Z.; Chen, H.Y.; Li, A. Characterization of Microplastics in Sediment Using Stereomicroscopy and Laser Direct Infrared (LDIR) Spectroscopy. Gondwana Res. 2022, 108, 22–30. [Google Scholar] [CrossRef]
- Käppler, A.; Fischer, M.; Scholz-Böttcher, B.M.; Oberbeckmann, S.; Labrenz, M.; Fischer, D.; Eichhorn, K.-J.; Voit, B. Comparison of μ-ATR-FTIR Spectroscopy and Py-GCMS as Identification Tools for Microplastic Particles and Fibers Isolated from River Sediments. Anal. Bioanal. Chem. 2018, 410, 5313–5327. [Google Scholar] [CrossRef] [PubMed]
Disclaimer/Publisher’s Note: The statements, opinions and data contained in all publications are solely those of the individual author(s) and contributor(s) and not of MDPI and/or the editor(s). MDPI and/or the editor(s) disclaim responsibility for any injury to people or property resulting from any ideas, methods, instructions or products referred to in the content. |
© 2024 by the authors. Licensee MDPI, Basel, Switzerland. This article is an open access article distributed under the terms and conditions of the Creative Commons Attribution (CC BY) license (https://creativecommons.org/licenses/by/4.0/).