Article

Multiple Soil Health Assessment Methods for Evaluating Effects of Organic Fertilization in Farmland Soil of Agro-Pastoral Ecotone

1
College of Agronomy and Biotechnology, China Agricultural University, Beijing 100193, China
2
Key Laboratory of Farming System, Ministry of Agriculture and Rural Affairs of China, Beijing 100193, China
*
Author to whom correspondence should be addressed.
Agriculture 2024, 14(4), 572; https://doi.org/10.3390/agriculture14040572
Submission received: 29 February 2024 / Revised: 22 March 2024 / Accepted: 27 March 2024 / Published: 3 April 2024
(This article belongs to the Section Agricultural Soils)

Abstract

:
The incorporation of organic fertilizer is an important practice to improve the sustainability and productivity of crop production and decrease environmental pollution from crop-livestock systems in global agriculture. However, establishing an evaluation dataset is still the main challenge for quickly and effectively assessing the effect of management measures on farmland soil health. Hereby, we developed a minimum dataset (MDS) using three methods (network analysis (NA), random forest analysis (RF), and principal component analysis (PCA)). Based on MDS and two scoring functions (nonlinear (NL) and linear scoring curve (L)), the SHI (soil health index framework) was constructed to assess soil health conditions under four fertilization treatments (no fertilization, CK; only chemical fertilizer, NPK; only cow manure, MF; 50% chemical fertilizer + 50% cow manure, NPKM) in the northern ecotone of China. The results showed that the MDS-based on SHIs were positively correlated with each other and SHI-TDS (total dataset), verifying the consistency of soil health assessment models. Higher R2 was observed in the fitting of SHIs based on NA and TDS, which suggested that nMDS (minimum dataset based on network analysis) could represent most of the information in the TDS. The SHI-NL-nMDS (based on network analysis and nonlinear scoring curve) has the highest ability of sensitivity and accuracy, which indicates that compared with PCA and RF, the SHI based on NA can better embody farmland sol ecosystem functions. In addition, crop yield was significantly positive relative to SHI (soil health index). The incorporation of cow manure and chemical fertilizer improved soil health and increased crop yield. These results indicate that network analysis was a reliable technology for determining the minimum dataset in the evaluation of farmland soil health, and incorporating livestock manure could improve soil health and crop yield in this study area.

Graphical Abstract

1. Introduction

Soil health refers to the ability of soil to function as a living ecosystem within land-use boundaries, promote plant and animal health, improve air and water quality, and increase animal and plant productivity [1]. Compared with soil quality, soil health pays more attention to the function of the soil ecosystem, not just soil productivity [2]. Soil is the foundation of agricultural production, and intensive agriculture is currently the main mode of food production in the world and an important factor affecting farmland soil health [3]. In recent decades, intensive agriculture has met the food demand of the growing population, while the field management practices for maintaining food supply often overlook soil health and the multifunctional ecosystem, which in turn results in the reduction and degradation of soil ecosystem services, ultimately leading to unsustainable agricultural development [4,5]. Soil health condition is a main restraining factor for farmland productivity [6]. Organic fertilizers, as the source of sustainable nutrient cycling and the substrate for microbial metabolism, play a crucial role in improving soil structure and fertility in agroecosystems [7,8,9]. Applying organic fertilizers is a production practice in green agriculture, which involves partially and completely replacing the chemical fertilizer and applying them to the soil before crop planting to provide sowing protection and adequate nutrients during crop production and fallow periods [10]. In the last few years, the study on the physical properties, nutrient content, enzyme activity, and microbial diversity of soil with added organic fertility has gradually increased [11,12,13]. However, few studies comprehensively evaluated the influence of organic fertilizer on soil’s health based on the farmland soil key ecosystem function.
Soil is a highly diverse and complex ecosystem, as its properties are affected by the soil formation process, parent material, climatic factors, artificial management practices, etc. Soil health evaluation should be locally conducted, and a comprehensive assessment is required [14]. Soil health index (SHI) could integrate different types of physical, chemical, and biological variables into a composite index that is widely used for evaluating soil health. SHIs have been developed for evaluating the influence of different field management measures [15,16,17] or different land use types [18,19,20,21] on soil properties, revealing their impact on soil productivity and ecosystem function [22,23,24,25,26]. SHI was often used to evaluate the influences of the ecosystem, such as the soil quality after deforestation in Northern Iran or ecological risk by soil heavy metal pollution [27]. The hilly region of the Loess Plateau is an ecological barrier for northern China, while the long-term use of mineral fertilizer has resulted in soil health degradation, becoming a serious problem that affected the productivity and sustainability of farmland in this region. Meanwhile, it is also the main region for animal husbandry and the production of manure is predicted to increase dramatically with the rapid development of animal husbandry. Incorporating livestock manure into agricultural management practices has been proposed to preserve the sustainability and productivity of agricultural systems, promote the recycling of livestock husbandry waste [28], and alleviate soil health degradation by increasing nutrient storage and organic matter [29]. However, few studies report the effect of organic fertilizer on soil health by multiple statistical methods in this region. It is necessary to develop the SHI to evaluate the impact of manure incorporation on the farmland soil health condition in the northern ecotone of China.
The development of SHI is mainly divided into three steps. First, establishing a minimum dataset (MDS) with low cost, simple measurement, reliability, sensitivity, and high accuracy as the criterion for selecting soil indicators from the total dataset (TDS). Next, standardizing each soil parameter from the minimum or total dataset applied by the two kinds of scoring curves (nonlinear and linear), ultimately combining the weight and score of all soil indicators into one index (SHIs) [30]. Establishing MDS to reduce data redundancy is a key crux in soil health research, to objectively define the meaningful and typical indicators related to soil conditions [31]. The TDS includes a series of indicators involving soil physicochemical and biological properties that are often codependent and usually measured with time and effort. A reasonable MDS should consist of physicochemical, biological, and nutrient parameters that represent the most information about TDS, and be susceptible to short-term changes in soil function, meanwhile reducing the cost and time required to determine soil indicators [32]. Several methods are used to establish evaluation datasets, including the expert opinion method [33], factor analysis (FA) [18], principal component analysis (PCA) [34], network analysis (NA) [35], and random forest analysis (RF) [36]. The FA and PCA are the most widely used methods to cut down the number of indicators and determine key indicators of soil health assessment [37,38,39]. However, previous studies have shown that FA and PCA methods may not include several key soil indicators in MDS, which reduces the stability and sensitivity of SHI, causing inaccurate results [40,41,42]. The NA and RF have been used to identify the complex relationship under soil microbial community and determine the key predictive factors of objective variables for field production targets, respectively [43,44]. Both technologies have been proven to be reliable and possess excellent statistical analysis capabilities to reduce data redundancy and identify key indicators by elucidating the complex relationship among soil variables under different field management [45]. In recent years, the NA technology has been applied to assess the effect of organic amendment on soil microbial interactions [35,46]. However, no more studies applied the NA method to choose the suitable soil parameters as MDS indicators. The methods for selecting representative and interpretable indicators for a reasonable MDS require further comparison and evaluation.
The present study aimed to use different methods, including principal comment analysis (PCA), random forest analysis (RF), and network analysis (NA) to establish MDS for the soil health evaluation model, and further assess the soil health under different fertilizer treatments. As far as we know, few studies have compared different methods to establish MDS for soil health assessment models of organic fertilizer incorporation in the agro-pastoral ecotone. The main goals of the study were (1) to differentiate the sensitivity and accuracy of SHIs based on different MDS establishment methods (PCA, RF, and NA), (2) to evaluate the influence of manure incorporation on farmland soil health, and (3) to explore the relationship between SHI and crop yield. The major hypotheses are that (1) the NA method is a reliable tool to establish a minimum dataset for soil health evaluation, (2) the significant positive correlation between soil health index and millet yield under all fertilization treatments, and (3) manure addition improved soil health conditions by increasing key limiting parameters, such as soil carbon, microbial biomass, and enzymatic activity.

2. Materials and Methods

2.1. Study Site and Experiment Design

The study was carried out through an ongoing field experiment established in 2020, and located at Yunzhou Country, Datong City, China (39°88′ N, 113°51′ W). The location belongs to a mid-latitude continental monsoon climate, with an average annual precipitation and temperature of 450 mm and 6.4 °C, respectively. The soil type is Kastanozems with a sandy loam texture. The topsoil contained 4.72 g kg−1 soil organic carbon, 0.53 g kg−1 total nitrogen, 6.02 mg kg−1 available phosphorous, 119.00 mg kg−1 available potassium, and had a pH of 8.41 before the experiment started. Millet is an important miscellaneous grain crop in this region and was sown in early May and harvested in early October.
Four fertilizer groups were included in this study: no fertilization (CK), application of chemical fertilizer alone (NPK), application of manure fertilizer alone (MF), and application of commercial organic fertilizer plus manure fertilizer at each 50 percent (NPKM). The field experimental design utilized a randomized block with four replicates. Each plot size was 50 m2 (length: 10 m and width: 5 m). Four fertilization groups were applied via rotary tillage each growing season before planting millet. The stubble of millet that was transferred out of the farmland was removed after harvesting millet. The cow manure was periodically transferred out from the cowshed and stacked together. Cow manure was applied as composted manure, and the nutrients of cow manure (dry weight basis) contained an average of 292.97 g kg−1 organic matter, 15.21 g kg−1 total nitrogen, a 19.26 organic-nitrogen ratio, and a pH of 6.52. The amount of cow manure in the MF treatment was identified by the total nitrogen input. The amount of phosphorus and potassium fertilizer was consistent with NPK treatment (Table S1). The irrigation method is dripping irrigation, and the drip irrigation belt was placed in the middle of two rows of millet. The total irrigation amount during the growth period of the four treatments was kept at 3000.00 m3 ha−1. The other field management measures were in line with local farmers.

2.2. Soil Sampling and Laboratory Determination

Soil samples (0–20 cm) were collected in October 2022, after the millet harvest. In each plot, five soil core samples (5 cm diameter and 20 cm deep) were intensively mixed into a composite sample, and all samples were sieved through a steel sieve (the aperture is 2 mm) to remove rock, weeds, mulch film, and crop stubble, then the other part was stored at 4 °C to determine the enzyme activity, biological biomass, available nutrients, and the other soil samples were naturally air dried for physical and chemical properties analyses. Twenty-two soil parameters in this study contained twelve chemical parameters, ten biological parameters, and three physical parameters. The specific measurement methods of soil properties are listed in Table S2.

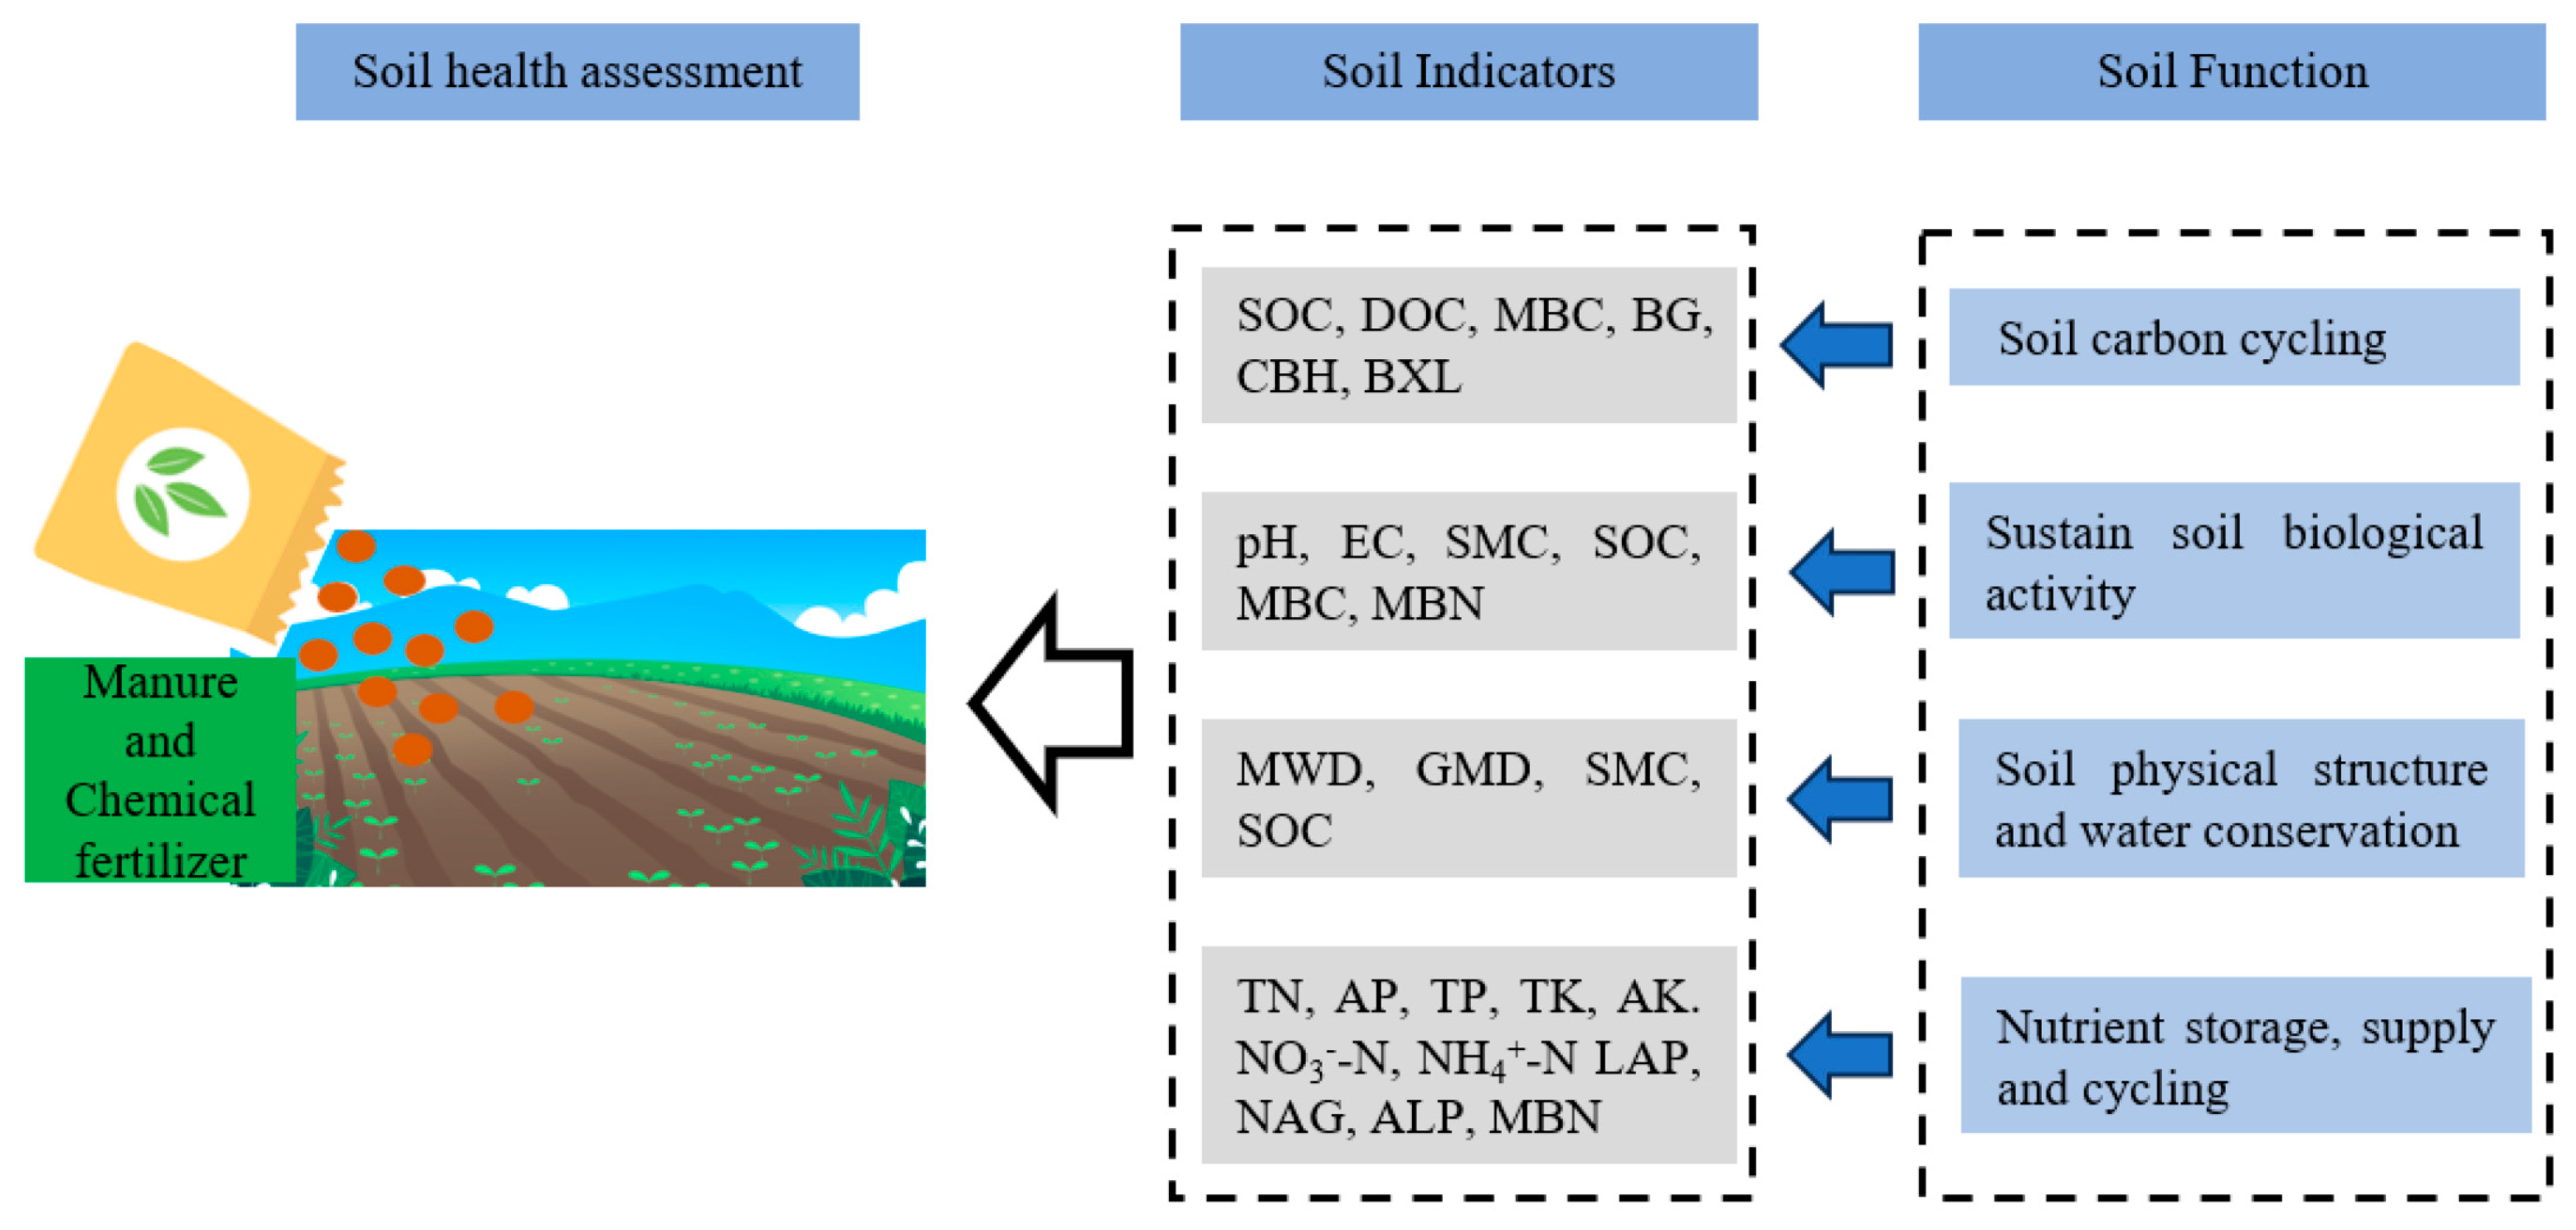
2.3. The Assessment of Farmland Soil Health

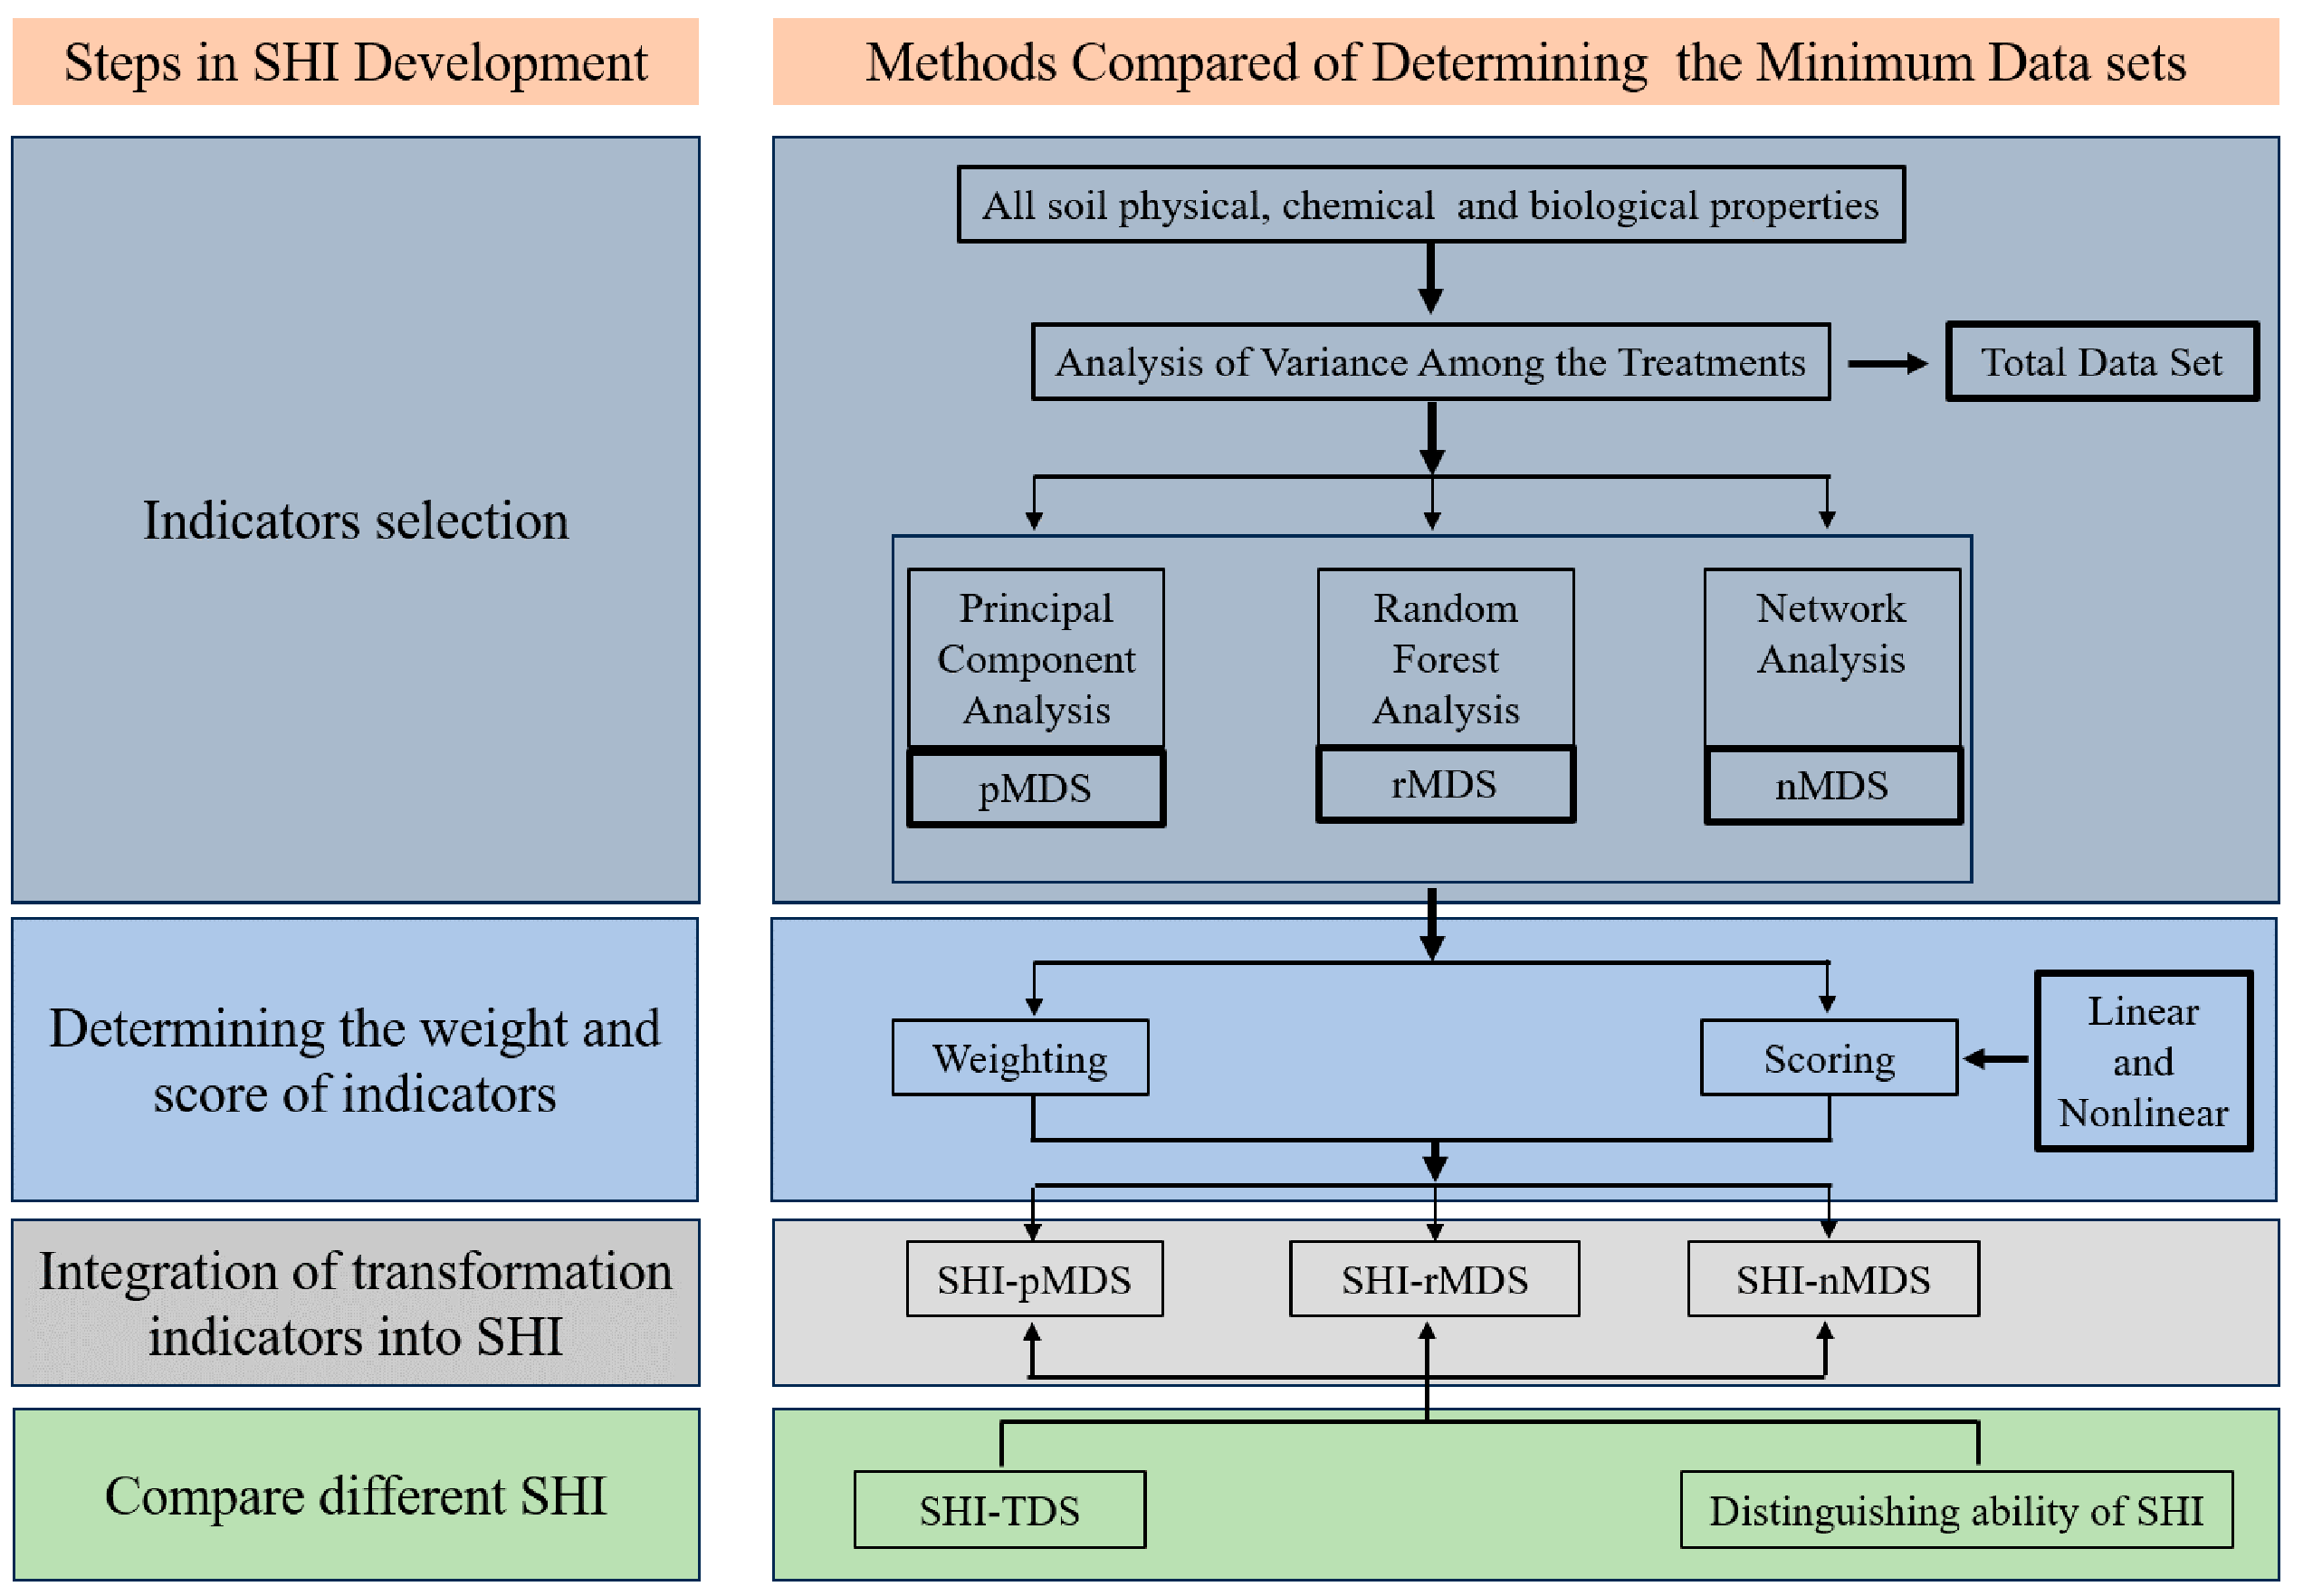
2.3.1. Developing the Minimum Dataset

The soil ecosystem function and productivity were the main goals of field management in assessing soil health conditions with the intensity of intensive agricultural production in the current research. Indicators of soil health assessment supply sufficient knowledge which includes multiple ecosystem functions correlative to the major field production targets, for example, soil carbon cycling (EF1), sustaining soil biological activity (EF2), soil physical structure stability and water conservation (EF3) and nutrient storage, supply, and cycling (EF4) (Figure 1). Therefore, twenty-two soil properties relative to the above-mentioned ecosystem function were determined as the possible parameters for the soil health assessment model (Figure 1). The partition of all soil parameters in different ecosystem function groups consult with [19], and Figure 2 shows the details.
The multivariate statistical analysis methods can be used in soil health comprehensive assessment to determine key soil indicators, since many soil parameters that influence soil health are highly correlated. First, only soil parameters that were significantly different (one-way ANOVA, p < 0.05) between the four fertilization groups in the millet phase were retained in the total dataset (TDS). Second, the soil parameters from TDS were chosen for the next step which was selected for establishing a minimum dataset (MDS). The development soil properties of the MDS were identified by the soil ecosystem function group. Three MDS, NA-MDS, RF-MDS, and PCA-MDS, were established by determining better soil health indicators set according to network analysis (NA), random forest analysis (RF), and principal component analysis (PCA), respectively (Figure 2). For PCA-MDS, the principal component (PCs) with eigenvalues ≥ 1 were chosen, since the PCs with high eigenvalues can better represent the varieties of the total system. Furthermore, for each PC, one indicator’s loading value within 10% of the highest weight load was retained. When two or more indicators were reserved in the PC, we used correlation analysis to identify redundancy of all indicators. If the indicators were not significantly correlated with each other, all indicators were selected into MDS. On the contrary, only the one indicator with the highest weighted load was chosen to establish MDS [47]. For RF-MDS, the indicator with the highest values of %IncMSE (describing the predicted significance) through determining the predictive factor of millet yield was separately selected from five ecosystem function groups to establish the RF-MDS. If one indicator has the highest %IncMSE value in different function groups, it will be selected into RF-MDS only once. For NA-MDS, Network Analysis (NA) was applied to elucidate the intricate interconnection among soil indicators and construct a network model for establishing MDS [48]. The Gephi 0.10 software was used to build a network model, visualize it, and analyze its topological properties. The Spearman’s rank correlation containing all pairwise correlations among all soil parameters was used as the raw data input into Gephi. The node in the network represents different soil parameters, and different edges represent significant correlation coefficients between the indicators (p < 0.05 and R ≥ |±0.60|). Soil properties were grouped according to the conceptual framework (Figure 1) and the nodes with the same color in the network indicate that they belong to the same soil property (e.g., soil physicochemical, nutrient content, and biochemical property). In network topology, the eigenvector centrality is a widely used statistical value and reflects the importance of nodes in the network. Hence, in each soil property group, we selected the soil indicator with the highest eigenvector centrality value and included it in NA-MDS. Furthermore, the weight of each indicator of NA-MDS was reckoned by the ratio of the eigenvector centrality value for each indicator to the sum of this value in each module [19].

2.3.2. Calculating Soil Health Indexes

After the indicators of PCA-MDS, RF-MDS, NA-MDS, and TDS were identified, a linear scoring method was used to transfer every indicator to the non-dimensional value of 0 to 1 [25]. All soil parameters were distinguished into two types in consideration of their contribution to soil health. If the value of the indicator improved can promote soil health, we used the ‘more is better’ scoring curve (Equation (1)). Otherwise, the ‘less is better’ scoring curve (Equation (2)) was used.
S L = X X m a x
S L = X m i n X
The Xmin, Xmax, and X are the minimum, maximum, and measured values of different soil parameters from the mineral and manure fertilization, respectively. Next, the nonlinear scoring curve was applied to the index dimensionless.
S N L = 1 1 + ( X + X m ) b
The Xm and X are the mean measured and measured value of every parameter. b is equal to −2.5 and 2.5 for the ‘more is better’ and ‘less is better’ curves, respectively [49]. The SNL and SL are nonlinear and linear scores of all datasets, respectively.
The weight of soil indicators of all datasets was calculated by dividing the communality of indicators by the sum of communality (NA-MDS, sum eigenvector centrality; RF-MDS, %IncMSE). Finally, the values of soil health indexes (SHI-TDS, SHI-PCA-MDS, SHI-RF-MDS, and SHI-NA-MDS) under four fertilization groups were computed by Equation (4)
S H I = i = 1 n w i × s i
The SHI represents the index of soil health under different fertilization groups, the Wi and n is the weight and number of each indicator from a dataset, respectively. Si is the linear score. Next, three SHIs based on soil indicators of PCA-MDS, RF-MDS, and NA-MDS were compared (Figure 2). Higher SHI values show better ecosystem process and function, which indicates a better effect of field management measures on farmland soil [50].

2.4. Statistical Analyses

In this study, principal component analysis and Pearson correlation were analyzed using SPSS 21.0. The Spearman’s correlation and random forest analysis were performed using the ‘ggpubr’ and ‘randomForest’ packages in R software version 4.1.0, respectively. The marked differences between four fertilization groups for soil properties, millet yield, and SHIs were used in the analysis of one-way variance and least significant difference (LSD). Graphics were generated with the R software version 4.1.0 ‘ggplot2’ package.

3. Results

3.1. Soil Properties of a Total Dataset and Millet Yield under Different Fertilization Treatments

The analysis of the ANOVA and LSD tests indicated that 22 soil parameters were marked differently (p < 0.05) between four fertilization groups (Table 1). Therefore, these soil properties were selected as indicators of TDS for PCA, RF, and NA to construct a minimum dataset (MDS). The pH was decreased by fertilization in the soil and was 3.09%, 3.68%, and 3.26% lower in NPK, MF, and NPKM relative to CK, respectively. Fertilization increased the soil moisture content (SMC) and NPKM had the highest SWC which was 27.94%, 40.69%, and 83.35% higher than that of MF, NPK, and CK, respectively. The soil nutrient content was significantly impacted by manure incorporation (Table 1). NPKM and MF tended to increase the soil organic carbon (SOC), which was 64.02~144.46% and 35.76~102.35% higher than that in NPK and CK, respectively (Table 1). The soil-available potassium (AK) and nitrate nitrogen ( N H 3 -N) exhibited the same trend, which showed the following order: NPKM > NPK > MF > CK. In addition, other soil nutrient properties (e.g., TK, DOC, and TN) obtained the highest value in NPKM, followed by MF and NPK, the last is CK. Microbial biomass C and N were influenced by manure incorporation and showed an increasing trend with manure addition. NPKM showed the highest MBC and MBN content compared with the other treatments (p < 0.05). The NPKM increased the content of MBC and MBN, which was 16.61%, 56.07%, 91.47%, and 33.65%, 38.88%, 91.47% higher than that in MF, NPK, and CK, respectively (p < 0.05). Like the above results, the C, N, and P acquisition enzyme activities were significantly different among fertilization strategies. The three enzyme activities of C-acq in NPKM, MF, and NPK were 18.16–70.26%, 11.86–79.50%, and 11.82–67.53% higher than that in CK, respectively. The N-acq enzyme activity increased by 41.09% and 62.71% of the MF and NPKM treatment compared with CK, respectively. Like C- and N-acq enzyme activities, the P-acq had the highest values in the NPKM, followed by MF, NPK, and CK. Moreover, the NPKM had the highest millet yield compared with MF, NPK, and CK, and increased by 1070.06, 859.32, and 2087.28 kg ha−1, respectively (Table 1; p < 0.05).

3.2. Development Minimum Dataset

In this study, three MDSs were developed with network analysis (NA), random forest analysis (RF), and principal component analysis (PCA). According to the result of PCA, the three PCs had eigenvalues greater than 1 (Table S3), which explained 83.44% of the variation in raw data. The PC1 explained 67.59% of the variance in the total data, and pH and LAP had higher weight loading, but a high correlation among these (Figure S1). Thus, pH was selected for PCA-MDS, due to it having the highest weight loading in the PC1. The MWD, N H 4 + -N, TN, and BXL were chosen as the four indicators with higher loaded values in the PC2 which explained a 9.50% variance. Because of the significant correlation among MWD, BXL, TN, and N H 4 + -N (Figure S1), only N H 4 + -N was selected to establish PCA-MDS. In the PC3, which explained a 6.35% variance of total data and had one indicator (EC) with the highest weighted loading, EC was identified to establish MDS. Finally, EC, pH, and N H 4 + -N were chosen to establish MDS, the order of indicators weight is as follows: EC (0.434) > pH (0.328) > N H 4 + -N (0.329) (Table S3).
The RF analysis based on multiple soil ecosystem functions was established to choose the RF-MDS parameters that affected millet yield (Table 2). In soil ecosystem function in connection with soil carbon cycling, the BXL was an important forecasting factor of the millet yield owing to its highest value of %IncMSE (10.77), thus it was selected into RF-MDS. For nutrient storage, supply, and cycling soil ecosystem function, AP had the highest value of %IncMSE (5.71) entered RF-MDS. Based on both sustained soil biological activity and soil physical structure and water conservation, the SMC with the highest value of %IncMSE (6.63) was chosen as a representative. In addition, MBN and MWD have higher values of %IncMSE of sustained soil biological activity (5.68) and soil physical structure and water conservation (4.52), respectively. Thus, both MBN and MWD were determined to establish RF-MDS. Therefore, the final soil indicators of RF-MDS to calculate SHI-RF-MDS were the following: BXL, AP, SMC, MBN, and MWD (Table 2).
For NA-MDS, the eigenvector centrality of MBC (1.00) was highest in various soil ecosystem function groups, including soil carbon cycling and sustaining soil biological activity. Thus, the MBC was selected to establish NA-MDS. In the soil carbon function group, DOC had a higher value of eigenvector centrality with 0.98 (Table 3), demonstrating that DOC is an important indicator for soil health assessment. TP had a maximum eigenvector centrality value of 0.92 (Table 3), thus TP was selected as a representative indicator of nutrient storage, supply, and cycling. The SMC appeared in two soil function groups (sustain soil biological activity, physical structure, and water conservation), and it had a higher eigenvector centrality value of 0.99. Therefore, SMC was identified as one of the established indicators of NA-MDS. In addition, MBN and GMD have higher values of eigenvector centrality in sustained soil biological activity (0.97) and physical structure and water conservation (0.88), respectively. Hence, both MBN and GMD were determined to construct NA-MDS. Furthermore, the BXL showed the maximum eigenvector centrality value of 0.92 among six soil enzymes, thus BXL was selected to establish NA-MDS. Finally, the GMD, SMC, TP, DOC, MBC, MBN, and BXL were determined to construct NA-MDS to evaluate soil health conditions (Table 4). The three selected minimum dataset methods and two indicator scoring methods to calculate SHI are described in Table S4.
Regardless of the dataset selection technologies of PCA, RF, and NA, the SHIs based on the nonlinear scoring curve were more sensitive to fertilization practices than the linear scoring curve due to the higher values of CV and F (Figure 3, except F value of SHI-L-rMDS), which showed that the nonlinear score curve had better distinguishing ability under different fertilization treatments. In addition, the linear regression result showed that the determination coefficient of SHIs among network analysis minimum dataset (R2 = 0.968 and 0.965) method and total dataset were higher than that among principal component analysis (R2 = 0.771 and 0.744), random forest analysis (R2 = 0.89 and 0.867) methods and total dataset in both nonlinear and linear scoring methods (Figure 4 and Figure S5). This result demonstrated that the minimum dataset established by the network analysis tool can retain the most information from the total dataset. Therefore, SHI calculated through the network analysis plus nonlinear scoring curve (SHI-L-nMDS) had a superior ability to differentiate for various fertilization practices (Figure 3, Figure 4 and Figure S5).

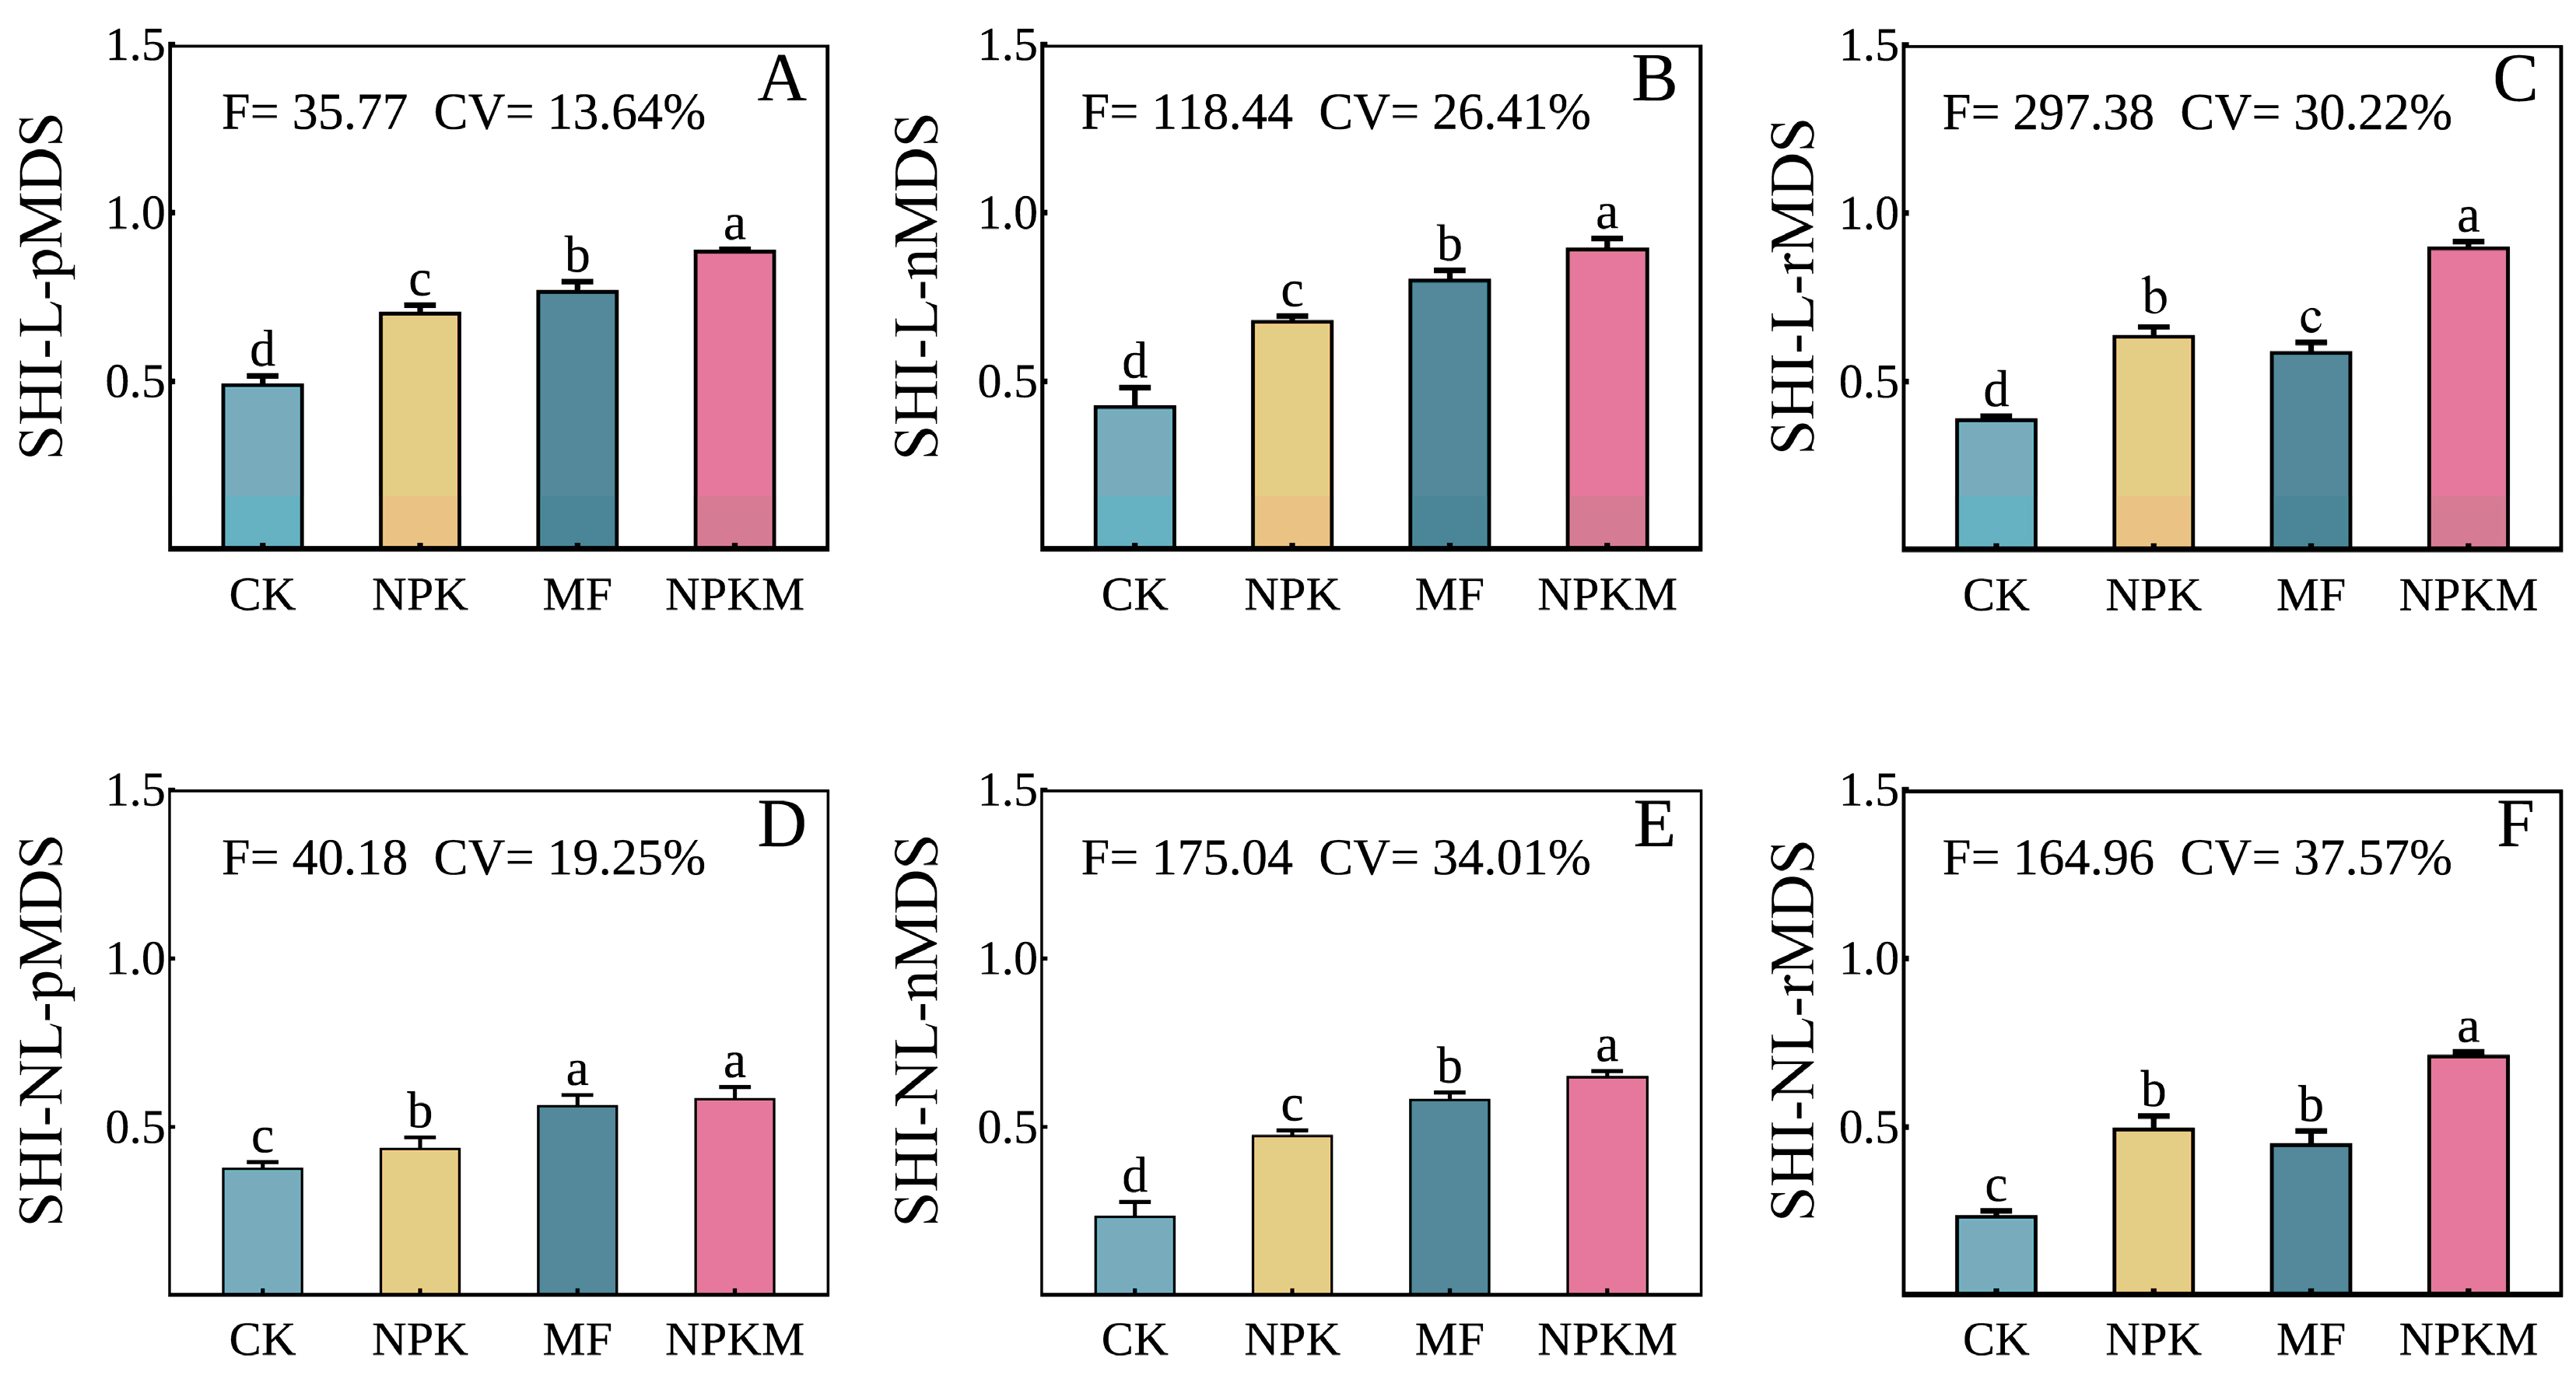
3.3. Comparison of SHIs between Fertilization Treatments

The two indicator scoring curves and three methods of establishing the minimum dataset, including SHI-L-pMDS, SHI-L-rMDS, SHI-L-nMDS, SHI-NL-pMDS, SHI-NL-rMDS, and SHI-NL-nMDS, and all indicator weights of three MDSs and TDS are exhibited in Table 4. Because of the effects of soil properties on soil ecosystem function and crop yield, each soil parameter from TDS and MDSs used the ‘more is better’ approach, besides EC and pH (which used ‘less is better’). The calculation equation and statistical analysis of six SHIs are shown in Table S4, and the highest and lowest SHI values were found in SHI-L-nMDS and SHI-NL-nMDS, respectively. The NPKM treatment had the highest value of SHIs and the lowest SHIs value in CK treatment (Figure 3). However, the SHIs in NPK were not always markedly lower than those of MF. There was no outstanding difference among the MF and NPK for SHI-L-rMDS and SHI-NL-rMDS. Compared to the MF, NPK, and CK treatments, the NPKM treatment raised SHIs by 2.13–58.54%, 23.66–43.74%, and 35.10–204.47%, respectively.

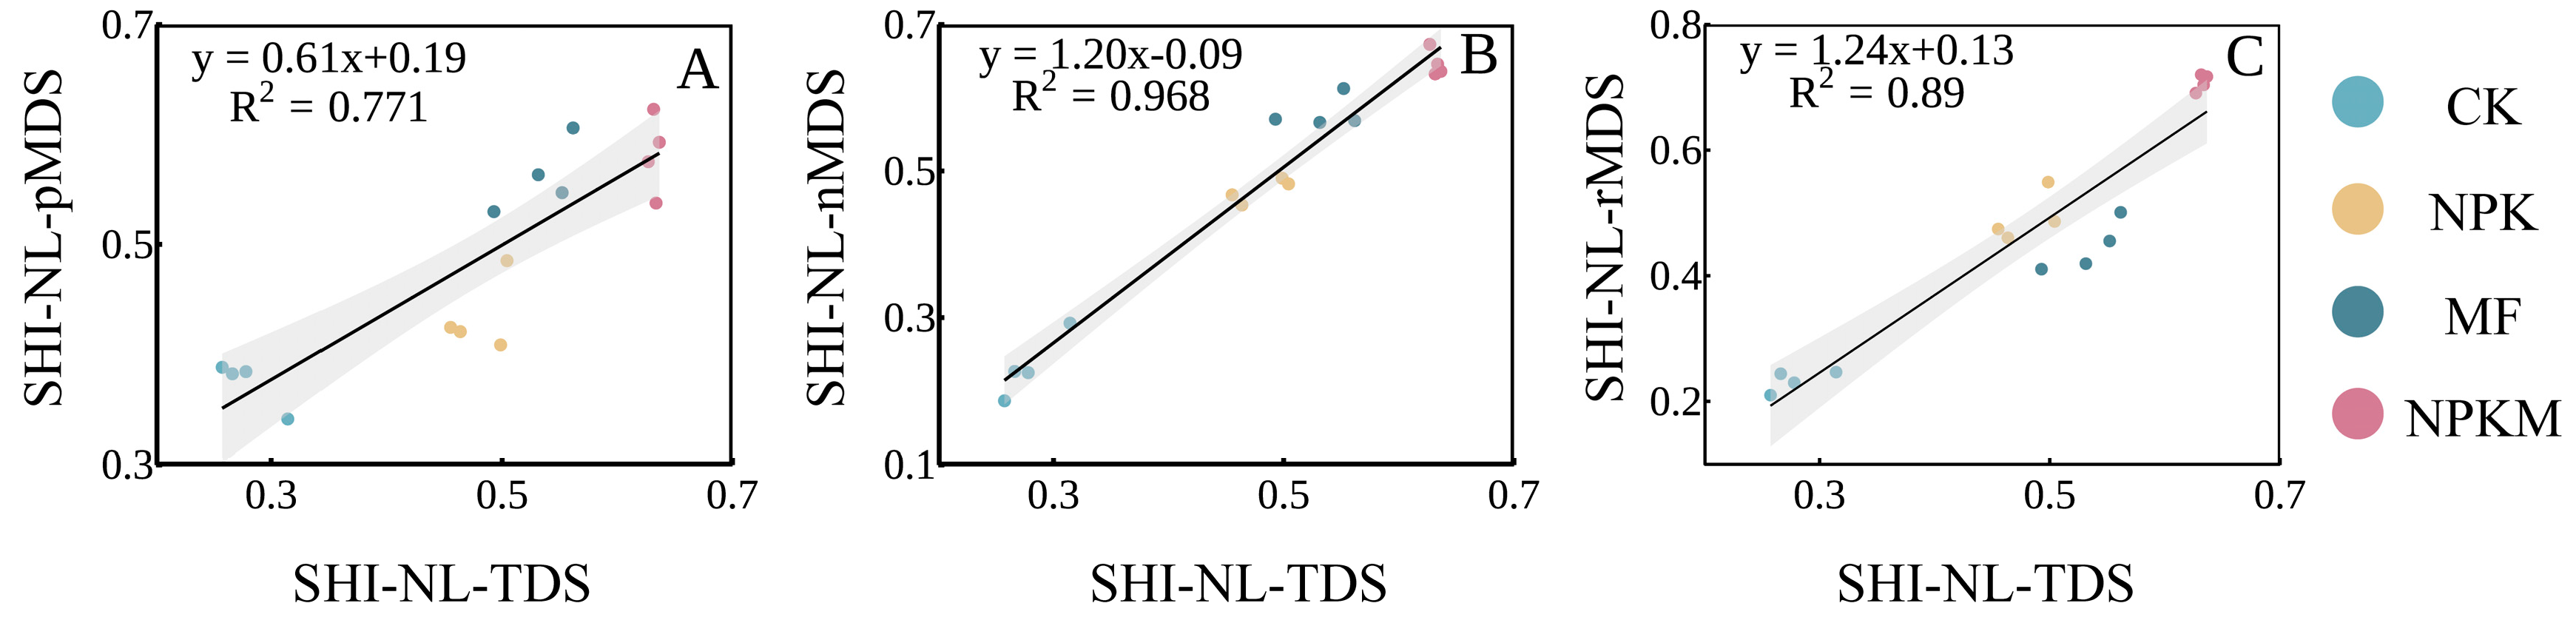
3.4. Relationships between SHIs and Crop Yields

There was a significantly positive relative between SHI-TDS and all SHI-MDSs (Figure 4 and Figure S5). Furthermore, the order of R2 values from large to small was: SHI-NA-MDS > SHI-RF-MDS > SHI-PCA-MDS (p < 0.01; Figure 4 and Figure S5). These results are also consistent with previous studies that the SHIs calculated by network analysis can greatly represent the information from the total dataset due to it having the highest values of R2. Furthermore, correlation analysis results demonstrated that eight SHIs were all marked positively relative to each other. The same result was shown in the relationship based on TDS and MDSs of soil health indexes and millet yield (p < 0.01; Table S5).

4. Discussion

4.1. Effect of Fertilization on Soil Properties

In this study, the soil properties were selected based on concern about the soil ecosystem to reveal the influence of different fertilization practices on farmland soil health. Twenty-two soil indicators were significantly different under four fertilization treatments, reflecting the intricate influences of various fertilization management practices on soil properties that were related to various farmland soil ecosystem functions and processes [51]. The ecosystem function of crop-assimilated nutrients, root elongation and fixation, and conservation of soil water are closely connected with soil physicochemical characteristics, such as the stability of soil aggregates (MWD and GMD), soil moisture content (SMC), pH, and electrical conductivity (EC) (Figure 1). Our study showed that cow manure fertilization improved MWD, GMD, and SMC meanwhile it decreased soil pH and EC. These results are consistent with those of [50], who found that compared to only chemical fertilizer soils, the content and stock of total carbon and soil organic carbon under organic fertilizer, humus acid plus organic fertilizer were 9–40% higher after two years. Organic fertilizer also ameliorated soil fertility by boosting nutrient availability (AK, AP, and N O 3 -N) and organic carbon, and it increases the capability of farmland soil to offer nutrients to plants [52,53]. Previous studies have shown that the addition of organic fertilizer could increase the soil carbon pool, such as soil organic carbon (SOC), dissolved organic carbon (DOC), and microbial biomass carbon (MBC) [54]. Our study also confirmed that the application of manure fertilizer had positive effects on SOC, DOC, and MBC, especially evident in low organic matter areas in the northern ecotone of China (Table 1). The rich nutrients of organic fertilizers were decomposed through microorganisms to slow nutrient release, and subsequently increased the nutrient pool of soil (TN, N O 3 -N, AP, and AK) [54,55,56]. Similarly, the authors of [57] found that organic fertilizer addition improved nitrogen (N) and phosphorus (P) efficiency by increasing soil organic matter and available nutrients in the oasis region of Northwest China. Among the four fertilization treatments, NPKM was the most effective treatment due to its higher soil enzyme activity (carbon, nitrogen, and phosphorus cycling), which facilitated the OC sequestration and turnover of N and P [58,59]. In addition, it resulted in the acid-base neutralization of soil and organic fertilizer, as well as increased soil nutrient content, and promotion of the function of microorganisms, as the high bioavailability of resources in neutral soil is conducive to microbial proliferation [60,61].
Soil biological properties (enzyme activity and microbial biomass) are highly sensitive to field management treatments, and are important parameters for evaluating and monitoring early changes in soil health in farmland [62,63]. Our research showed that manure fertilizer positively impacted enzyme activity and microbial biomass, which is in line with previous research that cow manure application could improve soil biological properties. It is mainly because rich organic substrate can offer appropriate microhabitats and niches for microorganisms [61,64], and improve the utilization of multifarious decomposed nutrients for soil organisms [65]. Previous studies found that fertilizers applied after fumigation increased the activities of soil catalase and soil sucrase was significantly increased by 6.2–15.9% and 133.1–238.5%. The improvement of the soil environment by cow manure amendments can stimulate the secretion of microbial enzymes and therefore provide high enzyme activity [66]. This may be mainly caused by food and energy-rich characteristics of manure fertilizer, which play a key role in the growth and habitat structure of soil microbial content. Our study also obtained the same results that the high values of microbial biomass and enzyme activities were found in treatments that included the addition of cow manure (NPKM and MF) (Table 1).

4.2. Soil Indicator Determined for Minimum Dataset with Three Methods

The MDS is a widely and efficiently recognized technology for soil health assessment, consisting of several important representative indicators [21,33,67]. The MDSs in this study were developed by principal component analysis (PCA), random forest analysis (RF), and network analysis (NA) based on soil ecosystem function, which was more comprehensive and objective than other studies on farmland soil evaluation in previous reports. These three methods provided different MDSs including different soil indicators for a soil health assessment (Table 4, Figure 2). The PCA has been widely used in soil health or quality evaluation for external environment interference [41], different soil parent material [34], and coastal regions. However, establishing MDS through PC has failed in some cases, mainly due to overlooking key soil ecosystem functions and field management goals [30,68,69,70]. For example, PCA may not consider the important soil indicators for monitoring the influence of land use and management, which had the highest value of weighted loading in the PC and could represent other indicators. In this study, a similar result was found that only soil physicochemical indicators were selected to establish pMDS. The MDSs which do not include physical, chemical, and biological indicators that collectively reflect ecosystem function may lead to inaccurate results [71]. However, combining pre-analysis (variance analysis or correlation analysis) with PCA has an advantage in reducing data redundancy. In the foreseeable future, the wide use of PCA for soil quality or health assessment models still needs to be mutually validated with other methods. Determining how to balance efficiency and accuracy is a key problem in all soil health or quality assessments.
Each indicator of soil health assessment should be selected based on the soil’s important ecosystem functions and specific field production targets of the agriculture system [33]. In this study, the RF analysis was used to predict the importance of soil indicators on millet yield, and then establish a minimum dataset (rMDS) according to four soil ecosystem functions and management objectives. The rMDS included two physical parameters (mean weight diameter and soil moisture content), one chemical parameter (total nitrogen), and two biological parameters (microbial biomass nitrogen and β-xylosidase), which contained rich soil information. Compared with PCA, the SHIs calculated by RF had higher values of R2, but lower than NA (Figure 4 and Figure S5). Furthermore, the F and CV values of RF were better than those of PCA (Figure 3). These results suggested that RF could retain more information from TDS and have greater distinguishing ability than conventional methods.
Network analysis (NA) is a novel method rarely used for assessing farmland soil health. This is the first study demonstrating the applicability and feasibility of NA technology for selecting soil parameters to establish a minimum dataset and evaluate the farmland soil health under different fertilization treatments in northern China. Higher R2 were observed in the fitting of SHIs based on NA and TDS, indicating higher accuracy MDS established by NA (Figure 4 and Figure S5). In our study, the GMD, SMC, TP, DOC, MBC, MBN, and CBH were identified as nMDS indicators to evaluate farmland soil health (Table 4). Soil carbon (DOC and MBC) was widely used as an important indicator of soil ecosystem function and often appeared in MDS [72]. Soil carbon promotes farmland soil health through preserving aggregation stabilization, increasing nutrient storage, and boosting microbial activity [14,73]. In consideration of the importance of soil carbon on the farmland ecosystem and its susceptibility, MBC and DOC are recommended for long-term monitoring in the northern ecotone of China. As for TP, it has a significant influence on nutrient cycling and promotion in soil, and phosphorus deficiency is commonly present in farmland soil in northern China. CBH is an important participant in soil organic matter formation, affecting the decomposition of crop residues in soil and the decomposition products can be preferentially utilized by microorganisms [74]. GMD is the embodiment of soil aggregates stability, an important soil parameter related to soil physical structure, the storage and stability of soil organic carbon as well as soil moisture content (SMC). MBN reflects the ability of nutrient supply and conservation, plays a key role in nitrogen cycling, and is sensitive to field management practices [75]. Although the varying number of soil indicators in MDS intuitively indicated the differences between the three methods, the same soil indicators did reappear in three different MDSs in this study (Table 4), indicating these indicators could reflect the complex information of farmland soil retained by the TDS. These key soil indicators were the core of determining the assessment accuracy and could distinguish the differences in soil health conditions under various field management measures [36,48]. This suggested that retaining key indicators in MDS may be enough to obtain accurate and sensitive evaluation results. Furthermore, NA could analyze the relationship between soil parameters and related soil functions as an important basis for selecting soil indicators. In addition, network analysis based on the Spearman correlation does not necessarily require normally distributed variables and pretreatment (data standardization and analysis of variance) before establishing MDS, so it requires minimal data processing, which reduces the time required for indicator selection, particularly in large-scale regional assessment work. Thus, the NA method could serve as an indicator selection tool to determine the MDS with an appropriate number of indicators based on the total dataset (TDS) and further be applied to develop a soil health assessment model. NA provided a new research approach for quantifying important parameters and structural stability of complex systems, and provides more reliable information for the functionality and change tendency of the entire system.
In this study, the nonlinear scoring curve with higher values of CV and F was better than a linear scoring curve (Figure 3), which was consistent with the findings in various land-use groups in Ireland [76], two irrigation and soil types in northern China [77], and different vegetation type on the Loess Plateau, China [78]. The nonlinear scoring curve could provide a deep understanding of the ecosystem functions of various soil parameters in the farmland system, and have greater discriminative ability than the linear scoring curve under field management treatments or land use groups [79]. However, a nonlinear scoring curve was not always reported as better than a linear scoring curve in some cases. For example, the authors of [41] showed that both linear and nonlinear scoring curves applied to evaluate soil quality indices have performed equally well in pastureland of semiarid regions. Furthermore, the nonlinear scoring curve is inferior to the linear curve used to assess the soil quality index because the linear scoring curve does not require a complex mathematical statistical operation [34]. These different results of the soil indicator standardization are mainly due to the complicated types of soil and land management, the balance of different soil functions, and the spatial or temporal scale of a soil health assessment.
The sensitivity and accuracy of six soil health indices were calculated by three minimum datasets (pMDS, rMDS, and nMDS), and two scoring curves were compared. The markedly positive relationships between SHI-TDS and SHI-MDS (SHI-L-pMDS, SHI-L-rMDS, SHI-L-nMDS, SHI-NL-pMDS, SHI-NL-rMDS, and SHI-NL-nMDS) were observed, indicating that all six SHI-MDS had excellent performance, and good accuracy and distinguishing ability when clarifying the influence under fertilization treatments on farmland soil health (Table S5). The above results show that constructing a suitable minimum dataset could supply adequate information to appraise the influence of field production measures on soil health [80]. However, there are differences in the distinguishing ability of SHI based on nMDS, pMDS, and rMDS. In one way, statistical analysis of soil health indices showed that SHI-NL-nMDS had higher F values and thus was more sensitive compared with SHI-NL-pMDS and SHI-NL-rMDS [48] (Figure 3). In addition, the SHI-nMDS (linear and nonlinear scoring curve) showed stronger associations with SHI-TDS (R2 = 0.965 and 0.968) than the SHI-pMDS (R2 = 0.744 and 0.771) and SHI-rMDS (R2 = 0.867 and 0.890) (Figure 4 and Figure S5), which suggested that nMDS could represent most of the information in the TDS. Interestingly, lower R2 was observed in the fitting of SHIs (SHI-L-rMDS, SHI-NL-rMDS) based on rMDS (using random forest analysis with the millet yield as a predictor) and TDS than based on NA (SHI-L-rMDS and SHI-NL-rMDS). This may be due to the influence of soil parameters and other climatic factors such as heat, light, and monsoon on crop yield [81,82]. Overall, NA has better accuracy and discrimination ability than principal component analysis and random forest analysis in this study, which may be because MDS based on network analysis could contain more information from the soil total dataset. Although the SHI-nMDS model is used for single crop systems with yield targets, it can be easily extended to other planting systems and regions. The potential limitation of the soil health assessment model may depend on specific soil and field management types, and its reliability and applicability to other planting systems and regions should be estimated. More field experiments in various planting systems and regional studies are needed to validate the SHI-nMDS model for a more accurate and stable assessment of soil health.

4.3. Effect of Organic Fertilization on Soil Health

The change in farmland soil health is the result of soil parent material and the long-term mutual effect between crops and soils, and is strongly influenced by field management [75]. According to all of the SHIs obtained from the three MDS methods, all fertilization treatments showed an increase in millet yield and soil health index, indicating that fertilization was better than no fertilization for improving soil productivity. Furthermore, the combined application of cow manure and chemical fertilizer (NPKM) had the highest SHI and millet yield, which follows previous studies that presented the obvious effect of organic fertilizer on farmland soil productivity and health, and crop yield [83,84,85]. There may be several reasons for this. First, livestock manure had higher nutrient content, lower C/N ratio, and more rapid degradation, and was available to stimulate soil microbial activity [29,86]. Secondly, the addition of cow manure can supply abundant slow-release nutrients and organic matter, thereby retaining more nutrients in farmland soil [87]. Thirdly, livestock manure can not only promote the input of plant-derived organic matter, but also facilitate carbon storage and improve the utilization efficiency of organic carbon by alleviating resource limitation and soil acidification [88]. The application of chemical fertilizer has been carried out for decades, however, the low level of soil health is still a serious problem that affects the productivity and sustainability of farmland in northern China. Our study indicates that the combined application of cow manure and chemical fertilizer is a low-cost scheme to improve soil health in farmland in the region.

4.4. SHIs Have a Positive Correlation with Each Other and Crop Yield

The result of the Pearson correlation analysis showed a highly significant positive correlation between soil health and crop yield. In general, crop yield is not usually selected into the minimum dataset for soil health assessment, but it still needs attention as it is the key plant indicator that responds to changes in soil parameters. Moreover, crop yield is of the highest concern for farmers in agricultural production. Previous studies have suggested that if there is no significant relationship between soil health or quality index and crop yield, the soil health assessment model will not have ecological value [89]. A growing number of studies have started to pay attention to the relationship between soil health or quality and crop yields [25,34,90]. It is widely believed that high soil health condition was matched with high crop yield with the addition of cow manure, as shown in this study (Table S5), indicating that the addition of livestock manure is a continuous field practice for simultaneously improving farmland productivity and soil health. An excellent SHI established using a nonlinear scoring curve and network analysis tool will supply valuable and sufficient information to evaluate the relationship among soil health indices, fertilization treatments, and farmland productivity. The average values of all SHIs in this study were 0.45–0.75 (Table S4), which demonstrates that farmland soil fertility was comparatively low in the agro-pastoral ecotone region. Therefore, encouraging farmers to add organic fertilizers such as livestock manure to improve farmland soil health is an important prerequisite for food security and sustainable agricultural development in northern China. In addition, we must be aware that the impact of manure fertilizers on farmland soil health is a superposition. Key soil parameters (soil carbon, soil nutrients, and enzyme activity) that impact crop yield and soil health should be long-term and dynamically monitored to optimize fertilization practices in time and ensure the increase in soil health and crop yield. In future studies, we recommend using multivariate analysis tools to clarify the complicated connections between soil health, crop yield, and field management practices. Additionally, it is necessary to further investigate the effects of microbial community structure and functional genes on soil health and crop yield.

5. Conclusions

The calculated farmland soil health index indicated that organic application of organic fertilizer could significantly improve soil health and ecosystem function of a single crop-planting system in the agro-pastoral ecotone in northern China, with the incorporation of cow manure plus chemical fertilizer (NPKM) being the most effective. Considering agriculture recyclable utilization and farmland productivity, the application of livestock manure is an effective way to improve intensive agricultural practice. Soil health indices (SHIs) calculated by the PCA, RF, and NA had a significant positive correlation with millet yield and SHI based on TDS. This confirmed that network analysis can be used to choose MDS and inform soil health assessment based on soil ecosystem function. Furthermore, the SHI developed by network analysis and nonlinear scoring curve retained most of the information of TDS and had optimum discriminative ability among the four fertilization treatments. The soil health index assessment model based on network analysis (SHI-nMDS) could link different soil ecosystem functions to clarify soil health conditions in a comprehensive way. Network analysis could be an appropriate method for assessing the soil health in northern China because of its good balance between maneuverability, discrimination, and accuracy for the SHI calculation. Ultimately, with regard to both farmland sustainability and productivity, livestock manure addition is an effective method for high-intensive utilization farmland. Although the SHI-nMDS evaluation framework is for the millet planting system with soil ecosystem function, it could be easily extended to other crop-planting systems. However, due to the differences in soil types and management practices, the evaluation framework applied to other crop systems and regions must be reappraised. Thus, further research on a larger number of a field experiments with various crop systems is needed for a more consistent and accurate soil health assessment, and to monitor and estimate the SHI-nMDS framework as a reliable method. Moreover, it helps us to better understand soil health.

Supplementary Materials

The following supporting information can be downloaded at: https://www.mdpi.com/article/10.3390/agriculture14040572/s1.

Author Contributions

H.L.: Conceptualization, Visualization, Methodology, Formal analysis, Data Curation and Writing—Original Draft; K.M.: Formal analysis and Data Curation; S.Z.: Writing—Review & Editing; X.C.: Formal analysis and Data Curation; Y.L.: Data Curation; Z.Z.: Data Curation; C.W.: Conceptualization, Supervision, Validation, Writing—Review & Editing and Funding Acquisition; F.C.: Writing—Conceptualization, Supervision, Validation, Writing—Review & Editing and Funding Acquisition. X.W.: Formal analysis, Project administration. All authors have read and agreed to the published version of the manuscript.

Funding

This research was funded by the National Key Research and Development Program of China (grant No. 2021YFD1901103).

Institutional Review Board Statement

Not applicable.

Data Availability Statement

The data involved in this study is still under study, so it cannot be shared.

Conflicts of Interest

The authors declare no conflict of interest.

References

  1. Rakkar, M.; Jungers, J.M.; Sheaffer, C.; Bergquist, G.; Grossman, J.; Li, F.; Gutknecht, J.L. Soil health improvements from using a novel perennial grain during the transition to organic production. Agric. Ecosyst. Environ. 2023, 341, 108164. [Google Scholar] [CrossRef]
  2. Doran, J.W.; Zeiss, M.R. Soil health and sustainability: Managing the biotic component of soil quality. Appl. Soil Ecol. A Sect. Agric. Ecosyst. Environ. 2000, 15, 3–11. [Google Scholar] [CrossRef]
  3. Gaffney, J.; Bing, J.; Byrne, P.F.; Cassman, K.G.; Ciampitti, I.; Delmer, D.; Habben, J.; Lafitte, H.R.; Lidstrom, U.E.; Porter, D.O.; et al. Science-based intensive agriculture: Sustainability, food security, and the role of technology. Glob. Food Secur. 2019, 23, 236–244. [Google Scholar] [CrossRef]
  4. Lu, M.; Powlson, D.S.; Liang, Y.; Yao, Z.; Chadwick, D.R.; Long, S.; Liu, D.; Chen, X.-P. Significant soil degradation is associated with intensive vegetable cropping in subtropical area: A case study in southwest China. SOIL Discuss. 2021, 7, 333–346. [Google Scholar] [CrossRef]
  5. Adhikari, K.; Hartemink, A.E. Linking soils to ecosystem services—A global review. Geoderma 2016, 262, 101–111. [Google Scholar] [CrossRef]
  6. Yang, T.; Siddique, K.H.M.; Liu, K. Cropping systems in agriculture and their impact on soil health-a review. Glob. Ecol. Conserv. 2020, 23, e01118. [Google Scholar] [CrossRef]
  7. Cheng, H.; Zhang, D.; Huang, B.; Song, Z.; Ren, L.; Hao, B.; Liu, J.; Zhu, J.; Fang, W.; Yan, D.; et al. Organic fertilizer improves soil fertility and restores the bacterial community after 1,3-dichloropropene fumigation. Sci. Total Environ. 2020, 738, 140345. [Google Scholar] [CrossRef] [PubMed]
  8. Liu, X.; Liu, H.; Zhang, Y.; Liu, C.; Liu, Y.; Li, Z.; Zhang, M. Organic amendments alter microbiota assembly to stimulate soil metabolism for improving soil quality in wheat-maize rotation system. J. Environ. Manag. 2023, 339, 117927. [Google Scholar] [CrossRef] [PubMed]
  9. Tian, S.; Zhu, B.; Yin, R.; Wang, M.; Jiang, Y.; Zhang, C.; Li, D.; Chen, X.; Kardol, P.; Liu, M. Organic fertilization promotes crop productivity through changes in soil aggregation. Soil Biol. Biochem. 2022, 165, 108533. [Google Scholar] [CrossRef]
  10. Jannoura, R.; Joergensen, R.G.; Bruns, C. Organic fertilizer effects on growth, crop yield, and soil microbial biomass indices in sole and intercropped peas and oats under organic farming conditions. Eur. J. Agron. 2014, 52, 259–270. [Google Scholar] [CrossRef]
  11. Li, Q.; Zhang, D.; Cheng, H.; Ren, L.; Jin, X.; Fang, W.; Yan, D.; Li, Y.; Wang, Q.; Cao, A. Organic fertilizers activate soil enzyme activities and promote the recovery of soil beneficial microorganisms after dazomet fumigation. J. Environ. Manag. 2022, 309, 114666. [Google Scholar] [CrossRef] [PubMed]
  12. Shang, L.; Wan, L.; Zhou, X.; Li, S.; Li, X.; Bhadauria, T. Effects of organic fertilizer on soil nutrient status, enzyme activity, and bacterial community diversity in leymus chinensis steppe in inner mongolia, China. PLoS ONE 2020, 15, e0240559. [Google Scholar] [CrossRef] [PubMed]
  13. Zhang, M.; Jia, J.; Lu, H.; Feng, M.; Yang, W. Functional diversity of soil microbial communities in response to supplementing 50% of the mineral n fertilizer with organic fertilizer in an oat field. J. Integr. Agric. 2021, 20, 2255–2264. [Google Scholar] [CrossRef]
  14. Rinot, O.; Levy, G.J.; Steinberger, Y.; Svoray, T.; Eshel, G. Soil health assessment: A critical review of current methodologies and a proposed new approach. Sci. Total Environ. 2019, 648, 1484–1491. [Google Scholar] [CrossRef]
  15. Aziz, I.; Mahmood, T.; Islam, K.R. Effect of long term no-till and conventional tillage practices on soil quality. Soil Tillage Res. 2013, 131, 28–35. [Google Scholar] [CrossRef]
  16. Nehrani, S.H.; Askari, M.S.; Saadat, S.; Delavar, M.A.; Taheri, M.; Holden, N.M. Quantification of soil quality under semi-arid agriculture in the northwest of iran. Ecol. Indic. 2020, 108, 105770. [Google Scholar] [CrossRef]
  17. Xue, R.; Wang, C.; Zhao, L.; Sun, B.; Wang, B. Agricultural intensification weakens the soil health index and stability of microbial networks. Agric. Ecosyst. Environ. 2022, 339, 108118. [Google Scholar] [CrossRef]
  18. Armenise, E.; Redmile-Gordon, M.A.; Stellacci, A.M.; Ciccarese, A.; Rubino, P. Developing a soil quality index to compare soil fitness for agricultural use under different managements in the mediterranean environment. Soil Tillage Res. 2013, 130, 91–98. [Google Scholar] [CrossRef]
  19. Li, X.; Qiao, L.; Huang, Y.; Li, D.; Xu, M.; Ge, T.; Meersmans, J.; Zhang, W. Manuring improves soil health by sustaining multifunction at relatively high levels in subtropical area. Agric. Ecosyst. Environ. 2023, 353, 108539. [Google Scholar] [CrossRef]
  20. Shen, Q.; Suarez-Abelenda, M.; Camps-Arbestain, M.; Pereira, R.C.; Mcnally, S.R.; Kelliher, F.M. An investigation of organic matter quality and quantity in acid soils as influenced by soil type and land use. Geoderma 2018, 328, 44–55. [Google Scholar] [CrossRef]
  21. Yuan, P.; Wang, J.; Li, C.; Xiao, Q.; Liu, Q.; Sun, Z.; Wang, J.; Cao, C. Soil quality indicators of integrated rice-crayfish farming in the jianghan plain, China using a minimum data set. Soil Tillage Res. 2020, 204, 104732. [Google Scholar] [CrossRef]
  22. Lal, R. Soil health and carbon management. Food Energy Secur. 2016, 5, 212–222. [Google Scholar] [CrossRef]
  23. Arshad, M.A.; Martin, S. Identifying critical limits for soil quality indicators in agro-ecosystems. Agric. Ecosyst. Environ. 2002, 88, 153–160. [Google Scholar] [CrossRef]
  24. Kurniawati, A.; Toth, G.; Ylivainio, K.; Toth, Z. Opportunities and challenges of bio-based fertilizers utilization for improving soil health. Org. Agric. 2023, 13, 335–350. [Google Scholar] [CrossRef]
  25. Li, P.; Shi, K.; Wang, Y.; Kong, D.; Liu, T.; Jiao, J.; Liu, M.; Li, H.; Hu, F. Soil quality assessment of wheat-maize cropping system with different productivities in China: Establishing a minimum data set. Soil Tillage Res. 2019, 190, 31–40. [Google Scholar] [CrossRef]
  26. Maharjan, B.; Das, S.; Acharya, B.S. Soil health gap: A concept to establish a benchmark for soil health management. Glob. Ecol. Conserv. 2020, 23, e01116. [Google Scholar] [CrossRef]
  27. Zhang, J.; Liu, Z.; Tian, B.; Li, J.; Luo, J.; Wang, X.; Ai, S.; Wang, X. Assessment of soil heavy metal pollution in provinces of China based on different soil types: From normalization to soil quality criteria and ecological risk assessment. J. Hazard. Mater. 2023, 441, 129891. [Google Scholar] [CrossRef] [PubMed]
  28. Fallah, S.; Rostaei, M.; Lorigooini, Z.; Surki, A.A. Chemical compositions of essential oil and antioxidant activity of dragonhead (Dracocephalum moldavica) in sole crop and dragonhead-soybean (Glycine max) intercropping system under organic manure and chemical fertilizers. Ind. Crop. Prod. 2018, 115, 158–165. [Google Scholar] [CrossRef]
  29. Li, K.; Zhang, H.; Li, X.; Wang, C.; Zhang, J.; Jiang, R.; Feng, G.; Liu, X.; Zuo, Y.; Yuan, H.; et al. Field management practices drive ecosystem multifunctionality in a smallholder-dominated agricultural system. Agric. Ecosyst. Environ. 2021, 313, 107389. [Google Scholar] [CrossRef]
  30. Askari, M.S.; Holden, N.M. Quantitative soil quality indexing of temperate arable management systems. Soil Tillage Res. 2015, 150, 57–67. [Google Scholar] [CrossRef]
  31. Bünemanna, E.K.; Giulia, B.B.; Zhanguo, B.; Rachel, E.C.; Gerlinde, D.D.; de Goedeb, R.; Luuk, F.; Violette, G.; Thom, W.K.; Paul, M.; et al. Soil quality—A critical review. Soil Biol. Biochem. 2018, 120, 105–125. [Google Scholar] [CrossRef]
  32. Andrews, S.S.; Karlen, D.L.; Cambardella, C.A. Soil management assessment framework: A quantitative soil quality evaluation method. Soil Sci. Soc. Am. J. 2004, 68, 1945–1962. [Google Scholar] [CrossRef]
  33. Andrews, S.S.; Karlen, D.L.; Mitchell, J.P. A comparison of soil quality indexing methods for vegetable production systems in northern California. Agric. Ecosyst. Environ. 2002, 90, 25–45. [Google Scholar] [CrossRef]
  34. Liu, J.; Wu, L.; Chen, D.; Yu, Z.; Wei, C. Development of a soil quality index for camellia oleifera forestland yield under three different parent materials in southern China. Soil Tillage Res. 2018, 176, 45–50. [Google Scholar] [CrossRef]
  35. Ji, L.; Ni, K.; Wu, Z.; Zhang, J.; Yi, X.; Yang, X.; Ling, N.; You, Z.; Guo, S.; Ruan, J. Effect of organic substitution rates on soil quality and fungal community composition in a tea plantation with long-term fertilization. Biol. Fertil. Soils 2020, 56, 633–646. [Google Scholar] [CrossRef]
  36. Li, P.; Zhang, H.; Deng, J.; Fu, L.; Chen, H.; Li, C.; Xu, L.; Jiao, J.; Zhang, S.; Wang, J.; et al. Cover crop by irrigation and fertilization improves soil health and maize yield: Establishing a soil health index. Appl. Soil Ecol. 2023, 182, 104727. [Google Scholar] [CrossRef]
  37. Cheng, J.; Ding, C.; Li, X.; Zhang, T.; Wang, X. Soil quality evaluation for navel orange production systems in central subtropical China. Soil Tillage Res. 2016, 155, 225–232. [Google Scholar] [CrossRef]
  38. Karaca, S.; Dengiz, O.; Turan, D.; Özkan, B.; Dedeoğlu, M.; Gülser, F.; Sargin, B.; Demirkaya, S.; Ay, A. An assessment of pasture soils quality based on multi-indicator weighting approaches in semi-arid ecosystem. Ecol. Indic. 2021, 121, 107001. [Google Scholar] [CrossRef]
  39. Panico, S.C.; Esposito, F.; Memoli, V.; Vitale, L.; Polimeno, F.; Magliulo, V.; Maisto, G.; De Marco, A. Variations of agricultural soil quality during the growth stages of sorghum and sunflower. Appl. Soil Ecol. 2020, 152, 103569. [Google Scholar] [CrossRef]
  40. Andrews, S.S.; Carroll, C.R. Designing a soil quality assessment tool for sustainable agroecosystem management. Ecol. Appl. 2001, 11, 1573–1585. [Google Scholar] [CrossRef]
  41. Raiesi, F.; Pejman, M. Assessment of post-wildfire soil quality and its recovery in semi-arid upland rangelands in central Iran through selecting the minimum data set and quantitative soil quality index. Catena 2021, 201, 105202. [Google Scholar] [CrossRef]
  42. Romaniuk, R.; Giuffré, L.; Costantini, A.; Bartoloni, N.; Nannipieri, P. A comparison of indexing methods to evaluate quality of horticultural soils. Part ii. Sensitivity of soil microbiological indicators. Soil Res. 2014, 52, 409–418. [Google Scholar] [CrossRef]
  43. Delgado-Baquerizo, M.; Maestre, F.T.; Reich, P.B.; Jeffries, T.C.; Gaitan, J.J.; Encinar, D.; Berdugo, M.; Campbell, C.D.; Singh, B.K. Microbial diversity drives multifunctionality in terrestrial ecosystems. Nat. Commun. 2016, 7, 10541. [Google Scholar] [CrossRef] [PubMed]
  44. Jiao, S.; Lu, Y.; Wei, G. Soil multitrophic network complexity enhances the link between biodiversity and multifunctionality in agricultural systems. Glob. Chang. Biol. 2022, 28, 140–153. [Google Scholar] [CrossRef] [PubMed]
  45. Han, Z.; Xu, P.; Li, Z.; Lin, H.; Zhu, C.; Wang, J.; Zou, J. Microbial diversity and the abundance of keystone species drive the response of soil multifunctionality to organic substitution and biochar amendment in a tea plantation. Glob. Chang. Biol. Bioenergy 2022, 14, 481–495. [Google Scholar] [CrossRef]
  46. Wang, H.; Xu, J.; Liu, X.; Zhang, D.; Li, L.; Li, W.; Sheng, L. Effects of long-term application of organic fertilizer on improving organic matter content and retarding acidity in red soil from China. Soil Tillage Res. 2019, 195, 104382. [Google Scholar] [CrossRef]
  47. Vasu, D.; Tiwari, G.; Sahoo, S.; Dash, B.; Jangir, A.; Sharma, R.P.; Naitam, R.; Tiwary, P.; Karthikeyan, K.; Chandran, P. A minimum data set of soil morphological properties for quantifying soil quality in coastal agroecosystems. Catena 2021, 198, 105042. [Google Scholar] [CrossRef]
  48. Raiesi, F.; Beheshti, A. Evaluating forest soil quality after deforestation and loss of ecosystem services using network analysis and factor analysis techniques. Catena 2022, 208, 105778. [Google Scholar] [CrossRef]
  49. Zhou, Y.; Ma, H.; Xie, Y.; Jia, X.; Su, T.; Li, J.; Shen, Y. Assessment of soil quality indexes for different land use types in typical steppe in the loess hilly area, China. Ecol. Indic. 2020, 118, 106743. [Google Scholar] [CrossRef]
  50. Raiesi, F. A minimum data set and soil quality index to quantify the effect of land use conversion on soil quality and degradation in native rangelands of upland arid and semiarid regions. Ecol. Indic. 2017, 75, 307–320. [Google Scholar] [CrossRef]
  51. Howell, D.M.; Gupta, S.D.; Pinno, B.D.; Mackenzie, M.D. Reclaimed soils; fertilizer, and bioavailable nutrients: Determining similarity with natural benchmarks over time. Can. J. Soil Sci. 2016, 97, 149–158. [Google Scholar] [CrossRef]
  52. Lazcano, C.; Gómez-Brandón, M.; Revilla, P.; Domínguez, J. Short-term effects of organic and inorganic fertilizers on soil microbial community structure and function. Biol. Fertil. Soils 2013, 49, 723–733. [Google Scholar] [CrossRef]
  53. von Arb, C.; Bünemann, E.K.; Schmalz, H.; Portmann, M.; Adamtey, N.; Musyoka, M.W.; Frossard, E.; Fliessbach, A. Soil quality and phosphorus status after nine years of organic and conventional farming at two input levels in the central highlands of kenya. Geoderma 2020, 362, 114112. [Google Scholar] [CrossRef]
  54. Bender, S.F.; Wagg, C.; van der Heijden, M.G.A. An underground revolution: Biodiversity and soil ecological engineering for agricultural sustainability. Trends Ecol. Evol. 2016, 31, 440–452. [Google Scholar] [CrossRef] [PubMed]
  55. Bai, X.; Tang, J.; Wang, W.; Ma, J.; Shi, J.; Ren, W. Organic amendment effects on cropland soil organic carbon and its implications: A global synthesis. Catena 2023, 231, 107343. [Google Scholar] [CrossRef]
  56. Luo, G.; Li, L.; Friman, V.; Guo, J.; Guo, S.; Shen, Q.; Ling, N. Organic amendments increase crop yields by improving microbe-mediated soil functioning of agroecosystems: A meta-analysis. Soil Biol. Biochem. 2018, 124, 105–115. [Google Scholar] [CrossRef]
  57. He, H.; Peng, M.; Lu, W.; Hou, Z.; Li, J. Commercial organic fertilizer substitution increases wheat yield by improving soil quality. Sci. Total Environ. 2022, 851, 158132. [Google Scholar] [CrossRef] [PubMed]
  58. Liu, E.; Yan, C.; Mei, X.; He, W.; Bing, S.H.; Ding, L.; Liu, Q.; Liu, S.; Fan, T. Long-term effect of chemical fertilizer, straw, and manure on soil chemical and biological properties in northwest China. Geoderma 2010, 158, 173–180. [Google Scholar] [CrossRef]
  59. Ros, M. Soil microbial activity after restoration of a semiarid soil by organic amendments. Soil Biol. Biochem. 2003, 35, 463–469. [Google Scholar] [CrossRef]
  60. Tiemann, L.K.; Billings, S.A. Changes in variability of soil moisture alter microbial community c and n resource use. Soil Biol. Biochem. 2011, 43, 1837–1847. [Google Scholar] [CrossRef]
  61. Wang, L.; Delgado-Baquerizo, M.; Wang, D.; Isbell, F.; Liu, J.; Feng, C.; Liu, J.; Zhong, Z.; Zhu, H.; Yuan, X.; et al. Diversifying livestock promotes multidiversity and multifunctionality in managed grasslands. Proc. Natl. Acad. Sci. USA 2019, 116, 6187–6192. [Google Scholar] [CrossRef]
  62. Li, P.; Wu, M.; Kang, G.; Zhu, B.; Li, H.; Hu, F.; Jiao, J. Soil quality response to organic amendments on dryland red soil in subtropical China. Geoderma 2020, 373, 114416. [Google Scholar] [CrossRef]
  63. Ferreiro, J.P.; Fu, S. Biological indices for soil quality evaluation: Perspectives and limitations. Land Degrad. Dev. 2016, 27, 14–25. [Google Scholar] [CrossRef]
  64. Jiang, Y.; Luan, L.; Hu, K.; Liu, M.; Chen, Z.; Geisen, S.; Chen, X.; Li, H.; Xu, Q.; Bonkowski, M.; et al. Trophic interactions as determinants of the arbuscular mycorrhizal fungal community with cascading plant-promoting consequences. Microbiome 2020, 8, 142. [Google Scholar] [CrossRef] [PubMed]
  65. Torsvik, V.; Ovreas, L.; Thingstad, T.F. Prokaryotic diversity—Magnitude; dynamics; controlling factors. Science 2002, 296, 1064–1066. [Google Scholar] [CrossRef]
  66. Luo, G.; Rensing, C.; Chen, H.; Liu, M.; Wang, M.; Guo, S.; Ling, N.; Shen, Q. Deciphering the associations between soil microbial diversity and ecosystem multifunctionality driven by long-term fertilization management. Funct. Ecol. 2018, 32, 1103–1116. [Google Scholar] [CrossRef]
  67. Yu, P.; Han, D.; Liu, S.; Wen, X.; Huang, Y.; Jia, H. Soil quality assessment under different land uses in an alpine grassland. Catena 2018, 171, 280–287. [Google Scholar] [CrossRef]
  68. Qi, Y.; Darilek, J.L.; Huang, B.; Zhao, Y.; Sun, W.; Gu, Z. Evaluating soil quality indices in an agricultural region of jiangsu province, China. Geoderma 2009, 149, 325–334. [Google Scholar] [CrossRef]
  69. Rossi, J.P.; Franc, A.; Rousseau, G.X. Indicating soil quality and the gisq. Soil Biol. Biochem. 2009, 41, 444–445. [Google Scholar] [CrossRef]
  70. Swanepoel, P.A.; Preez, C.C.D.; Botha, P.R.; Snyman, H.A.; Habig, J. Soil quality characteristics of kikuyu–ryegrass pastures in south Africa. Geoderma 2014, 232–234, 589–599. [Google Scholar] [CrossRef]
  71. Vasu, D.; Singh, S.K.; Ray, S.K.; Duraisami, V.P.; Tiwary, P.; Chandran, P.; Nimkar, A.M.; Anantwar, S.G. Soil quality index (SQI) as a tool to evaluate crop productivity in semi-arid deccan plateau, India. Geoderma 2016, 282, 70–79. [Google Scholar] [CrossRef]
  72. Wood, S.A.; Tirfessa, D.; Baudron, F. Soil organic matter underlies crop nutritional quality and productivity in smallholder agriculture. Agric. Ecosyst. Environ. 2018, 266, 100–108. [Google Scholar] [CrossRef]
  73. Zornoza, R.; Acosta, J.A.; Bastida, F.; Domínguez, S.G.; Toledo, D.M.; Faz, A. Identification of sensitive indicators to assess the interrelationship between soil quality, management practices and human health. Soil 2015, 1, 173–185. [Google Scholar] [CrossRef]
  74. Zhou, S.; Chen, L.; Wang, J.; He, L.; Wang, J.; Ren, C.; Guo, Y.; Zhao, F. Stronger microbial decay of recalcitrant carbon in tropical forests than in subtropical and temperate forest ecosystems in China. Catena 2022, 215, 106351. [Google Scholar] [CrossRef]
  75. Lyu, L.; Zhu, J.; Long, H.; Liao, K.; Fan, Y.; Wang, J. Effects of farmland use transition on soil organic carbon in dry farming areas. Environ. Dev. Sustain. 2023, 26, 7055–7078. [Google Scholar] [CrossRef]
  76. Holden, N.M.; Askari, M.S. Indices for quantitative evaluation of soil quality under grassland management. Geoderma 2014, 230, 230–231. [Google Scholar] [CrossRef]
  77. Lu, H.; Chen, X.; Ma, K.; Zhou, S.; Yi, J.; Qi, Y.; Hao, J.; Chen, F.; Wen, X. Soil health assessment under different soil and irrigation types in the agro-pastoral ecotone of northern China. Catena 2024, 235, 107655. [Google Scholar] [CrossRef]
  78. Zhao, D.; Xu, M.; Liu, G.; Ma, L.; Zhang, S.; Xiao, T.; Peng, G. Effect of vegetation type on microstructure of soil aggregates on the loess plateau, China. Agric. Ecosyst. Environ. 2017, 242, 1–8. [Google Scholar] [CrossRef]
  79. Yu, P.; Liu, S.; Zhang, L.; Li, Q.; Zhou, D. Selecting the minimum data set and quantitative soil quality indexing of alkaline soils under different land uses in northeastern China. Sci. Total Environ. 2018, 616–617, 564–571. [Google Scholar] [CrossRef]
  80. Jiang, M.; Xu, L.; Chen, X.; Zhu, H.; Fan, H. Soil quality assessment based on a minimum data set: A case study of a county in the typical river delta wetlands. Sustainability 2020, 12, 9033. [Google Scholar] [CrossRef]
  81. Shi, W.; Wang, M.; Liu, Y. Crop yield and production responses to climate disasters in China. Sci. Total Environ. 2021, 750, 141147. [Google Scholar] [CrossRef]
  82. Zhi, J.; Cao, X.; Zhang, Z.; Qin, T.; Qu, L.; Qi, L.; Ge, L.; Guo, A.; Wang, X.; Da, C.; et al. Identifying the determinants of crop yields in China since 1952 and its policy implications. Agric. For. Meteorol. 2022, 327, 109216. [Google Scholar] [CrossRef]
  83. Baldi, E.; Cavani, L.; Margon, A.; Quartieri, M.; Sorrenti, G.; Marzadori, C.; Toselli, M. Effect of compost application on the dynamics of carbon in a nectarine orchard ecosystem. Sci. Total Environ. 2018, 637–638, 918–925. [Google Scholar] [CrossRef] [PubMed]
  84. Mazzon, M.; Cavani, L.; Ciavatta, C.; Campanelli, G.; Burgio, G.; Marzadori, C. Conventional versus organic management: Application of simple and complex indexes to assess soil quality. Agric. Ecosyst. Environ. 2021, 322, 107673. [Google Scholar] [CrossRef]
  85. Zhang, J.; Li, Y.; Jia, J.; Liao, W.; Amsili, J.P.; Schneider, R.L.; van Es, H.M.; Li, Y.; Zhang, J. Applicability of soil health assessment for wheat-maize cropping systems in smallholders’ farmlands. Agric. Ecosyst. Environ. 2023, 353, 108558. [Google Scholar] [CrossRef]
  86. Hoorens, B.; Aerts, R.; Stroetenga, M. Does initial litter chemistry explain litter mixture effects on decomposition? Oecologia 2003, 137, 578–586. [Google Scholar] [CrossRef] [PubMed]
  87. Zhang, Y.; Xu, X.; Li, Z.; Liu, M.; Xu, C.; Zhang, R.; Luo, W. Effects of vegetation restoration on soil quality in degraded karst landscapes of southwest China. Sci. Total Environ. 2019, 650, 2657–2665. [Google Scholar] [CrossRef]
  88. Xiao, Q.; Huang, Y.; Wu, L.; Tian, Y.; Wang, Q.; Wang, B.; Xu, M.; Zhang, W. Long-term manuring increases microbial carbon use efficiency and mitigates priming effect via alleviated soil acidification and resource limitation. Biol. Fertil. Soils 2021, 57, 925–934. [Google Scholar] [CrossRef]
  89. Li, P.; Zhang, T.; Wang, X.; Yu, D. Development of biological soil quality indicator system for subtropical China. Soil Tillage Res. 2013, 126, 112–118. [Google Scholar] [CrossRef]
  90. Zhang, J.; Nie, J.; Cao, W.; Gao, Y.; Lu, Y.; Liao, Y. Long-term green manuring to substitute partial chemical fertilizer simultaneously improving crop productivity and soil quality in a double-rice cropping system. Eur. J. Agron. 2023, 142, 126641. [Google Scholar] [CrossRef]
Figure 1. Conceptual diagram for soil health assessment indictors selecting based on soil ecosystem function in this study. MWD: mean weight diameter, GMD: geometric mean diameter, SMC: soil moisture content (%), EC: electrical conductivity (us cm−1), SOC: soil organic carbon (g kg−1), TN: total nitrogen (g kg−1), AP: available phosphorus (mg kg−1), TP: total phosphorus (g kg−1), TK: total potassium (mg kg−1), N O 3 -N: nitrate nitrogen (mg kg−1), N H 4 + -N: ammonium nitrogen (mg kg−1), AK: available potassium (mg kg−1), DOC: dissolved organic carbon (mg kg−1), MBC: microbial biomass carbon (mg kg−1), MBN: microbial biomass nitrogen (mg kg−1), BG: β-glucosidase (IU g−1), CBH: β-cellobiosidas (IU g−1), BXL: β-Xylosidase (IU g−1), NAG: β-1,4-N-acetylglucosaminidase (U g−1), LAP: L-leucine aminopeptidase (U g−1), ALP: Alkaline Phosphatase (IU g−1).
Agriculture 14 00572 g001
Figure 2. Conceptual framework and flow chart for calculating soil health indexes using weighting and scoring combinations based on minimum dataset established by principal component analysis (pMDS), random forest analysis (rMDS) and network analysis (nMDS).
Agriculture 14 00572 g002
Figure 3. Soil health indexes (SHIs) under four fertilization treatments. Values are means ± standard error (n = 4). Different letters indicate significant difference among treatments (p < 0.05). Note: (A) SHI-L-pMDS, soil health index calculated by linear scoring curve and minimum dataset established with principal component analysis; (B) SHI-L-nMDS, soil health index calculated by linear scoring curve and minimum dataset established with network analysis; (C) SHI-L-rMDS, soil health index calculated by linear scoring curve and minimum dataset established with random forest analysis; (D) SHI-NL-pMDS, soil health index calculated by nonlinear scoring curve and minimum dataset established with principal component analysis; (E) SHI-NL-nMDS, soil health index calculated by nonlinear scoring curve and minimum dataset established with network analysis; (F) SHI-NL-rMDS, soil health index calculated by nonlinear scoring curve and minimum dataset established with random forest analysis.
Agriculture 14 00572 g003
Figure 4. Relationship between of soil health index based on three minimum datasets between total dataset methods under nonlinear scoring curve. SHI-NL-pMDS: soil health index calculated by nonlinear scoring curve and minimum dataset established with principal component analysis; SHI-NL-nMDS: soil health index calculated by nonlinear scoring curve and minimum dataset established with network analysis; SHI-NL-rMDS: soil health index calculated by nonlinear scoring curve and minimum dataset established with random forest analysis; SHI-NL-TDS: soil health index calculated by nonlinear scoring curve and total dataset. (A): linear regression analysis results of SHI-NL-TDS and SHI-NL-pMDS; (B): linear regression analysis results of SHI-NL-TDS and SHI-NL-nMDS; (C): linear regression analysis results of SHI-NL-TDS and SHI-NL-rMDS.
Agriculture 14 00572 g004
Table 1. Descriptive statistics of all soil properties for different fertilizer treatments (mean ± standard deviation). Means for the same property with different lowercase letters indicate significant treatment differences at p < 0.05.
MWDGMDSMCpHECSOCTNAPTP
CK1.57 ± 0.74 b1.77 ± 0.42 b6.49 ± 0.26 d8.81 ± 0.09 a71.16 ± 1.71 c3.04 ± 0.59 b0.45 ± 0.03 b2.70 ± 0.05 d0.02 ± 0.02 b
NPK1.87 ± 1.19 b2.30 ± 0.57 b8.46 ± 0.53 c8.49 ± 0.13 b99.57 ± 6.92 b4.53 ± 0.77 b0.50 ± 0.09 b7.57 ± 0.76 b0.06 ± 0.01 a
MF1.79 ± 1.06 b3.41 ± 0.67 a9.30 ± 0.49 b8.54 ± 0.07 b105.11 ± 4.61 b7.43 ± 1.54 a0.52 ± 0.15 b4.15 ± 0.16 c0.07 ± 0.01 a
NPKM4.24 ± 0.56 a3.83 ± 0.72 a11.90 ± 0.53 a8.52 ± 0.08 b117.43 ± 117.43 a6.15 ± 0.650.70 ± 0.07 a8.96 ± 0.64 a0.07 ± 0.01 a
TK N O 3 -N N H 4 + -NAKDOCMBCMBNBGCBH
CK1.46 ± 0.03 c2.84 ± 0.88 b1.30 ± 0.09 c119.00 ± 7.87 c97.33 ± 5.91 c355.67 ± 49.13 c15.40 ± 1.55 c5.56 ± 1.45 c46.88 ± 13.55 b
NPK1.46 ± 0.04 b6.80 ± 2.76 a1.56 ± 0.31 bc215.00 ± 12.57 b127.33 ± 20.82 b43.47 ± 3.52 b43.47 ± 3.52 b7.84 ± 0.45 b78.54 ± 2.24 a
MF1.49 ± 0.02 ab6.38 ± 1.73 a2.01 ± 0.33 b244.75 ± 14.15 a157.67 ± 8.01 a45.17 ± 2.18 b45.17 ± 2.18 b7.86 ± 0.23 b84.16 ± 2.74 a
NPKM1.57 ± 0.11 a6.89 ± 1.77 a3.30 ± 0.65 a242.00 ± 10.71 a158.67 ± 7.32 a60.37 ± 10.36 a60.37 ± 10.36 a7.78 ± 0.18 a79.82 ± 2.36 a
BXLLAPNAGALPYield
CK37.20 ± 1.30 c24.21 ± 3.61 c6.07 ± 0.61 c11.02 ± 1.52 c2715.22 ± 343.44 c
NPK41.59 ± 1.97 b38.89 ± 1.81 b7.02 ± 0.58 b12.31 ± 1.07 b3943.18 ± 59.72 b
MF41.61 ± 0.74 b38.34 ± 1.44 b5.97 ± 0.79 b12.88 ± 0.77 b3732.44 ± 31.98 b
NPKM43.95 ± 3.39 a42.18 ± 1.39 a6.94 ± 0.66 a14.43 ± 1.74 a4802.50 ± 172.18 a
Table 2. Results of random forest analysis (RF) of total dataset soil indicators as predictors of millet yield. Boldface and underline soil properties correspond to the indicators included in the RF-MDS (rMDS).
Soil IndicatorsSoil Ecosystem Function%IncMSE
SOCSoil carbon cycling1.58
DOC2.56
MBC4.51
BG6.26
CBH3.72
BXL8.19
APNutrient storage, supply, and cycling5.71
AK4.88
LAP4.83
N H 4 + -N4.63
TK3.73
N O 3 -N3.05
TP2.67
TN2.48
ALP1.75
NAG1.61
SMCSustain soil biological activity6.63
MBN5.68
MBC4.51
EC4.41
pH3.82
SOC1.58
SMCSoil physical structure and water conservation6.63
MWD4.52
SOC1.58
GMD1.32
Note: See Figure 1 for abbreviation definitions.
Table 3. Results of network analysis (NA) of total dataset soil indicators. Boldface and underline soil properties correspond to the indicators included in the NA-MDS (nMDS).
Soil IndicatorsSoil Ecosystem FunctionEigenvector Centrality
SOCSoil carbon cycling0.87
DOC0.98
MBC1.00
BG0.89
CBH0.92
BXL0.89
TNNutrient storage, supply, and cycling0.87
AP0.64
TP0.92
TK0.87
N O 3 -N0.52
N H 4 + -N0.89
AK0.83
LAP0.79
NAG0.48
ALP0.89
pHSustain soil biological activity0.13
SMC0.99
SOC0.87
MBC1.00
MBN0.97
EC0.52
MWDSoil physical structure and water conservation0.27
GMD0.88
SMC0.99
SOC0.87
Note: See Figure 1 for abbreviation definitions.
Table 4. Weights of the soil health indictors that were assigned in the TDS, pMDS, nMDS and rMDS.
IndictorsScoring CurveLinear CurveNonlinear CurveWeight
XmaxXminMeanSlopeTDSpMDSnMDSrMDS
MWDMore is better4.990.512.37−2.500.0410.147
GMDMore is better4.871.382.83−2.500.0380.133
SMCMore is better12.616.259.03−2.500.0520.1490.216
pHLess is better8.898.348.592.500.0470.328
ECLess is better129.6269.4198.322.500.0490.343
SOCMore is better9.302.465.29−2.500.047
TNMore is better0.790.300.54−2.500.0400.186
APMore is better9.572.635.85−2.500.050
TPMore is better0.070.010.05−2.500.0450.138
TKMore is better1.661.161.44−2.500.045
N O 3 -NMore is better9.981.845.73−2.500.030
N H 4 + -NMore is better3.801.172.04−2.500.0470.329
AKMore is better261.00112.00205.19−2.500.051
DOCMore is better169.0089.00135.25−2.500.0480.148
MBCMore is better772.00317.00514.25−2.500.0500.150
MBNMore is better74.7013.5041.10−2.500.0480.1450.185
BGMore is better10.963.817.70−2.500.045
CBHMore is better91.3333.8873.41−2.500.0500.138
BXLMore is better61.4529.4542.71−2.500.0490.266
LAPMore is better43.5519.4635.91−2.500.051
NAGMore is better7.823.706.12−2.500.036
ALPMore is better15.558.5212.22−2.500.041
Note: TDS, total dataset; pMDS, based on the principal component analysis to establish minimum dataset; nMDS, based on the network analysis to establish minimum dataset; rMDS, based on the random forest analysis to establish minimum dataset. See Figure 1 for abbreviation definitions.
Disclaimer/Publisher’s Note: The statements, opinions and data contained in all publications are solely those of the individual author(s) and contributor(s) and not of MDPI and/or the editor(s). MDPI and/or the editor(s) disclaim responsibility for any injury to people or property resulting from any ideas, methods, instructions or products referred to in the content.

