
Spatio-Temporal Variation and Future Sustainability of Net Primary Productivity from 2001 to 2021 in Hetao Irrigation District, Inner Mongolia

Abstract
:1. Introduction
2. Data and Research Methods
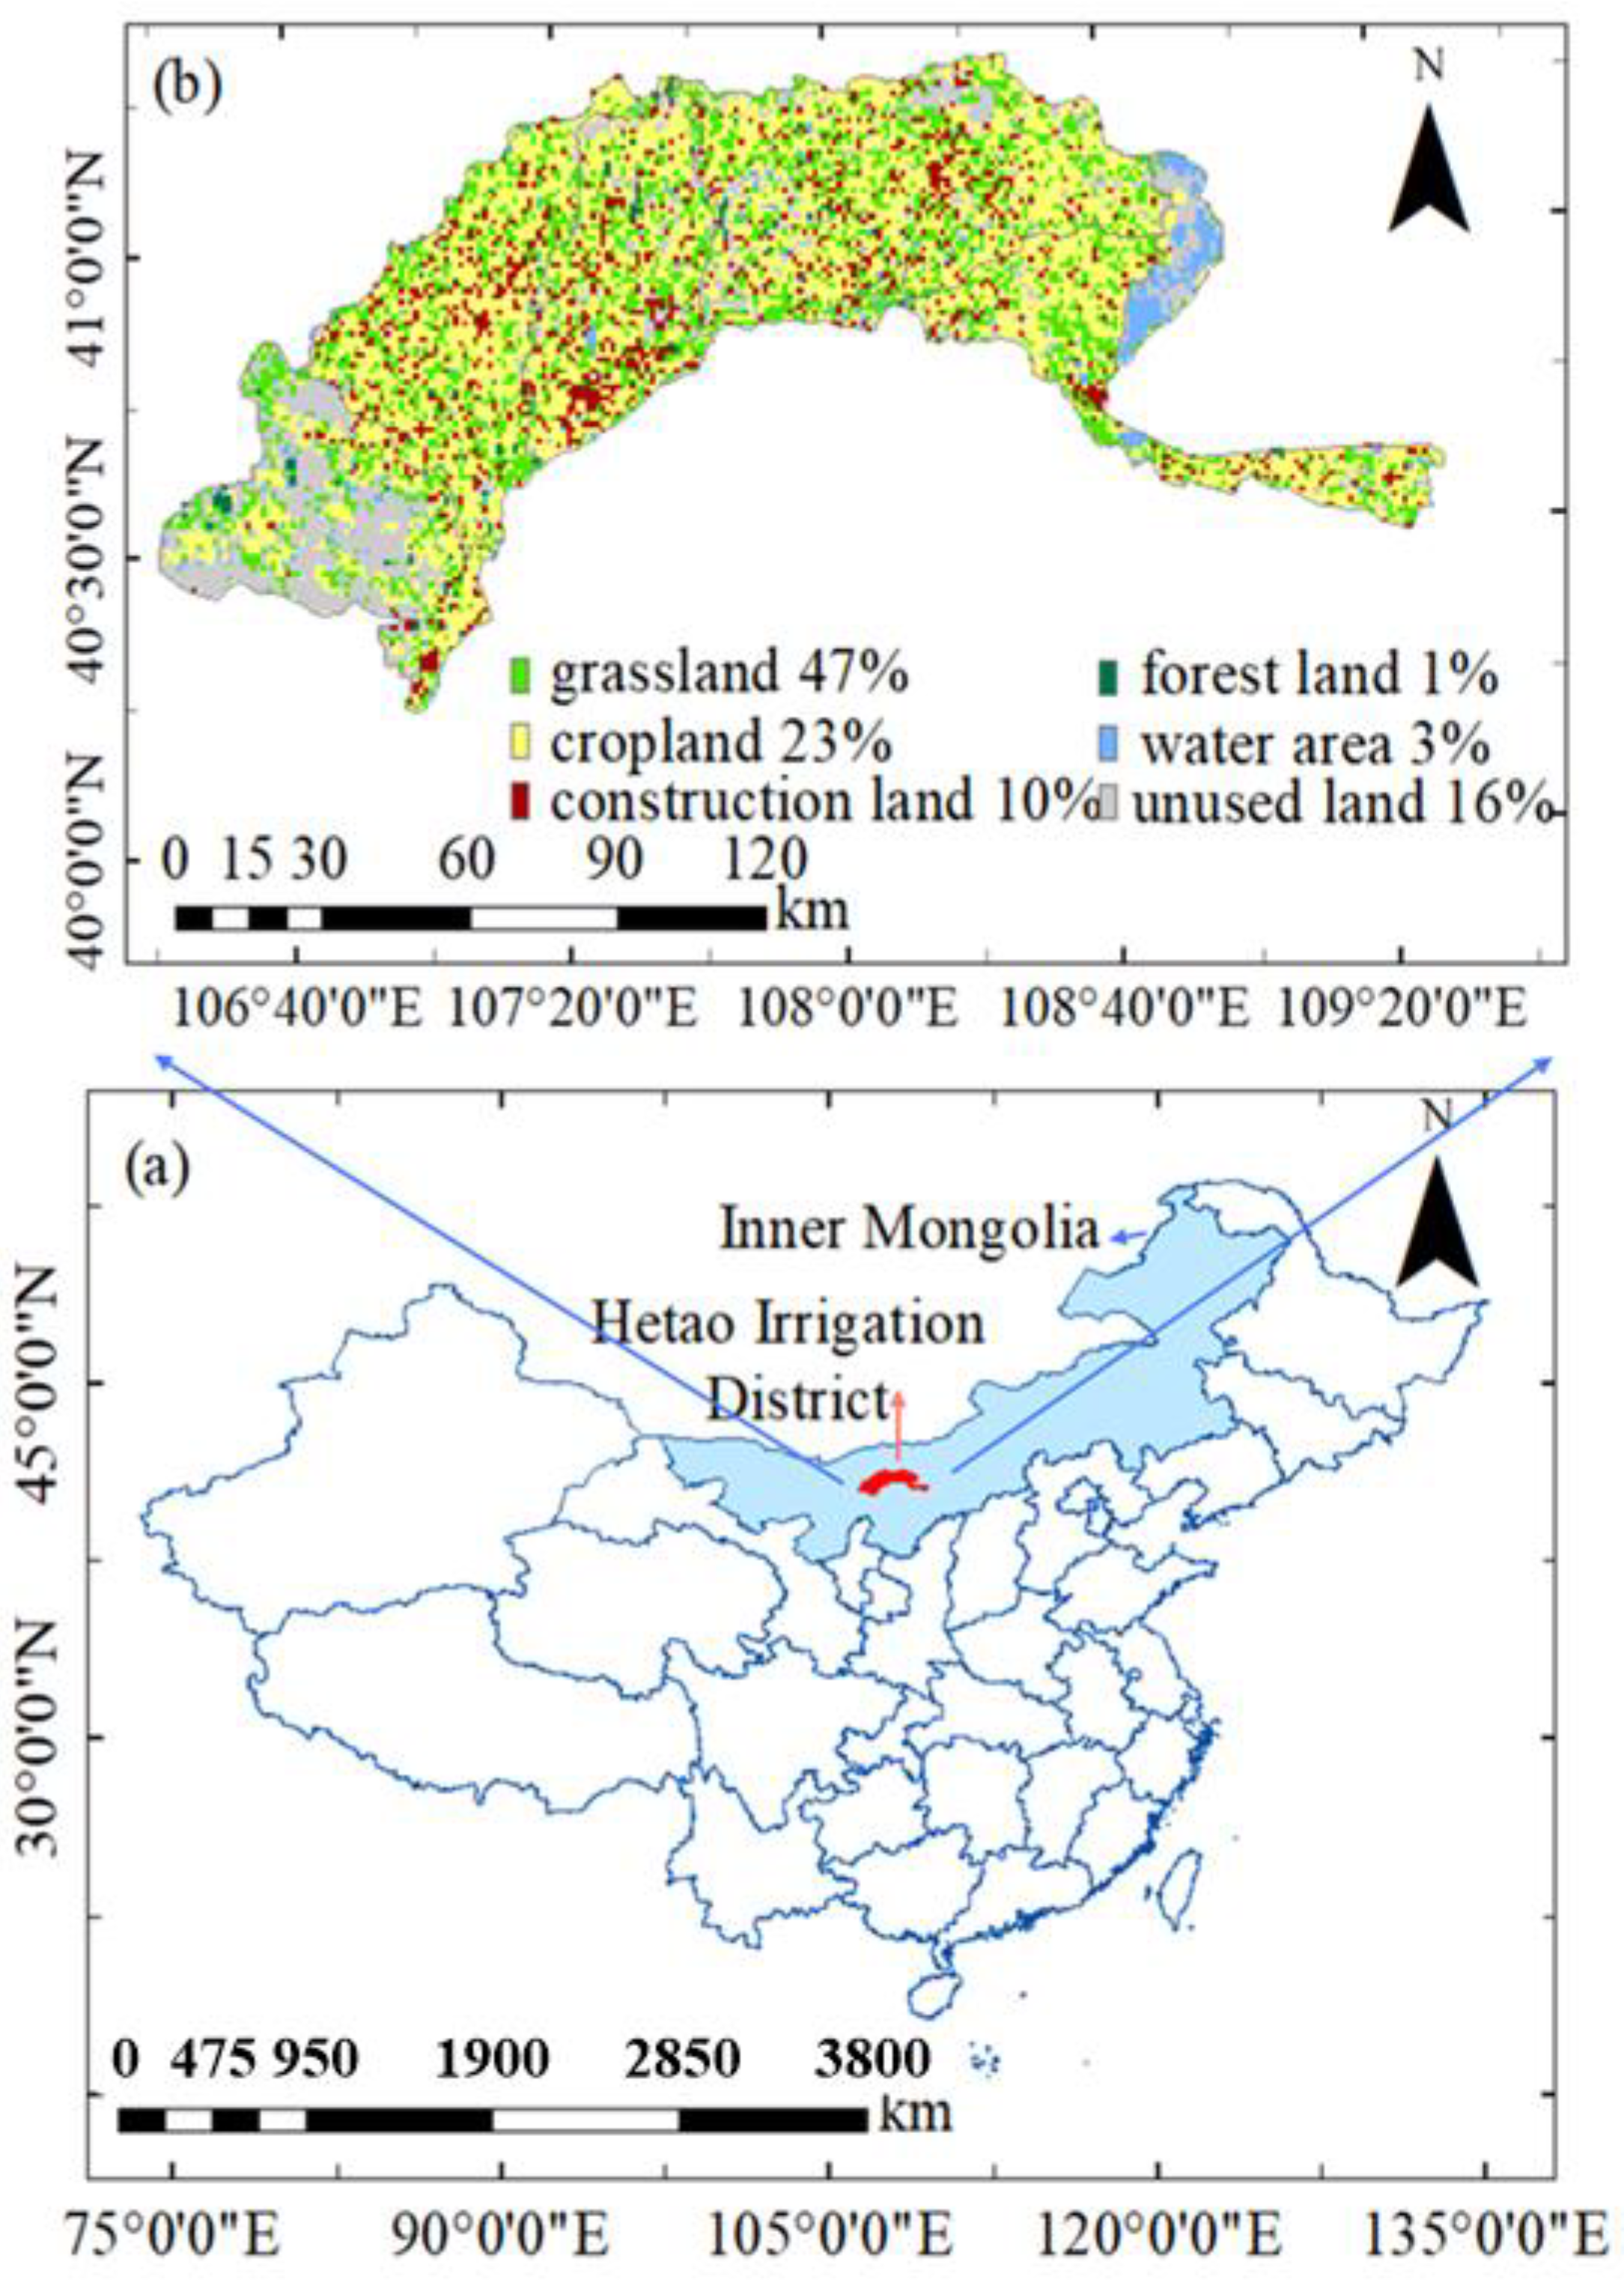
2.1. Study Area
2.2. Data Sources
2.3. Methods
2.3.1. Theil–Sen Median Trend Analysis and Mann–Kendall Test
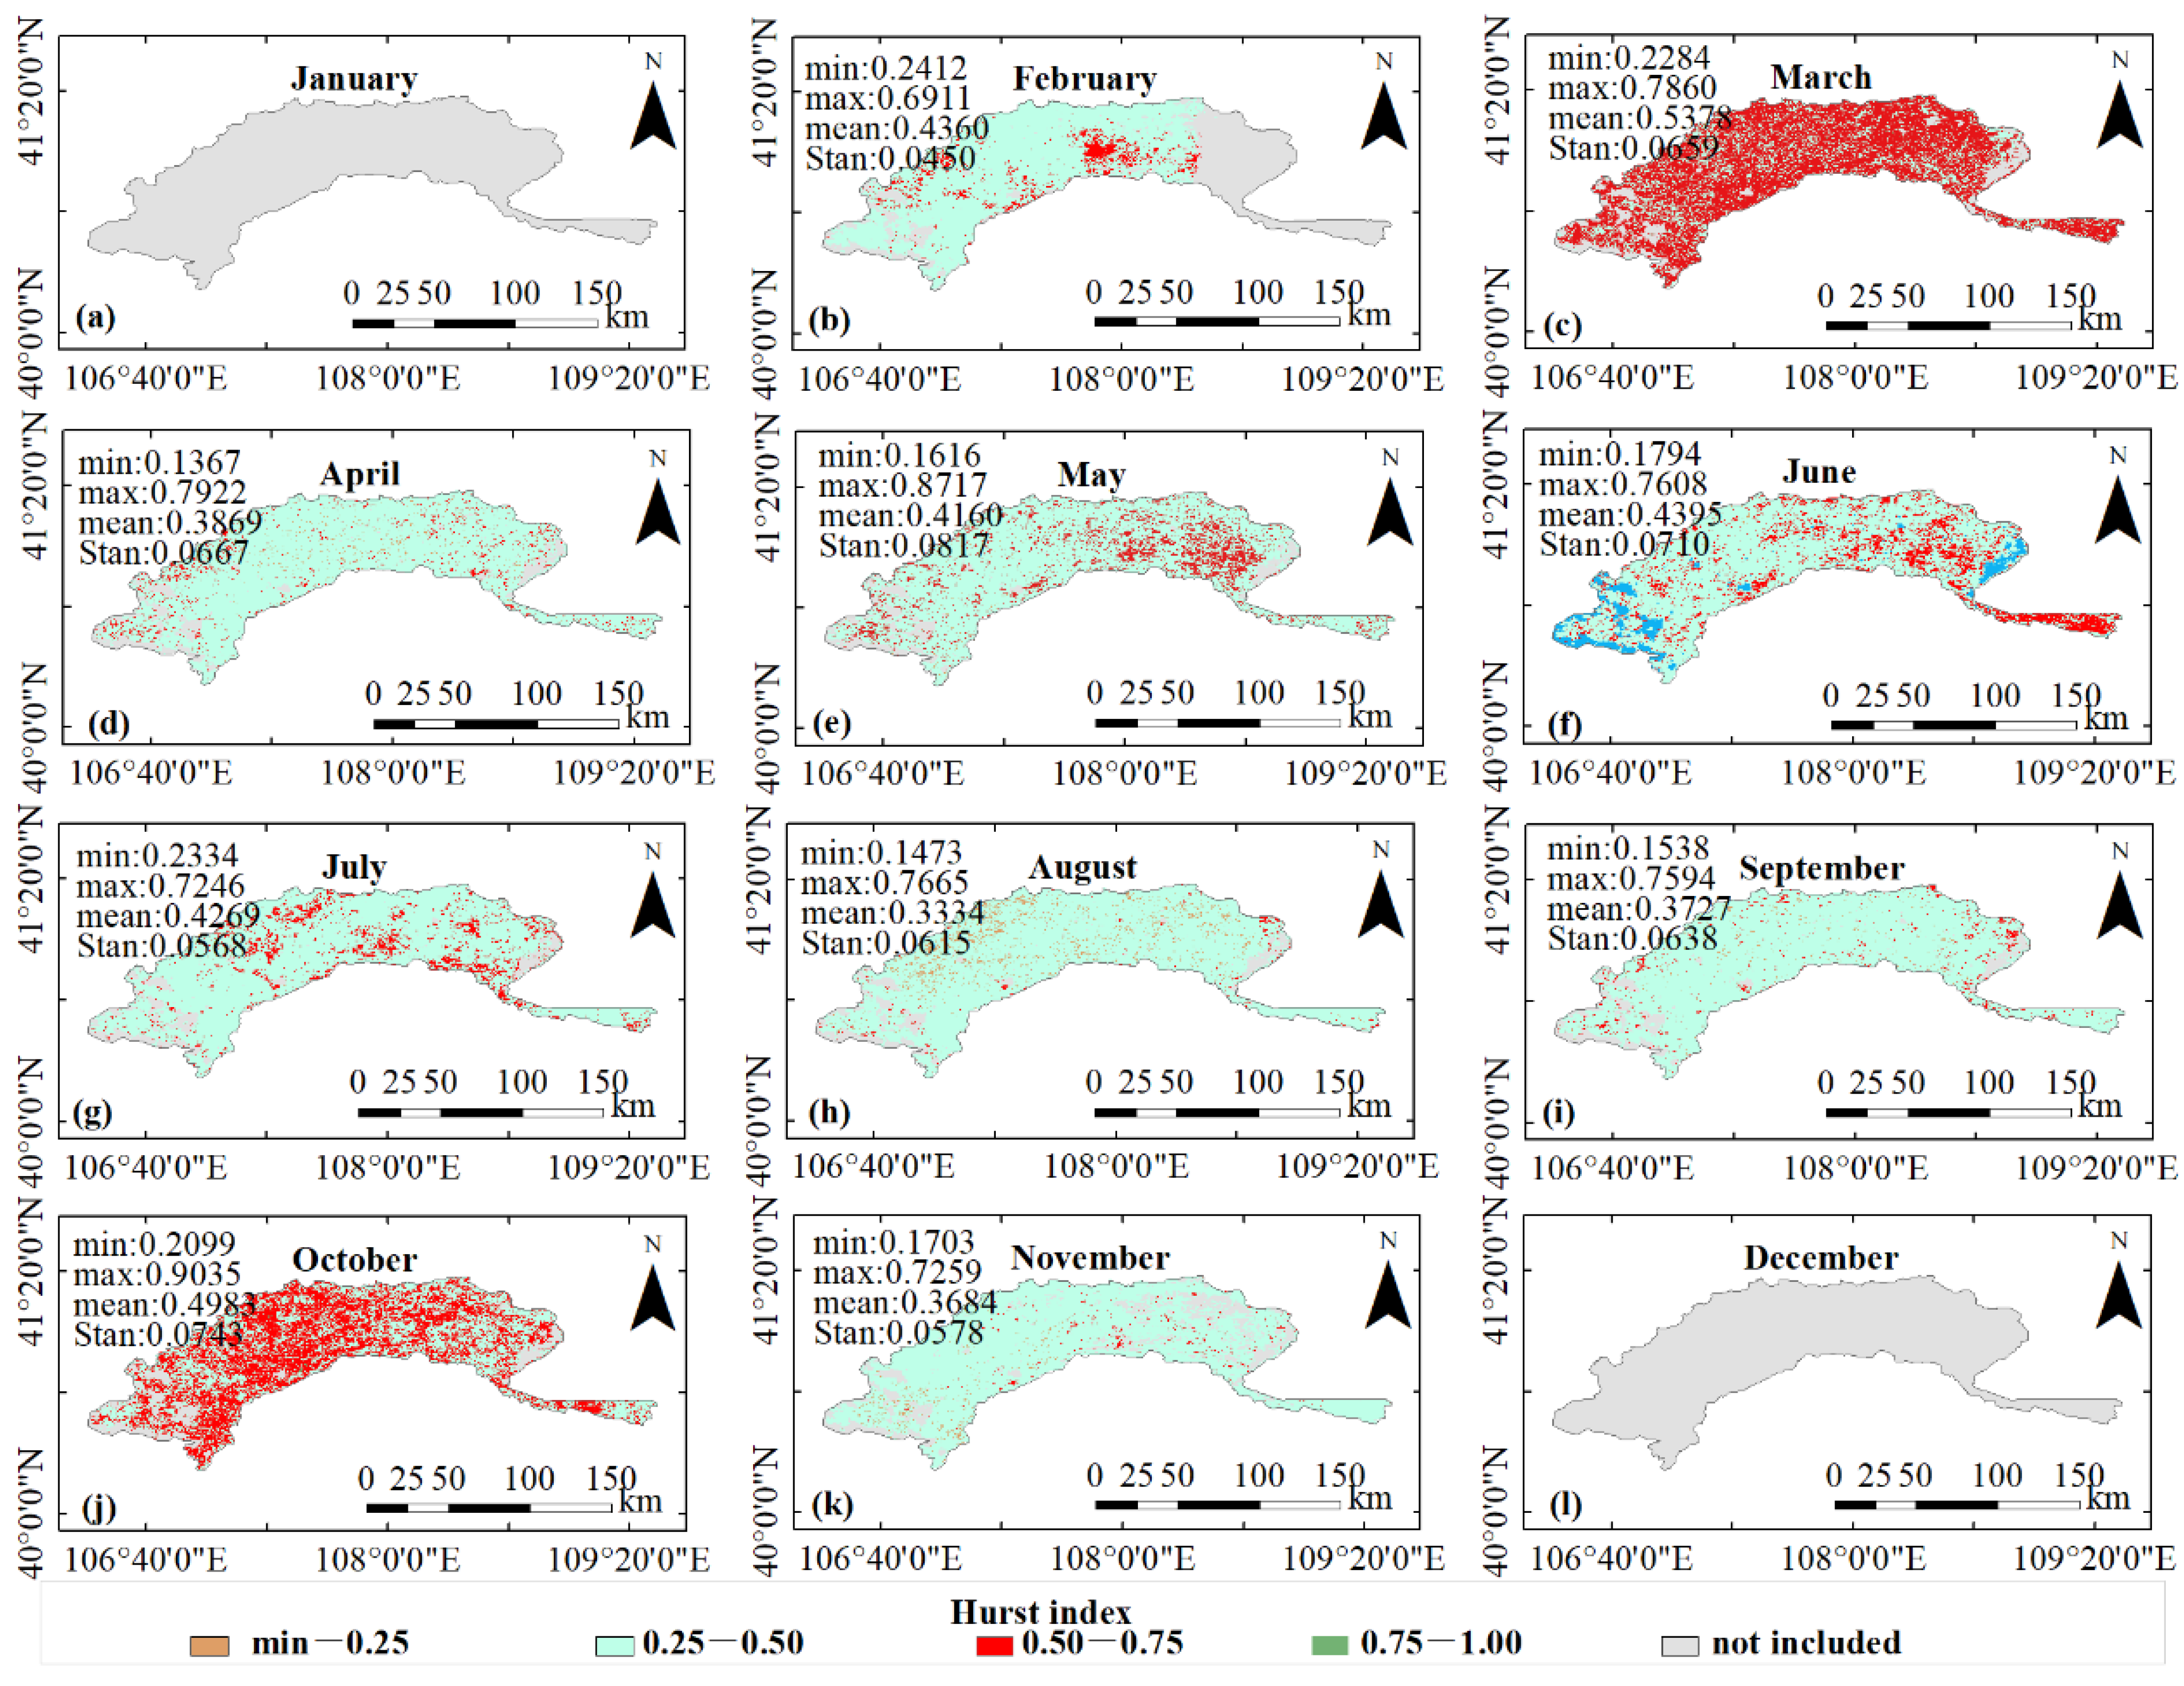
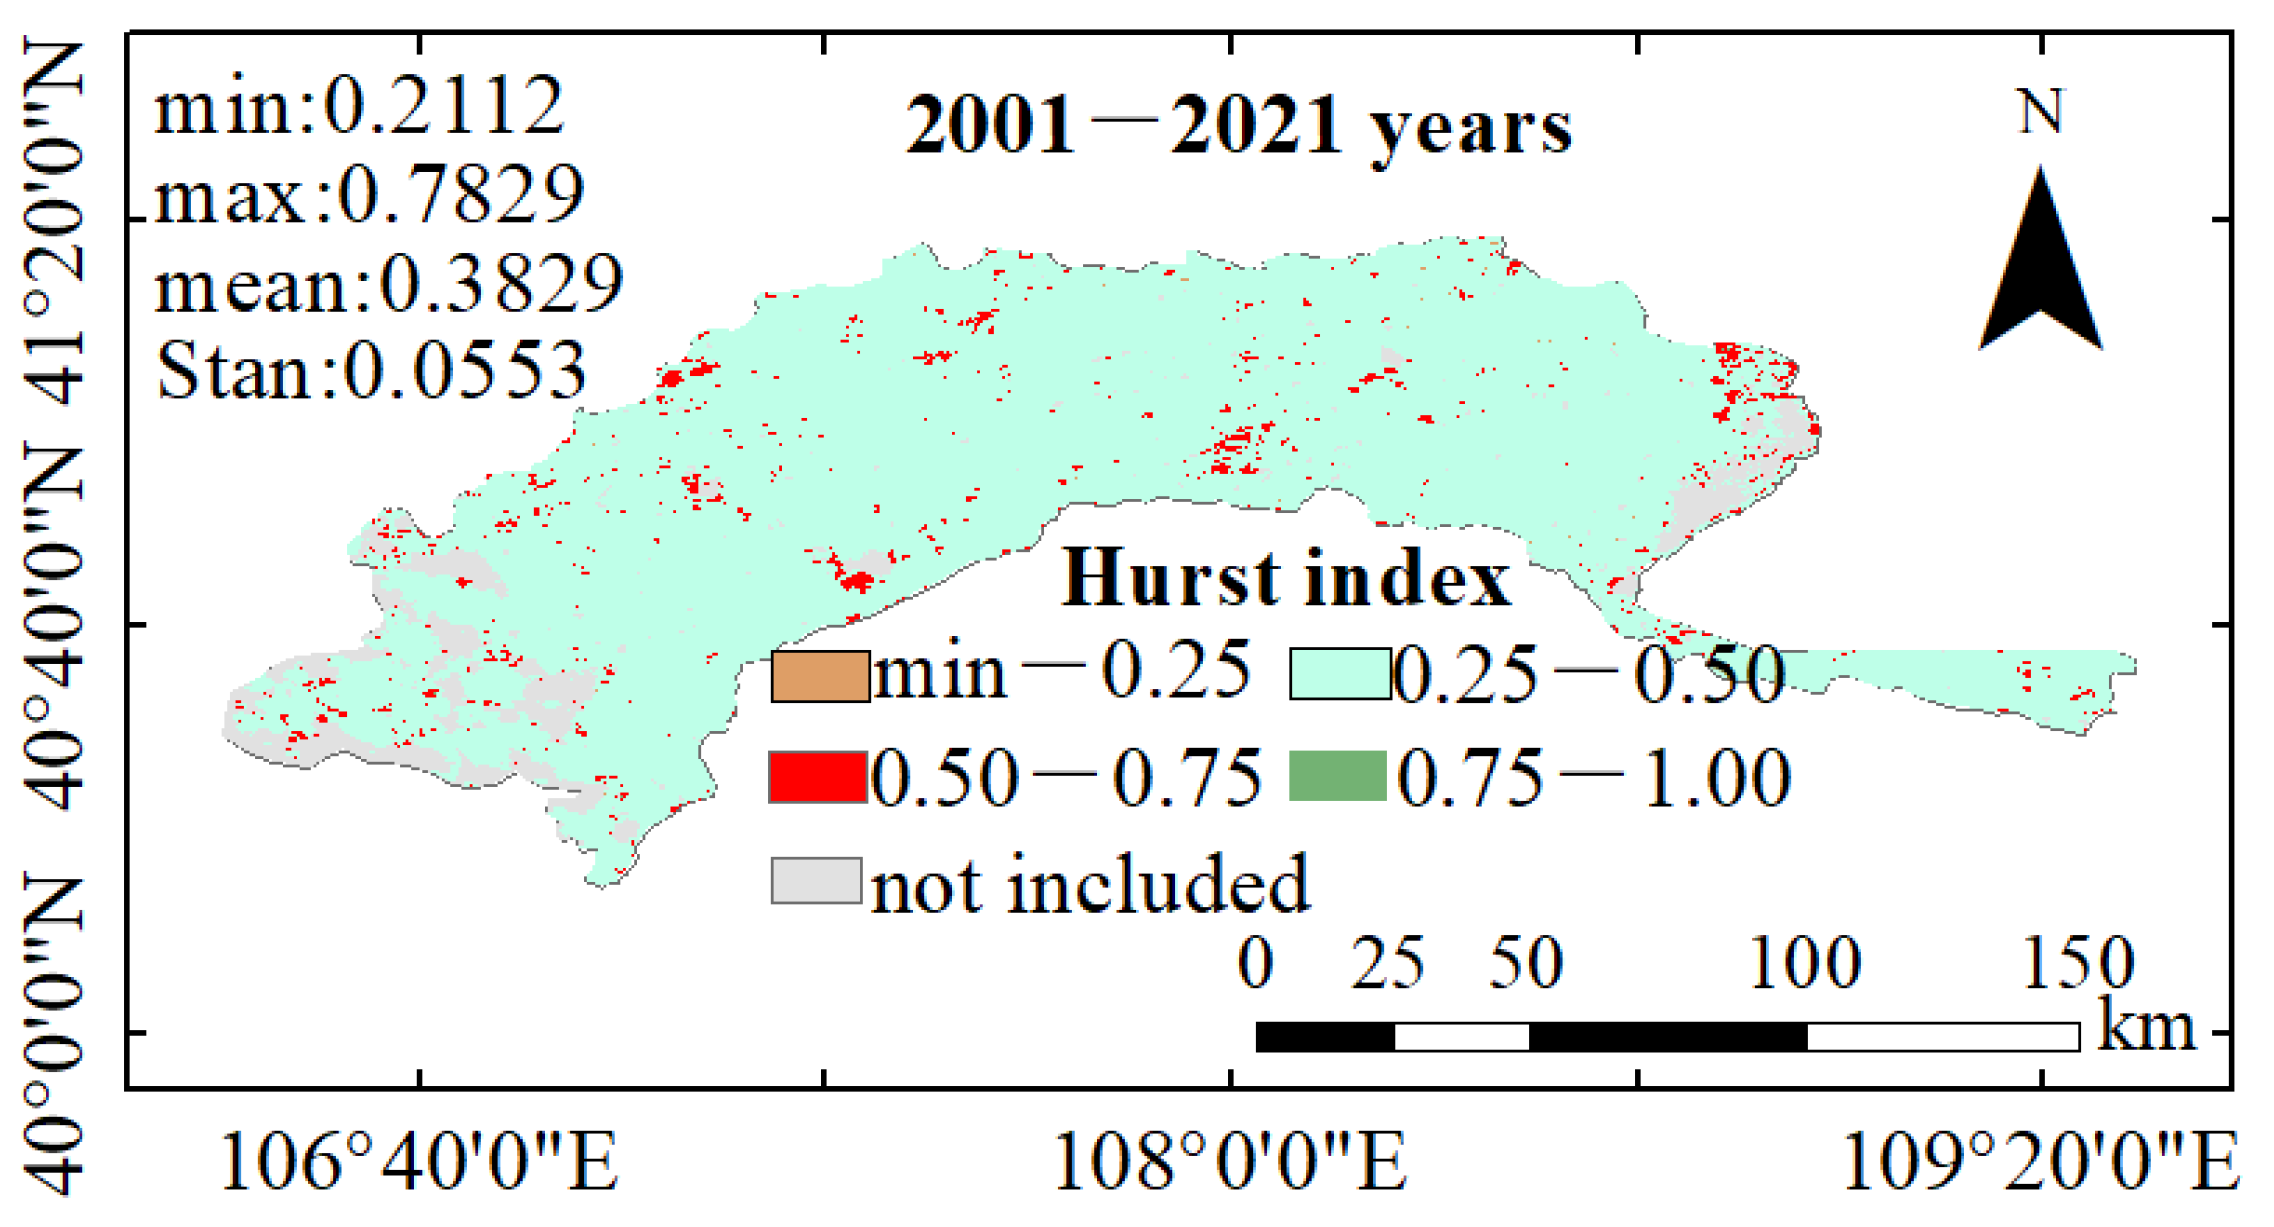
2.3.2. The Hurst Index
3. Results and Analysis
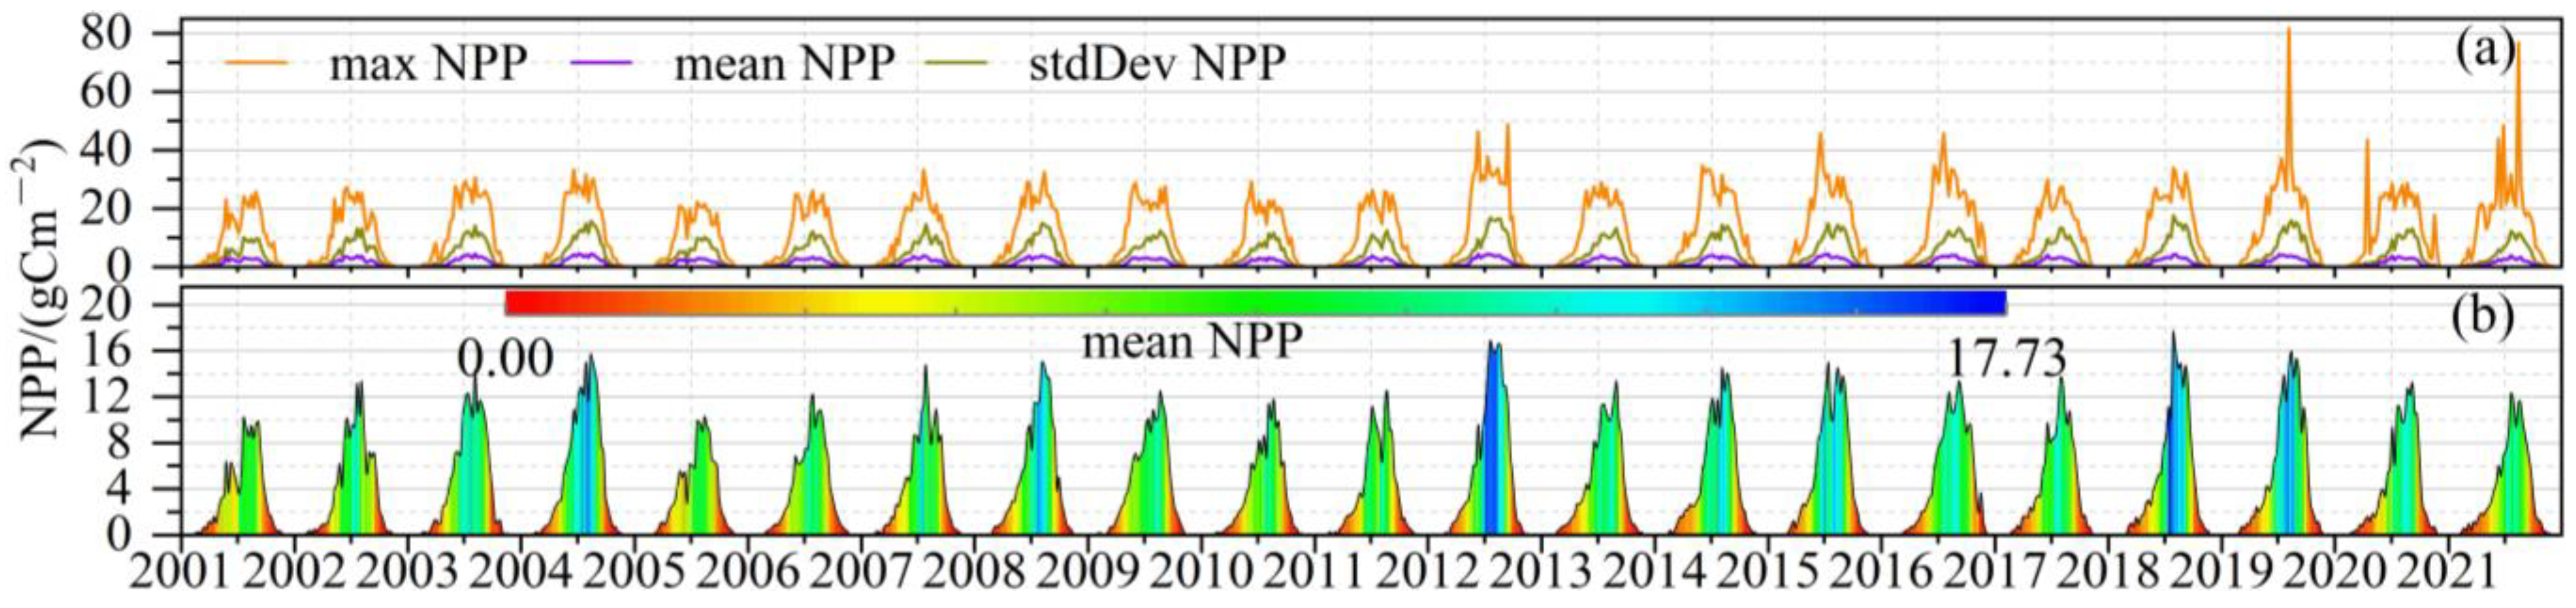
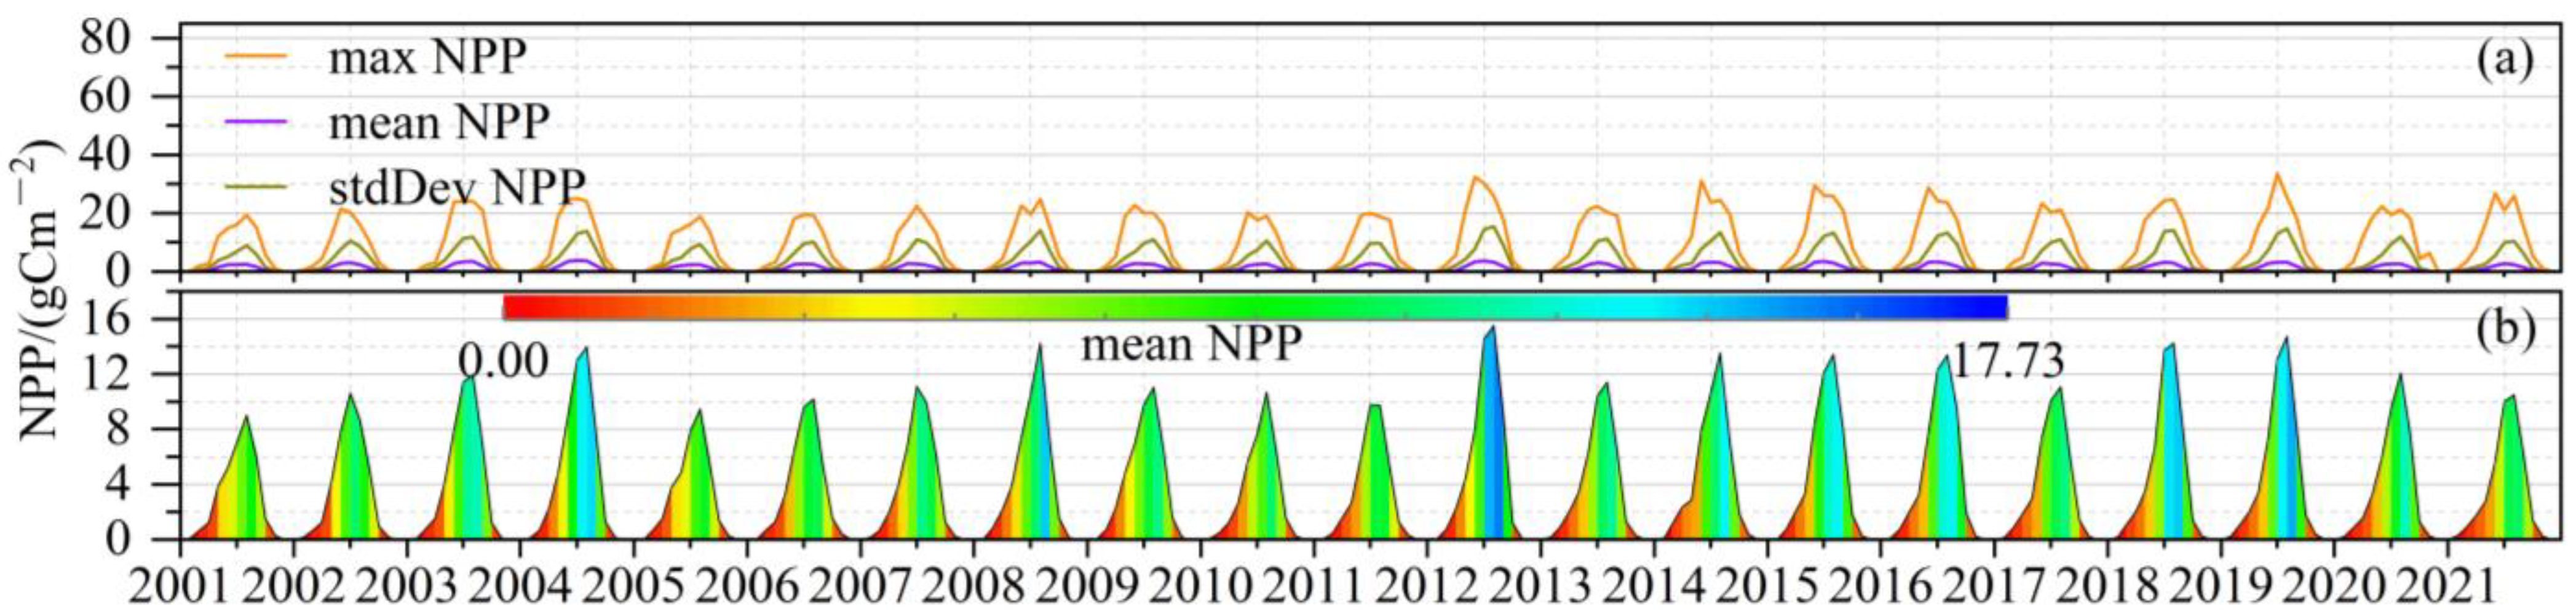
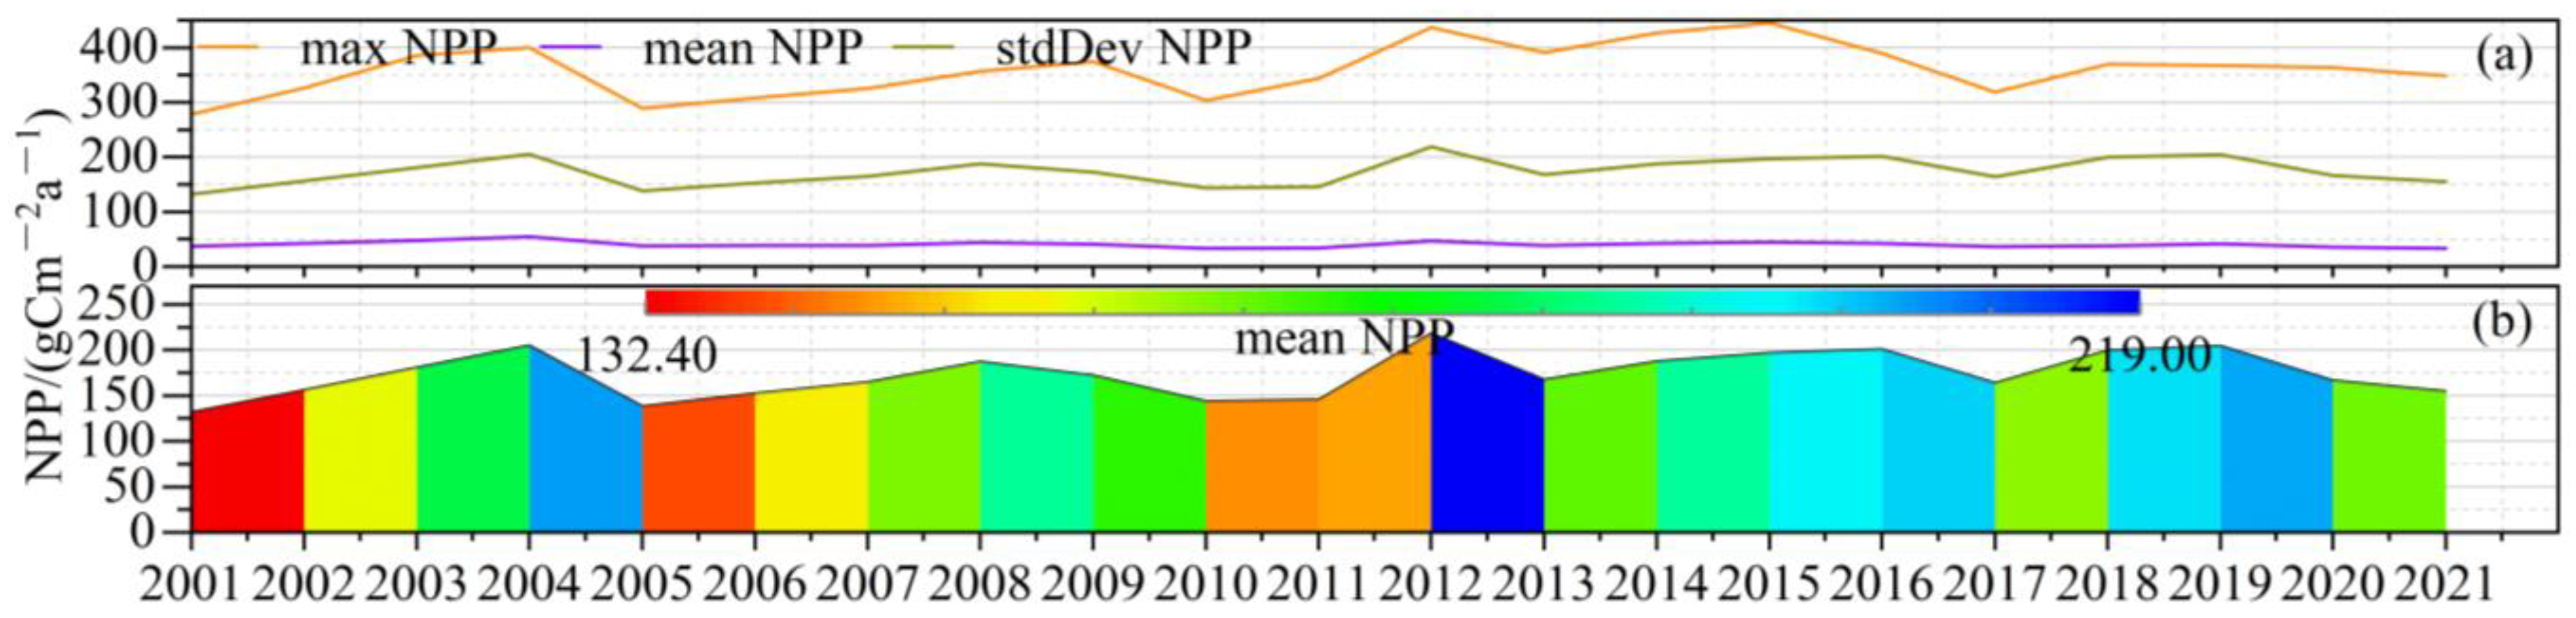
3.1. Analysis of Temporal Changes in NPP at Different Scales
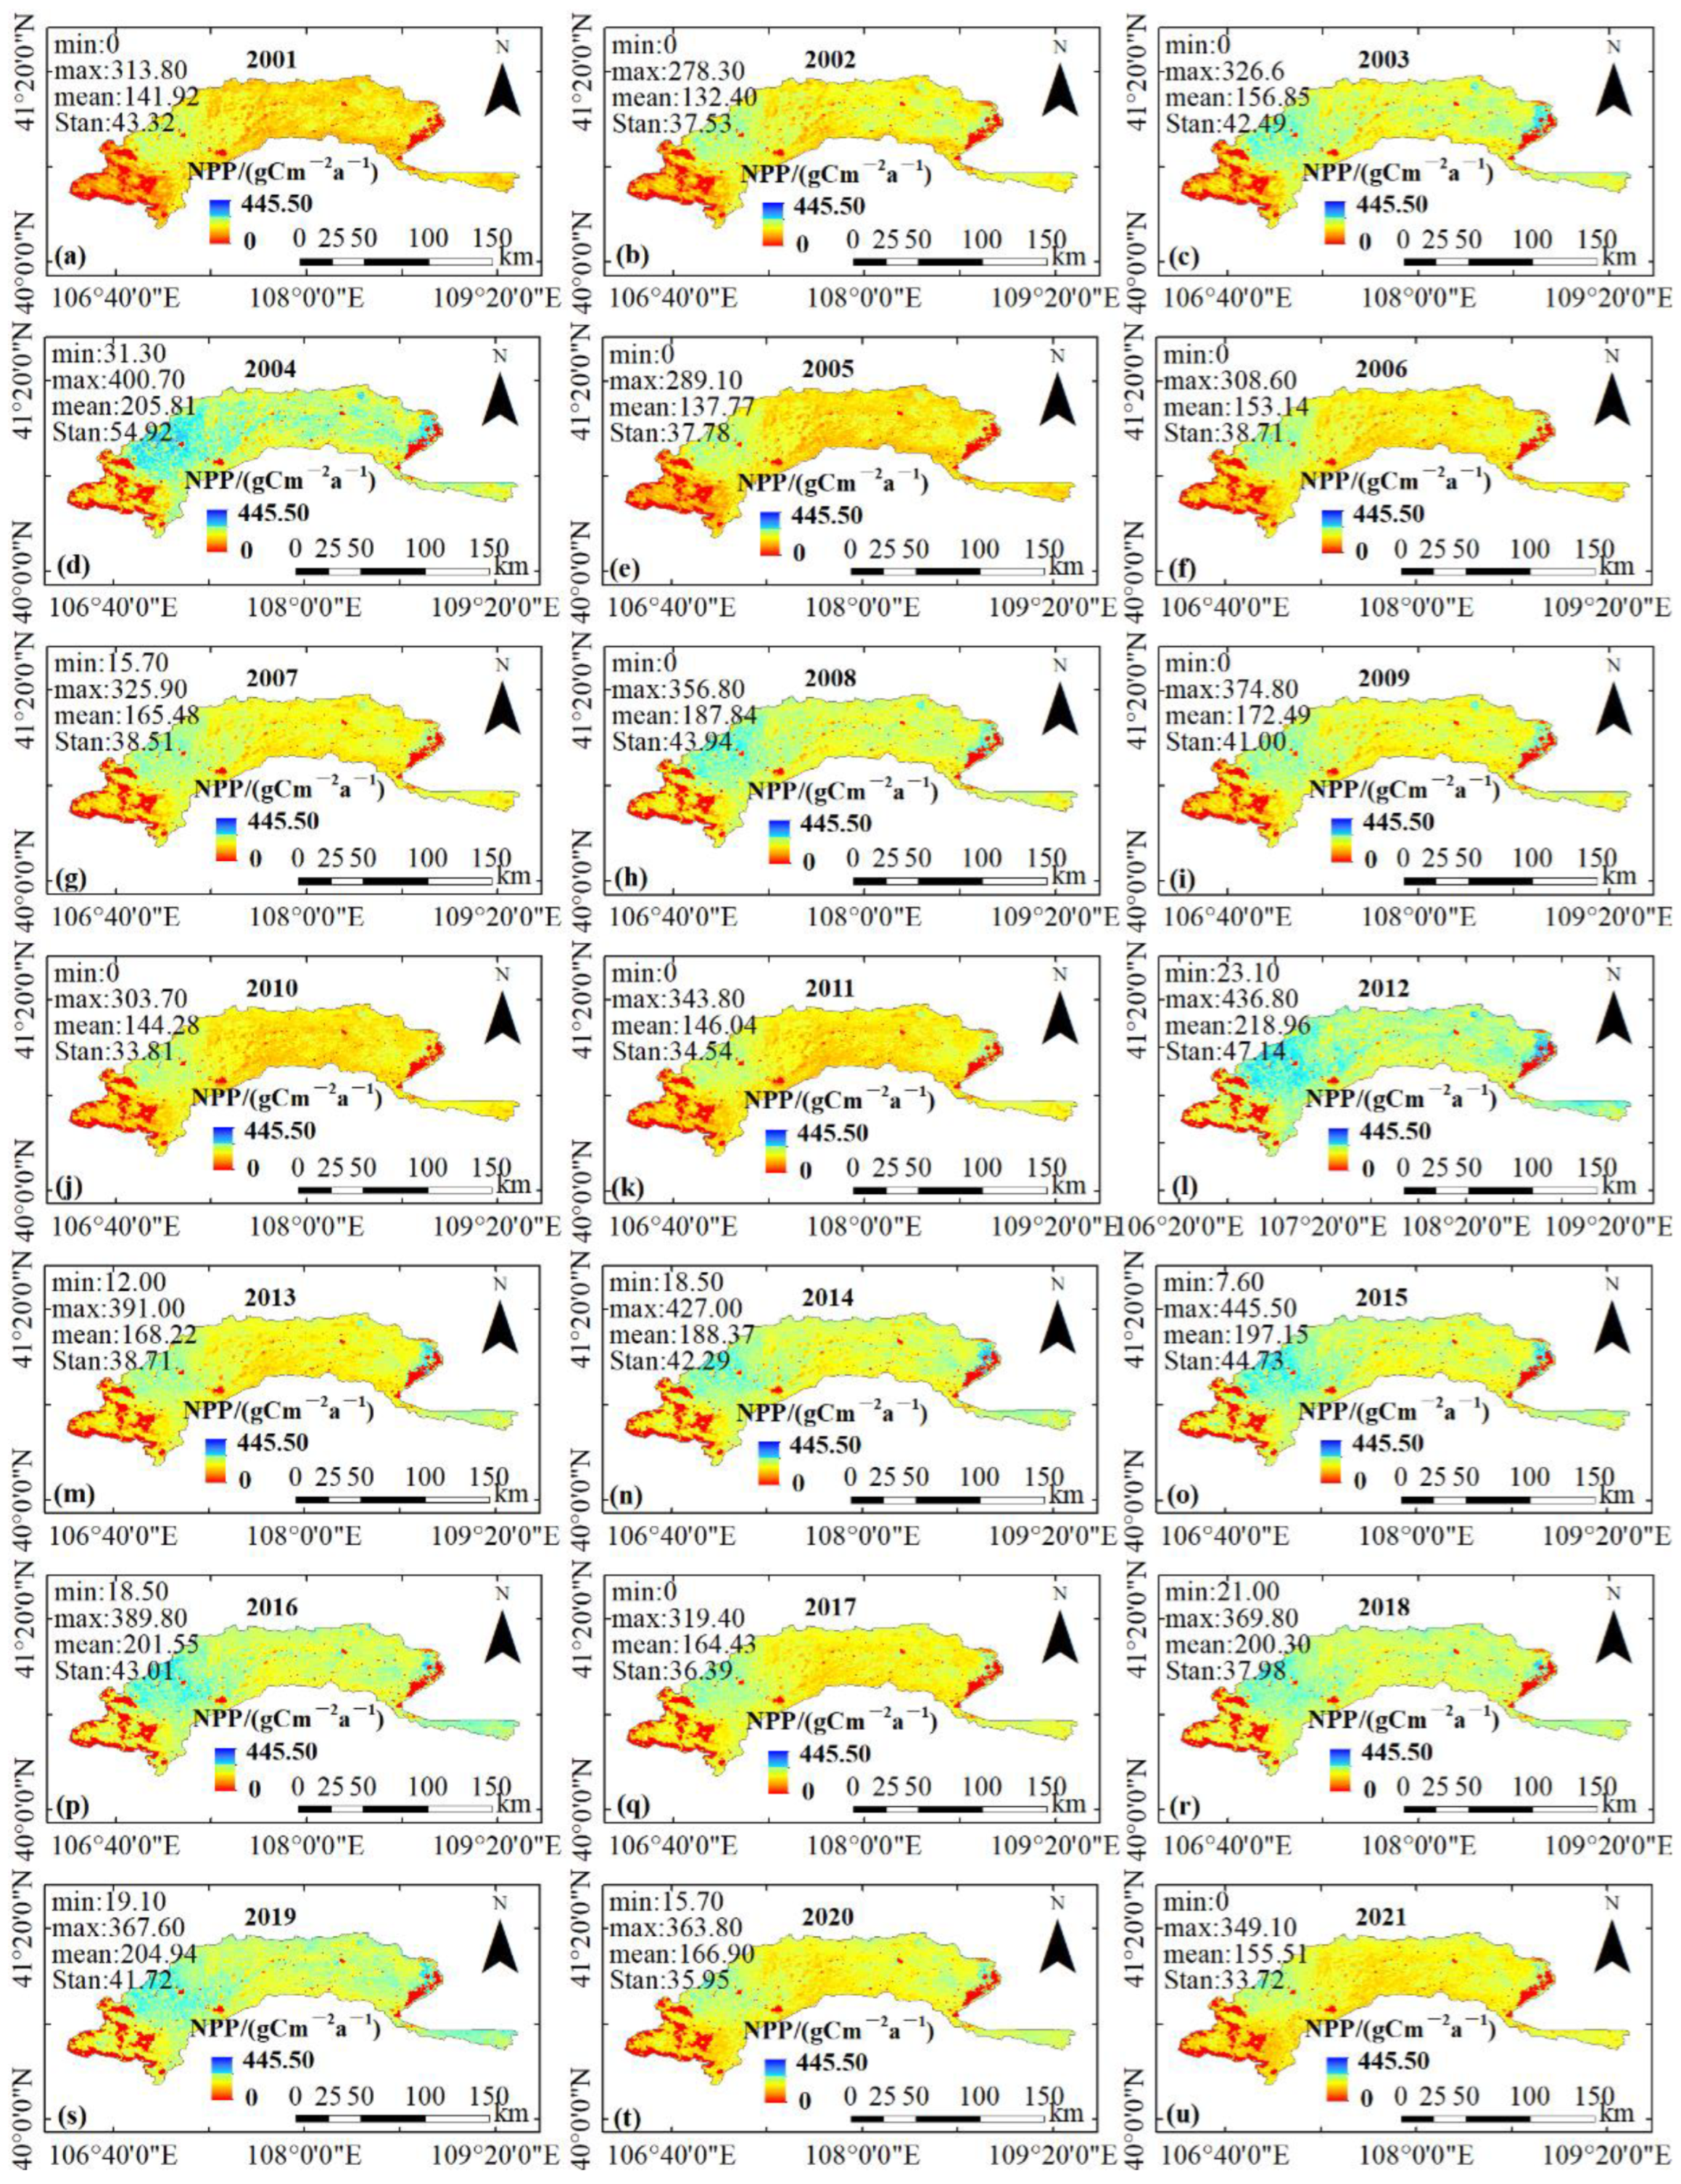
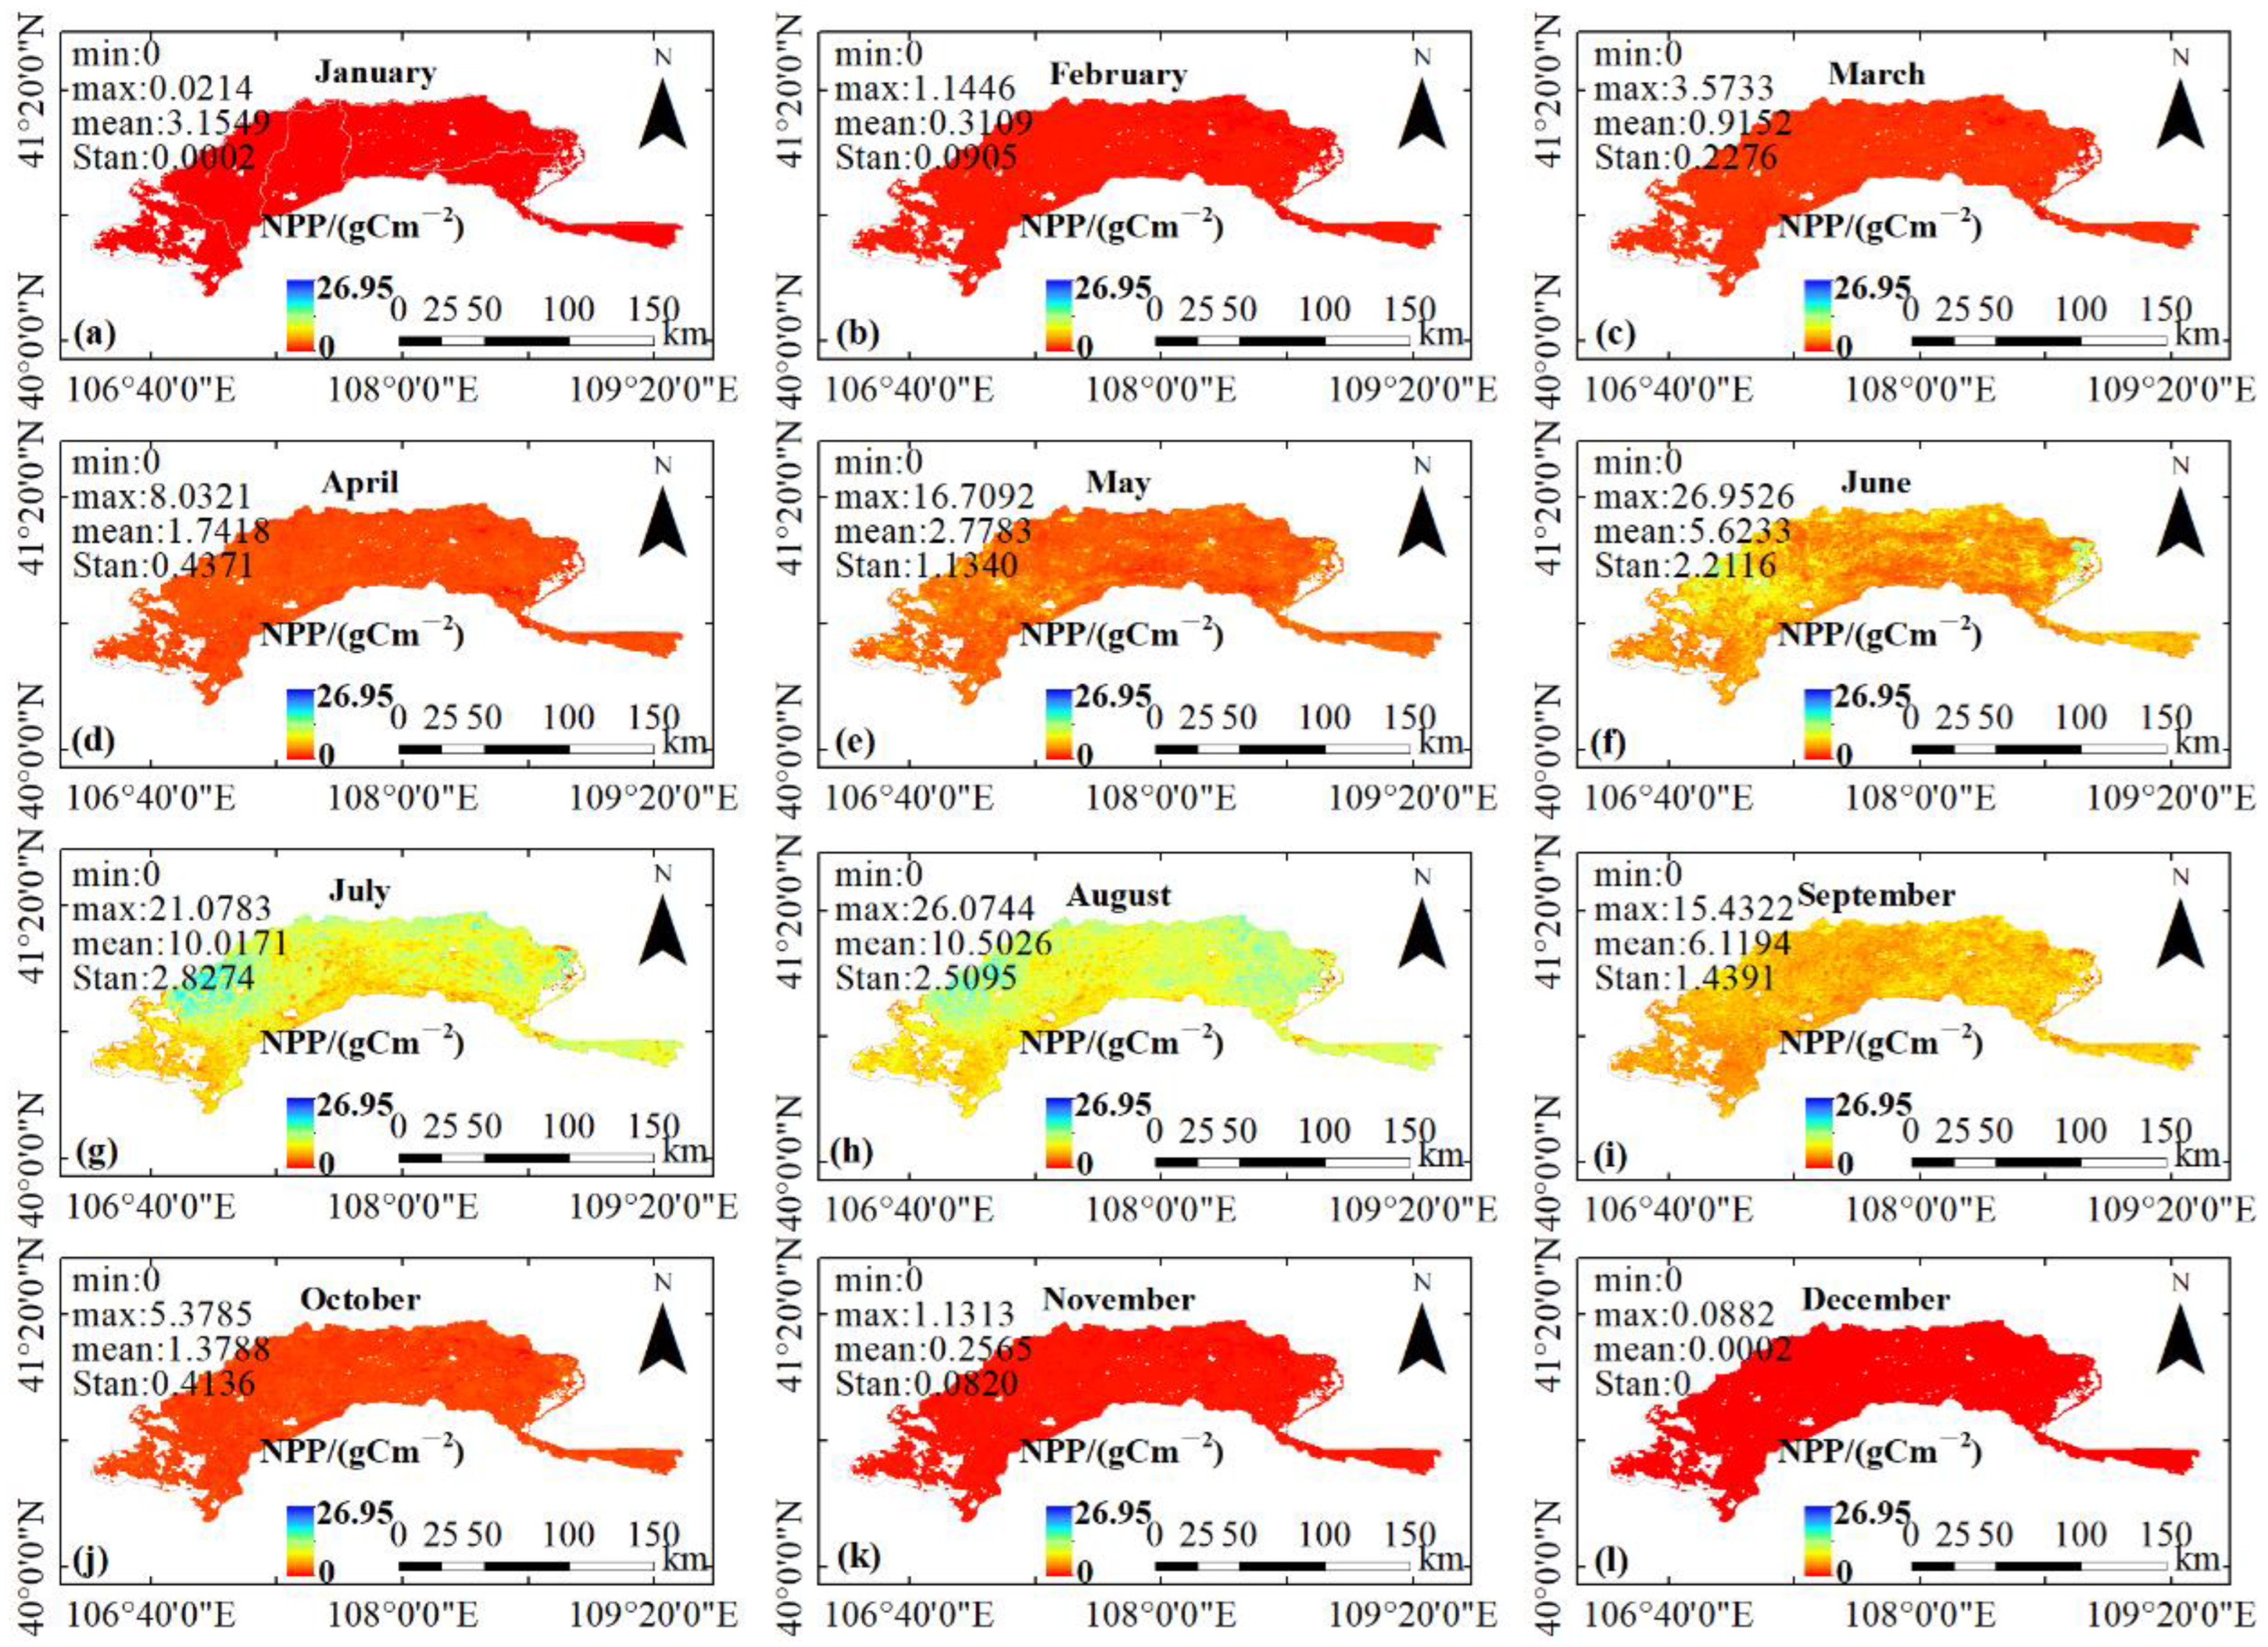
3.2. Analysis of Spatial Variation of NPP at Different Scales
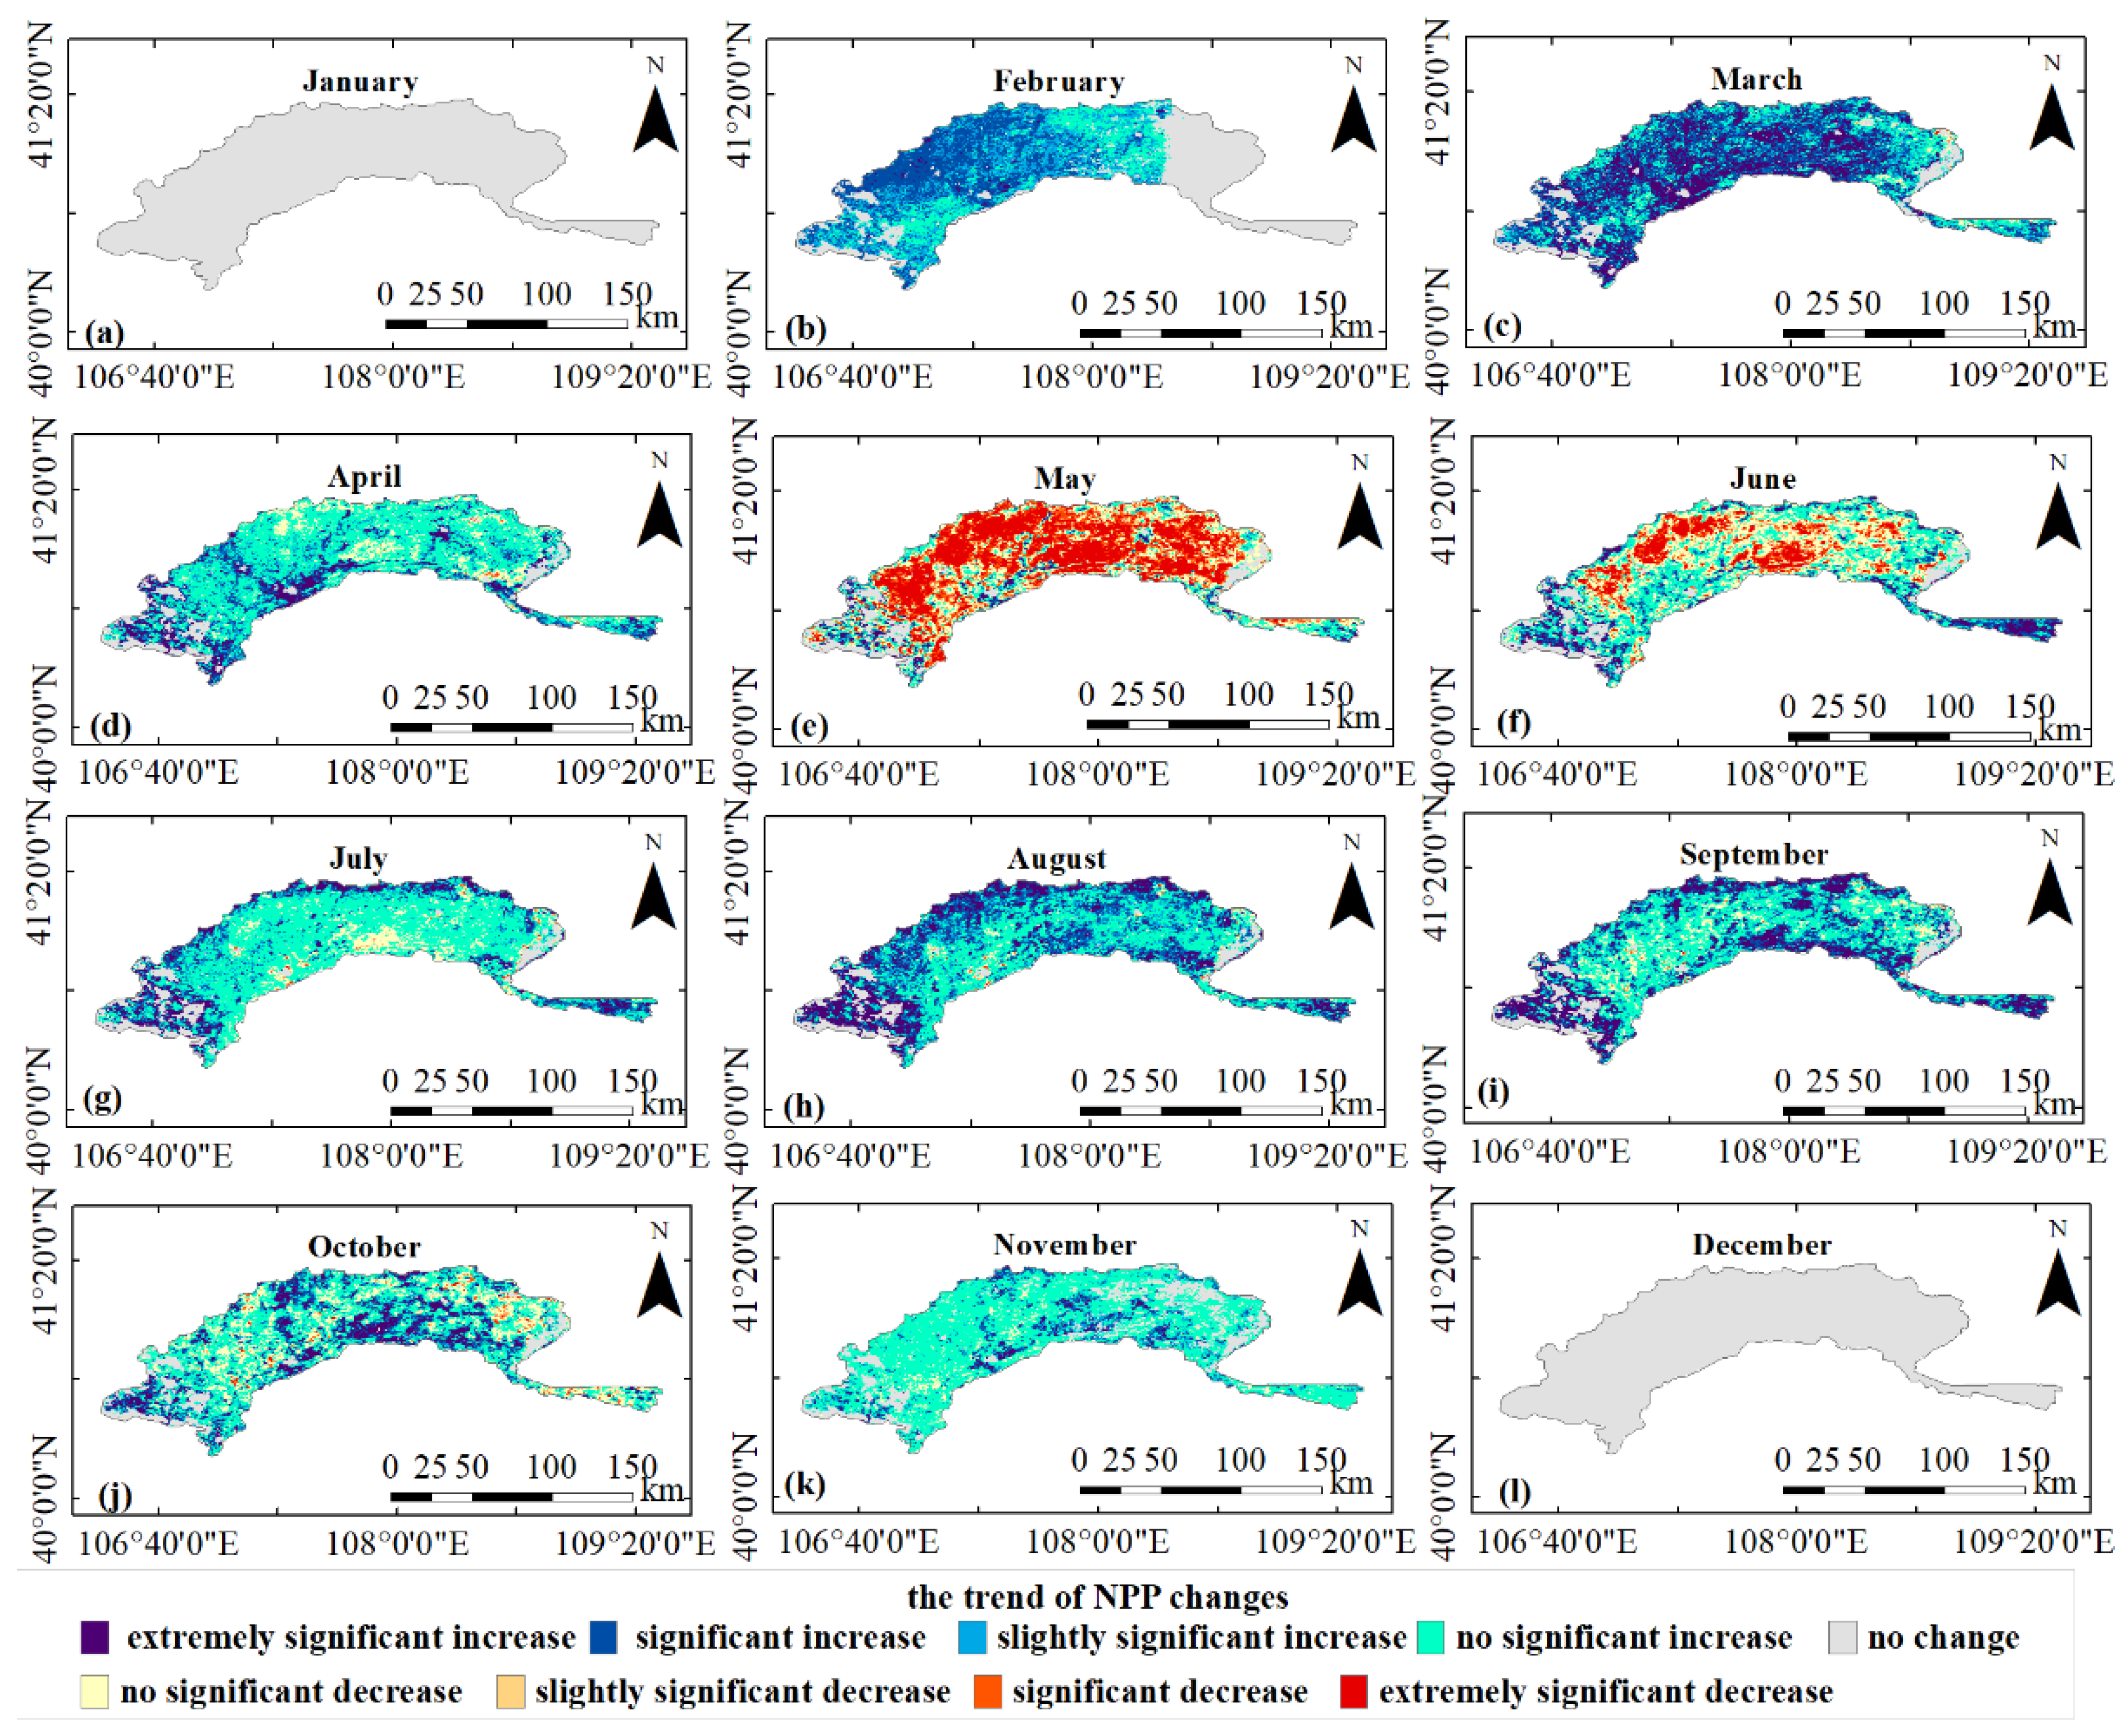
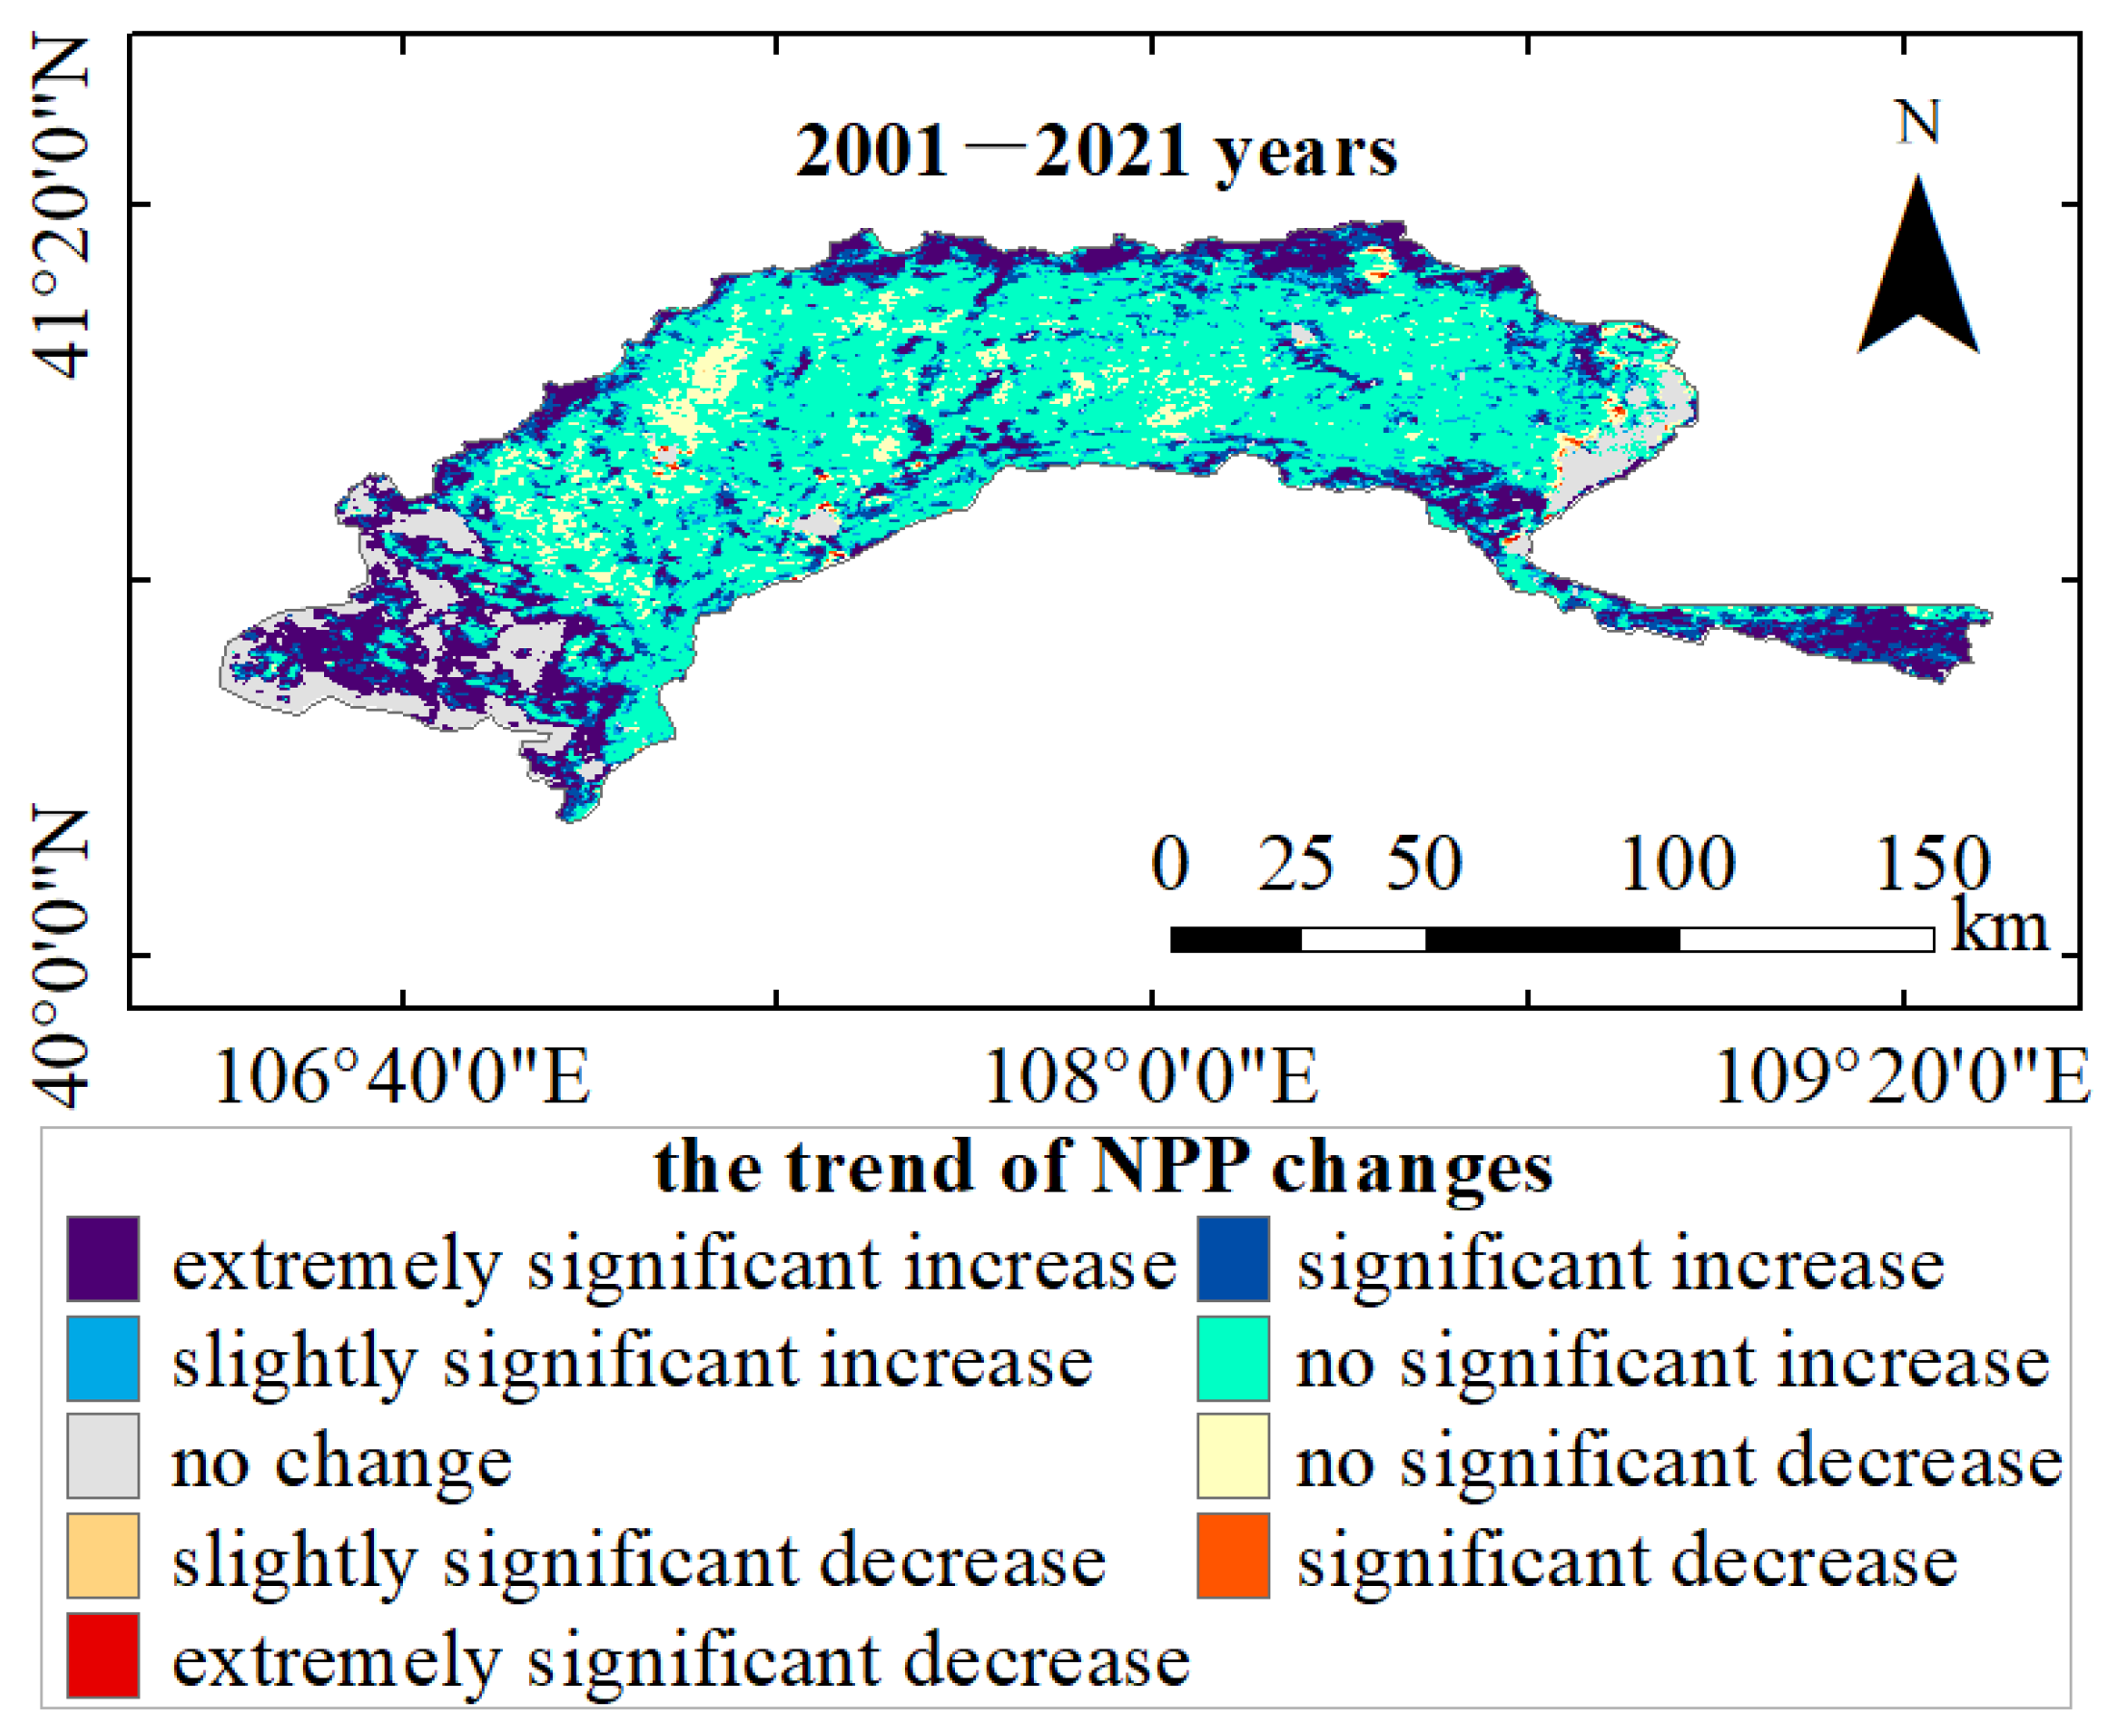
3.3. Spatial–Temporal Distributions and Variations of NPP Trend

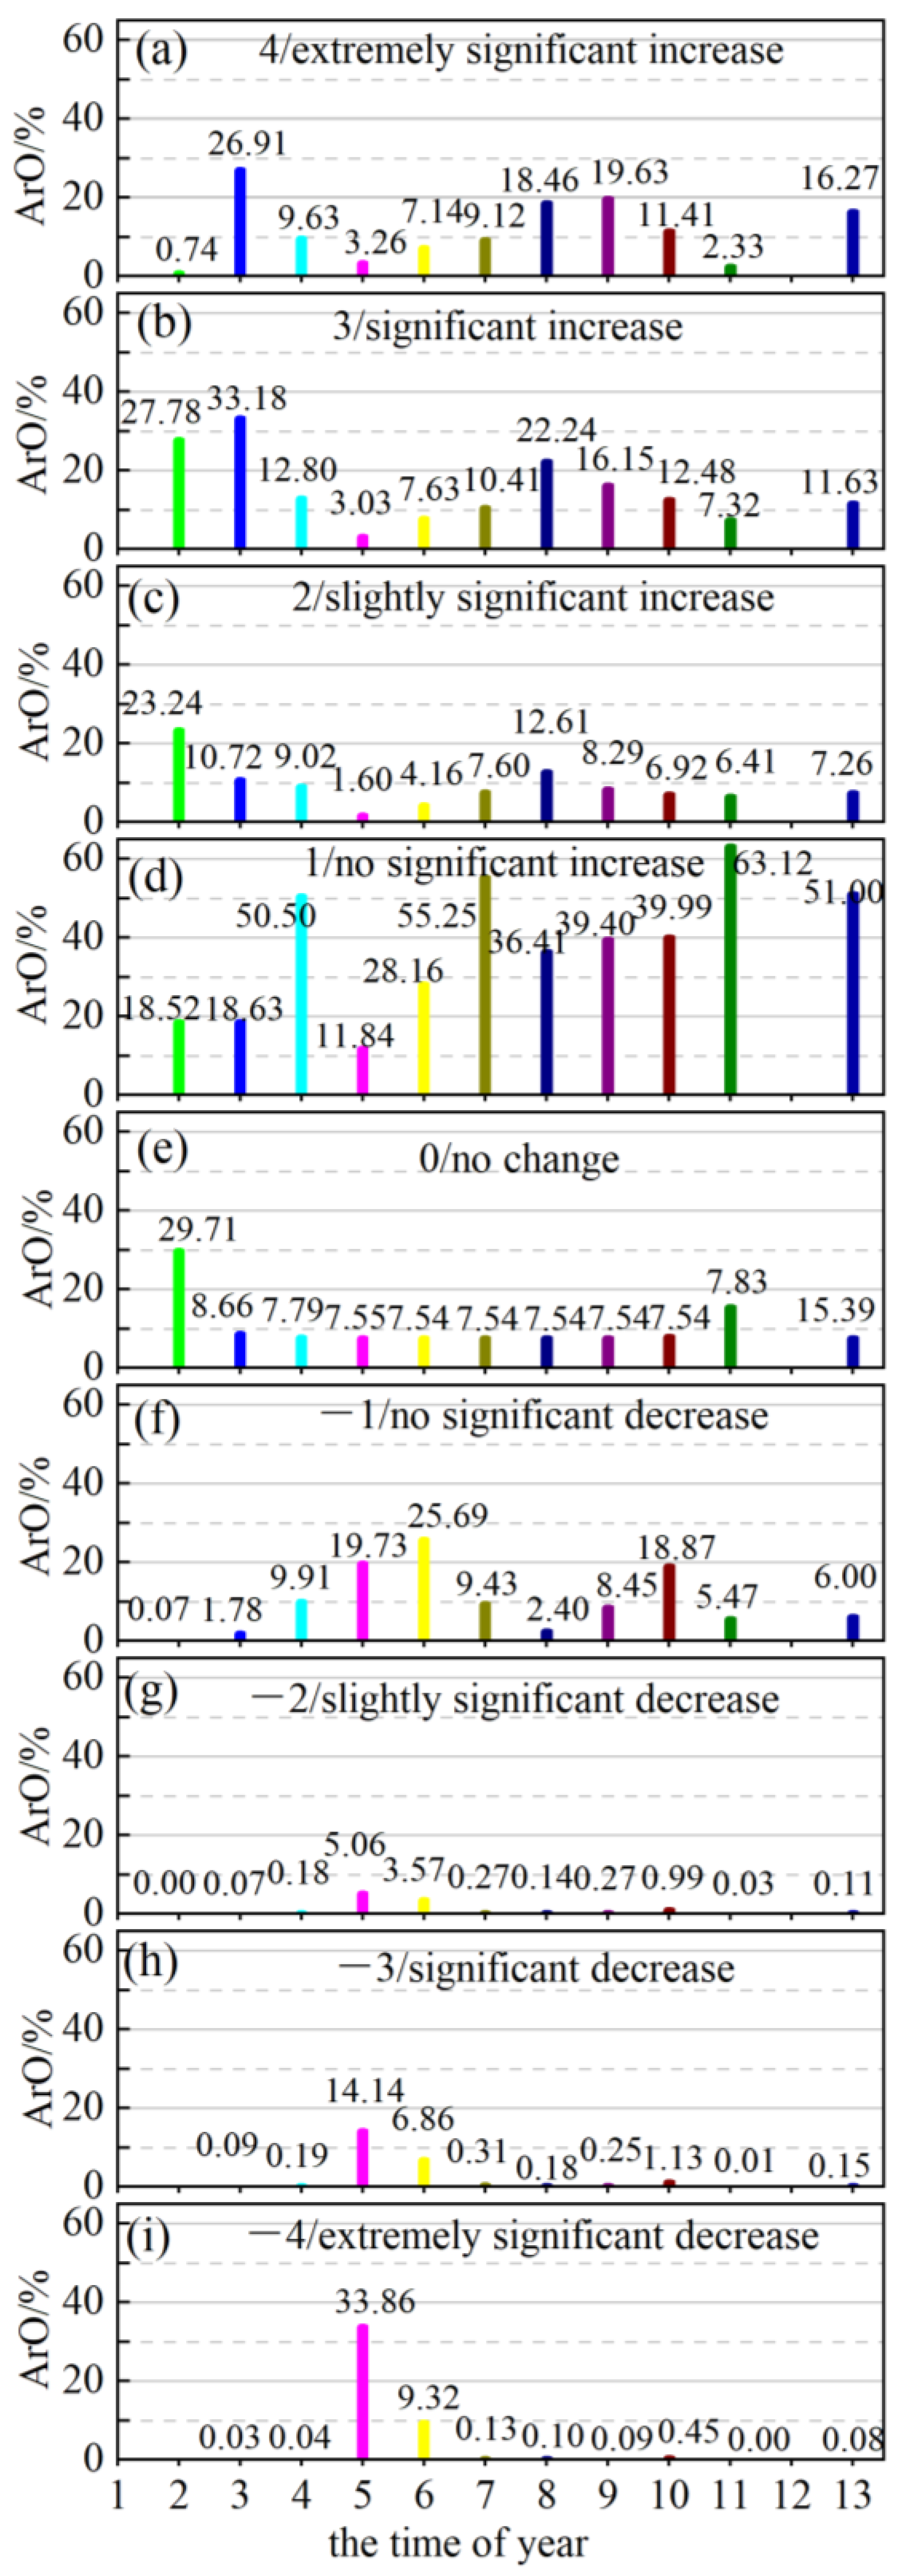
| Time | Parameter | NPP Change Trend Categories | ||||||||
|---|---|---|---|---|---|---|---|---|---|---|
| 4 | 3 | 2 | 1 | 0 | −1 | −2 | −3 | −4 | ||
| 1/January | Area | - | - | - | - | - | - | - | - | - |
| ArO | - | - | - | - | - | - | - | - | - | |
| 2/February | Area | 0.85 | 31.82 | 26.62 | 21.21 | 34.04 | 0.08 | 0 | - | - |
| ArO | 0.74 | 27.78 | 23.24 | 18.52 | 29.71 | 0.07 | 0 | - | - | |
| 3/March | Area | 30.82 | 38.00 | 12.28 | 21.34 | 9.91 | 2.04 | 0.08 | 0.11 | 0.03 |
| ArO | 26.91 | 33.18 | 10.72 | 18.63 | 8.66 | 1.78 | 0.07 | 0.09 | 0.03 | |
| 4/April | Area | 11.03 | 14.66 | 10.33 | 57.84 | 8.92 | 11.36 | 0.21 | 0.22 | 0.05 |
| ArO | 9.63 | 12.80 | 9.02 | 50.50 | 7.79 | 9.91 | 0.18 | 0.19 | 0.04 | |
| 5/May | Area | 3.74 | 3.47 | 1.83 | 13.56 | 8.65 | 22.60 | 5.80 | 16.20 | 38.78 |
| ArO | 3.26 | 3.03 | 1.60 | 11.84 | 7.55 | 19.73 | 5.06 | 14.14 | 33.86 | |
| 6/June | Area | 8.18 | 8.74 | 4.76 | 32.26 | 8.63 | 29.42 | 4.09 | 7.85 | 10.68 |
| ArO | 7.14 | 7.63 | 4.16 | 28.16 | 7.54 | 25.69 | 3.57 | 6.86 | 9.32 | |
| 7/July | Area | 10.45 | 11.93 | 8.71 | 63.28 | 8.63 | 10.80 | 0.31 | 0.35 | 0.15 |
| ArO | 9.12 | 10.41 | 7.60 | 55.25 | 7.54 | 9.43 | 0.27 | 0.31 | 0.13 | |
| 8/August | Area | 21.15 | 25.47 | 14.45 | 41.71 | 8.63 | 2.75 | 0.16 | 0.21 | 0.11 |
| ArO | 18.46 | 22.24 | 12.61 | 36.41 | 7.54 | 2.40 | 0.14 | 0.18 | 0.10 | |
| 9/September | Area | 22.48 | 18.50 | 9.49 | 45.13 | 8.63 | 9.68 | 0.31 | 0.29 | 0.10 |
| ArO | 19.63 | 16.15 | 8.29 | 39.40 | 7.56 | 8.45 | 0.27 | 0.25 | 0.09 | |
| 10/October | Area | 13.06 | 14.30 | 7.92 | 45.80 | 8.97 | 21.61 | 1.14 | 1.29 | 0.52 |
| ArO | 11.41 | 12.48 | 6.92 | 39.99 | 7.83 | 18.87 | 0.99 | 1.13 | 0.45 | |
| 11/November | Area | 2.67 | 8.39 | 7.34 | 72.30 | 17.63 | 6.26 | 0.03 | 0.01 | - |
| ArO | 2.33 | 7.32 | 6.41 | 63.12 | 15.39 | 5.47 | 0.03 | 0.01 | - | |
| 12/December | Area | - | - | - | - | - | - | - | - | - |
| ArO | - | - | - | - | - | - | - | - | - | |
| 13/Year | Area | 18.63 | 13.32 | 8.32 | 58.42 | 8.66 | 6.87 | 0.13 | 0.17 | 0.10 |
| ArO | 16.27 | 11.63 | 7.26 | 51.00 | 7.56 | 6.00 | 0.11 | 0.15 | 0.08 | |
3.4. Future Trend Prediction of NPP Spatiotemporal Changes
4. Conclusions
Author Contributions
Funding
Institutional Review Board Statement
Informed Consent Statement
Data Availability Statement
Conflicts of Interest
References
- Gang, C.; Zhou, W.; Chen, Y.; Wang, Z.; Sun, Z.; Li, J.; Qi, J.; Odeh, I. Quantitative assessment of the contributions of climate change and human activities on global grassland degradation. Environ. Earth Sci. 2014, 72, 4273–4282. [Google Scholar] [CrossRef]
- Zhang, F.; Hu, X.; Zhang, J.; Li, C.; Zhang, Y.; Li, X. Change in Alpine Grassland NPP in response to climate variation and human activities in the Yellow River Source Zone from 2000 to 2020. Sustainability 2022, 14, 8790. [Google Scholar] [CrossRef]
- Li, Z.; Liu, S.; Tan, Z.; Bliss, N.; Young, C.; West, T.; Ogle, S. Comparing cropland net primary production estimates from inventory, a satellite-based model, and a process-based model in the Midwest of the United States. Ecol Modell. 2014, 277, 1–12. [Google Scholar] [CrossRef]
- Kumar, M.; Singh, R.; Panigrahy, S.; Raghubanshi, A. Carbon density and accumulation in agroecosystem of Indo-Gangetic Plains and Vindhyan highlands. India. Environ. Monit. Assess. 2014, 186, 4971–4985. [Google Scholar] [CrossRef] [PubMed]
- Wang, Y.; Xu, X.; Huang, L.; Yang, G.; Fan, L.; Wei, P.; Chen, G. An improved CASA model for estimating winter wheat yield from remote sensing images. Remote Sens. 2019, 11, 1088. [Google Scholar] [CrossRef]
- Huang, X.; Yang, Y.; Chen, C.; Zhao, H.; Yao, B.; Ma, Z.; Ma, L.; Zhou, H. Quantifying and mapping human appropriation of net Primary productivity in Qinghai Grasslands in China. Agriculture 2022, 12, 1113. [Google Scholar] [CrossRef]
- Koju, U.; Zhang, J.; Maharjan, S.; Bai, Y.; Zhang, S.; Yao, F. Analysis of spatiotemporal dynamics of forest Net Primary Productivity of Nepal during 2000–2015. Int. J. Remote Sens. 2020, 41, 4336–4364. [Google Scholar] [CrossRef]
- Gang, C.; Zhou, W.; Wang, Z.; Chen, Y.; Li, J.; Chen, J.; Qi, J.; Odeh, I.; Groisman, P. Comparative assessment of grassland NPP dynamics in response to climate change in China, North America, Europe and Australia from 1981 to 2010. Agron. Crop. Sci. 2015, 201, 57–68. [Google Scholar] [CrossRef]
- Wang, Y.; Yue, H.; Peng, Q.; He, C.; Hong, S.; Bryan, B. Recent responses of grassland net primary productivity to climatic and anthropogenic factors in Kyrgyzstan. Land Degrad. Dev. 2020, 31, 2490–2506. [Google Scholar] [CrossRef]
- Peng, M.; Han, W.; Li, C.; Li, G.; Yao, X.; Zhang, M. Diurnal and seasonal CO2 exchange and yield of maize cropland under different irrigation treatments in semiarid Inner Mongolia. Agric. Water Manag. 2021, 255, 107041. [Google Scholar] [CrossRef]
- Li, C.; Han, W.; Peng, M. Improving the spatial and temporal estimating of daytime variation in maize net primary production using unmanned aerial vehicle-based remote sensing. Int. J. Appl. Earth Obs. Geoinf. 2021, 103, 102467. [Google Scholar] [CrossRef]
- Li, C.; Han, W.; Peng, M.; Zhang, F. Abiotic and biotic factors contribute to CO2 exchange variation at the hourly scale in a semiarid maize cropland. Sci. Total Environ. 2021, 784, 147170. [Google Scholar] [CrossRef] [PubMed]
- Peng, M.; Han, W.; Li, C.; Li, G.; Yao, X.; Shao, G. Modeling the daytime net primary productivity of maize at the canopy scale based on UAV multispectral imagery and machine learning. J. Clean. Prod. 2022, 367, 133041. [Google Scholar] [CrossRef]
- Zhang, Q.; Lei, H.; Yang, D.; Xiong, L.; Liu, P.; Fang, B. Decadal variation in CO2 fluxes and its budget in a wheat and maize rotation cropland over the North China Plain. Biogeosciences 2020, 17, 2245–2262. [Google Scholar] [CrossRef]
- Dugas, W.; Heuer, M.; Mayeux, H. Carbon dioxide fluxes over bermudagrass, native prairie, and sorghum. Agric. For. Meteorol. 1999, 93, 121–139. [Google Scholar] [CrossRef]
- Yang, F.; He, P.; Ding, H.; Shi, Y. A Monthly High-Resolution Net Primary Productivity Dataset (30 m) of Qinghai Plateau From 1987 to 2021. IEEE J. Sel. Top. Appl. Earth Observ. Remote Sens. 2023, 16, 8262–8273. [Google Scholar] [CrossRef]
- Wang, F.; Wang, F.; Hu, J.; Xie, L.; Yao, X. Rice yield estimation based on an NPP model with a changing harvest index. IEEE J. Sel. Top. Appl. Earth Obs. Remote Sens. 2020, 13, 2953–2959. [Google Scholar] [CrossRef]
- Zhao, J.; Liu, D.; Zhu, Y.; Peng, H.; Xie, H. A review of forest carbon cycle models on spatiotemporal scales. J. Clean. Prod. 2022, 339, 130692. [Google Scholar] [CrossRef]
- Cuo, L.; Zhang, Y.; Xu, R.; Zhou, B. Decadal change and inter-annual variability of net primary productivity on the Tibetan Plateau. Clim. Dyn. 2021, 56, 1837–1857. [Google Scholar] [CrossRef]
- Du, H.; Mao, F.; Zhao, G.; Li, X.; Xu, X.; Ge, H.; Cui, L.; Liu, Y.; Zhu, D.; Li, Y. Estimating and Analyzing the spatiotemporal pattern of aboveground carbon in bamboo forest by combining remote sensing data and improved BIOME-BGC model. IEEE J. Sel. Top. Appl. Earth Observ. Remote Sens. 2022, 11, 2282–2295. [Google Scholar] [CrossRef]
- Zhu, L.; Sun, W.; Wu, J.; Fan, D. Spatiotemporal distribution of carbon sink indicators-NPP and its driving analysis in ordos city, China. Appl. Sci. 2023, 13, 6457. [Google Scholar] [CrossRef]
- Xue, P.; Liu, H.; Zhang, M.; Gong, H.; Cao, L. Nonlinear characteristics of NPP based on ensemble empirical mode decomposition from 1982 to 2015—A case study of six coastal provinces in southeast China. Remote Sens. 2021, 14, 15. [Google Scholar] [CrossRef]
- Yang, H.; Zhong, X.; Deng, S.; Xu, H. Assessment of the impact of LUCC on NPP and its influencing factors in the Yangtze River basin, China. Catena 2021, 206, 105542. [Google Scholar] [CrossRef]
- Cao, Z.; Zhu, T.; Cai, X. Hydro-agro-economic optimization for irrigated farming in an arid region: The Hetao Irrigation District, Inner Mongolia. Agric. Water Manag. 2023, 277, 108095. [Google Scholar] [CrossRef]
- Wan, W.; Lin, Z.; Li, B.; Fang, H.; Wu, H.; Yang, H. Evaluating soil erosion by introducing crop residue cover and anthropogenic disturbance intensity into cropland C-factor calculation: Novel estimations from a cropland-dominant region of Northeast China. Soil Tillage Res. 2022, 219, 105343. [Google Scholar] [CrossRef]
- Hao, L.; Wang, S.; Cui, X.; Zhai, Y. Spatiotemporal dynamics of vegetation net primary productivity and its response to climate change in Inner Mongolia from 2002 to 2019. Sustainability 2021, 13, 13310. [Google Scholar] [CrossRef]
- Li, J.; Cui, Y.; Liu, J.; Shi, W.; Qin, Y. Estimation and analysis of net primary productivity by integrating MODIS remote sensing data with a light use efficiency model. Ecol. Modell. 2013, 252, 3–10. [Google Scholar] [CrossRef]
- Wang, Z.; Zhong, J.; Lan, H.; Wang, Z.; Sha, Z. Association analysis between spatiotemporal variation of net primary productivity and its driving factors in inner mongolia, china during 1994–2013. Ecol. Indic. 2019, 105, 355–364. [Google Scholar] [CrossRef]
- Wang, X.; Wei, Y.; Yang, J. Analysis on water cycling in GSPAC system of Hetao Irrigation District, in Inner Mongolia, China. J. Irrig. Drain. Eng. 2004, 23, 30–33. [Google Scholar]
- Xu, X.; Huang, G.; Qu, Z.; Pereira, L. Assessing the groundwater dynamics and impacts of water saving in the Hetao Irrigation District, Yellow River basin. Agric. Water Manag. 2010, 98, 301–313. [Google Scholar] [CrossRef]
- Son, S.; Wang, M.; Harding, L. Satellite-measured net primary production in the Chesapeake Bay. Remote Sens. Environ. Mar. 2014, 144, 109–119. [Google Scholar] [CrossRef]
- Sen, P. Estimates of the regression coefficient based on Kendall’s tau. J. Am. Stat. Assoc. 1968, 63, 1379–1389. [Google Scholar] [CrossRef]
- Theil, H. A rank-invariant method of linear and polynomial regression analysis. Indag. Math. 1950, 12, 173. [Google Scholar]
- Burn, D.; Elnur, M. Detection of hydrologic trends and variability. J. Hydrodyn. 2002, 255, 107–122. [Google Scholar] [CrossRef]
- Zhang, Y.; Gong, J.; Yang, J.; Peng, J. Evaluation of future trends based on the characteristics of net primary production (NPP) changes over 21 years in the Yangtze River Basin in China. Sustainability 2023, 15, 10606. [Google Scholar] [CrossRef]
- Zhang, K.; Kimball, J.; McDonald, K.; Cassano, J.; Running, S. Impacts of large-scale oscillations on pan-Arctic terrestrial net primary production. Geophys. Res. Lett. 2007, 34, L21403. [Google Scholar] [CrossRef]
- Wang, S.; Huang, K.; Yan, H.; Yan, H.; Zhou, L.; Wang, H.; Zhang, J.; Yan, J.; Zhao, L.; Wang, Y.; et al. Improving the light use efficiency model for simulating terrestrial vegetation gross primary production by the inclusion of diffuse radiation across ecosystems in China. Ecol. Complex. 2015, 23, 1–13. [Google Scholar] [CrossRef]
- Xi, M.; Zhang, X.; Kong, F.; Li, Y.; Sui, X.; Wang, X. CO2 exchange under different vegetation covers in a coastal wetland of Jiaozhou Bay, China. Ecol. Eng. 2019, 137, 26–33. [Google Scholar] [CrossRef]
- Peng, M.; Han, W.; Li, C.; Huang, S. Improving the spatial and temporal estimation of maize daytime net ecosystem carbon exchange variation based on unmanned aerial vehicle multispectral remote sensing. IEEE J. Sel. Top. Appl. Earth Observ. Remote Sens. 2021, 14, 10560–10570. [Google Scholar] [CrossRef]
- Lyapustin, A.; Wang, Y.; Xiong, X.; Meister, G.; Platnick, S. Scientific impact of MODIS C5 calibration degradation and C6 improvement. Atmos. Meas. Tech. 2014, 7, 4353–4365. [Google Scholar] [CrossRef]
- Jahelnabi, A.; Wu, W.; Boloorani, A.; Salem, H.; Nazeer, M.; Fadoul, S.; Khan, M. Assessment the influence of climate and human activities in vegetation degradation using GIS and remote sensing techniques. Contemp. Probl. Ecol. 2020, 13, 685–693. [Google Scholar] [CrossRef]
- Xu, Y.; Lu, Y.; Zou, B.; Xu, M.; Feng, Y. Unraveling the enigma of NPP variation in Chinese vegetation ecosystems: The interplay of climate change and land use change. Sci. Total Environ. 2024, 912, 169023. [Google Scholar] [CrossRef] [PubMed]
- Wang, W.; Wang, J.; Liu, X.; Zhou, G.; Yan, J. Decadal drought deaccelerated the increasing trend of annual net primary production in tropical or subtropical forests in southern China. Sci. Rep. 2016, 6, 28640. [Google Scholar] [CrossRef] [PubMed]
- Zhang, W.; Chen, S.; Chen, J.; Wei, L.; Han, X.; Lin, G. Biophysical regulations of carbon fluxes of a steppe and a cultivated cropland in semiarid Inner Mongolia. Agric. For. Meteorol. 2007, 146, 216–229. [Google Scholar] [CrossRef]
- Zhang, T.; Peng, J.; Liang, W.; Yang, Y.; Liu, Y. Spatial-temporal patterns of water use efficiency and climate controls in China’s loess plateau during 2000–2010. Sci. Total Environ. 2016, 565, 105–122. [Google Scholar] [CrossRef] [PubMed]
- Liu, Y.; Xiao, J.; Ju, W.; Zhou, Y.; Wang, S.; Wu, X. Water use efficiency of China’s terrestrial ecosystems and responses to drought. Sci. Rep. 2015, 5, 13799. [Google Scholar] [CrossRef]
- Lu, X.; Zhuang, Q. Evaluating evapotranspiration and water-use efficiency of terrestrial ecosystems in the conterminous United States using MODIS and AmeriFlux data. Remote Sens. Environ. 2010, 114, 1924–1939. [Google Scholar] [CrossRef]
- Zhao, M.; Running, S. Drought-induced reduction in global terrestrial net primary production from 2000 through 2009. Science 2010, 329, 940–943. [Google Scholar] [CrossRef]
- Li, Z.; Zhang, R.; Wang, X.; Chen, F.; Tian, C. Growing season carbon dioxide exchange in flooded non-mulching and non-flooded mulching cotton. PLoS ONE 2012, 7, e50760. [Google Scholar] [CrossRef]
- Li, G.; Cui, J.; Han, W.; Zhang, H.; Huang, S.; Chen, H.; Ao, J. Crop type mapping using time-series Sentinel-2 imagery and U-Net in early growth periods in the Hetao irrigation district in China. Comput. Electron. Agric. 2022, 203, 107478. [Google Scholar] [CrossRef]
- Valerie, A.; Cook, F.J. Relationships between soil respiration and soil moisture. Soil Biol. Biochem. 2008, 40, 1013–1018. [Google Scholar]
- Wu, J.; Zhang, Q.; Li, A.; Liang, C. Historical landscape dynamics of Inner Mongolia: Patterns, drivers, and impacts. Landsc. Ecol. 2015, 30, 1579–1598. [Google Scholar] [CrossRef]
- Gao, L.; Kinnucan, H.; Zhang, Y.; Qiao, G. The effects of a subsidy for grassland protection on livestock numbers, grazing intensity, and herders’ income in Inner Mongolia. Land Use Policy 2016, 54, 302–312. [Google Scholar] [CrossRef]
- Huang, K.; Xia, J.; Wang, Y.; Ahlström, A.; Chen, J.; Cook, R.B.; Cui, E.; Fang, Y.; Fisher, J.B.; Huntzinger, D.N. Enhanced peak growth of global vegetation and its key mechanisms. Nat. Ecol. Evol. 2018, 2, 1897–1905. [Google Scholar] [CrossRef] [PubMed]
- Xie, W.; Zhu, A.; Ali, T.; Zhang, Z.; Chen, X.; Wu, F.; Huang, J.; Davis, K. Crop switching can enhance environmental sustainability and farmer incomes in China. Nature 2023, 616, 300–305. [Google Scholar] [CrossRef]
- Xiao, J. Satellite evidence for significant biophysical consequences of the “Grain for Green” Program on the Loess Plateau in China. J. Geophys. Res. Biogeosci. 2014, 119, 2261–2275. [Google Scholar] [CrossRef]
- Hao, X.; He, W.; Lam, S.; Li, P.; Zong, Y.; Zhang, D.; Li, F. Enhancement of no-tillage, crop straw return and manure application on field organic matter content overweigh the adverse effects of climate change in the arid and semi-arid Northwest China. Agric. For. Meteorol. 2020, 295, 1–10. [Google Scholar] [CrossRef]
- Li, R.; Shi, H.; Flerchinger, G.; Akae, T. Simulation of freezing and thawing soils in Inner Mongolia Hetao Irrigation District, China. Geoderma 2012, 173, 28–33. [Google Scholar] [CrossRef]
- Niu, Q.; Xiao, X.; Zhang, Y.; Qin, Y.; Dang, X.; Wang, J.; Zou, Z.; Doughty, R.B.; Brandt, M.; Tong, X.; et al. Ecological engineering projects increased vegetation cover, production, and biomass in semiarid and subhumid Northern China. Land Degrad. Dev. 2019, 30, 1620–1631. [Google Scholar] [CrossRef]
- Li, D.; Luo, H.; Hu, T.; Shao, D.; Cui, Y.; Khan, S.; Luo, Y. Identification of the roles of climate factors, engineering construction, and agricultural practices in vegetation dynamics in the Lhasa River Basin, Tibetan Plateau. Remote Sens. 2020, 12, 883. [Google Scholar] [CrossRef]
- Li, Y.; Zhang, X.; Cao, Z.; Liu, Z.; Lu, Z.; Liu, Y. Towards the progress of ecological restoration and economic development in China’s Loess Plateau and strategy for more sustainable development. Sci. Total Environ. 2021, 756, 143676. [Google Scholar]


| β | Z | Trend Type | Trend Features |
|---|---|---|---|
| β > 0 | 2.58 < Z | 4 | extremely significant increase |
| 1.96 < Z ≤ 2.58 | 3 | significant increase | |
| 1.65 < Z ≤ 1.96 | 2 | slightly significant increase | |
| Z ≤ 1.65 | 1 | no significant increase | |
| β = 0 | Z | 0 | no change |
| β < 0 | Z ≤ 1.65 | −1 | no significant decrease |
| 1.65 < Z ≤ 1.96 | −2 | slightly significant decrease | |
| 1.96 < Z ≤ 2.58 | −3 | significant decrease | |
| 2.58 < Z | −4 | extremely significant decrease |
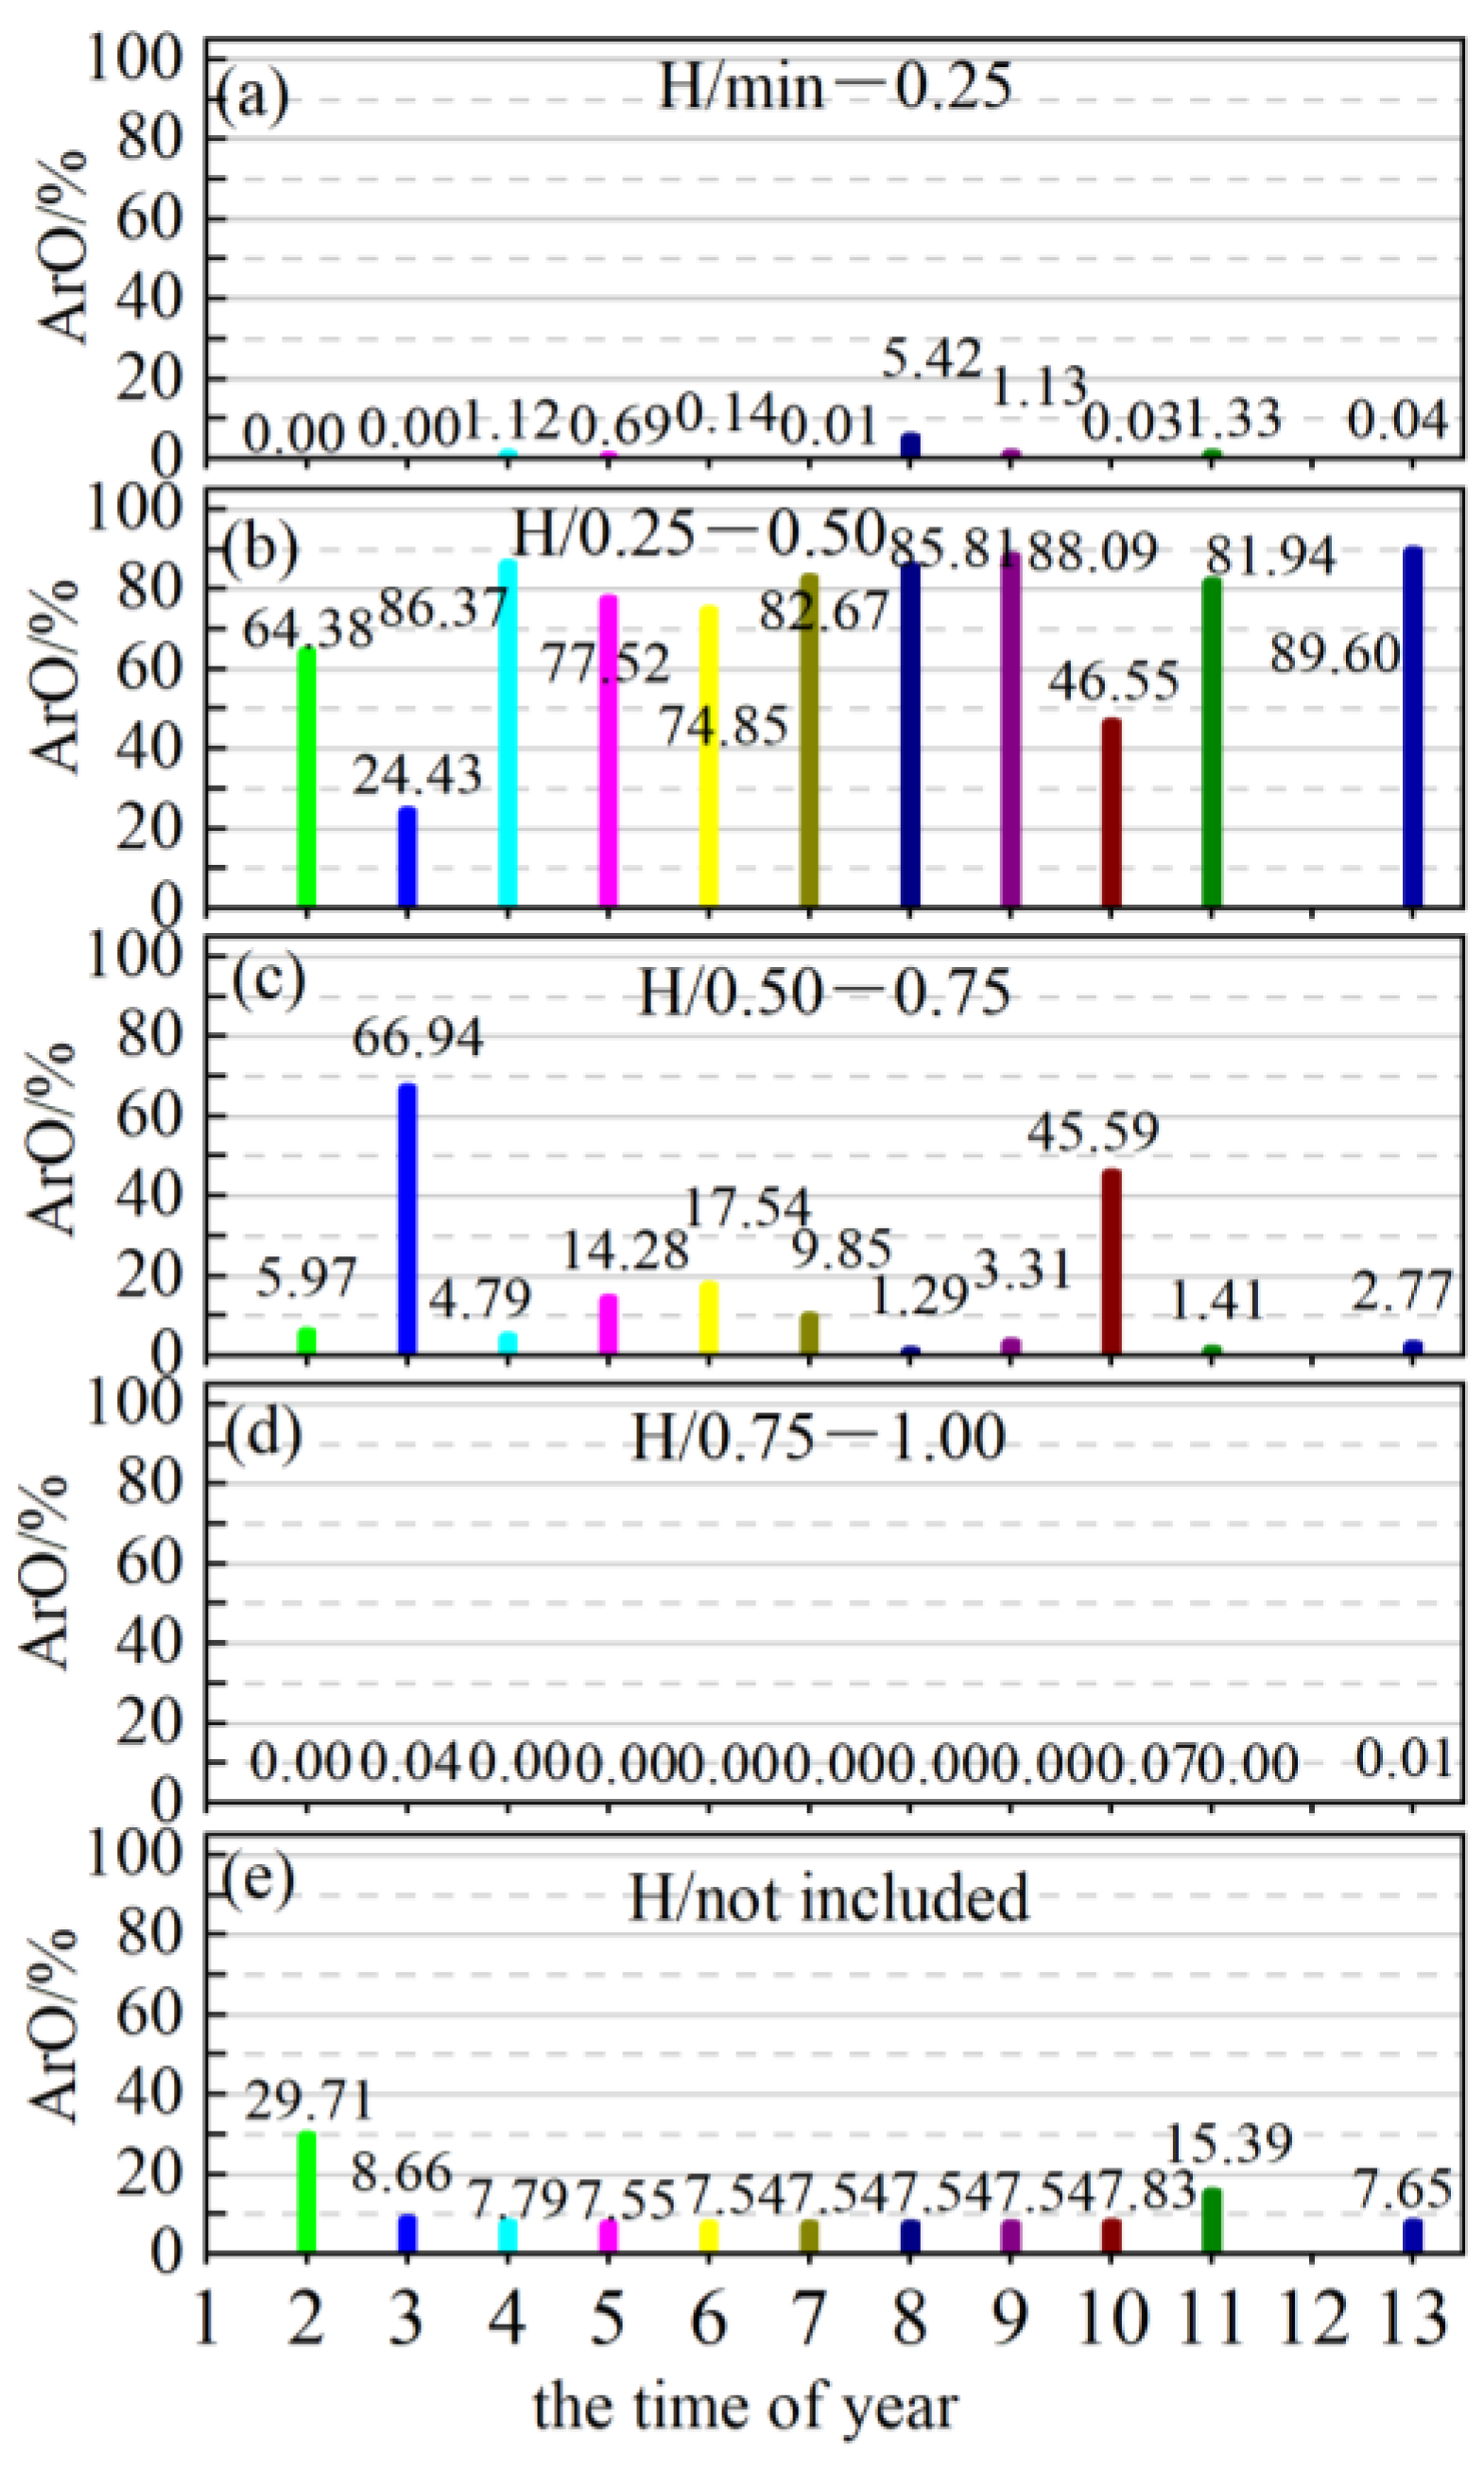
| Time | Parameter | Hurst Index | ||||
|---|---|---|---|---|---|---|
| Min-0.25 | 0.25–0.50 | 0.50–0.75 | 0.75–1.00 | Not Included | ||
| 1/January | Area | - | - | - | - | - |
| ArO | - | - | - | - | - | |
| 2/February | Area | 0.00 | 73.75 | 6.84 | 0.00 | 34.04 |
| ArO | 0.00 | 63.38 | 5.97 | 0.00 | 29.71 | |
| 3/March | Area | 0.01 | 27.98 | 76.67 | 0.05 | 9.91 |
| ArO | 0.00 | 24.43 | 66.94 | 0.04 | 8.66 | |
| 4/April | Area | 1.28 | 98.93 | 5.48 | 0.00 | 8.92 |
| ArO | 1.12 | 86.37 | 4.79 | 0.00 | 7.79 | |
| 5/May | Area | 0.80 | 88.79 | 16.35 | 0.04 | 8.65 |
| ArO | 0.69 | 77.52 | 14.28 | 0.03 | 7.55 | |
| 6/June | Area | 0.15 | 85.74 | 20.09 | 0.00 | 8.63 |
| ArO | 0.14 | 74.85 | 17.54 | 0.00 | 7.54 | |
| 7/July | Area | 0.01 | 94.69 | 11.28 | 0.00 | 8.63 |
| ArO | 0.01 | 82.67 | 9.85 | 0.00 | 7.54 | |
| 8/August | Area | 6.21 | 98.29 | 1.48 | 0.00 | 8.63 |
| ArO | 5.42 | 85.81 | 1.29 | 0.00 | 7.54 | |
| 9/September | Area | 1.29 | 100.90 | 3.79 | 0.00 | 8.63 |
| ArO | 1.13 | 88.09 | 3.31 | 0.00 | 7.54 | |
| 10/October | Area | 0.03 | 53.31 | 52.22 | 0.08 | 8.63 |
| ArO | 0.03 | 46.55 | 45.59 | 0.07 | 7.83 | |
| 11/November | Area | 1.53 | 93.86 | 1.61 | 0.00 | 17.63 |
| ArO | 1.33 | 81.94 | 1.41 | 0.00 | 15.39 | |
| 12/December | Area | - | - | - | - | - |
| ArO | - | - | - | - | - | |
| 13/Year | Area | 0.05 | 102.63 | 3.18 | 0.01 | 8.76 |
| ArO | 0.04 | 89.60 | 2.77 | 0.01 | 7.65 | |
Disclaimer/Publisher’s Note: The statements, opinions and data contained in all publications are solely those of the individual author(s) and contributor(s) and not of MDPI and/or the editor(s). MDPI and/or the editor(s) disclaim responsibility for any injury to people or property resulting from any ideas, methods, instructions or products referred to in the content. |
© 2024 by the authors. Licensee MDPI, Basel, Switzerland. This article is an open access article distributed under the terms and conditions of the Creative Commons Attribution (CC BY) license (https://creativecommons.org/licenses/by/4.0/).
Share and Cite
Peng, M.; Li, C.; Wang, P.; Dai, X. Spatio-Temporal Variation and Future Sustainability of Net Primary Productivity from 2001 to 2021 in Hetao Irrigation District, Inner Mongolia. Agriculture 2024, 14, 613. https://doi.org/10.3390/agriculture14040613
Peng M, Li C, Wang P, Dai X. Spatio-Temporal Variation and Future Sustainability of Net Primary Productivity from 2001 to 2021 in Hetao Irrigation District, Inner Mongolia. Agriculture. 2024; 14(4):613. https://doi.org/10.3390/agriculture14040613
Chicago/Turabian StylePeng, Manman, Chaoqun Li, Peng Wang, and Xincong Dai. 2024. "Spatio-Temporal Variation and Future Sustainability of Net Primary Productivity from 2001 to 2021 in Hetao Irrigation District, Inner Mongolia" Agriculture 14, no. 4: 613. https://doi.org/10.3390/agriculture14040613