Article

Impacts of the National Nutrition Plan 2017–2030 on Listed Agrifood Enterprises: A Financial Statement Perspective

1
College of Economics and Management, Fujian Agriculture and Forestry University, Fuzhou 350002, China
2
College of Management, National Yunlin University of Science and Technology, Yunlin 64002, Taiwan
*
Author to whom correspondence should be addressed.
Agriculture 2024, 14(5), 677; https://doi.org/10.3390/agriculture14050677
Submission received: 9 February 2024 / Revised: 20 April 2024 / Accepted: 24 April 2024 / Published: 26 April 2024
(This article belongs to the Special Issue Agricultural Markets and Agrifood Supply Chains)

Abstract

:
The Chinese government promulgated the National Nutrition Plan 2017–2030 to provide scientific guidance for agrifood consumption and enhance nutrition intake. We categorized the sample into pre-2018 and post-2018 periods. By evaluating the effects of the National Nutrition Plan 2017–2030 through economic theory and a translog revenue function model based on financial statement data from 2015 to 2022, our findings indicate that the National Nutrition Plan 2017–2030 has increased the overall agrifood sales of listed agrifood enterprises, but the increase in agrifood sales produced by large listed agrifood enterprises has been slight. Finally, we offer policy recommendations for regulatory authorities and develop strategies for agrifood firms to encourage local food procurement. This study also contributes to our understanding of China’s agrifood industry dynamics and underscores the significance of the National Nutrition Plan 2017–2030 in enhancing nutritional intake and fostering sustainable growth in China’s agriculture industry.

1. Introduction

Food security and agricultural sustainability significantly impact China’s economic development and social stability. In today’s world, many international issues are related to food shortages and sustainable development. Food security and agricultural sustainability are essential to global governance and are related to China’s national security. As the world’s most authoritative and representative international intergovernmental organization today, the United Nations plays an irreplaceable role in global governance issues such as food security and agricultural sustainability. In the face of global agricultural development and sustainable development circumstances, and under the background of the United Nations Sustainable Development Agenda, it is of great significance for China and the United Nations to expand and deepen cooperation in food security and agricultural sustainability.
In November 1996, the first World Food Summit (WFS) adopted the Rome Declaration on World Food Security, which reaffirmed the WFS’s goals of “everyone’s right to access to safe and nutritious food” and “reducing the number of undernourished people to half of the current number by 2015” [1]. Since then, China has gradually improved public health and agricultural food production [2]. With the remarkable achievements in the Chinese economy alongside the rapid advancements in the food industry and agriculture, there has been an increase in agrifood availability for the population, fostering growth and development in adolescents while reducing malnutrition rates [3].
Nevertheless, China continues to face challenges related to malnutrition, mainly due to the inadequate intake or poor quality of agrifoods, leading to undernourishment of the population in certain regions. The National Nutrition Plan 2017–2030 (NNPRO) is a crucial policy designed to tackle these problems and is expected to play a significant role in enhancing nutritional status and increasing access to agrifoods. The objective of this study is to assess the influence of the NNPRO on listed agrifood enterprises. This will be achieved by employing a translog revenue function model to analyze accounting data spanning from 2015 to 2022.
Government policies play a crucial role in shaping a nation’s progress toward achieving optimal nutrition and ensuring an adequate supply of agrifoods. In 2017, China introduced the National Nutrition Plan 2017–2030 to enhance the nutritional status of China’s population and agrifood availability. We have constructed the agrifoods industry’s translog revenue function and utilized the annual pooling data of agrifood companies between 2015 and 2022. Our empirical results indicate that the average partial effect (APE) of the NNPRO on listed agrifood enterprises’ total revenue (AREVENUE) is positive. This means that the NNPRO positively impacts the overall agrifood sales of listed agrifood enterprises. Furthermore, we have found that the APE value of small listed agrifood enterprises on AREVENUE is also positive, and the APE value is higher than the APE value of the NNPRO on AREVENUE. This suggests that after the NNPRO launch, the increase in agrifood sales produced by large listed agrifood enterprises has been slight.
Boysen et al. [4] studied the impact of agrifood policy changes on the Irish economy and income distribution, using the CGE model to introduce the agrifood sector, differentiated household groups, and agricultural policy tools in particular detail, including their links to production and household factors. Niemi et al. [5] used the AG-MEMOD modeling framework to analyze the impact of policy changes on the Finnish agrifood industry. Solis-Navarrete et al. [6] analyzed the impact of innovation policies on the agrifood industry in Guerrero and Michoacán states through case studies and unit of analysis (UA) processing. However, none of these studies used the agrifood sector’s revenue function to study policy impact. This paper aims to fill this literature gap. To the best of our knowledge, we may be the first team to conduct policy research using the revenue function of the agrifood sector. This is the first contribution to this study. Secondly, our research suggests that China’s policymakers in the agrifood and nutrition sectors could develop stricter agrifood policies to address concerns about the safety of Chinese agrifoods. We propose specific measures for the agrifood industry’s regulatory agencies to consider, and we also highlight matters that stakeholders such as the public, investors, and agrifood enterprises should pay attention to. By doing so, people’s rights are increased, and they become more interested in purchasing agrifoods, safeguarding stakeholders’ interests. Thirdly, this study can provide a meaningful reference for some countries or regions, especially those with significant agrifood trade with China, when formulating nutrition and agrifood trade policies and adjusting the structure of exported agrifoods. Meanwhile, this study will help policymakers update policies, help stakeholders such as the agrifood sector and agrifood supply chain adjust development strategies, and provide better policy guidance for international agrifood traders.

2. Background and Hypothesis Development

The NNPRO has a significant impact on the price of agricultural products. The theory of price formation has been studied alongside the entire development of economics. Petty [7] pointed out that labor time determines the value of a commodity, and the value of a commodity determines its price. Smith [8], based on Petty’s theory of natural price, believed that in addition to labor, capital and land were also necessary inputs in producing a commodity. Hence, the price of a commodity not only contains the value of labor but also the remuneration for land and capital, namely rent and interest. In Smith’s theory of production cost value, it is believed that the remuneration for labor, rent of land, and interest constitute the natural price of a commodity. Ricardo [9] distinguished between value and use value, believing that the exchange value was the object of use value and a commodity was the sum of new value creation and original value. In the utility price theory, the price of a commodity is determined by its utility value. From the perspective of consumers, the reason why they buy a commodity is that the commodity can be of particular use to them, which is the source of commodity value. Bailey [10] believed that the use value of a commodity determines its value, and a commodity is a specific consumer demand that has been satisfied. Consumer evaluations regarding the satisfaction they gain from a commodity determine the value and price of a commodity. The use value of a commodity is closely related to the price of the commodity. However, the confusion between use value and price significantly weakens the persuasiveness of the utility price theory. Based on the labor theory of value, Malthus [11] and Say [12] believed that the price of the commodity depends on its production cost, that is, the cost of producing the commodity, including the wages of workers, the profits of entrepreneurs, and the rent of land. Say [12] believed that the creation of commodity value included the interaction of capital, labor, and natural resources, including land, and the price of a commodity was determined by the cost of input factors.
Marshall [13] proposed the theory that supply and demand determine the price based on exchange theory, which is widely recognized in the theoretical community. Marshall [13] believed that in a market economy, the operation of the market mechanism reflects the interrelated and restrictive relationship between price, supply, and demand. The price mechanism mainly consists of price formation, operation, and regulation, which all allocate economic resources together. In other words, the key to the market mechanism’s operation is the price mechanism. Price fluctuations will change the relative relationship between market supply and demand. As producers adjust their allocation of production resources according to the market price, consumers adjust their consumption plans and methods. Prices affect supply and demand, and the relative changes in supply and demand determine the formation and fluctuation of prices. Equilibrium price theory states that the market reaches equilibrium when supply and demand are equal. The realization of this equilibrium is achieved through the continuous mutual game between supply and demand. In short, the core of the operation of the market mechanism is price, which spontaneously adjusts the allocation of market resources and consumer choice behavior, and supply and demand determine the price in essence. The NNPRO significantly impacts the demand for agricultural products and affects their prices. Their price affects the overall sales of listed companies’ agricultural products.
Numerous studies have meticulously analyzed industry and government data to understand the impact of public policy. These studies have covered a wide range of topics, such as the EU food law [14,15,16,17], the US Food Safety Modernization Act [18,19,20,21], the British Food Safety Act [22,23,24], the Organic Foods Production Act [25,26,27], healthy food subsidies [28,29,30,31,32], fat tax [33,34,35,36,37], sugar-sweetened beverage labels [38,39,40,41], the sugary drink tax [42,43], and chain restaurant menu labeling [44,45,46,47]. The main focus of these studies was to comprehend how policy influences markets, public behavior, and associated industries.
Food-related policies and alterations significantly impact the food industry and people’s food purchases. The competitive food law has implemented restrictions on selling “competitive foods” in schools. Many US states enacted these policies in response to concerns about the unhealthy diet of students on campus [48,49]. Competitive foods harm human health in many ways, and the candy and sugar-sweetened drinks commonly found on campuses have led to an increase in obesity rates among students [50,51,52,53]. Policy changes that set nutritional standards can promote a more appropriate dietary intake among students, reduce their average weight, and improve the school dining environment [54,55,56,57,58,59,60,61]. Such policies effectively reduce students’ reliance on non-nutritious foods [62,63,64,65,66,67,68]. Previous research has also pointed out that these regulations promote healthier product purchases in adolescents [54] and healthier weights [60]. Additionally, these policies increase revenues in the food sector [69]. Given the impact of policies on the food industry and people’s food purchases, we are interested in studying the effects of the NNPRO on agrifood sales, agri-markets, and the agrifood sector in emerging markets.
The NNPRO suggests ways to address undernutrition in specific populations. These methods are as follows: First, the monitoring of the agricultural food composition should be strengthened by expanding the breadth of monitoring, conducting regular monitoring, and collecting data on nutritional, functional, and harmful components and components related to specific diseases. The national agricultural food composition database should be continuously updated and improved, and a laboratory reference system should be established to strengthen quality control. Second, the quality and safety of agricultural food for infants and young children should be improved, and the healthy development of the industry should be promoted. This can be achieved by strengthening the monitoring of nutritional components and key pollutants in infant formula and complementary foods to promptly revise and improve their standards. The research and development capacity and the quality of infant formula and complementary food should be continuously improved. In addition to the NNPRO’s impact on undernutrition in specific populations, it also profoundly impacts agricultural food purchases.
We align with Testa et al.’s [70] perspective and emphasize “soft” policies that employ persuasion and voluntary actions to influence agrifood purchases. A prominent example of such a policy in China is the NNPRO, which addresses issues related to agrifood consumption and undernutrition among specific populations. Cai et al. [71] studied the role of the NNPRO in China in responding to the call of the Sustainable Development Goals (SDGs). Wu [72] analyzed the challenges and opportunities faced by the development of China’s nutrition and functional food industry based on the background of the NNPRO and explored how to stimulate enterprise innovation, enhance competitiveness, and improve the health efficiency of nutrition and health food in a modern-day context. Yang et al. [73] identified trends in child nutrition, gaps in achieving child-nutrition-related targets, and implications for the Chinese government’s plans and policy choices based on the NNPRO policy. However, there is currently no research on the economic impact of the NNPRO on the agrifood sector, and this paper will fill this literature gap.
The NNPRO ensures the supply of agrifoods and nutrition at multiple levels:
(1)
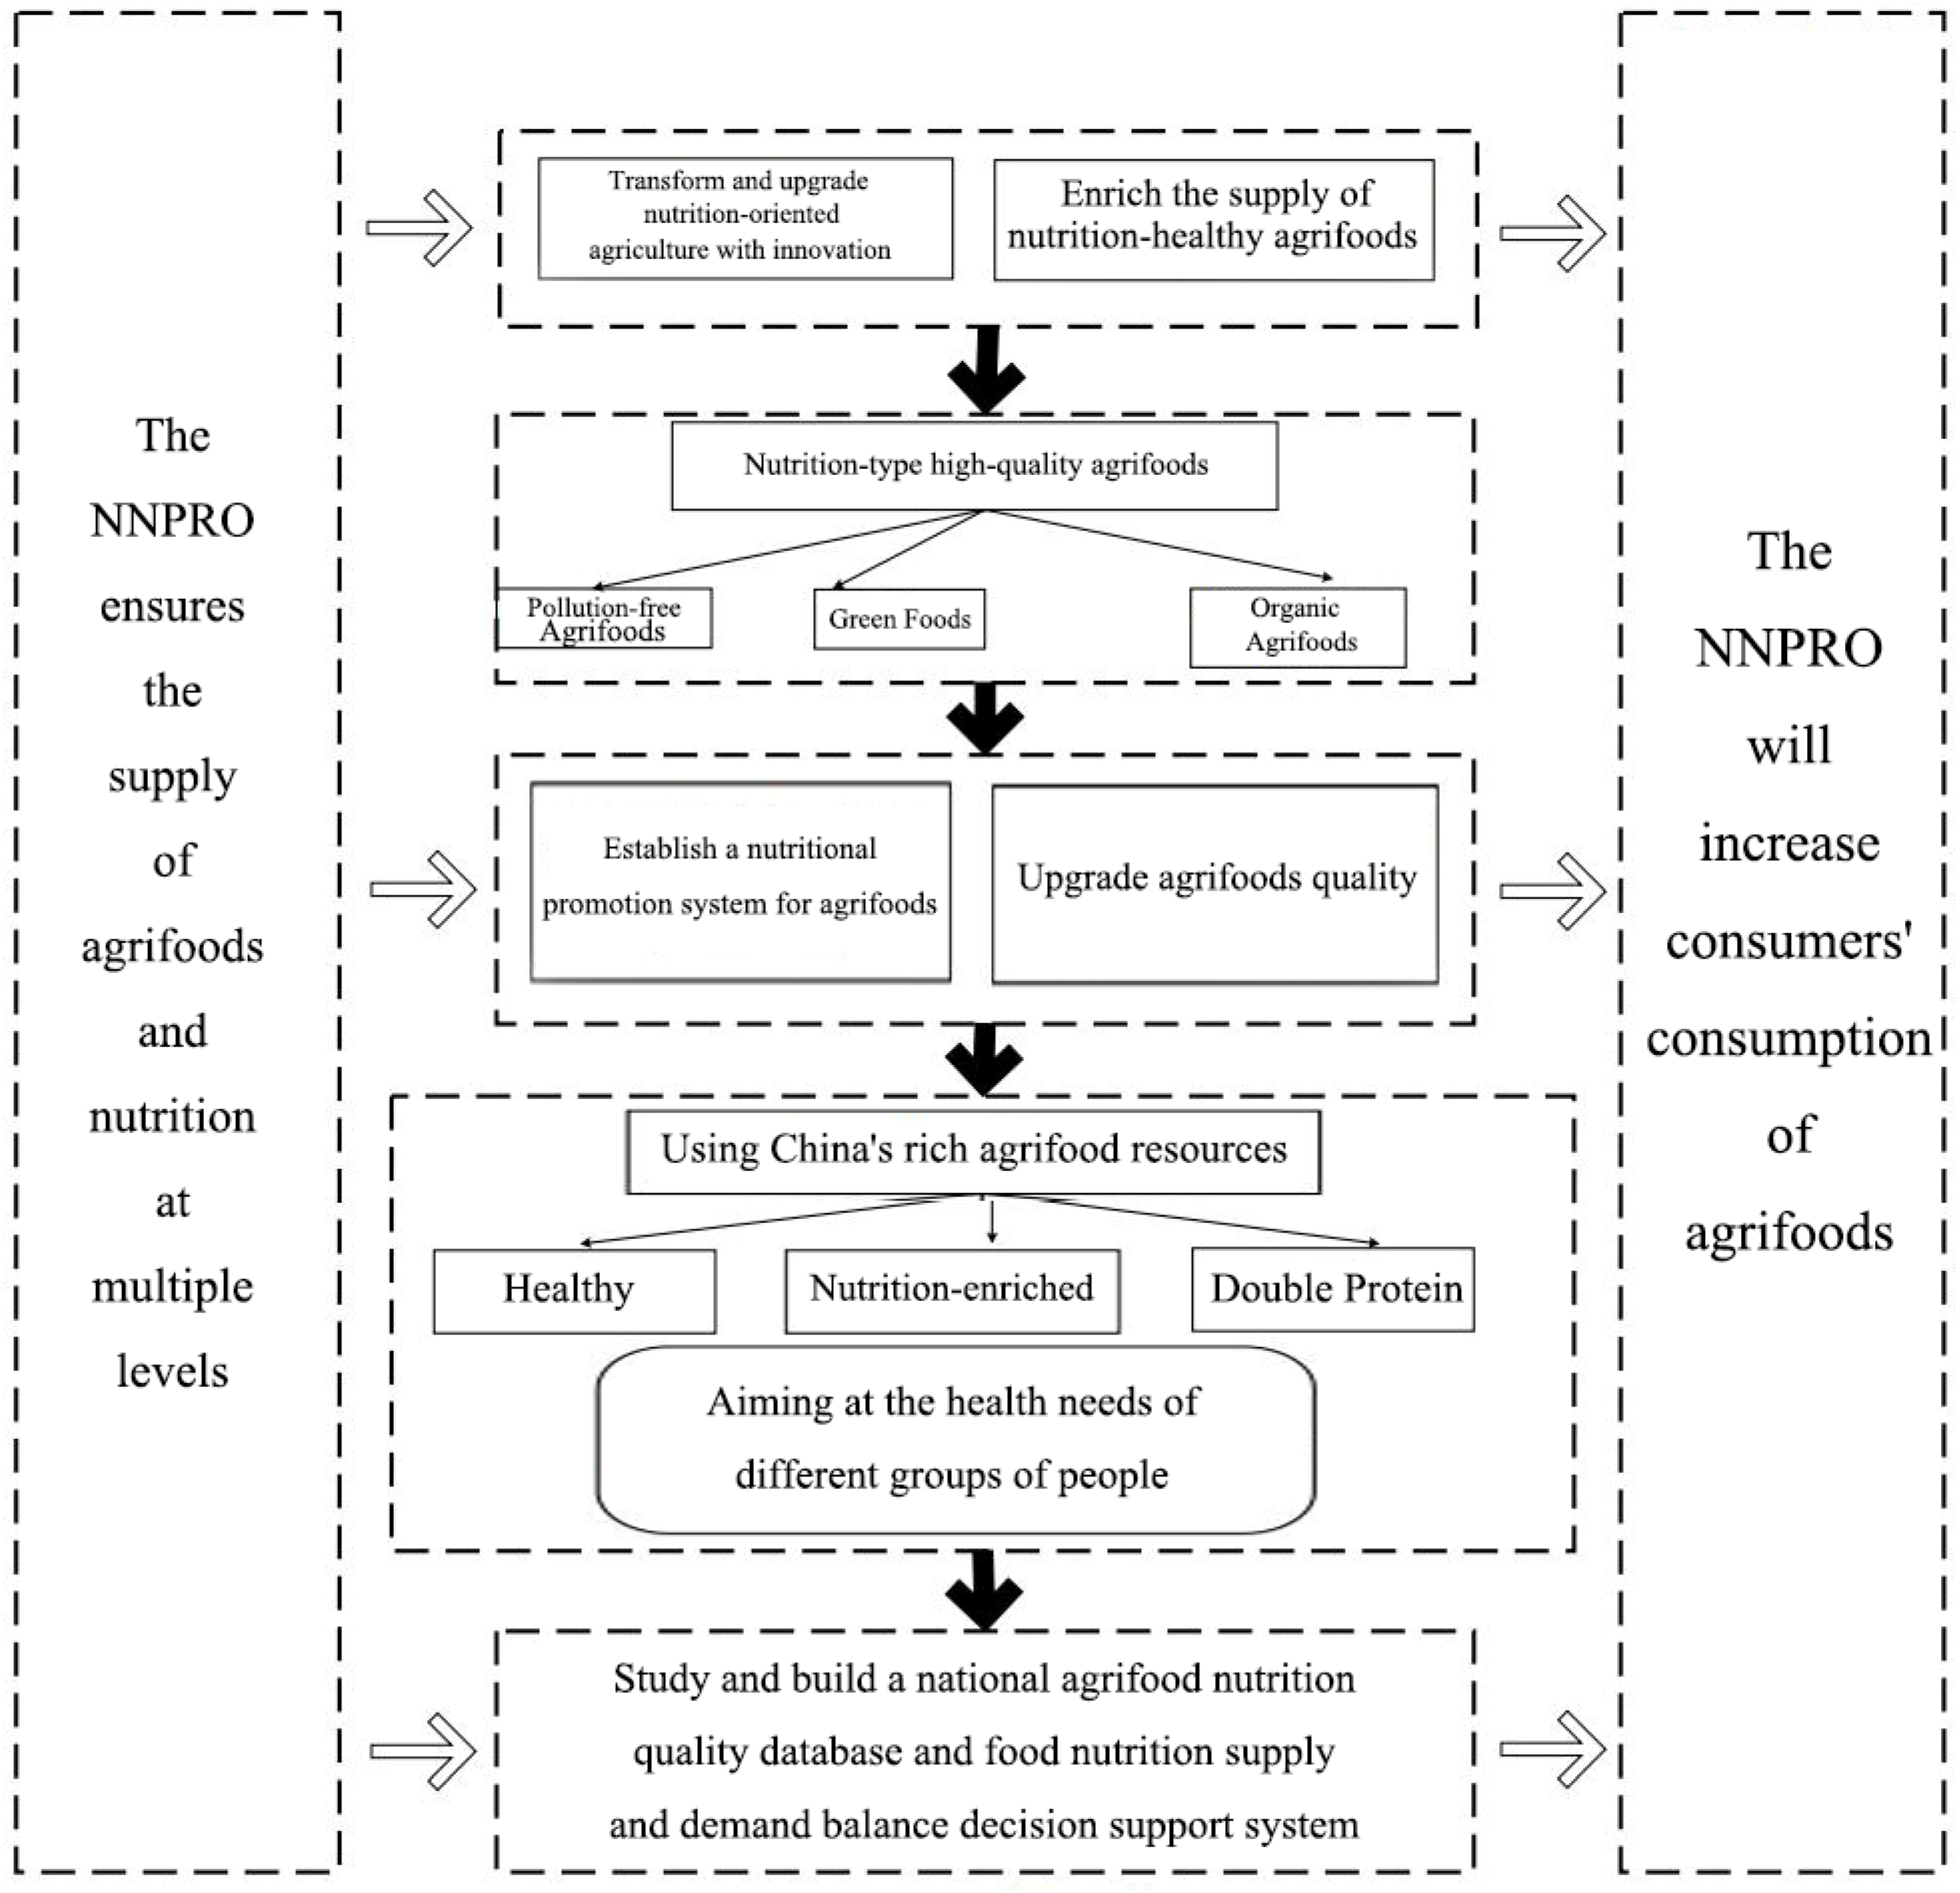
The NNPRO aims to transform and upgrade nutrition-oriented agriculture with innovation, enrich the supply of nutritious, healthy agrifoods, and promote the integration of nutrition and health with agricultural development.
(2)
The NNPRO aims to strengthen the production of nutritious, high-quality agrifoods. It has formulated guidelines on improving the nutrition quality of agrifoods, increasing the proportion of pollution-free agrifoods, green foods, and organic agrifoods in the same kind of agrifoods to more than 80%.
(3)
The NNPRO also aims to establish a nutritional promotion system for agrifoods, upgrade their quality, and promote agrifoods produced in underprivileged areas globally.
(4)
The NNPRO aims to study and build a national agrifood nutrition quality database and a food nutrition supply and demand balance decision support system.
(5)
Using China’s rich agrifood resources, the NNPRO is targeted at the health needs of different groups of people, focusing on developing healthy, nutrition-enriched, double-protein, and other new nutritious agrifoods.
Figure 1 shows the implementation mechanism of the NNPRO.
Considering the above policy details of the NNPRO, we expect the NNPRO will increase the consumption of agrifoods, especially agrifoods from listed agrifood enterprises. Given the plan has strengthened the support of small- and medium-sized agrifood companies, we expect the sales of agrifoods produced by these enterprises will increase significantly, but there has only been a small increase in the sales of agrifoods produced by large agrifood enterprises. Therefore, we put forward the following research hypothesis:
Hypothesis 1.
The National Nutrition Plan 2017–2030 has increased the overall agrifood sales of listed agrifood enterprises, but the increase in agrifood sales produced by large listed agrifood enterprises has been slight.

3. Method

3.1. Theoretical Model

Tsai et al. [74] identified that the cornerstone of any enterprise’s steady advancement lies in the quality of its human resources. Within the agrifood industry in China, a diverse workforce is present, encompassing managers, R&D experts, and regular staff members. The production function of the agrifood sector is as follows:
y = f f ,   d ,   b , x 1 , x 2 , x 3
In the context of agrifood sales, denoted by y, the inputs are categorized as x 1 for management personnel, x 2 for research and development personnel, and x 3 for the count of general staff. Additionally, investments are made in three key areas: fixed assets (f), research and development (R&D) (d), and intangible assets (b). From an economic standpoint, inputs must exceed zero, applicable to y , x i , f ,   d 0 , and for i = 1, 2, and 3, respectively. Moreover, these variables must adhere to specific theoretical prerequisites: 2 f ( · ) / b 2 0 , 2 f ( · ) / d 2 0 , 2 f ( · ) / f 2 0 , and 2 f ( · ) / x i 2 0 .
The equation in this study represents the revenue function within the agrifood sector:
r p ; f ,   d ,   b , x 1 , x 2 , x 3 = m a x   p y subject   to   y = f f ,   d ,   b , x 1 , x 2 , x 3
In the agrifood industry, revenue, denoted as r, and the price of its products, represented by p, are described in Equation (2). Studies frequently apply the Cobb–Douglas function to convert this equation. The transformed function of revenue is depicted in Equation (3):
ln r = α 0 + δ ln p + i = 1 3 α i ln x i + β 1 ln f + δ 1 l n   d + ϵ 1 l n   b
The model discussed produces a single output, characterized by its feature of being of homogeneous degree 1 concerning the output price (δ = 1). By normalizing this model with p = 1 as per reference [63], it is represented through Equation (4):
ln r = α 0 + i = 1 3 α i l n   x i + β 1 l n   f + δ 1 l n   d + ϵ 1 l n   b
Building upon the methodologies used by earlier researchers regarding the translog revenue function [75,76], we define the model’s application to the agrifood sector as shown in Equation (5) [77]:
l n   r = α 0 + i = 1 3 α i   l n   x i + β 1 l n   f + δ 1 l n   d + ϵ 1 l n   b + 1 2 i = 1 3 l = 1 3 α i l   l n   x i   l n   x l + 1 2 β 11 ln f 2 + 1 2 δ 11 ln d 2 + 1 2 ϵ 11 ln b 2 + i = 1 3 γ i 1 ln x i l n   f + i = 1 3 ε i 1 ln x i l n   d + i = 1 3 μ i 1 ln x i l n   b + θ 11 l n   f   l n   d + ρ 11 l n   f   l n   b + σ 11 l n   d   l n   b
In this research, setting α i l = γ i 1 = ε i 1 = μ i 1 = θ 11 = ρ 11 = σ 11 = 0 transforms the equation back to its Cobb–Douglas form, characterized by a log-linear specification.

3.2. Variables and Samples

3.2.1. Choose Samples

In this study, we extensively examined the input variables in the agrifood sector from 2015 to 2022, employing financial statement data from the CSMAR database, recognized as China’s definitive source. This study deleted some unreasonable data. For example, we eliminated agrifood companies that reported no total revenue, no managers, R&D personnel, or other employees, had no fixed or intangible assets, and made no investments in R&D, and so on. This process resulted in a quarterly dataset of 406 valid observations.

3.2.2. Variables

The independent variables included multiple inputs from the agrifood sector; the dependent variable is the revenue of the agricultural food sector (AREVENUE). To capture the contribution of personnel, we utilized proxies such as the count of management staff (MSTAFF), R&D staff (RSTAFF), and general employees (OSTAFF). Additionally, we extracted financial metrics for intangible assets (INTASSE), fixed assets (FIXED), and research and development spending (DEVELOP) from the annual reports of publicly traded agrifood firms to gauge the impact of these asset-based inputs.
Efficient human resource management enhances the quality of business operations [78,79,80,81] and boosts profits [82,83,84,85]. The educational background of employees plays a crucial role in human resources [86,87,88]. Workers with varying educational levels offer different levels of work efficiency and make distinct contributions to a company’s income. Employees with diverse educational and professional experiences collaborate, creating varied human resource structures. These structures exhibit unique coordination effects, influencing companies’ overall performance and function. Viewing inter-company collaborations as a team, the composition of team members significantly affects the collective revenue. Understanding how different types of employees interact with other factors is critical to grasping the complexities of income generation in the agrifood sector from a holistic input perspective.
In our analysis, we incorporated a dummy variable named NNPRO to evaluate its impact on listed agrifood enterprises. NNPRO is set to 1 for representing the data spanning five years, from 2018 to 2022, and set to 0 for data covering three years, from 2015 to 2017. Additionally, our study introduces another dummy variable, BIG, to denote the presence of China’s three largest agrifood companies, which hold a significant market share, where an agrifood company is marked as BIG = 1 if it is among the top three in China and non-BIG = 0 otherwise.
In the study conducted by Coelli et al. [89], including the YEAR variable was crucial for adjusting the model to account for various impacts across different years, encompassing economic growth. YEAR allows for capturing industry evolution over time, technological advancements, and shifts on both the supply and demand sides. As economic growth fosters an increase in demand, the supply side is invariably affected. The YEAR variable encapsulates several factors, including economic progress, fluctuations in GNP and GDP, the rising number of agrifood enterprises, economic downturns, and other annual influences. Table 1 provides detailed definitions for variables.

3.3. The Estimation Model

In this study, the theoretical model is rewritten into an estimation model, and we have added BIG, NNPRO, and YEAR to the model. Next, we rewrote Equation (5) as follows:
ln A R E V E N U E = α 0 + α 1 ln M S T A F F + α 2 ln R S T A F F + α 3 ln O S T A F F + β 1 ln F I X E D + δ 1 ln D E V E L O P + ϵ 1 l n I N T A S S E + 1 2   α 11   l n   M S T A F F 2 + 1 2   α 22   l n   R S T A F F 2 + 1 2   α 33   l n   O S T A F F 2 + 1 2   β 11   l n   F I X E D 2 + 1 2   δ 11   l n   D E V E L O P 2 + 1 2   ϵ 11   l n   I N T A S S E 2 + α 12 ln M S T A F F ln R S T A F F + α 13 ln M S T A F F ln O S T A F F + α 23   l n   R S T A F F   l n   O S T A F F + γ 11 ln M S T A F F ln F I X E D + γ 21   l n   R S T A F F   l n   F I X E D + γ 31   l n   O S T A F F   l n   F I X E D + ε 11 ln M S T A F F ln D E V E L O P + ε 21 l n   R S T A F F   l n   D E V E L O P + ε 31   l n   O S T A F F   l n   D E V E L O P + μ 11 ln M S T A F F ln I N T A S S E + μ 21 ln R S T A F F ln I N T A S S E + μ 31   l n   O S T A F F ln I N T A S S E + θ 11   l n   F I X E D   l n   D E V E L O P + ρ 11   l n   F I X E D   l n   I N T A S S E + σ 11   l n   D E V E L O P   l n   I N T A S S E + φ 1   B I G + φ 2   N N P R O + φ 3   B I G   N N P R O + τ 1   Y E A R + τ 2   Y E A R 2
The expected challenges in estimating the average partial effects of different inputs on agrifood revenue are twofold: first, there may be some inputs whose average partial effects on agrifood revenue are not statistically significant, and second, there may be some inputs whose average partial effects on agrifood revenue are not theoretically consistent. These challenges may affect the final interpretation of the model outputs.
The APE of MSTAFF on AREVENUE:
l n A R E V E N U E ^ / l n M S T A F F = α ^ 1 + α ^ 11 l n M S T A F F ¯ + α ^ 12 l n R S T A F F ¯ + α ^ 13 l n O S T A F F ¯ + γ ^ 11 l n F I X E D ¯ + ε ^ 11 l n D E V E L O P ¯ + μ ^ 11 l n I N T A S S E ¯
The APE of RSTAFF on AREVENUE:
l n A R E V E N U E ^ / l n R S T A F F = α ^ 2 + α ^ 22 l n R S T A F F ¯ + α ^ 12 l n M S T A F F ¯ + α ^ 23 l n O S T A F F ¯ + γ ^ 21 l n F I X E D ¯ + ε ^ 21 l n D E V E L O P ¯ + μ ^ 21 l n I N T A S S E ¯
The APE of OSTAFF on AREVENUE:
l n A R E V E N U E ^ / l n O S T A F F = α ^ 3 + α ^ 33 l n O S T A F F ¯ + α ^ 13 l n M S T A F F ¯ + α ^ 23 l n R S T A F F ¯ + γ ^ 31 l n F I X E D ¯ + ε ^ 31 l n D E V E L O P ¯ + μ ^ 31 l n I N T A S S E ¯
The APE of FIXED on AREVENUE:
l n A R E V E N U E ^ / l n F I X E D = β ^ 1 + β ^ 11 l n F I X E D ¯ + γ ^ 11 l n M S T A F F ¯ + γ ^ 21 l n R S T A F F ¯ + γ ^ 31 l n O S T A F F ¯ + θ ^ 11 l n D E V E L O P ¯ + ρ ^ 11 l n I N T A S S E ¯
The APE of DEVELOP on AREVENUE:
l n A R E V E N U E ^ / l n D E V E L O P = δ ^ 1 + δ ^ 11 l n D E V E L O P ¯ + ε ^ 11 l n M S T A F F ¯ + ε ^ 21 l n R S T A F F ¯ + ε ^ 31 l n O S T A F F ¯ + θ ^ 11 l n F I X E D ¯ + σ ^ 11 l n I N T A S S E ¯
The APE of INTASSE on AREVENUE:
l n A R E V E N U E ^ / l n I N T A S S E = ϵ ^ 1 + ϵ ^ 11 l n I N T A S S E ¯ + μ ^ 11 l n M S T A F F ¯ + μ ^ 21 l n R S T A F F ¯ + μ ^ 31 l n O S T A F F ¯ + ρ ^ 11 l n F I X E D ¯ + σ ^ 11 l n D E V E L O P ¯
The APE of BIG on AREVENUE:
l n A R E V E N U E ^ / B I G = φ 1 + φ 3 N N P R O
The APE of NNPRO on AREVENUE:
l n A R E V E N U E ^ / N N P R O = φ 2 + φ 3 B I G
The APE of YEAR on AREVENUE:
l n A R E V E N U E ^ / Y E A R = τ 1 + 2 τ 2   Y E A R ¯

4. Results

4.1. Descriptive Statistics and Correlation Matrix

Table 2 presents statistical data for China’s listed agrifood enterprises from 2015 to 2022. Table 2 reveals that, throughout the study duration, the listed agrifood enterprises recorded average values for metrics such as AREVENUE, EMPLOYEE, FIXED, DEVELOP, and INTASSE that exceeded their respective median values, suggesting a rightward skew in the overall data. Notably, the standard deviation for AREVENUE between 2018 and 2022 was considerably high, indicating significant differences in the sizes of companies within the listed agrifood enterprises. From 2017 to 2022, the listed agrifood enterprises’ average revenue experienced a steady increase, climbing from CNY 370 million to CNY 608 million, marking a 64.32% growth over six years. This rise highlights the increasing demand for agrifoods among Chinese consumers, potentially influenced by factors such as inflation, demographic changes, or agrifood pricing strategies. Furthermore, we also noticed that during 2015–2017, before the promulgation of the NNPRO, the average revenue of China’s listed agrifood enterprises increased slowly. Still, it experienced a substantial increase after 2018, which also shows that consumers paid increasing attention to the intake of agrifoods after the promulgation of the NNPRO. China’s listed agrifood enterprises saw a significant increase in the sales of agrifood after the plan’s enactment.
Table 3 displays the Spearman and Pearson correlation coefficients, as detailed in the study. The table reveals a positive correlation between the NNPRO and AREVENUE. Therefore, implementing the National Nutrition Plan 2017–2030 has partially contributed to an increased consumer inclination toward purchasing agrifoods, as evidenced by the growth in revenue within China’s listed agrifood enterprises. However, it is important to note that correlation coefficients only represent a one-to-one relationship between variables and do not consider the influence of other variables. Therefore, for a comprehensive analysis, the impact of different variables must be considered using econometrics. The following section of this paper will delve into the ramifications of the NNPRO on listed agrifood enterprises by analyzing the translog revenue function.

4.2. The Policy and Listed Agrifood Enterprises

Our research aims to explore how the NNPRO influences the listed agrifood enterprises. By marking the first year post-NNPRO implementation as the cut-off point, we employ the Chow Test to assess the listed agrifood enterprises’ revenue. With an F statistic of 1.88 leading to rejecting the null hypothesis, our findings indicate a significant impact of the NNPRO on the listed agrifood enterprises. Consequently, we incorporated NNPRO into our analytical model to pinpoint its effects on the listed agrifood enterprises. Additionally, the introduction of BIG allows us to examine how the NNPRO variably affects agrifoods depending on their market origins.

4.3. Model Estimates

4.3.1. Model Test

To convey the findings accurately, the study opted for the translog function over the log-linear function. The translog function differs from the Cobb–Douglas model primarily in its functional form; it offers greater flexibility that leads to more accurate efficiency scores than the Cobb–Douglas model. This study’s findings are detailed in Table 4. Nonetheless, it’s vital to verify the effectiveness of the translog revenue function in accurately reflecting the results, which necessitates testing Equation (6) as outlined:
α i l = γ i 1 = ε i 1 = μ i 1 = θ 11 = ρ 11 = σ 11 = 0
According to the equation provided above, where i = 1 , 2 , 3 , Table 4 indicates that the model’s F statistic is 2.51. Based on this test result, it can be concluded that the translog function is a more suitable method for estimating the impact of the NNPRO on the listed agrifood enterprises in comparison to the Cobb–Douglas function.

4.3.2. APE Analysis

Table 5 demonstrates a positive and significant average partial effect of YEAR on AREVENUE, suggesting that as the number of enterprises increases, technological advancements occur, and the economy grows, consumption of agrifood also rises. Furthermore, when isolating other variables through the YEAR, based on the data presented in Table 5, it can be observed that the APE of the NNPRO on AREVENUE is positive. Additionally, Table 4 shows that the translog coefficient for the NNPRO is also significantly positive, further confirming that the NNPRO has contributed to an overall increase in agrifood sales of listed agrifood enterprises. This may be due to the promotion of the nutritional value of agrifoods by the NNPRO, which has positively impacted consumer agrifood purchases. In addition, Table 5 shows the APE of the NNPRO for non-BIG (0.144) is greater than the APE of the NNPRO for BIG (0.125), which indicates that when consumers buy agrifoods from non-BIG, the positive impact of the NNPRO on consumer agrifood purchases is more prominent. One of the reasons for this is that the NNPRO has strengthened the support of non-BIG agrifood companies. This confirms Hypothesis 1.

5. Discussion

Crook et al. [90] performed a multivariate analysis to explore the link between human resources and corporate revenue, suggesting a positive association between the two. Hitt et al. [85] examined how human resources affect the revenues of American law firms, discovering a positive relationship, indicating that a higher number of employees leads to better performance. The agricultural food sector requires significant technological investments, necessitating R&D expenditures and investments to boost a company’s innovation capabilities, enabling it to capture a more significant market share and increase its overall revenue. The data shown in Table 5 reveal that the APE of OSTAFF, DEVELOP, and INTASSE on AREVENUE is positive, showing that the revenue of publicly listed agrifood enterprises increases with the rise in other staff, R&D spending, and intangible assets. This supports the theoretical framework.
The differences in the average partial effect of the NNPRO on revenue between BIG and non-BIG agricultural food listed companies illustrate that the promulgation of the National Nutrition Plan 2017–2030 is conducive to improving the market structure of China’s agricultural food industry. Consumer buying intentions for the products of small- and medium-sized listed agrifood enterprises significantly increase, while their buying intentions for the products of large listed agrifood enterprises only slightly increase, which helps to strengthen market competition, accelerate research and development in China’s agricultural food enterprises, and improve food safety standards.
In December 2021, the US Department of Agriculture (USDA) and the Department of Health and Human Services (HHS) released the Dietary Guidelines for Americans (2020–2025), which provide recommendations on “what to eat and drink to meet nutritional needs, promote health, and reduce the risk of chronic diseases”. The new guidelines include all groups of people of different ages and consist of four health guidelines for healthy people and people at risk of disease, including encouraging residents to make reasonable food and drink choices and maintain a healthy diet throughout their lives.
Specifically, the Dietary Guidelines for Americans (2020–2025) have four core guidelines: (1) Healthy dietary patterns should be followed at every stage of life. (2) Foods and drinks with a high nutritional density should be selected and enjoyed while considering individual dietary preferences, cultural traditions, and costs. (3) Particular attention should be paid to foods and drinks with a high nutrient density to meet food group requirements and energy suitability limits. 4) Foods and drinks with high added sugar, saturated fatty acid, and sodium contents should be reduced, and alcoholic beverages should be limited. However, none of the four core guidelines mention establishing a nutrition promotion system for agricultural products. In contrast, China explicitly accounts for quality agricultural products in the NNPRO.
The positive impact of the NNPRO on revenue can be explained by the fact that the NNPRO has effectively influenced consumer preferences for healthier agricultural foods. One of the initial goals of the NNPRO was to promote the transformation and upgrade of nutritional agriculture through innovation and enrich the supply of nutritional and healthy agricultural products. Therefore, the results of this study are consistent with the initial goals of the policy.

6. Conclusions

In this study, we employ the translog function to evaluate the NNPRO’s effect on listed agrifood enterprises. We use agrifood enterprises’ annual pooling data from 2015 to 2022. The results indicate that the National Nutrition Plan 2017–2030 has increased the overall agrifood sales of listed agrifood enterprises, but the increase in agrifood sales produced by large listed agrifood enterprises has been slight. In addition to the growth in agrifood sales, we also pay attention to food safety standard improvements and consumers’ changing opinions of agricultural product quality caused by the NNPRO. The NNPRO has strengthened the production and supply of nutritionally high-quality agricultural products, established an agricultural product nutrition promotion system, and improved the quality of agricultural products, which are of milestone significance for improving food safety standards and helping consumers place higher requirements on the quality of agricultural products.
In 2023, China’s GDP per capita was USD 12,700. As Chinese citizens’ purchasing power has increased, they have become more interested in agrifood quality and scientific nutrition. With more convenient trade channels and concerns about the safety of Chinese agrifoods, people in China are paying more attention to international agrifoods. After evaluating the policy content of the NNPRO and our research results, we put forward the following actionable policy recommendations: (1) Further improve agricultural food safety laws; in particular, the food safety problems of listed agrifood companies must be strictly dealt with. (2) Increase the special rectification efforts of listed agrifood companies to prevent food pollution from the source and promote the “Pollution-free Agricultural Food Action Plan”. (3) Further strengthen the supervision of agricultural food circulation. (4) Accelerate the construction of a food safety credit system and the development of information technology for listed agrifood companies through the above measures to improve agricultural product safety standards, strictly regulate and enforce the law, and enhance market confidence. Finally, cooperation between all parties in the agrifood sector (such as government, industry, consumers, and investors) should be promoted to promote the development of sustainable and reliable agrifood systems.
Due to the limited availability of data, this study, like many others on the impact of policy, has significant limitations. First, our data span is from 2015 to 2022. This does not cover the effects of the market changes and government policy interventions in January 2023. If scholars can obtain the latest data for 2023 to cover the latest market and policy developments, they can provide a more accurate framework for future surveys. In addition, our conclusions regarding the plan’s effect on the listed agrifood enterprises are primarily derived from a quantitative analysis. If combined with a qualitative analysis, more accurate study results may be obtained.

Author Contributions

Data curation, Y.L.; formal analysis, C.-C.Y.; investigation, J.C.; methodology, Y.L.; supervision, C.-C.Y.; writing—original draft, J.C.; writing—review and editing, J.C. All authors have read and agreed to the published version of the manuscript.

Funding

This research was funded by the General Project of Social Science Foundation of Fujian Province (grant number FJ2024B120).

Institutional Review Board Statement

Not applicable.

Informed Consent Statement

Not applicable.

Data Availability Statement

CSMAR (2023): China Stock Market and Accounting Research Database; https://data.csmar.com/ (accessed on 21 April 2023).

Conflicts of Interest

The authors declare no conflicts of interest.

References

  1. Food and Agriculture Organization. Rome Declaration on World Food Security; Food and Agriculture Organization: Rome, Italy, 1996. [Google Scholar]
  2. Disease Prevention and Control Bureau of National Health Commission of China. Report on Nutrition and Chronic Diseases of Chinese Residents; People’s Medical Publishing House: Beijing, China, 2015.
  3. International Food Policy Research Institute. Global Nutrition Report—Shining a Light to Spur Action on Nutrition; International Food Policy Research Institute: London, UK, 2018. [Google Scholar]
  4. Boysen, O.; Miller, A.C.; Matthews, A. Economic and Household Impacts of Projected Policy Changes for the Irish Agri-food Sector. J. Agric. Econ. 2016, 67, 105–129. [Google Scholar] [CrossRef]
  5. Niemi, J.; Jansik, C.; Kettunen, L.; Lehtonen, H. A Tool to Analyse the Impact of Policy Changes on the Agri-Food Sector of Finland. In Proceedings of the 89th European Seminar of the European Asssociation of Agricultural Economists, Parma, Italy, 2–5 February 2005; pp. 609–629. [Google Scholar] [CrossRef]
  6. Solis-Navarrete, J.A.; Bucio-Mendoza, S.; Mata-Vázquez, P.; Astudillo-Miller, M.X. Innovation Policy in the Agri-Food Sector: Evidence from Undeveloped Mexican Regions. J. Sci. Technol. Policy Manag. 2021, 12, 149–168. [Google Scholar] [CrossRef]
  7. Petty, W. A Treatise of Taxes and Contributions; EEBO Editions; ProQuest: Ann Arbor, MI, USA, 1662; ISBN 978-3337441807. [Google Scholar]
  8. Adam, S. An Inquiry into the Nature and Causes of the Wealth of Nations; Modern Library: New York, NY, USA, 1776; ISBN 978-0865970083. [Google Scholar]
  9. Ricardo, D. On the Principles of Political Economy and Taxation; John Murray: London, UK, 1817; ISBN 978-3487409290. [Google Scholar]
  10. Bailey, S. A Critical Dissertation on the Nature, Measures, and Causes of Value; R. Hunter: London, UK, 1825; ISBN 978-0714610726. [Google Scholar]
  11. Malthus, T.R. Principles of Political Economy; Cambridge University Press: Cambridge, UK, 1989; ISBN 978-0521075916. [Google Scholar]
  12. Say, J.-B. Traité D’Économie Politique; Kelley: New York, NY, USA, 1803; ISBN 978-2717853186. [Google Scholar]
  13. Marshall, A. Principles of Economic; Macmillan: London, UK, 1890; ISBN 978-1605208015. [Google Scholar]
  14. MacMaoláin, C. EU Food Law: Protecting Consumers and Health in a Common Market; Bloomsbury Publishing: London, UK, 2007; ISBN 978-1841134987. [Google Scholar]
  15. Aparicio, A.A. Who is a ‘Consumer’ on Food Law: Some Reflections on the Notion of Consumer and the EU Food Law. In The Ethics of Consumption; Wageningen Academic Publishers: Wageningen, The Netherlands, 2013; pp. 465–470. ISBN 978-9086862313. [Google Scholar]
  16. Pisanello, D. What Do Food Safety and Fair Trade Stand For-Reconciling the Twofold Objective of EU Food Law. Eur. Food Feed. Law Rev. 2009, 4, 320–328. [Google Scholar]
  17. Edinger, W.H. The Gullible Consumer in EU Food Law. In The Ethics of Consumption; Wageningen Academic Publishers: Wageningen, The Netherlands, 2013; pp. 135–140. ISBN 978-9086862313. [Google Scholar]
  18. Adalja, A.; Lichtenberg, E. Produce Growers’ Cost of Complying with the Food Safety Modernization Act. Food Policy 2018, 74, 23–38. [Google Scholar] [CrossRef]
  19. Ribera, L.A.; Knutson, R.D. The FDA’s Food Safety Modernization Act and Its Economic Implications. Choices 2011, 26, 1–6. [Google Scholar]
  20. Strauss, D.M. An Analysis of the FDA Food Safety Modernization Act: Protection for Consumers and Boon for Business. Food Drug Law J. 2011, 66, 353–376. [Google Scholar]
  21. Bovay, J.; Sumner, D.A. Economic Effects of the US Food Safety Modernization Act. Appl. Econ. Perspect. Policy 2018, 40, 402–420. [Google Scholar] [CrossRef]
  22. Wheelock, V. Initial Impact of the Food Safety Act. Br. Food J. 1991, 93, 24–27. [Google Scholar] [CrossRef]
  23. Hobbs, J.E.; Kerr, W.A. Costs of Monitoring Food Safety and Vertical Coordination in Agribusiness: What can be Learned from the British Food Safety Act 1990? Agribusiness 1993, 8, 575–584. [Google Scholar]
  24. Simpson, S. The Food Safety Act: Food Manufacturer Response and Attitude. Br. Food J. 1992, 94, 3–7. [Google Scholar] [CrossRef]
  25. Clark, J.B. Impact and Analysis of the US Federal Organic Food Production Act of 1990 with Particular Reference to the Great Lakes. U. Tol. L. Rev. 1994, 26, 323. [Google Scholar]
  26. Carroll, C.S. What Does Organic Mean Now-Chickens and Wild Fish Are Undermining the Organic Foods Production Act of 1990. San Joaquin Agric. Law Rev. 2004, 14, 117. [Google Scholar]
  27. Klonsky, K. The Organic Foods Production Act: How Will Implementation Change the Face of California’s Organic Agriculture? Agric. Resour. Econ. Update 2001, 4, 7–9. [Google Scholar]
  28. Lee, Y.; Mozaffarian, D.; Sy, S.; Huang, Y.; Liu, J.; Wilde, P.E.; Micha, R. Cost-Effectiveness of Financial Incentives for Improving Diet and Health through Medicare and Medicaid: A Microsimulation Study. PLoS Med. 2019, 16, e1002761. [Google Scholar] [CrossRef]
  29. Black, A.P.; Vally, H.; Morris, P.; Daniel, M.; Esterman, A.; Karschimkus, C.S.; O’Dea, K. Nutritional Impacts of a Fruit and Vegetable Subsidy Programme for Disadvantaged Australian Aboriginal Children. Br. J. Nutr. 2013, 110, 2309–2317. [Google Scholar] [CrossRef]
  30. Waterlander, W.E.; Jiang, Y.; Nghiem, N.; Eyles, H.; Wilson, N.; Cleghorn, C.; Blakely, T. The Effect of Food Price Changes on Consumer Purchases: A Randomised Experiment. Lancet Public Health 2019, 4, e394–e405. [Google Scholar] [CrossRef]
  31. Black, A.P.; Vally, H.; Morris, P.S.; Daniel, M.; Esterman, A.J.; Smith, F.E.; O’Dea, K. Health Outcomes of a Subsidised Fruit and Vegetable Program for Aboriginal Children in Northern New South Wales. Med. J. Aust. 2013, 199, 46–50. [Google Scholar] [CrossRef] [PubMed]
  32. Kalamov, Z. A Sales Tax is Better at Promoting Healthy Diets Than the Fat Tax and the Thin Subsidy. Health Econ. 2020, 29, 353–366. [Google Scholar] [CrossRef]
  33. Leicester, A.; Windmeijer, F. The ‘Fat Tax’: Economic Incentives to Reduce Obesity. Inst. Fisc. Stud. 2004, 49, 1–19. [Google Scholar]
  34. Tiffin, R.; Arnoult, M. The Public Health Impacts of a Fat Tax. Eur. J. Clin. Nutr. 2011, 65, 427–433. [Google Scholar] [CrossRef] [PubMed]
  35. Allais, O.; Bertail, P.; Nichèle, V. The Effects of a Fat Tax on French Households’ Purchases: A Nutritional Approach. Am. J. Agric. Econ. 2010, 92, 228–245. [Google Scholar] [CrossRef]
  36. Smed, S. Financial Penalties on Foods: The Fat Tax in Denmark. Nutr. Bull. 2012, 37, 142–147. [Google Scholar] [CrossRef]
  37. Strnad, J. Conceptualizing the Fat Tax: The Role of Food Taxes in Developed Economies. S. Cal. L. Rev. 2004, 78, 1221. [Google Scholar] [CrossRef]
  38. Roberto, C.A.; Wong, D.; Musicus, A.; Hammond, D. The influence of Sugar-Sweetened Beverage Health Warning Labels on Parents’ Choices. Pediatrics 2016, 137, e20153185. [Google Scholar] [CrossRef] [PubMed]
  39. Bollard, T.; Maubach, N.; Walker, N.; Mhurchu, C.N. Effects of Plain Packaging, Warning Labels, and Taxes on Young People’S Predicted Sugar-Sweetened Beverage Preferences: An Experimental Study. Int. J. Behav. Nutr. Phys. 2016, 13, 95. [Google Scholar] [CrossRef] [PubMed]
  40. Billich, N.; Blake, M.R.; Backholer, K.; Cobcroft, M.; Li, V.; Peeters, A. The Effect of Sugar-Sweetened Beverage Front-Of-Pack Labels on Drink Selection, Health Knowledge and Awareness: An Online Randomised Controlled Trial. Appetite 2018, 128, 233–241. [Google Scholar] [CrossRef]
  41. Franckle, R.L.; Levy, D.E.; Macias-Navarro, L.; Rimm, E.B.; Thorndike, A.N. Traffic-Light Labels and Financial Incentives to Reduce Sugar-Sweetened Beverage Purchases by Low-Income Latino Families: A Randomized Controlled Trial. Public Health Nutr. 2018, 21, 1426–1434. [Google Scholar] [CrossRef] [PubMed]
  42. Kao, K.E.; Jones, A.C.; Ohinmaa, A.; Paulden, M. The Health and Financial Impacts of a Sugary Drink Tax Across Different Income Groups in Canada. Econ. Hum. Biol. 2020, 38, 100869. [Google Scholar] [CrossRef]
  43. Alsukait, R.; Wilde, P.; Bleich, S.; Singh, G.; Folta, S. Impact of Saudi Arabia’s Sugary Drink Tax on Prices and Purchases. Curr. Dev. Nutr. 2019, 3, 1. [Google Scholar] [CrossRef]
  44. Bleich, S.N.; Wolfson, J.A.; Jarlenski, M.P. Calorie Changes in Chain Restaurant Menu Items: Implications for Obesity and Evaluations of Menu Labeling. Am. J. Prev. Med. 2015, 48, 70–75. [Google Scholar] [CrossRef]
  45. VanEpps, E.M.; Roberto, C.A.; Park, S.; Economos, C.D.; Bleich, S.N. Restaurant Menu Labeling Policy: Review of Evidence and Controversies. Curr. Obes. Rep. 2016, 5, 72–80. [Google Scholar] [CrossRef]
  46. Burton, S.; Kees, J. Flies in the Ointment? Addressing Potential Impediments to Population-Based Health Benefits of Restaurant Menu Labeling Initiatives. J. Public Policy Mark. 2012, 31, 232–239. [Google Scholar]
  47. Scourboutakos, M.J.; Orr, S.; Hobin, E.; Murphy, S.A.; Manson, H.; L’Abbé, M.R. Assessing the Early Impact of Menu-Labeling on Calories in Chain Restaurants in Ontario, Canada. Am. J. Prev. Med. 2019, 56, 195–203. [Google Scholar] [CrossRef] [PubMed]
  48. Chriqui, J.; Resnick, E.; Schneider, L.; Schermbeck, R.; Adcock, T.; Carrion, V.; Chaloupka, F. School District Wellness Policies: Evaluating Progress and Potential for Improving Children’s Health Five Years after the Federal Mandate; Robert Wood Johnson Foundation: Puleston, NJ, USA, 2013. [Google Scholar]
  49. Masse, L.C.; Perna, F.; Agurs-Collins, T.; Chriqui, J.F. Change in School Nutrition-Related Laws from 2003 to 2008: Evidence From the School Nutrition-Environment State Policy Classification System. Am. J. Public Health 2013, 103, 1597–1603. [Google Scholar] [CrossRef] [PubMed]
  50. Ogden, C.L.; Carroll, M.D.; Kit, B.K.; Flegal, K.M. Prevalence of Childhood and Adult Obesity in the United States, 2011–2012. JAMA 2014, 311, 806–814. [Google Scholar] [CrossRef] [PubMed]
  51. Johnston, L.D.; O’Malley, P.M.; Terry-McElrath, Y.M.; Freedman-Doan, P.; Brenner, J.S. School Policies and Practices to Improve Health and Prevent Obesity: National Secondary School Survey Results; Institute for Social Research: Ann Arbor, MI, USA, 2011. [Google Scholar]
  52. Turner, L.; Chaloupka, F.J.; Chriqui, J.F.; Sandoval, A. School Policies and Practices to Improve Health and Prevent Obesity: National Elementary School Survey Results; University of Illinois at Chicago: Chicago, IL, USA, 2010. [Google Scholar]
  53. Larson, N.; Story, M. Are ’Competitive Foods’ Sold at School Making Our Children Fat? Health Affair. 2010, 29, 430–435. [Google Scholar] [CrossRef] [PubMed]
  54. Chriqui, J.F.; Pickel, M.; Story, M. Influence of School Competitive Food and Beverage Policies on Obesity, Consumption, and Availability: A Systematic Review. JAMA Pediatr. 2014, 168, 279–286. [Google Scholar] [CrossRef] [PubMed]
  55. Chriqui, J.F.; Turner, L.; Taber, D.R.; Chaloupka, F.J. Association between District and State Policies and US Public Elementary School Competitive Food and Beverage Environments. JAMA Pediatr. 2013, 167, 714–722. [Google Scholar] [CrossRef] [PubMed]
  56. Cullen, K.W.; Watson, K.; Zakeri, I. Improvements in Middle School Student Dietary Intake after Implementation of the Texas Public School Nutrition Policy. Am. J. Public Health 2008, 98, 111–117. [Google Scholar] [CrossRef]
  57. Foster, G.D.; Sherman, S.; Borradaile, K.E. A Policy-Based School Intervention to Prevent Overweight and Obesity. Pediatrics 2008, 121, e794–e802. [Google Scholar] [CrossRef]
  58. Jaime, P.C.; Lock, K. Do School Based Food and Nutrition Policies Improve Diet and Reduce Obesity? Prev. Med. 2009, 48, 45–53. [Google Scholar] [CrossRef] [PubMed]
  59. Taber, D.R.; Chriqui, J.F.; Chaloupka, F.J. Differences in Nutrient Intake Associated with State Laws Regarding Fat, Sugar, and Caloric Content of Competitive Foods. Arch. Pediatr. Adolesc. Med. 2012, 166, 452–458. [Google Scholar] [CrossRef] [PubMed]
  60. Taber, D.R.; Chriqui, J.F.; Perna, F.M.; Powell, L.M.; Chaloupka, F.J. Weight Status among Adolescents in States that Govern Competitive Food Nutrition Content. Pediatrics 2012, 130, 437–444. [Google Scholar] [CrossRef] [PubMed]
  61. Woodward-Lopez, G.; Gosliner, W.; Samuels, S.E.; Craypo, L.; Kao, J.; Crawford, P.B. Lessons Learned from Evaluations of California’s Statewide School Nutrition Standards. Am. J. Public Health 2010, 100, 2137–2145. [Google Scholar] [CrossRef] [PubMed]
  62. Kubik, M.Y.; Wall, M.; Shen, L.; Nanney, M.S.; Nelson, T.F.; Laska, M.N.; Story, M. State but not District Nutrition Policies are Associated with Less Junk Food in Vending Machines and School Stores in US Public Schools. J. Am. Diet. Assoc. 2010, 110, 1043–1048. [Google Scholar] [CrossRef]
  63. Long, M.W.; Henderson, K.E.; Schwartz, M.B. Evaluating the Impact of a Connecticut Program to Reduce Availability of Unhealthy Competitive Food in Schools. J. Sch. Health 2010, 80, 478–486. [Google Scholar] [CrossRef]
  64. Phillips, M.M.; Raczynski, J.M.; West, D.S.; Pulley, L.; Bursac, Z.; Gauss, C.H.; Walker, J.F. Changes in School Environments with Implementation of Arkansas Act 1220 of 2003. Obesity 2010, 18, S54–S61. [Google Scholar] [CrossRef] [PubMed]
  65. Samuels, S.E.; Bullock, S.L.; Woodward-Lopez, G.; Clark, S.E.; Kao, J.; Craypo, L.; Crawford, P.B. To What Extent have High Schools in California been Able to Implement State-Mandated Nutrition Standards? J. Adolesc. Health 2009, 45, S38–S44. [Google Scholar] [CrossRef]
  66. Samuels, S.E.; Hutchinson, K.S.; Craypo, L.; Barry, J.; Bullock, S.L. Implementation of California State School Competitive Food and Beverage Standards. J. Sch. Health 2010, 80, 581–587. [Google Scholar] [CrossRef]
  67. Taber, D.R.; Stevens, J.; Evenson, K.R.; Ward, D.S.; Poole, C.; Maciejewski, M.L.; Brownson, R.C. State Policies Targeting Junk Food in Schools: Racial/Ethnic Differences in the Effect of Policy Change on Soda Consumption. Am. J. Public Health 2011, 101, 1769–1775. [Google Scholar] [CrossRef]
  68. Cullen, K.W.; Watson, K.B. The Impact of the Texas Public School Nutrition Policy on Student Food Selection and Sales in Texas. Am. J. Public Health 2009, 99, 706–712. [Google Scholar] [CrossRef] [PubMed]
  69. Trusts, P.C. Health Impact Assessment: National Nutrition Standards for Snack and a la Carte Foods and Beverages Sold in Schools; Pew Charitable Trusts: Washington, DC, USA, 2012. [Google Scholar]
  70. Testa, F.; Russo, M.V.; Cornwell, T.B.; McDonald, A.; Reich, B. Social Sustainability as Buying Local: Effects of Soft Policy, Meso-Level Actors, and Social Influences on Purchase Intentions. J. Public Policy Mark. 2018, 37, 152–166. [Google Scholar] [CrossRef]
  71. Cai, L.; Hu, X.; Liu, S.; Wang, L.; Wang, X.; Tu, H.; Tong, Y. China is Implementing the National Nutrition Plan of Action. Front. Nutr. 2022, 9, 983484. [Google Scholar] [CrossRef]
  72. Wu, J.J. Innovation and Development Trend of China’s Nutrition and Functional Food Industry under the Background of National Nutrition Plan. J. Food Saf. Food Qual. 2021, 4, 3164–3171. [Google Scholar]
  73. Yang, B.; Huang, X.; Liu, Q.; Tang, S.; Story, M.; Chen, Y.; Zhou, M. Child Nutrition Trends over the Past Two Decades and Challenges for Achieving Nutrition SDGs and National Targets in China. Int. J. Environ. Res. Public Health 2020, 17, 1129. [Google Scholar] [CrossRef] [PubMed]
  74. Tsai, T.; Yang, C.; Fu, C. Knowledge spillover effect and human capital. Yat–Sen Manag. Rev. 2010, 17, 250–278. [Google Scholar]
  75. Christensen, L.R.; Greene, W.H. Economies of Scale in U.S. Electric Power Generation. J. Polit. Econ. 1976, 84, 655–676. [Google Scholar] [CrossRef]
  76. Darrough, M.N.; Heineke, J.M. The Multi-Output Translog Production Cost Function: The Case of Law Enforcement Agencies; North-Holland Publishing Company: Amsterdam, The Netherlands, 1978. [Google Scholar]
  77. Berndt, E.R.; Christensen, L.R. The Translog Function and the Substitution of Equipment, Structures, and Labor in U.S. Manufacturing 1929–1968. J. Econ. 1973, 1, 81–114. [Google Scholar] [CrossRef]
  78. Schultz, T.W. Investment in Human Capital. Am. Econ. Rev. 1961, 51, 1–17. [Google Scholar]
  79. Wang, I.; Shieh, C.; Wang, F. Effect of Human Capital Investment on Organizational Performance. Soc. Behav. Personal. Int. J. 2008, 36, 1011–1022. [Google Scholar] [CrossRef]
  80. Nezam, M.; Ataffar, A.; Isfahani, A.; Shahin, A. Human Capital and New Product Development Performance Efficiency—The Mediating Role of Organisational Learning Capability. Int. J. Innov. Learn. 2016, 20, 26–46. [Google Scholar] [CrossRef]
  81. Wang, M.; Hwang, K.; Lin, S. An Empirical Study of the Relationships among Employee’s Perceptions of HR Practice, Human Capital, and Department Performance: A Case of at & T Subordinate Telecoms Company in Taiwan. Expert. Syst. Appl. 2011, 38, 3777–3783. [Google Scholar] [CrossRef]
  82. Kujansivu, P.; Lonnqvist, A. How do Investments in Intellectual Capital Create Profits? Int. J. Learn. Intellect. Cap. 2007, 4, 304–319. [Google Scholar] [CrossRef]
  83. Unger, J.; Rauch, A.; Frese, M.; Rosenbusch, N. Human Capital and Entrepreneurial Success: A Meta-Analytical Review. J. Bus. Ventur. 2011, 26, 341–358. [Google Scholar] [CrossRef]
  84. Gimeno, J.; Folta, T.; Cooper, A.; Woo, C. Survival of the Fittest? Entrepreneurial Human Capital and the Persistence of Underperforming Firms. Adm. Sci. Q. 1997, 42, 750–783. [Google Scholar] [CrossRef]
  85. Hitt, M.A.; Bierman, L.; Shimizu, K.; Kochhar, R. Direct and Moderating Effects of Human Capital on Strategy and Performance in Professional Service Firms: A Resource–Based Perspective. Acad. Manag. J. 2001, 44, 13–28. [Google Scholar] [CrossRef]
  86. Lobel, O. The New Cognitive Property: Human Capital Law and the Reach of Intellectual Property. Tex. Law Rev. 2014, 93, 789–851. [Google Scholar] [CrossRef]
  87. Dimov, D. Nascent Entrepreneurs and Venture Emergence: Opportunity Confidence, Human Capital, and Early Planning. J. Manag. Stud. 2010, 47, 1123–1153. [Google Scholar] [CrossRef]
  88. Martin, B.; McNally, J.; Kay, M. Examining the Formation of Human Capital in Entrepreneurship: A Meta-Analysis of Entrepreneurship Education Outcomes. J. Bus. Ventur. 2013, 28, 211–224. [Google Scholar] [CrossRef]
  89. Coelli, T.J.; Rao, D.S.P.; O’Donnell, C.J.; Battese, G.E. An Introduction to Efficiency and Productivity Analysis; Springer Science & Business Media: Berlin/Heidelberg, Germany, 2005; ISBN 978-0387242651. [Google Scholar]
  90. Crook, T.R.; Todd, S.Y.; Combs, J.G.; Woehr, D.J.; Ketchen, D.J. Does Human Capital Matter? A Meta–Analysis of the Relationship between Human Capital and Firm Performance. J. Appl. Psychol. 2011, 96, 443–456. [Google Scholar] [CrossRef]
Figure 1. Implementation mechanism of the National Nutrition Plan 2017–2030.
Agriculture 14 00677 g001
Table 1. Variable definitions.
VariableDefinition
Theoretical
Variable
Proxy
Variable
rAREVENUEThe revenue of agrifood enterprise
x1MSTAFFManagement employees
x2RSTAFFR&D employees
x3OSTAFFOrdinary employees
EMPLOYEENumber of employees of all types
fFIXEDFixed assets
dDEVELOPR&D expenses
bINTASSEIntangible assets
BIGDummy variable. If the agrifood company is in the top three agrifood companies in China, BIG = 1; otherwise, BIG = 0
NNPRODummy variable. In 2018–2022, NNPRO = 1; in 2015–2017, NNPRO = 0
YEARIn 2015, YEAR = 1; in 2016, YEAR = 2, and so on
Table 2. Sample descriptive statistics.
Panel A:2015 (n = 43)2016 (n = 51)
VariableMaxMinMeanMedianStd. Dev.MaxMinMeanMedianStd. Dev.
AREVENUE¥1030.00¥23.27¥311.00¥173.00¥290.00¥1520.00¥28.50¥403.00¥289.00¥356.00
MSTAFF23.00 11.00 15.09 14.00 3.36 29.00 11.00 16.04 14.00 4.96
RSTAFF316.00 17.00 126.05 88.00 105.68 322.00 11.00 139.14 99.00 106.22
OSTAFF31,960.00 228.00 3315.93 1188.00 6728.77 31,975.00 208.00 4277.08 1560.00 8355.96
EMPLOYEE32,289.00 265.00 3457.07 1513.00 6777.46 32,304.00 259.00 4432.26 1687.00 8410.05
FIXED¥3960.00¥153.00¥746.00¥622.00¥791.00¥3810.00¥137.00¥910.00¥724.00¥894.00
DEVELOP¥124.00¥0.45¥17.46¥10.37¥23.05¥224.00¥0.44¥24.15¥11.54¥40.96
INTASSE¥2070.00¥23.57¥343.00¥191.00¥565.00¥2970.00¥16.87¥401.00¥201.00¥704.00
Panel B:2017 (n = 47)2018 (n = 45)
VariableMaxMinMeanMedianStd. Dev.MaxMinMeanMedianStd. Dev.
AREVENUE¥1930.00¥41.11¥370.00¥263.00¥369.00¥2410.00¥33.62¥473.00¥270.00¥501.00
MSTAFF28.00 6.00 15.15 14.00 5.56 27.00 7.00 15.47 14.00 5.32
RSTAFF409.00 13.00 146.60 153.00 119.65 453.00 12.00 138.47 68.00 133.62
OSTAFF33,932.00 203.00 3255.21 1531.00 6751.64 35,128.00 148.00 5257.84 1646.00 10,029.21
EMPLOYEE34,261.00 237.00 3416.96 1576.00 6796.61 35,428.00 194.00 5411.78 1668.00 10,077.08
FIXED¥3260.00¥123.00¥833.00¥700.00¥700.00¥3200.00¥108.00¥1130.00¥696.00¥897.00
DEVELOP¥323.00¥0.27¥29.77¥8.39¥61.07¥449.00¥0.57¥40.50¥11.79¥86.57
INTASSE¥2890.00¥15.12¥437.00¥194.00¥771.00¥2820.00¥12.22¥481.00¥248.00¥766.00
Panel C:2019 (n = 48)2020 (n = 50)
VariableMaxMinMeanMedianStd. Dev.MaxMinMeanMedianStd. Dev.
AREVENUE¥4770.00¥54.83¥571.00¥368.00¥757.00¥5750.00¥38.97¥588.00¥376.00¥860.00
MSTAFF27.00 7.00 15.33 14.00 4.40 23.00 6.00 14.10 13.50 3.85
RSTAFF510.00 8.00 116.60 63.50 128.77 456.00 15.00 131.60 71.00 131.29
OSTAFF34,629.00 77.00 4779.25 1299.00 9510.60 34,100.00 171.00 4571.84 978.00 9218.68
EMPLOYEE34,921.00 101.00 4911.19 1353.50 9563.40 34,412.00 201.00 4717.54 1036.00 9275.94
FIXED¥3190.00¥96.86¥1100.00¥640.00¥917.00¥3270.00¥90.47¥1100.00¥599.00¥968.00
DEVELOP¥412.00¥0.25¥30.69¥10.43¥66.23¥346.00¥0.11¥27.53¥10.57¥54.74
INTASSE¥2750.00¥10.73¥457.00¥222.00¥733.00¥2670.00¥8.78¥437.00¥178.00¥709.00
Panel D:2021 (n = 60)2022 (n = 62)
VariableMaxMinMeanMedianStd. Dev.MaxMinMeanMedianStd. Dev.
AREVENUE¥5000.00¥33.37¥518.00¥301.00¥745.00¥4920.00¥49.27¥608.00¥416.00¥752.00
MSTAFF21.00 7.00 14.05 14.00 3.19 22.00 6.00 14.02 14.00 3.41
RSTAFF451.00 14.00 125.62 74.50 117.94 457.00 19.00 134.18 98.00 117.26
OSTAFF33,224.00 140.00 3885.30 928.00 8271.54 33,048.00 115.00 3887.61 1166.00 8041.56
EMPLOYEE33,530.00 186.00 4024.97 1061.00 8325.33 33,349.00 169.00 4035.81 1427.00 8087.92
FIXED¥3260.00¥48.50¥999.00¥534.00¥973.00¥3300.00¥71.69¥1020.00¥579.00¥963.00
DEVELOP¥275.00¥0.10¥25.06¥12.38¥41.19¥423.00¥0.10¥38.93¥14.33¥71.05
INTASSE¥2610.00¥8.08¥383.00¥152.00¥647.00¥2550.00¥9.08¥410.00¥199.00¥635.00
Note: AREVENUE, FIXED, DEVELOP, and INTASSE are expressed in millions of RMB.
Table 3. Spearman and Pearson correlation coefficients.
VariableAREVENUEMSTAFFRSTAFFOSTAFFEMPLOYEEFIXEDDEVELOPINTASSEBIGNNPRO
AREVENUE1.000 0.175 ***0.421 ***0.563 ***0.572 ***0.579 ***0.293 ***0.661 ***0.634 ***0.132 ***
-----(0.000) (0.000) (0.000) (0.000) (0.000) (0.000) (0.000) (0.000) (0.008)
MSTAFF0.189 ***1.000 0.535 ***0.244 ***0.262 ***0.187 ***0.382 ***0.396 ***0.145 ***−0.064
(0.000) -----(0.000) (0.000) (0.000) (0.000) (0.000) (0.000) (0.004) (0.195)
RSTAFF0.319 ***0.591 ***1.000 0.405 ***0.448 ***0.351 ***0.561 ***0.537 ***0.425 ***−0.075
(0.000) (0.000) -----(0.000) (0.000) (0.000) (0.000) (0.000) (0.000) (0.132)
OSTAFF0.324 ***−0.015 0.412 ***1.000 0.996 ***0.884 ***−0.077 0.724 ***0.412 ***−0.018
(0.000) (0.769) (0.000) -----(0.000) (0.000) (0.123) (0.000) (0.000) (0.713)
EMPLOYEE0.327 ***−0.006 0.424 ***0.999 ***1.000 0.884 ***−0.035 0.729 ***0.419 ***−0.025
(0.000) (0.909) (0.000) (0.000) -----(0.000) (0.479) (0.000) (0.000) (0.614)
FIXED0.346 ***0.041 0.413 ***0.782 ***0.783 ***1.000 −0.022 0.738 ***0.391 ***0.054
(0.000) (0.405) (0.000) (0.000) (0.000) -----(0.652) (0.000) (0.000) (0.278)
DEVELOP0.318 ***0.573 ***0.629 ***−0.053 −0.043 0.039 1.000 0.173 ***0.281 ***0.080
(0.000) (0.000) (0.000) (0.291) (0.387) (0.436) -----(0.000) (0.000) (0.106)
INTASSE0.215 ***0.287 ***0.235 ***0.151 ***0.153 ***0.22 ***0.151 ***1.000 0.499 ***0.036
(0.000) (0.000) (0.000) (0.002) (0.002) (0.000) (0.002) -----(0.000) (0.466)
BIG0.567 ***0.184 ***0.430 ***0.399 ***0.403 ***0.334 ***0.238 ***0.325 ***1.000 −0.032
(0.000) (0.000) (0.000) (0.000) (0.000) (0.000) (0.000) (0.000) -----(0.515)
NNPRO0.143 ***−0.103 ** −0.033 0.044 0.043 0.122 **0.069 0.024 −0.032 1.000
(0.004) (0.038) (0.505) (0.381) (0.389) (0.014) (0.168) (0.631) (0.515) -----
Note: 1. The left and right of Table 3 display the Pearson and Spearman coefficients, respectively. 2. The symbols *, **, and *** represent significance levels of 10%, 5%, and 1%, respectively.
Table 4. Translog model estimates.
Equation (6)
VariableCoeffVariableCoeff
t-Stat.t-Stat.
Intercept−25.466 (lnMSTAFF)(lnDEVELOP)0.190
(−0.994)(1.154)
lnMSTAFF9.851 (lnMSTAFF)(lnINTASSE)0.025
(1.234) (0.087)
lnRSTAFF3.009 (lnRSTAFF)(lnOSTAFF)−0.024
(1.338) (−0.234)
lnOSTAFF−7.634 **(lnRSTAFF)(lnFIXED)−0.061
(−2.536)(−0.496)
lnFIXED4.311 (lnRSTAFF)(lnDEVELOP)−0.043
(1.124) (−0.801)
lnDEVELOP−2.937 **(lnRSTAFF)(lnINTASSE)0.020
(−2.501)(0.311)
lnINTASSE3.017 (lnOSTAFF)(lnFIXED)0.355
(1.058) (1.617)
(lnMSTAFF)20.248 (lnOSTAFF)(lnDEVELOP)−0.025
(0.357) (−0.495)
(lnRSTAFF)20.088 (lnOSTAFF)(lnINTASSE)0.079
(1.342) (0.767)
(lnOSTAFF)2−0.183 **(lnFIXED)(lnDEVELOP)0.134 *
(−2.166)(1.688)
(lnFIXED)2−0.153 (lnFIXED)(lnINTASSE)−0.012
(−0.911)(−0.073)
(lnDEVELOP)20.035 **(lnDEVELOP)(lnINTASSE)−0.046
(2.050) (−1.146)
(lnINTASSE)2−0.071 BIG0.276 **
(−1.322)(2.351)
(lnMSTAFF)(lnRSTAFF)−0.792 **NNPRO0.144 **
(−2.500)(2.037)
(lnMSTAFF)(lnOSTAFF)0.851 **BIGNNPRO−0.019
(2.029) (−0.133)
(lnMSTAFF)(lnFIXED)−0.867 YEAR0.966 ***
(−1.568)(6.724)
YEAR2−0.071 **
(−2.238)
R-squared0.795
Degree of freedom405
Null hypothesis ( α i l = γ i 1 = ε i 1 = μ i 1 = θ 11 = ρ 11 = σ 11 = 0 )
F-stat.2.51
Sign. level0.000
Note: 1. The symbols *, **, and *** represent significance levels of 10%, 5%, and 1%, respectively. 2. For definitions of all the variables utilized in this study, see Table 1.
Table 5. APE of variables.
ValueSignificance Test
APE_MSTAFF−0.143 H 0 : α 1 = α 11 = α 12 = α 13 = γ 11 = ε 11 = μ 11 = 0
F-stat. = 2.13
Sign. level = 0.04
APE_RSTAFF−0.098 H 0 : α 2 = α 22 = α 12 = α 23 = γ 21 = ε 21 = μ 21 = 0
F-stat. = 2.21
Sign. level = 0.03
APE_OSTAFF0.210 H 0 : α 3 = α 33 = α 13 = α 23 = γ 31 = ε 31 = μ 31 = 0
F-stat. = 3.50
Sign. level = 0.00
APE_FIXED−0.014 H 0 : β 1 = β 11 = γ 11 = γ 21 = γ 31 = θ 11 = ρ 11 = 0
F-stat. = 0.80
Sign. level = 0.58
APE_DEVELOP0.173 H 0 : δ 1 = δ 11 = ε 11 = ε 21 = ε 31 = θ 11 = σ 11 = 0
F-stat. = 5.37
Sign. level = 0.00
APE_INTASSE0.064 H 0 : ϵ 1 = ϵ 11 = μ 11 = μ 21 = μ 31 = ρ 11 = σ 11 = 0
F-stat. = 0.61
Sign. level = 0.75
APE_BIG H 0 : φ 1 = φ 3 = 0
When NNPRO = 00.276 F-stat. = 4.23
When NNPRO = 10.256 Sign. level = 0.02
APE_NNPRO H 0 : φ 2 = φ 3 = 0
When BIG = 00.144 F-stat. = 2.56
When BIG = 10.125 Sign. level = 0.08
H 0 : τ 1 = τ 2 = 0
APE_YEAR0.824F-stat. = 109.88
Sign. level = 0.00
Disclaimer/Publisher’s Note: The statements, opinions and data contained in all publications are solely those of the individual author(s) and contributor(s) and not of MDPI and/or the editor(s). MDPI and/or the editor(s) disclaim responsibility for any injury to people or property resulting from any ideas, methods, instructions or products referred to in the content.

