Abstract
(1) Background: The effective selection of hyperspectral feature bands is pivotal in monitoring the nutritional status of intricate alpine grasslands on the Qinghai–Tibet Plateau. The traditional methods often employ hierarchical screening of multiple feature indicators, but their universal applicability suffers due to the use of a consistent methodology across diverse environmental contexts. To remedy this, a backward feature elimination (BFE) selection method has been proposed to assess indicator importance and stability. (2) Methods: As research indicators, the crude protein (CP) and chlorophyll (Chl) contents in degraded grasslands on the Qinghai–Tibet Plateau were selected. The BFE method was integrated with partial least squares regression (PLS), random forest (RF) regression, and tree-based regression (TBR) to develop CP and Chl inversion models. The study delved into the significance and consistency of the forage quality indicator bands. Subsequently, a path analysis framework (PLS-PM) was constructed to analyze the influence of grassland community indicators on SpecChl and SpecCP. (3) Results: The implementation of the BFE method notably enhanced the prediction accuracy, with ΔR2RF-Chl = 56% and ΔR2RF-CP = 57%. Notably, spectral bands at 535 nm and 2091 nm emerged as pivotal for CP prediction, while vegetation indices like the PRI and mNDVI were critical for Chl estimation. The goodness of fit for the PLS-PM stood at 0.70, indicating the positive impact of environmental factors such as grassland cover on SpecChl and SpecCP prediction (rChl = 0.73, rCP = 0.39). SpecChl reflected information pertaining to photosynthetic nitrogen associated with photosynthesis (r = 0.80). (4) Disscusion: Among the applied model methods, the BFE+RF method is excellent in periodically discarding variables with the smallest absolute coefficient values. This variable screening method not only significantly reduces data dimensionality, but also gives the best balance between model accuracy and variables, making it possible to significantly improve model prediction accuracy. In the PLS-PM analysis, it was shown that different coverage and different community structures and functions affect the estimation of SpecCP and SpecChl. In addition, SpecChl has a positive effect on the estimation of SpecCP (r = 0.80), indicating that chlorophyll does reflect photosynthetic nitrogen information related to photosynthesis, but it is still difficult to obtain non-photosynthetic and compound nitrogen information. (5) Conclusions: The application of the BFE + RF method to monitoring the nutritional status of complex alpine grasslands demonstrates feasibility. The BFE filtration process, focusing on importance and stability, bolsters the system’s generalizability, resilience, and versatility. A key research avenue for enhancing the precision of CP monitoring lies in extracting non-photosynthetic nitrogen information.
1. Introduction
Grasslands are an important part of our natural resources and the foundation of modern agricultural development, as they have a vast spatial scope, quantifiable and measurable characteristics, production potential, and a key role in maintaining ecological balance [1,2]. However, in recent years, due to climate change and human pressure [3,4], our region of interest has suffered severe grassland degradation, which has brought significant challenges to the sustainable development of the local economy (livestock production, grass product production) and the environmental (biodiversity, climate regulation, soil conservation, water conservation, and other ecological services) framework [5,6,7]. In view of these challenges, it is increasingly important to systematically obtain accurate data on grassland conditions [8]. The traditional methods for monitoring grassland resources mainly rely on laboratory testing based on chemical detection methods, which require a large amount of manpower and material resources to collect plant samples for testing and therefore have the disadvantages of being time-consuming and laborious [9]. Hyperspectral remote sensing has become a transformative tool that allows for extensive and effective monitoring of grassland dynamics and conservation status [10]. Its application further promotes the economic and environmental aspects of grassland management and supports sustainable development. Despite this progress, the method for quantifying feed is relatively uncontroversial in terms of its simplicity; qualitative analysis through hyperspectral remote sensing is a considerable obstacle, requiring our methods to be innovative and technically accurate. It is crucial to improve and advance the methods used. Combining advanced analytical techniques and algorithms with field data can improve the accuracy and robustness of the spectral features related to grassland forage quality. The continuous development and validation of these remote sensing methods will not only overcome the limitations of the current assessments but also ensure a sustainable future for grassland ecosystems and the communities that depend on them.
Nitrogen, a paramount element among the essential nutrients, is indispensable for the robust growth of pastures [11]. Traditionally, quantifying nitrogen content in forage leaves, used to assess forage status or nutritional worth, has involved labor-intensive laboratory-based chemical assays, such as the Kjeldahl method, or near-infrared (NIR) spectroscopy techniques [12,13,14]. However, these conventional approaches, though accurate, require extensive sample collection and preparatory processes before subsequent lab analyses. Therefore, determining nitrogen content through these means can be arduous and costly, especially with an increasing sample volume. This is where the ingenuity of grassland nitrogen optical remote sensing becomes prominent, operating within the 400–2500 nm range, covering both visible and near-infrared bands. Once the model is established, near-infrared spectroscopy will greatly reduce the laboratory costs, enabling large-scale coverage and the regular provision of pasture quality data. This technology offers a low-cost, efficient alternative to the rigors of laboratory investigation.
The prowess of remote sensing technology in promptly measuring the nitrogen content across various crops has been thoroughly documented in numerous studies [15,16,17]. At the minute level of the leaf structure, it is evident from spectrometric analysis that the chlorophyll content is the predominant influence on the spectral values, particularly within the 400–700 nm wavelength range, the domain where pigment absorption is most significant [18]. On the other hand, the spectral absorption features attributed to non-pigmented compounds predominately manifest at wavelengths beyond the 700 nm threshold [19]. While nitrogen constitutes only a minor fraction of the leaf mass by itself, the majority of it is intricately linked with pigments and proteins that are integral to the photosynthetic process. Previous research has elucidated that the uptake of nitrogen by crops is especially pronounced within the red and green spectral bands [20,21,22], thus enabling a basis for the estimation of foliar nitrogen content. Specific absorption bands that are characteristic of nitrogen, proteins, and chlorophyll, specifically at wavelengths such as 640 nm [23], 910 nm, 1510 nm, and 2300 nm [24], have been identified and effectively utilized for nitrogen estimation in forage analysis. Moreover, tri-band parameters and vegetation indices—such as red edge slope, red edge vegetation indices (VIs), and red edge position (REP)—have shown a strong correlation with herbage nitrogen content [25]. Noteworthy examples include the soil-adjusted vegetation index (SAVI), normalized difference vegetation index (NDVI), normalized difference nitrogen index (NDNI), and the Structurally Independent Pigmentation Index (SIPI). These spectral signatures, red edge parameters, and vegetation indices are highly responsive to nitrogen levels, significantly impacting the spatial variability and distribution patterns of the nitrogen content in grassland ecosystems. However, despite the precision with which these methods estimate nitrogen content, the link between chlorophyll concentration and nitrogen levels remains an area of debate. By harnessing cutting-edge spectral analysis techniques and developing robust, data-derived spectral indices, we can achieve a more nuanced understanding of this complex interaction. It is through the continual innovation of remote sensing methodologies that we can decipher the real impact of nitrogen on plants’ physiological status.
Hyperspectral data are characterized by large volumes and a high dimensionality [26,27]. Additionally, these variables are typically highly correlated, often exhibiting multicollinearity, a significant challenge in remote sensing data analysis [28,29]. In the context of remote sensing and chemometrics, two methods are commonly employed to analyze hyperspectral data: PLS regression and RF regression [30,31]. PLS regression, recognized as a state-of-the-art non-parametric method for analyzing spectroscopic data, has been widely used in vegetation property mapping [32,33]. On the other hand, RF regression, as an ensemble classification and regression algorithm, has gained popularity in remote sensing for its high accuracy and flexibility when used with complex datasets [34]. Moreover, feature selection techniques play a crucial role in remote sensing analysis. These techniques aim to enhance the predictive accuracy and interpretability of machine learning classification algorithms by eliminating redundant, noisy, or irrelevant variables from training datasets or feature spaces [35]. The goal is often to maximize the accuracy of specific classification models, as measured by precision indicators, by identifying and selecting the most effective combination of features [36]. Therefore, understanding the impact of the feature selection processes on various machine learning or deep learning models applied to remote sensing data is essential.
The overall objective of this study is to estimate the chlorophyll (Chl) and crude protein (CP) content of alpine meadow grasses at various stages of degradation using hyperspectral data through the application of the backward feature elimination (BFE) method. The specific goals of the study are as follows.
- (i)
- To assess the effectiveness of PLS, RF, and tree-based regression methods in the quantification of Chl and CP levels.
- (ii)
- Testing the implementation of the BFE technique to optimize predictive models and determining the most important spectral parameters for predicting grassland quality markers based on their indicator importance and stability.
- (iii)
- To utilize partial least squares path modeling (PLS-PM) to explore both the direct and indirect linkages between the canopy structure and the soil background with spectral estimation of chlorophyll and crude protein contents and to explicate the network of relationships and intricate interactions that interlink these variables.
2. Materials and Methods
2.1. Study Area
The study area is located in an alpine meadow on the northeastern edge of the Qinghai–Tibet Plateau (37°40′ N, 102°32′ E), with altitudes ranging from 2960 m to 3425 m. The region features a moist climate, thin air, and strong solar radiation. The natural vegetation consists of cold temperate humid alpine meadows. This area experiences concurrent hydrothermal conditions with no absolute frost-free period, dividing the year into cold and hot seasons. The average annual temperature is –0.1 °C, with the warmest month, July, averaging 12.7 °C and the coldest month, January, averaging –18.3 °C. The annual accumulated temperature above 0 °C is 1380 °C. The average annual precipitation is 416 mm, mainly concentrated in July, August, and September. The annual evaporation rate is 1592 mm, approximately 3.8 times the precipitation, indicating concurrent hydrothermal periods. The soil types are predominantly subalpine meadow soil and subalpine dark calcareous soil, with the soil depths ranging from 40 to 80 cm and a soil pH of 7.0 to 8.2.
2.2. Grassland Observation Data
2.2.1. Experimental Site Information
Field investigations took place during the peak growth phase of the principal species in the alpine meadow, around mid-August, aiming to improve the general applicability and precision of the fodder nutrient prediction model. Following a four-level gradient standard for grassland degradation, five natural grazing grasslands were selected as the research sample plots for the experiment. The altitude, longitude, and latitude of these sample plots were recorded (Table 1).

Table 1.
Types and geographical positions of the grassland communities.
Using an equidistant sampling method for the sample investigation, 24 samples of 1 m × 1 m were collected from each degradation gradient sample area, with a distance of 5 m between each sample. A total of 120 samples of 1 m × 1 m were collected. In each subplot, a FieldSpec 4Hi-ResASD4Hi-ResASD ground object spectrometer (spectral range: 350 to 2500 nm; spectral acquisition time: 100 milliseconds) was used to measure the spectrum of the grassland canopy. The vertical height of the fiber probe in relation to the vegetation canopy is determined by the size of the sample canopy and the angle of the probe’s field (25) so that the sample canopy is within the probe’s field of view. The mean spectral reflectance data, used as the sample spectral reflectivity, were derived from ten measurements of the vegetation canopy’s spectral reflectivity. After gathering spectral data from the vegetation canopy, the documented information encompassed altitude and geographical coordinates (longitude and latitude), as well as details regarding the grass, such as its variety, extent of cover, occurrence, dominant species, and the populations of those species. Dominant species refers to the species that dominate a community, surpassing other species within the same community in terms of their quantity, volume, biomass, or impact on habitat. They have a significant control over the structure and environmental formation of the community. A total of 11 plants were surveyed in the non-degraded plots, including the dominant species Kobresia humilis with a coverage rate of 26.21%. A total of 17 plants were surveyed in the light degradation plots, including the dominant species Gentiana macrophylla, with a coverage rate of 19.12%. A total of 18 plants were surveyed in the medium degradation plots, including the dominant species Polygonum viviparum, with a coverage rate of 18.8%. A total of 11 plants were surveyed in the heavy degradation plots, including the dominant species Melissitus ruthenicus, with a coverage rate of 9.32%. A total of 3 plants were surveyed in the extreme degradation plots, including the dominant species Melissitus ruthenicus, with a coverage rate of 11.23% (Table 2).
Table 2.
Different plant species and their height and coverage.
The plant community coverage, the Shannon–Wiener diversity index, the Margalef richness index, and the Pielou evenness index for the study plots are detailed in Figure 1. The average coverage of the non-degraded grassland plant community was the highest, not significantly different from the lightly degraded grassland community (p > 0.05) but significantly higher than the remaining degraded grasslands (p < 0.05). The order was ND > LD > MD > HD > OD. For the Shannon–Wiener diversity index, the mean value was highest in the MD area, and except for the HD area, it was not significantly different from the other degraded grasslands (p > 0.05), in the order of MD > ND > LD > HD > OD. Regarding the Margalef richness index, the MD area had the highest mean value, significantly higher than the HD and OD areas (p < 0.05), with the order being MD > ND > LD > HD > OD. For the Pielou evenness index, the ND area had the highest mean value, significantly higher than the HD and OD area (p < 0.05), arranged as ND > MD > LD > HD > OD.
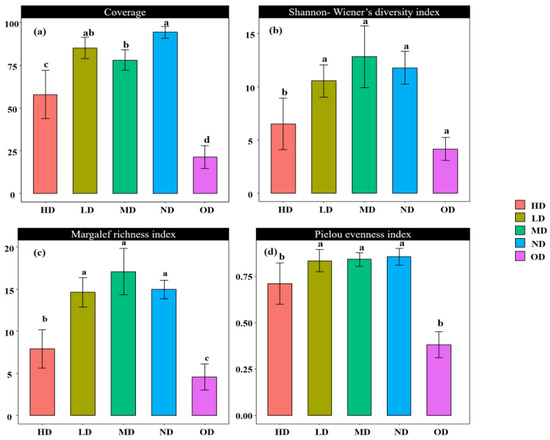
Figure 1.
Analysis of the differences in plant community coverage (a), Shannon–Wiener diversity index (b), Margalef richness index (c), and Pielou evenness index (d) across plots of varying degrees of degradation. Note: Subfigure (a) shows the differential analysis of vegetation coverage with different degrees of degradation. Subfigure (b) shows the Shannon Wiener diversity index difference analysis for different degrees of degradation. Subgraph (c) shows the analysis of differences in the Margalef wealth index for different degrees of degradation. Subgraph (d) shows the differential analysis of Pielou evenness index for different degrees of degradation. In addition, different letters within each subgraph denote significant differences between groups (p < 0.05). Any occurrence of the same letter indicates that there are no significant differences between the two groups (p > 0.05).
2.2.2. Indicators Measured in the Laboratory
Grass was collected and transported back to the laboratory in ice bags. Its chlorophyll content was determined using fresh grass samples from the canopy vegetation, while the remaining grass samples were dried at 60 °C for 48 h in the laboratory. After drying, the samples were mixed, ground, and sifted through a 1 mm sieve prior to chemical analysis. The methods for nutritional determination are as follows:
- Forage chlorophyll (Chl) content: Spectrophotometry;
- crude protein (CP) content: Kjeldahl method.
The descriptive statistics on the pasture quality variables are presented in Table 3.
Table 3.
Descriptive statistics on the pasture quality variables used to fit the models.
2.3. Spectral Variables
Table 4 summarizes 26 spectral variables, including 12 vegetation indices and 14 spectral signature parameters, widely used to estimate forage nutritional models. Vegetation indices and spectral characteristic parameters have been extensively utilized in the qualitative and quantitative evaluation of grassland growth.
Table 4.
Spectral variables used for estimating forage model.
2.4. Backward Feature Elimination
Backward feature elimination (BFE) was employed to discern the most pivotal spectral bands for predicting the quality attributes of the grass under study. In PLS, BFE is conducted through a filtration process that iteratively removes bands with the least absolute regression coefficient values, as detailed by Mehmood [49]. Following the exclusion of the least significant bands, Leave-One-Out cross-validation (LOOcv) is carried out to determine the optimum number of latent variables (LVs) and recalculate the regression coefficients. This procedure is reiterated until merely two bands remain. During each step, the Leave-One-Out cross-validation (LOOcv) process involves determining both the coefficient of determination (R2) and the root mean square error (RMSE). A parallel approach is applied in the case of RFs. Here, the bands deemed least crucial, based on the smallest increase in the mean square error (MSE), are successively eliminated until a pair remains, in line with the methodology adopted by Abdel-Rahman E M [50].
To investigate the influence of the dataset and the stability of the selected bands, the BFE process was repeated n = 100 times in a bootstrap selection of 70% of the samples. The percentage of bands selected in the 100 iterations of BFE was used as an estimate of its stability.
2.5. Partial Least Squares Regression
PLSR consists of a linear multivariate regression model that seeks to maximize the covariance between Y and X by decomposing them into n orthogonal latent variables (LVs), linking the response variable matrix Y (Chl, CP) with the predictor variable matrix X (hyperspectral indices). The PLSR model is calibrated using Leave-One-Out cross-validation (LOOcv). The only parameter to be tuned in PLSR is the optimal number of LVs, which is chosen based on the first local minimum of the root mean square error (RMSE) predicted by cross-validation. In this study, we describe the basic functionalities and characteristics of PLSR. The PLSR model was implemented using the CRAN package “PLS.”
The use of the coefficient of the partial least squares model as an indicator of the importance of an evaluation index has been proven to be a robust method for variable selection in PLS.
2.6. Random Forest Regression
Random forest (RF) regression utilizes a collective of Classification and Regression Trees (CART) as a part of its machine learning approach to construct predictive models. Two-thirds of the original dataset is randomly selected as in-bag samples using the bootstrap method, forming a collection of k decision trees. One-third of the dataset, designated as Out-Of-Bag (OOB) data, is used to calculate the mean square error (MSE), which is synonymous with the OOB error. This OOB error is considered an accurate measure of the model’s accuracy [51,52]. The RF algorithm is implemented using the CRAN package “randomForest”. As mentioned earlier, an RF has two main hyperparameters, namely the number of trees to grow (ntree) and the number of predictor variables selected at each node (mtry). The default values for “randomForest” are used for ntree (500 trees) and mtry (1/3 of the total number of predictor variables), as they have been proven to be acceptable values and are the most commonly recommended [53].
The importance of the random forest regression method lies in its ability to quickly and effectively process large amounts of data, identify useful features, and provide reliable prediction results. The basic principle involves randomly permuting the predictor variables and using the remaining predictor variables to calculate the MSE of the OOB set prediction. MSE is a key indicator for evaluating the importance of model indicators, and the closer the indicator is to the response variable, the larger the MSE value [53].
2.7. Tree-Based Regression
Decision tree technology is applied to both classification and prediction. A decision tree is a method for classifying data. It mainly identifies patterns and infers rules from disorganized and irregular datasets to create a decision tree for classification. The construction of a decision tree employs a top-down, recursive approach. By analyzing the differences between each node according to the internal structure of the decision tree, the outcomes are derived based on the distribution of the tree’s branches.
2.8. Model Evaluation
The coefficient of determination (R2) and root mean square error (RMSE) are used to assess the model accuracy, where n is the number of samples, is the actual observed value, is the predicted value, and is the mean of the actual observed values. R2 ranges from 0 to 1, with values closer to 1 indicating a better model fit. A smaller RMSE indicates the higher predictive accuracy of the model.
2.9. Partial Least Squares Path Modeling
Unlike covariance-based structural equation modeling, PLS-PM focuses on maximizing the explained variance of the dependent constructs, making it a powerful tool in predictive studies and when the research objective is theory building or exploratory in nature.
A significant benefit of PLS-PM lies in its low requirements for the scale of measurement, the size of the sample, and the distribution of the residuals. This renders it particularly apt for preliminary studies where such criteria are not stringently adhered to. Furthermore, PLS-PM can handle both reflective and formative measurement models, providing flexibility in modeling complex constructs that are not easily captured using traditional methods [54,55].
In terms of interpretation, PLS-PM provides several outputs, including path coefficients (indicating the strength and direction of relationships between variables), loadings and weights (for measurement models), and various goodness-of-fit measures to assess the model’s predictive power and the quality of the measurement models.
2.10. Technical Ideas
Correlation analysis utilizing raw spectra, spectral signature parameters, vegetation indices, and community nutritional indicators (Chl, CP) was conducted to identify crucial spectral bands with a strong relationship. These correlations were incorporated as input parameters for the PLS, TBR and RF models. Moreover, recursive feature elimination was employed in the PLS, TBR and RF models to evaluate the changes in the model accuracy before and after the application of this technique. The significance of the model indicators was assessed using the regression coefficient (PLS) and the increase in the MSE (RF) as benchmarks, while the stability of the model indicators was evaluated based on the frequency of their appearance after 100 iterations of backward feature elimination. The overall importance of the indicators and their stability determined the key spectral indicators for predicting the chlorophyll and crude protein contents. PLS-PM was used to explore the direct and indirect connections between the canopy structure (Shannon–Wiener diversity index, Margalef richness index, and Pielou evenness index) and soil background (coverage) and the spectral signatures of Chl and CP, elucidating the network of interrelations and intricate interactions among these variables.
The construction process of the estimation model for the Chl and CP contents in alpine meadow grasslands is shown in Figure 2.
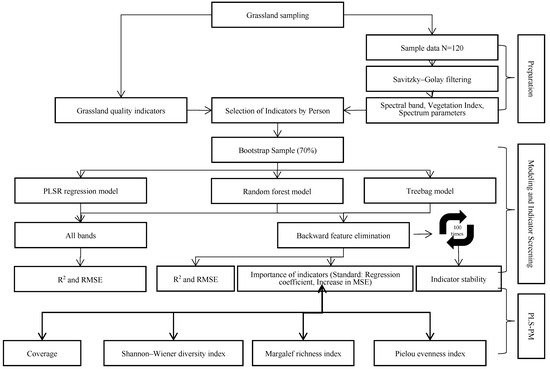
Figure 2.
Modeling approach of the study.
3. Results
3.1. Effects of Steppe Grassland Degradation on Plants’ Spectral Reflectance
Under various degradation gradients, as depicted in Figure 3, the spectral shapes have a similar appearance. The distinct visible absorption characteristic of plant chlorophyll near 550 nm is evident, and the reflectance at the green peak decreases rapidly with increasing degradation levels.
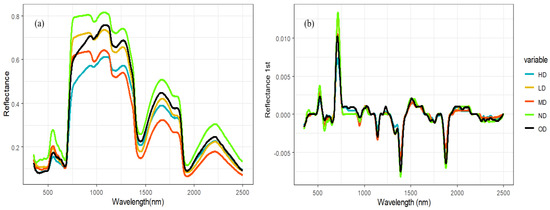
Figure 3.
Original spectral spectroscopy and first-order differential spectral of vegetation canopy with different degradation degrees of alpine grassland. Note: Subfigure (a) shows original spectral spectroscopy of vegetation canopy with different degradation degrees of alpine grassland. Subfigure (b) shows first-order differential spectral of vegetation canopy with different degradation degrees of alpine grassland.
At nearly 680 nm, there is a narrow band (approximately 0.68–0.78 µm) where the spectral response of healthy plants exhibits a dramatic increase—approximately tenfold—from the chlorophyll absorption outside the red light region to the high-reflectance region in the near-infrared.
Compared with the original spectrum, the differential spectrum of the canopy can eliminate the influence of noise and highlight the slope changes or peak information in the spectrum and is very useful for identifying the peak position and shape in the spectrum, especially for the obvious peaks at 0.52–0.55 µm and 0.71–0.720 µm in Figure 3b.
3.2. Correlation Analysis
Correlation analyses are performed to examine the relationships between the forage Chl and CP and the spectral indices (including the original spectrum, spectral parameters, and vegetation indices). As shown in Figure 4, the bands of the original spectrum that are significantly correlated with forage Chl span 350–652 nm, 654–655 nm, and 684–925 nm, which correspond to a total of 547 bands. Among these bands, the correlation coefficient curves show three peaks at 384 nm (R = 0.52), 529 nm (R = 0.49), and 723 nm (R = 0.49).
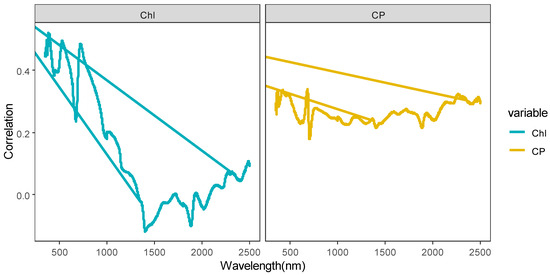
Figure 4.
Correlation between the forage nutrient index and the spectral variables.
For the original spectrum bands that demonstrate significant correlation with forage CP, the ranges are 355–535 nm, 661–690 nm, and 769 nm, extending to 2092–2099 nm, encompassing a total of 221 bands. Among these, spectral reflectance presents a positive correlation with forage CP, and the correlation coefficient curves exhibit one peak at 682 nm (R = 0.339).
As shown in Figure 5,the absolute values of the correlation coefficient between these vegetation indices and the forage nutrient indices were generally in the range of 0.28 to 0.63 (p < 0.01). The vegetation indices were significantly correlated with the chlorophyll content: the mNDVI, PRI, SIPI, DVI, SAVI, NRI, and NDWI showed a significant correlation with chlorophyll. The vegetation indices significantly correlated with the CP (crude protein) content included the mNDVI and PRI.
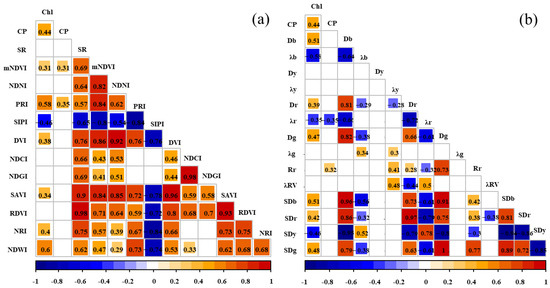
Figure 5.
Correlation between the forage nutrient indices, vegetation indices, and spectral feature parameters. Note: Subfigure (a) shows the correlation coefficients between vegetation index, Chl, and CP. Subfigure (b) shows the correlation coefficient graph between spectral parameters, Chl, and CP.
The absolute values of the correlation coefficient between the spectral feature parameters and forage nutrient indices were generally in the range of 0.29 to 0.65 (p < 0.01). The spectral feature parameters significantly correlated with chlorophyll content included Db, λb, Dr, λr, Dg, SDb, SDr, SDy, and SDg, while those significantly correlated with the CP content included λr and Rr.
In general, spectral parameter techniques based on a combination of vegetation indices and first-derivative transformation can improve the characterization of herbage nitrogen content and minimize the effects of the atmosphere, soil background, and water absorption. They also provide more comprehensive information than the original spectrum.
3.3. Regression Analysis Based on Backward Feature Elimination
In order to create inversion models for the Chl and CP variables, we used partial least square regression, random forests, and tree-based BEF. We compared three methods for estimating grassland nutrients after applying backward feature elimination: PLS-BEF, RF-BEF, and tree-based BEF. Figure 6 displays the model fitting accuracy (R2) and root mean square error (RMSE) for these three methods. In the Chl and CP models, all useless or redundant features were eliminated after a certain point in the feature selection loop, at which time the algorithm began to discard features containing non-redundant information. The performance of the three models was significantly different. RF-BEF yielded the best results, followed by tree-based BEF, while PLS-BEF had the poorest model performance.
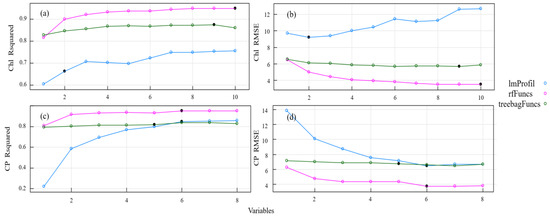
Figure 6.
Model accuracy and root mean square error based on backward feature elimination. Note: Subfigure (a) shows the accuracy of the Chl model under different selection variables. Subfigure (b) shows the root mean square error of the Chl model under different selection variables. The subgraph (c) shows the accuracy of the CP model under different selection variables. The subgraph (d) shows the root mean square error of the CP model under different selection variables.
To compare the inversion accuracy and root mean square error of the models after variable feature elimination, Table 5 displays the number and proportion of frequency bands chosen for each pasture quality variable using backward feature elimination. The table also illustrates the capability of the spectral bands and vegetation indices to reflect the reflectance curves of the pasture mass, which depend on the varying content of the pasture mass. RF-BEF outperformed the other two methods when comparing the model accuracy and root mean square error. Additionally, some differences were observed between the models. ImProfil selected fewer frequency bands than both RF-BEF and tree-based BEF for variable selection. RF-BEF selected 10 sensitive bands and tree-based BEF selected 9 sensitive bands in the chlorophyll content inversion model. Across the three methods for estimating the chlorophyll models, the PRI and mNDVI were chosen as sensitive indices for modeling. For the CP estimation models, 535 nm, 2091 nm, the PRI, and λr were selected as sensitivity indices for participation in the modeling.
Table 5.
Performance of models with all bands and with selected bands.
3.4. Selection of Characteristic Variables
Random forests exhibit high predictive accuracy for high-dimensional datasets, even when the variables are highly correlated. Figure 7 illustrates the significance of the variables within a random forest, and their importance in the chlorophyll inversion model is ranked as follows: 359 nm > PRI > λr > NDWI > SIPI > mNDVI > λb > 652 nm > SAVI > NIR. The importance of the indicators in the crude protein (CP) inversion models is demonstrated by the sequence PRI > 359 nm > 535 nm > λr > 2091 nm > SAVI.
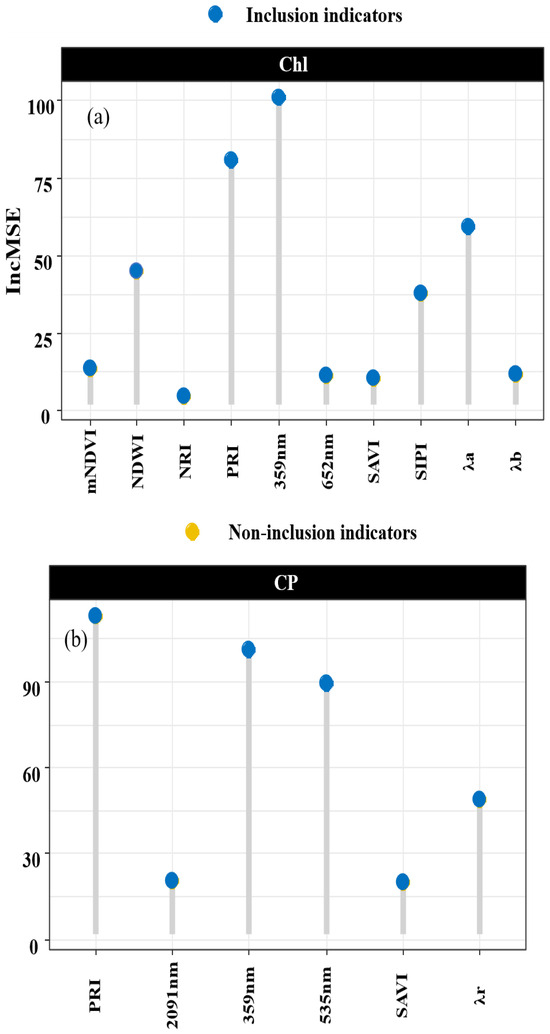
Figure 7.
Assessment of indicator importance. Note: Subfigure (a) shows the important values of each indicator in the Chl random forest model. Subfigure (b) shows the important values of each indicator in the CP random forest model.
The importance of the indicators in the PLS model is evaluated using the coefficients of the following equations.
Lm(CP) = 12.03 × 2091 nm − 17.68 × 535 nm − 5.57 × mNDVI + 4.60 × PRI + 10.65 × λr + 10.07 × SAVI + 25.30
Lm(Chl) = 16.50 × PRI + 5.07 × mNDVI + 25.26
In all the models predicting the chlorophyll content, the spectral indicators mNDVI and PRI appeared with a frequency higher than 70% in a hundred cycles (Figure 8a). Similarly, in the models predicting the CP content, the spectral indicators 2091 nm and 535 nm were selected with a frequency exceeding 70% in a hundred cycles (Figure 8b). It is noteworthy that high importance also exhibited high stability in the predictions of Chl and CP. For example, for Chl predictions with PLS, the PRI is the most important band, respectively, and also has the highest stability values.
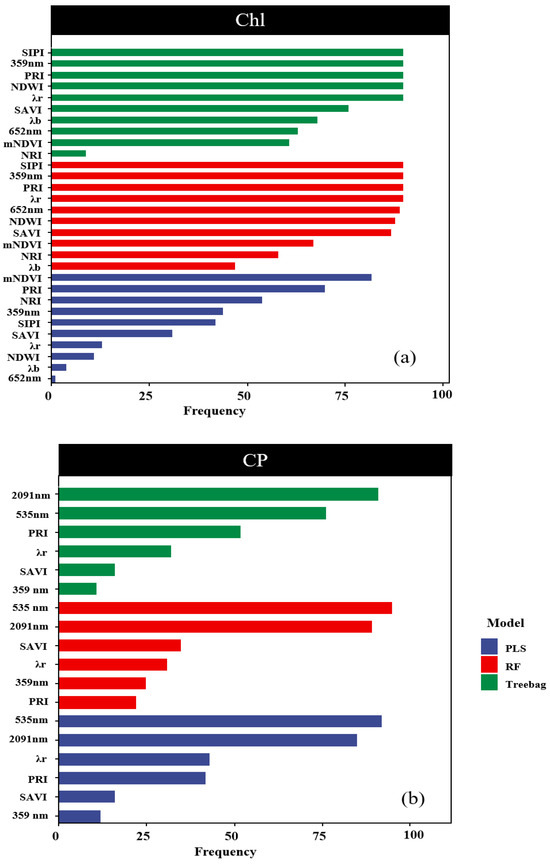
Figure 8.
Assessment of indicator stability. Note: Subfigure (a) shows the frequency of occurrence of the three Chl models after 100 iterations. The subgraph (b) shows the frequency of the three CP models appearing after 100 iterations.
3.5. Partial Least Squares Path Modeling
The PLS-PM framework delineates the interconnections between SpecCP (spectral variables characterizing chlorophyll), SpecChl (spectral variables characterizing crude protein), C (community coverage), S (Shannon–Wiener index), P (Pielou evenness index), and D (Margalef richness index). Blue arrows signify positive pathways, while red arrows indicate negative pathways. Standardized path coefficients are displayed on the arrows. A comprehensive summary of the overall effects is presented at the bottom of the chart.
To investigate the influence of the soil background and grassland vegetation community structure on the spectral prediction of chlorophyll and crude protein content and to mitigate the effects of multicollinearity among independent variables and their interactive influences, we partitioned the independent variables into a partial least squares regression path model. Initially, spectral indicators for the grassland community chlorophyll and crude protein content were obtained through assessments of their importance and stability. Subsequently, a path analysis framework was established to examine the impact of grassland coverage, the richness index, the evenness index, the diversity index, and the salinity index on these spectral indicators. The PLS-PM method was then employed to elucidate the interactions among groups of independent variables (Figure 9). It enables the evaluation of the model’s fit and predictive capacity. The model’s goodness of fit stood at 0.70. Among the four groups of independent variables, grassland coverage contributed the most to the estimation of SpecChl and SpecCP (r = 0.73, r = 0.39) (Figure 9). In the estimation of SpecCP, both the evenness index and the diversity index exerted a negative impact, whereas in the estimation of SpecChl, only the evenness index had a detrimental effect. SpecChl positively influenced the estimation of SpecCP (r = 0.80).
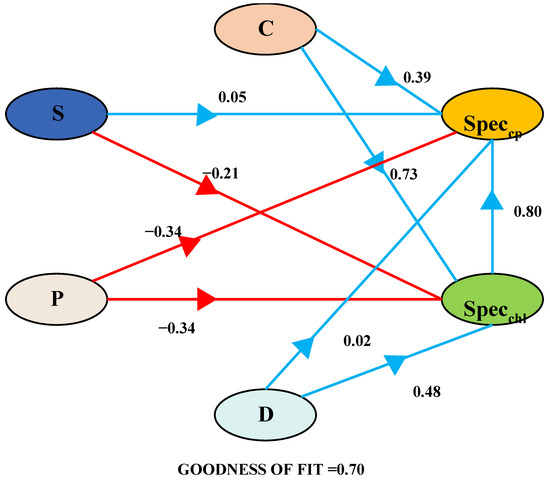
Figure 9.
Partial least squares path modeling.
4. Discussion
4.1. The Impact of Backward Feature Elimination on the Model’s Predictive Capability
This study contrasts conventional modeling approaches (PLS, RF, tree-based) with regression algorithms enhanced by backward feature elimination (PLS-BEF, RF-BEF, tree-based BEF). The findings reveal that when leveraging the Pearson’s correlation coefficient method for feature selection in chlorophyll and crude protein inversion, the precision of traditional models is suboptimal (ChlRF = 0.39, ChlTree-based = 0.72, CPRF = 0.37, CPtree-based = 0.31). This can be attributed to the Hughes phenomenon, stemming from redundancy and high correlation amongst the hyperspectral data variables, a phenomenon where the predictive performance improves with the addition of features only until an optimal number is reached, beyond which further inclusion of features degrades the performance. Often, traditional correlation methods are employed to select model variables, but the criteria for selection remain uncertain, and the presence of redundant data still allows the influence of multicollinearity to persist. Hence, the algorithms utilized must adeptly address these issues to avert the “Hughes phenomenon”. The backward feature elimination method iteratively recalculates the regression coefficients after discarding the variable with the smallest absolute coefficient value. This cycle culminates in an optimal balance of model accuracy and variable quantity. In trials, the backward feature elimination method significantly reduced the data dimensionality, finely pruning the surplus variables on top of the initial indicators and considerably enhancing the model’s accuracy beyond the primitive model (ChlPLS-BEF = 0.36, ChlRF-BEF = 0.95, ChlTree-based-BEF = 0.85, CPPLS-BEF = 0.85, CPRF-BEF = 0.94, CPTree-based-BEF = 0.84). Moreover, Fernández-Habas and colleagues, utilizing the same ASD FieldSpec spectral data for random forest regression prediction of Mediterranean grassland crude protein mass, corroborated that the backward feature elimination method markedly improved the model’s precision (R2 = 0.84, RMSE = 2.17) compared to the original full-band model (R2 = 0.79, RMSE = 2.48), substantiating the method’s superiority in managing high-dimensional hyperspectral data.
Conversely, within the backward feature elimination method, the RF was superior to PLS when forecasting the accuracy of Chl and CP, a finding that aligns with numerous reports where nonlinear algorithms (such as SVMs, RFs, or CNNs) were performant when using hyperspectral data due to their capacity to elucidate more complex non-linear relationships than traditional linear regression. Wijesingha and others [55] documented that for predicting the CP and ADF in 950 samples from mountain hay meadows using drone-based hyperspectral data (194 bands with a 118 nm spectral resolution), the RF’s performance surpassed that of PLS.
4.2. Selection of Characteristic Variables
This research focused on feature selection via backward feature elimination to identify spectral variables correlated with functional parameters (Chl, CP), analyzing the importance and stability of these indicators to determine spectral variables related to chlorophyll and crude protein content traits. It is critical to associate the selected bands, crucial in such studies, with stability analyses to furnish additional insights. The reliability of the selected spectral bands, despite changes in the dataset, is essential for prediction. This importance stems from the need to counter the possible confusing influences of factors such as the reflectance of the canopy, the angle of leaf positioning, varying plant species, moisture levels, or the diversity in phenological phases [56,57,58].
The principle behind the remote estimation of crop chlorophyll content is predicated on the differential reflectance and absorption rates of chlorophyll at various spectral bands, resulting in distinct reflectance characteristics. These specific bands are sensitive to crop chlorophyll. In this study, post-selection, the vegetation indices the PRI and mNDVI exhibited the greatest significance and stability concerning Chl. Drawing from Figure 6, the association of these selected variables with chlorophyll visibly trends downwards with the intensification of degradation; samples with higher chlorophyll values inherently displayed higher mNDVI and PRI values. These two vegetation indices have been widely studied in depicting plant pigment status and canopy structure. The PRI, a normalized vegetation index at 531 nm and 570 nm, is influenced by the xanthophyll cycle and associated with leaf photon use efficiency. The close relationship between the PRI and chlorophyll content could stem from a reliable correlation between leaf chlorophyll and xanthophyll concentrations, where changes in xanthophylls can indirectly reflect alterations in chlorophyll concentrations. Consequently, the PRI, which is sensitive to xanthophyll concentrations, is also keenly sensitive to chlorophyll levels. This effect is also observable in Gamon’s data [59], where the diurnal variation in the PRI for young leaves with a high chlorophyll content correlated well with the epoxidation state in xanthophyll cycling. The mNDVI modifies the NDVI by incorporating 445 nm, as chlorophyll strongly absorbs energy at the spectral band centered around 0.45 nm and 0.67 nm. Plant leaves intensely absorb blue and red energies while reflecting green; moreover, xanthophylls have an absorption band around 0.45 um (blue), thus reflecting changes in chlorophyll concentrations to some extent.
The principle underlying remote sensing estimation of crop nitrogen content is based on the vibrational response of nitrogen’s chemical bonds in the crop’s molecular composition under electromagnetic radiation, leading to spectral absorption and reflectance differences at certain wavelengths. These specific wavelengths are sensitive indicators (characteristic bands) of crop nitrogen content. In this study, post-selection, the vegetation indices at 535 nm and 2091 nm showed the highest relevance and stability in relation to CP (crude protein). Adjorlolo and colleagues [60] found that according to the Variable Importance in Projection (VIP) index in partial least squares (PLS) analysis, the 2015 nm wavelength is crucial in predicting nitrogen levels in both C4 and C3 types of grass. They further observed a strong correlation between the 720 nm wavelength and CP, underscoring the reliability and significance of assessing pasture quality in the red edge region. Kokaly [61] noted that for the prediction of crude protein (CP) and neutral detergent fiber (NDF), spectral bands from the near-infrared and short-wave infrared regions are frequently chosen in both partial least squares (PLS) and random forest (RF) models. This preference is due to the distinctive absorption features of compounds like cellulose, protein, nitrogen, and starch, which are related to the molecular bonds of C-H, C-N, N-H, and O-H. These findings suggest that targeted band selection in these regions can accurately predict pasture quality with a limited number of bands [62]. In this study, the sampled pastures exhibited distinct degradation characteristics, with the vegetation cover displaying a clear tiered distribution. The stability of 535 nm and 2015 nm, superior to the SAVI and λr, is attributed to their respective sensitivities to vegetation stress and the soil background. The mixture of degraded and non-degraded samples could have potentially reduced the stability of the indices in the model, thus obscuring the vibrational effects of nitrogen’s chemical bonds under electromagnetic influence. Independent calibration models for different stages of degradation could enhance the stability of these wavelengths. However, this approach might limit the dataset’s scope and the model’s generalizability. Given the common occurrence of mixed degraded and non-degraded grasslands in the alpine grasslands of the Tibetan Plateau, studying the soil background and community observational structure is crucial to understanding the impact on the spectral sensitivity indicators of Chl and CP for degraded pastures, thereby acquiring vital information on pasture quality.
4.3. PLS-PM
While the selected characteristic bands and hyperspectral indices are closely correlated with the community chlorophyll and nitrogen content, it is crucial to acknowledge that various confounding factors, such as the canopy structure, soil background, and observational geometry, can also impact the estimation model. Research indicates that grassland coverage positively influences the estimation of SpecCP and SpecChl. Compared to vegetated surfaces, bare ground typically reflects higher short-wave infrared radiation but lower visible and near-infrared radiation. Consequently, the spectral characteristics of vegetation may be affected, resulting in lower green and red radiation reflectance. Under low coverage, the degree of light absorption and scattering by the vegetation diminishes, as the vegetation itself absorbs and scatters light. This leads to less light being absorbed by the vegetation and more light penetrating the vegetation layer or being absorbed or reflected by the underlying ground surface. Hence, low coverage might result in reduced light energy utilization by the vegetation. Low community coverage could be attributed to poor vegetation growth or stressors such as drought or pestilence. These factors can degrade the health of the vegetation, manifesting in spectral anomalies like reduced chlorophyll content and an abnormal photosynthetic performance.
Leaf nitrogen content (LNC) is a crucial crop nutrition indicator. Due to the high correlation between chlorophyll and nitrogen content, over the past two decades, numerous studies have constructed various chlorophyll-sensitive vegetation indices based on chlorophyll’s sensitive bands in the visible light spectrum to estimate leaf nitrogen content. However, the agricultural sector commonly uses the total nitrogen content, and chlorophyll can only reflect photosynthetic nitrogen information related to photosynthesis. In this study, SpecChl positively influenced the estimation of SpecCP (r = 0.80), showing its significant impact and confirming that chlorophyll indeed reflects photosynthetic nitrogen information related to photosynthesis but cannot fully represent the total nitrogen information for crop leaves. Chlorophyll-based vegetation indices (VIs) have proven effective for leaf nitrogen content mapping (LNCM), which is largely due to the high proportion of nitrogen that is invested in the photosynthetic apparatus of foliage. Specifically, in C3 species, it is estimated that between 75% and 80% of a leaf’s nitrogen content is incorporated into proteins within the chloroplasts, as described by Chapin [62].
Additionally, heterogeneity exists in the structure between different communities. In the study, the evenness index negatively influenced the SpecCP and SpecChl estimates, while the richness index positively affected the SpecChl estimates. Only the evenness index had a negative impact on the SpecChl estimates. This indicates that different community structures and functions affect the estimates of SpecCP and SpecChl. During the growing season, the nitrogen allocation between photosynthetic and non-photosynthetic compounds is dynamic [63] and depends on the species [64]. Consequently, the link between the overall nitrogen content and chlorophyll may vary and be unique to each species, suggesting that spectral estimation models could differ across various plant communities.
5. Conclusions
- (i)
- PLS outperformed the RF in predicting Chl and CP in terms of the accuracy and certainty of its predictions.
- (ii)
- Backward feature elimination (BFE) can significantly decrease the number of spectral bands required for predictive analysis and simultaneously enhance the precision of the resulting models, particularly within the context of PLS regression techniques.
- (iii)
- Moreover, the spectral bands within the red edge and near-infrared regions proved to be significant and reliable in estimating the nutritional quality; particularly, the bands at 535 nm and 2091 nm are pivotal for the precise forecasting of CP, while vegetation indices such as the PRI and mNDVI are vital for predicting Chl.
- (iv)
- Environmental factors such as grassland cover (soil background) positively influence the prediction of SpecChl and SpecCP when degraded and non-degraded lands are interwoven. However, within the community structure, the evenness index negatively impacts the spectral predictions of both SpecChl and SpecCP. Notably, SpecChl has a robust positive correlation with the SpecCP estimation (r = 0.80), affirming that chlorophyll is indeed indicative of the photosynthetic nitrogen information associated with photosynthesis.
Author Contributions
T.J., as the first author of the article, analyzed the data and prepared the first draft. X.L., as the corresponding author of the article, participated in the concept and the procedures for the experiments. All authors have read and agreed to the published version of the manuscript.
Funding
This work was supported by project funds from the College of Pratacultural Science, Gansu Agricultural University, including Gansu Province Grassland Monitoring and Evaluation (GSZYTC-ZCJC-21010), the 2021 Forestry and Grassland Science and Technology Project at the Provincial Level—Spatial Distribution and Carbon Storage Estimation of Grassland Soil Carbon Density in the Hexi Desert Area (2021kj071), the New Round of Grassland Subsidy and Reward Benefits Evaluation and Grassland Ecological Evaluation Research in Gansu Province (XZ20191225), and the National Natural Science Foundation of China (32260354).
Institutional Review Board Statement
Not applicable.
Data Availability Statement
Data are contained within the article.
Conflicts of Interest
The authors declare no conflict of interest.
References
- Hopkins, A.; Holz, B. Grassland for agriculture and nature conservation: Production, quality and multi-functionality. Agron. Res. 2006, 4, 3–20. [Google Scholar]
- Kang, L. Grassland ecosystems in China: Review of current knowledge and research advancement. Philos. Trans. R. Soc. B Biol. Sci. 2007, 362, 997–1008. [Google Scholar] [CrossRef] [PubMed]
- Zhou, H.; Yang, X.; Hou, C.; Shao, X.; Shi, Z.; Li, H.; Su, H.; Qin, R.; Chang, T.; Hu, X.; et al. Alpine Grassland Degradation and Its Restoration in the Qinghai–Tibet Plateau. Grasses 2023, 2, 31–46. [Google Scholar] [CrossRef]
- Li, L.; Zhang, Y.; Wu, J.S.; Li, S.C.; Zhang, B.H.; Zu, J.X.; Zhang, H.M.; Ding, M.J.; Paudel, B. Increasing sensitivity of alpine grasslands to climate variability along an elevational gradient on the Qinghai-Tibet Plateau. Sci. Total Environ. 2019, 678, 21–29. [Google Scholar] [CrossRef] [PubMed]
- Li, X.L.; Gao, J.; Brierley, G.; Qiao, Y.M.; Zhang, J.; Yang, Y.W. Rangeland degradation on the Qinghai-Tibet plateau: Implications for rehabilitation. Land Degrad. Dev. 2013, 24, 72–80. [Google Scholar] [CrossRef]
- Li, X.; Perry, G.L.; Brierley, G.J. A spatial simulation model to assess controls upon grassland degradation on the Qinghai-Tibet Plateau, China. Appl. Geogr. 2018, 98, 166–176. [Google Scholar] [CrossRef]
- Xu, Y.; Dong, S.K.; Shen, H.; Xiao, J.N.; Li, S.; Gao, X.X.; Wu, S.N. Degradation significantly decreased the ecosystem multifunctionality of three alpine grasslands: Evidences from a large-scale survey on the Qinghai-Tibetan Plateau. J. Mt. Sci. 2021, 18, 357–366. [Google Scholar] [CrossRef]
- Ali, I.; Cawkwell, F.; Dwyer, E.; Barrett, B.; Green, S. Satellite remote sensing of grasslands: From observation to management. J. Plant Ecol. 2016, 9, 649–671. [Google Scholar] [CrossRef]
- Nagendra, H.; Lucas, R.; Honrado, P.; Jongman, R.; Tarantino, C.; Adamo, M.; Mairota, P. Remote sensing for conservation monitoring: Assessing protected areas, habitat extent, habitat condition, species diversity, and threats. Ecol. Indic. 2013, 33, 45–59. [Google Scholar] [CrossRef]
- Wang, Z.; Lucas, R.; Honrado, J.P.; Jongman, H.G.; Tarantino, C.; Adamo, M.; Mairota, P. Review of remote sensing applications in grassland monitoring. Remote Sens. 2022, 14, 2903. [Google Scholar] [CrossRef]
- El-Ramady, H.R.; Alshaal, A.T.; Amer, M.; Domokos-Szabolcsy, É.; Elhawat, N.; Prokisch, J.; Fári, M. Soil quality and plant nutrition. In Sustainable Agriculture Reviews 14: Agroecology and Global Change; Springer: Berlin, Germany, 2014; pp. 345–447. [Google Scholar]
- Zhu, S.; Feng, P.Z.; Feng, J.; Xu, J.; Wang, Z.M.; Xu, J.L.; Yuan, Z.H. The roles of starch and lipid in Chlorella sp. during cell recovery from nitrogen starvation. Bioresour. Technol. 2018, 247, 58–65. [Google Scholar] [CrossRef] [PubMed]
- Zhai, Y.; Cui, L.; Zhou, X.; Gao, Y.; Fei, T.; Gao, W. Estimation of nitrogen, phosphorus, and potassium contents in the leaves of different plants using laboratory-based visible and near-infrared reflectance spectroscopy: Comparison of partial least-square regression and support vector machine regression methods. Int. J. Remote Sens. 2013, 34, 2502–2518. [Google Scholar]
- Comino, F.; Ayora-Cañada, M.J.; Aranda, V.; Díaz, V.; Domínguez-Vidal, A. Near-infrared spectroscopy and X-ray fluorescence data fusion for olive leaf analysis and crop nutritional status determination. Talanta 2018, 188, 676–684. [Google Scholar] [CrossRef] [PubMed]
- Sishodia, R.P.; Ray, R.L.; Singh, S.K. Applications of remote sensing in precision agriculture: A review. Remote Sens. 2020, 12, 3136. [Google Scholar] [CrossRef]
- Inoue, Y. Satellite-and drone-based remote sensing of crops and soils for smart farming—A review. Soil Sci. Plant Nutr. 2020, 66, 798–810. [Google Scholar] [CrossRef]
- Zha, H.; Miao, Y.; Wang, T.; Li, Y.; Zhang, J.; Sun, W.; Feng, Z.; Kusnierek, K. Improving unmanned aerial vehicle remote sensing-based rice nitrogen nutrition index prediction with machine learning. Remote Sens. 2020, 12, 215. [Google Scholar] [CrossRef]
- Atzberger, C.; Guérif, M.; Baret, F.; Werner, Y. Comparative analysis of three chemometric techniques for the spectroradiometric assessment of canopy chlorophyll content in winter wheat. Comput. Electron. Agric. 2010, 73, 165–173. [Google Scholar] [CrossRef]
- Garnett, J. Using Infrared Spectroscopy to Evaluate Physiological Ageing in Stored Potatoes (Solanum tuberosum). Ph.D. Thesis, University of East Anglia, Norwich, UK, 2018. [Google Scholar]
- Li, L.; Lin, D.; Wang, J.; Yang, L.; Wang, Y. Multivariate analysis models based on full spectra range and effective wavelengths using different transformation techniques for rapid estimation of leaf nitrogen concentration in winter wheat. Front. Plant Sci. 2020, 11, 755. [Google Scholar] [CrossRef]
- Wang, W.; Yao, X.; Yao, X.F.; Tian, Y.; Liu, X.; Ni, J.; Cao, W.; Zhu, Y. Estimating leaf nitrogen concentration with three-band vegetation indices in rice and wheat. Field Crops Res. 2012, 129, 90–98. [Google Scholar] [CrossRef]
- Klem, K.; Rajsnerová, P.; Novotná, K.; Mìša, P.; Křen, J. Changes in vertical distribution of spectral reflectance within spring barley canopy as an indicator of nitrogen nutrition, canopy structure and yield parameters. Agriculture 2014, 60, 50–59. [Google Scholar] [CrossRef][Green Version]
- Nussberger, S.; Dekker, J.; Kuehlbrandt, W.; Bolhuis, B.; Grondelle, R.; Amerongen, H. Spectroscopic characterization of three different monomeric forms of the main chlorophyll a/b binding protein from chloroplast membranes. Biochemistry 1994, 33, 14775–14783. [Google Scholar] [CrossRef] [PubMed]
- Gao, J.; Liang, T.; Yin, J.; Ge, J.; Feng, Q.; Wu, C.; Hou, M.; Liu, J. Estimation of alpine grassland forage nitrogen coupled with hyperspectral characteristics during different growth periods on the Tibetan Plateau. Remote Sens. 2019, 11, 2085. [Google Scholar] [CrossRef]
- Stroppiana, D.; Fava, F.; Boschetti, M.; Brivio, P.A. Estimation of nitrogen content in crops and pastures using hyperspectral vegetation indices. In Hyperspectral Remote Sensing of Vegetation; Thenkabail, P.S., Lyon, J.G., Huete, A., Eds.; Wiley Online Library: Hoboken, NJ, USA, 2011; pp. 245–262. [Google Scholar]
- Bioucas-Dias, J.M.; Plaza, A.; Camps-Valls, G.; Scheunders, P.; Nasrabadi, N.; Chanussot, J. Hyperspectral remote sensing data analysis and future challenges. IEEE Geosci. Remote Sens. Mag. 2013, 1, 6–36. [Google Scholar] [CrossRef]
- Landgrebe, D. Hyperspectral image data analysis. IEEE Signal Process. Mag. 2002, 19, 17–28. [Google Scholar] [CrossRef]
- Adjorlolo, C.; Cho, M.; Mutanga, O.; Ismail, R. Optimizing spectral resolutions for the classification of C 3 and C 4 grass species, using wavelengths of known absorption features. J. Appl. Remote Sens. 2012, 6, 063560. [Google Scholar] [CrossRef]
- Craig, A.P.; Franca, A.S.; Irudayaraj, J. Pattern recognition applied to spectroscopy: Conventional methods and future directions. In Pattern Recognition: Practices, Perspectives and Challenges; Vincent, D.B., Ed.; Nova Science Publishers, Inc.: New York, NY, USA, 2013; pp. 1–46. [Google Scholar]
- Fernández-Habas, J.; Cañada, M.; Moreno, A.; Leal-Murillo, J.; González-Dugo, M.; Oar, B.; Gómez-Giráldez, P.; Fernández-Rebollo, P. Estimating pasture quality of Mediterranean grasslands using hyperspectral narrow bands from field spectroscopy by Random Forest and PLS regressions. Comput. Electron. Agric. 2022, 192, 106614. [Google Scholar] [CrossRef]
- Tan, K.; Ma, W.; Wu, F.; Du, Q. Random forest–based estimation of heavy metal concentration in agricultural soils with hyperspectral sensor data. Environ. Monit. Assess. 2019, 191, 446. [Google Scholar] [CrossRef]
- Joshi, S.; Yi, S.; Jinniu, W.; Pasakhala, B.; Ismail, M.; Bisht, N.; Qamar, F.; Long, R.; Wu, N.; Foggin, M.; et al. Rangeland resource and use assessment protocol. Man. ICIMOD Kathmandu Rangel. Resour. Use Assess. Protoc. MANUAL 2019, 1, 3. [Google Scholar]
- Marabel, M.; Alvarez-Taboada, F. Spectroscopic determination of aboveground biomass in grasslands using spectral transformations, support vector machine and partial least squares regression. Sensors 2013, 13, 10027–10051. [Google Scholar] [CrossRef]
- Belgiu, M.; Drăguţ, L. Random forest in remote sensing: A review of applications and future directions. ISPRS J. Photogramm. Remote Sens. 2016, 114, 24–31. [Google Scholar] [CrossRef]
- Tuv, E.; Borisov, A.; Runger, G.; Torkkola, K. Feature selection with ensembles, artificial variables, and redundancy elimination. J. Mach. Learn. Res. 2009, 10, 1341–1366. [Google Scholar]
- Kotsiantis, S.B.; Zaharakis, L.D.; Pintelas, P.E. Machine learning: A review of classification and combining techniques. Artif. Intell. Rev. 2006, 26, 159–190. [Google Scholar] [CrossRef]
- Chen, J.M. Evaluation of vegetation indices and a modified simple ratio for boreal applications. Can. J. Remote Sens. 1996, 22, 229–242. [Google Scholar] [CrossRef]
- Jurgens, C. The modified normalized difference vegetation index (mNDVI) a new index to determine frost damages in agriculture based on Landsat TM data. Int. J. Remote Sens. 1997, 18, 3583–3594. [Google Scholar] [CrossRef]
- Wang, L.; Wei, Y. Revised normalized difference nitrogen index (NDNI) for estimating canopy nitrogen concentration in wetlands. Optik 2016, 127, 7676–7688. [Google Scholar] [CrossRef]
- Garbulsky, M.F.; Peñuelas, J.; Gamon, J.; Inoue, Y.; Filella, L. The photochemical reflectance index (PRI) and the remote sensing of leaf, canopy and ecosystem radiation use efficiencies: A review and meta-analysis. Remote Sens. Environ. 2011, 115, 281–297. [Google Scholar] [CrossRef]
- Sims, D.A.; Gamon, J.A. Relationships between leaf pigment content and spectral reflectance across a wide range of species, leaf structures and developmental stages. Remote Sens. Environ. 2002, 81, 337–354. [Google Scholar] [CrossRef]
- Jiang, Z.; Huete, A.; Chen, J.; Chen, Y.; Li, J.; Yan, G.; Zhang, X. Analysis of NDVI and scaled difference vegetation index retrievals of vegetation fraction. Remote Sens. Environ. 2006, 101, 366–378. [Google Scholar] [CrossRef]
- Gao, B.-C. NDWI—A normalized difference water index for remote sensing of vegetation liquid water from space. Remote Sens. Environ. 1996, 58, 257–266. [Google Scholar] [CrossRef]
- Mishra, S.; Mishra, D.R. Normalized difference chlorophyll index: A novel model for remote estimation of chlorophyll-a concentration in turbid productive waters. Remote Sens. Environ. 2012, 117, 394–406. [Google Scholar] [CrossRef]
- Huete, A.R. A soil-adjusted vegetation index (SAVI). Remote Sens. Environ. 1988, 25, 295–309. [Google Scholar] [CrossRef]
- Li, P.; Jiang, L.; Feng, Z.; Sheldon, S. Mapping rice cropping systems using Landsat-derived renormalized index of normalized difference vegetation index (RNDVI) in the Poyang lake region, China. Front. Earth Sci. 2016, 10, 303–314. [Google Scholar] [CrossRef]
- Schleicher, T.D.; Bausch, W.C.; Delgado, J.A.; Ayers, P.D. Evaluation and refinement of the nitrogen reflectance index (NRI) for site-specific fertilizer management. In Proceedings of the 2001 ASAE Annual Meeting, Anaheim, CA, USA, 18–21 August 1998. [Google Scholar]
- Blackburn, G.A. Hyperspectral remote sensing of plant pigments. J. Exp. Bot. 2007, 58, 855–867. [Google Scholar] [CrossRef]
- Mehmood, T.; Liland, K.; Snipen, L.; Sabo, S. A review of variable selection methods in partial least squares regression. Chemom. Intell. Lab. Syst. 2012, 118, 62–69. [Google Scholar] [CrossRef]
- Abdel-Rahman, E.M.; Mutanga, O.; Odindi, J.; Adam, E.; Odindo, A.; Ismail, R. A comparison of partial least squares (PLS) and sparse PLS regressions for predicting yield of Swiss chard grown under different irrigation water sources using hyperspectral data. Comput. Electron. Agric. 2014, 106, 11–19. [Google Scholar] [CrossRef]
- Svetnik, V.; Liaw, A.; Tong, C.; Culberson, J.C.; Sheridan, R.P.; Feuston, B.P. Random forest: A classification and regression tool for compound classification and QSAR modeling. J. Chem. Inf. Comput. Sci. 2003, 43, 1947–1958. [Google Scholar] [CrossRef] [PubMed]
- Liaw, A.; Wiener, M. Classification and regression by randomForest. R News 2002, 2, 18–22. [Google Scholar]
- Latan, H.; Noonan, R.; Matthews, L. Partial least squares path modeling. In Basic Concepts, Methodological Issues and Applications; Springer International Publishing AG: Berlin/Heidelberg, Germany, 2017. [Google Scholar]
- McIntosh, C.N.; Edwards, J.R.; Antonakis, J. Reflections on partial least squares path modeling. Organ. Res. Methods 2014, 17, 210–251. [Google Scholar] [CrossRef]
- Wijesingha, J.; Astor, T.; Schulze-Brüninghoff, D.; Wengert, M.; Wachendorf, M. Predicting forage quality of grasslands using UAV-borne imaging spectroscopy. Remote Sens. 2020, 12, 126. [Google Scholar] [CrossRef]
- Curran, P.J. Remote sensing of foliar chemistry. Remote Sens. Environ. 1989, 30, 271–278. [Google Scholar] [CrossRef]
- Kattenborn, T.; Eichel, J.; Fassnacht, F.E. Convolutional Neural Networks enable efficient, accurate and fine-grained segmentation of plant species and communities from high-resolution UAV imagery. Sci. Rep. 2019, 9, 17656. [Google Scholar] [CrossRef] [PubMed]
- Pullanagari, R.; Dehghan-Shoar, M.; Yule, L.J.; Bhatia, N. Field spectroscopy of canopy nitrogen concentration in temperate grasslands using a convolutional neural network. Remote Sens. Environ. 2021, 257, 112353. [Google Scholar] [CrossRef]
- Gamon, J.A.; Field, C.B.; Fredeen, A.L.; Thayer, S. Assessing photosynthetic downregulation in sunflower stands with an optically-based model. Photosynth. Res. 2001, 67, 113–125. [Google Scholar] [CrossRef]
- Adjorlolo, C.; Mutanga, O.; Cho, M.A. Predicting C3 and C4 grass nutrient variability using in situ canopy reflectance and partial least squares regression. Int. J. Remote Sens. 2015, 36, 1743–1761. [Google Scholar] [CrossRef]
- Kokaly, R.F. View_SPECPR, Software for Plotting Spectra (Installation Manual and User’s Guide, Version 1.2); US Geological Survey: Reston, Virginia, 2008.
- Chapin, F.S.; Bloom, A.J.; Field, C.B.; Waring, R.H. Plant responses to multiple environmental factors. Bioscience 1987, 37, 49–57. [Google Scholar] [CrossRef]
- Bélanger, G.; Gastal, F.; Lemaire, G. Growth analysis of a tall fescue sward fertilized with different rates of nitrogen. Crop Sci. 1992, 32, 1371–1376. [Google Scholar] [CrossRef]
- Funk, J.L.; Glenwinkel, L.A.; Sack, L. Differential allocation to photosynthetic and non-photosynthetic nitrogen fractions among native and invasive species. PLoS ONE 2013, 8, e64502. [Google Scholar] [CrossRef]


Disclaimer/Publisher’s Note: The statements, opinions and data contained in all publications are solely those of the individual author(s) and contributor(s) and not of MDPI and/or the editor(s). MDPI and/or the editor(s) disclaim responsibility for any injury to people or property resulting from any ideas, methods, instructions or products referred to in the content. |
© 2024 by the authors. Licensee MDPI, Basel, Switzerland. This article is an open access article distributed under the terms and conditions of the Creative Commons Attribution (CC BY) license (https://creativecommons.org/licenses/by/4.0/).