Abstract
Effective spraying is essential for modern agricultural production, to ensure a high-quality and abundant harvest. Simultaneously, it is crucial to minimise the negative impact of crop protection products on the environment. To achieve this, it is necessary to implement the appropriate technical and technological parameters for the treatment and to consider the conditions under which the treatment is carried out. The aim of this study was to determine the relationship between the speed of the sprayer, the pressure of the liquid, and the type of nozzles, as well as air temperature and wind speed, in terms of the degree of coverage of the sprayed surfaces. The degree of coverage was analysed by spraying water-sensitive papers placed on the artificial plant, positioned to obtain horizontal and vertical surfaces. The study found that standard single flat fan nozzles provided greater coverage on upper horizontal surfaces, while standard nozzles were more effective for vertical transverse approach surfaces at lower fluid pressures and travel speeds. Neural networks were used to develop models of the relationships studied. Models with high accuracy for the validation data set were obtained in the case of the coverage of the vertical transverse leaving surface and the upper level surface (R = 0.93 and R = 0.86). These models were used to determine the optimum values of the technical parameters of the spraying process under the selected weather conditions. The maximum spray coverage (41.49%) was predicted for the XR nozzle under the following conditions: pressure = 200 kPa, driving speed = 1.4 m·s−1, temperature = 21.73 °C and wind speed = 0.32 m·s−1. Based on the sensitivity analysis of the neural models it was found that the greatest effect on the coverage of the vertical transverse leaving surface was observed for temperature and the coverage of the upper level surface was mostly influenced by driving speed.
1. Introduction
Pesticides are essential for controlling harmful pests in agriculture, forestry, and landscaping. They include substances used to prevent, destroy, repel, attract, or reduce pest organisms. In agricultural production, pesticides are used to control pests, diseases, weeds, and other plant pathogens. The goal is to reduce yield losses and maintain high product quality. The method of application of the pesticides is determined by the nature and habits of the target pest, the characteristics of the target site, and properties of the pesticide formulation [1,2,3,4]. The sustainability of application equipment, costs, and the efficiency of alternative methods must also be considered. The application of crop protection chemicals during peak times is crucial for achieving higher crop yields [5].
As farmers are expected to produce more food with fewer resources, agricultural innovation and research become essential. Precision agriculture offers opportunities to help farmers increase productivity and save on labour expenses. Precision spraying allows for the right amount of products to be applied only to the crops that need it. According to Gil et al. pesticide applications are considered significant in current agricultural plant protection practices [6]. Pesticide application on limited agricultural land can help to maximise agricultural output [7,8,9]. Abbas et al. found that variable-rate spray treatments with intelligent control systems can drastically decrease unintended environmental damage caused by the use of pesticides. This method also allows farmers to apply pesticides only where they are needed, using the appropriate amount based on canopy size, the time of year, and the stage of plant growth. The objective of spraying in agriculture is to achieve a uniform distribution of chemicals throughout the crop foliage. It is important to maintain the correct dosage to ensure the effective and efficient use of pesticides. Underdosing may result in inadequate coverage, while overdosing can lead to pesticide waste and increased environmental impact [3,10,11], as well as the potential for groundwater contamination [12]. Although pesticides are manufactured under strict regulations to be reasonably safe and have minimal impact on humans and the environment, there are serious concerns about health risks resulting from human exposure and residues in food and drinking water [10,11,13].
The quality of the spraying process is largely determined by spray drift, which refers to the movement of pesticide dust or droplets through the air to unintended locations during or shortly after application [11]. Spray drift is affected by, among other things, the droplet size distribution, which depends on the nozzle type and the pressure of the spray liquid [14,15]. Spray nozzles in pesticide application equipment produce pesticide droplets. It is important to select the correct nozzle type and size for each application. Flat fan, solid cone, flooding, triple action, broadcast fan, blast, low volume and centrifugal are the most commonly used nozzles for pesticide application [5]. As the droplet size is much smaller, good coverage can be achieved with less chemical contamination [7,16]. However, in low humidity, smaller droplets evaporate quickly and may not reach the target.
The other very important features that affect the quality of the spraying process are the speed and position of the sprayer boom, the weather conditions and the crop conditions. Establishing the relationships between these parameters and indicators of spraying efficiency and developing mathematical models is therefore crucial to optimising the spraying process. There are two approaches to developing models of spraying operations: empirical and mechanistic. Empirical models are based on experimental data and often use statistical methods or artificial intelligence tools such as machine learning algorithms to establish relationships between various operational factors, weather conditions, and crop characteristics and spraying quality. Mechanistic models are built using a physical basis for spray drift, such as Gaussian dispersion equations and particle tracking models. [17]. Gu et al. [18] employed the three methods—classic regression, partial least squares regression, and back propagation neural network—to develop a wind loss model that can be used for real-life application in orchards. Wang and Rautmann [19] created the probabilistic spray drift model based on the Monte Carlo simulation parametrised using experimental field data. Azizpanah et al. [20] used a combination of image processing and neural modelling to predict a spray drift and droplet volume median diameter for various operating parameters. Peñaloza et al. [21] presented a computational model for the prediction of droplet size and spray angle, which determine the spraying quality based on the operational conditions and parameters of the nozzle and the liquid to be sprayed. The other example of models useful for the analysis of spraying operations is the AgDRIFT model developed by the US Environmental Protection Agency. It contains mechanistic aerial application algorithms as well as empirical curves for drift estimation [22]. This model was validated by some researchers and should be the subject of further improvement [23].
The accurate mathematical models can be used to optimise the spraying process to reduce the off-target drift and improve the quality of spraying operation. In our previous research, machine learning methods were used to build empirical models of the relationships between operational factors and parameters describing spraying quality. A neural network was employed to create an accurate model for predicting an average degree of the coverage of sprayed surfaces or the coverage uniformity coefficient based on droplet size, spray angle, and driving speed [24]. The model was used to determine the optimal operating factors. The same machine learning technique was used to analyse the influence of nozzle type, spray pressure, driving speed and spray angle on spray coverage. The optimisation process was then carried out to maximise the percentage area coverage [25]. Nadeem et al. [26] proposed the bi-objective mathematical model of the spraying process to optimise spraying time and drift proportion. The authors presented the optimal values of boom height, speed, nozzle spacing, and operating pressure for a specific nozzle type. These values simultaneously minimise spraying time and drift.
Today’s crop protection technology focuses on minimising the disadvantages of spraying while maximising treatment quality, efficiency, and effectiveness. The proper execution of treatment is crucial for two strategies published by the European Commission (2020) [27]. According to these strategies, the use of pesticides must be reduced by 50%. To achieve this, treatment scenarios must be created that consider technical and technological parameters, as well as weather conditions. Therefore, the aim of this study is to develop machine learning models that establish the relationships between the percentage area coverage of sprayed surfaces and nozzle type, spray pressure, driving speed, and weather conditions (wind speed and temperature). The study also conducts an optimisation of the application process efficiency by using an evolutionary algorithm based on accurate models. Furthermore, the study determines the importance of input variables in each of the neural models.
2. Materials and Methods
2.1. Experiment Set-Up
The study was conducted in the year 2022 on a strawberry plantation in Jaszkotle village, in the Kąty Wrocławskie municipality, Poland. Experimental plots measuring 10 m in length and 1.80 m in width were designated, and fertilisation treatments were carried out using Barrier Si-Ca from Cosmocel (Monterrey, Mexico) on the following dates: 30 May, 6 June, 14 June, and 22 June. The experimental results obtained on 6 June, 14 June, and 22 June were analysed. The atmospheric conditions at the time of the measurements are presented in Table 1.

Table 1.
Atmospheric conditions measured during the survey.
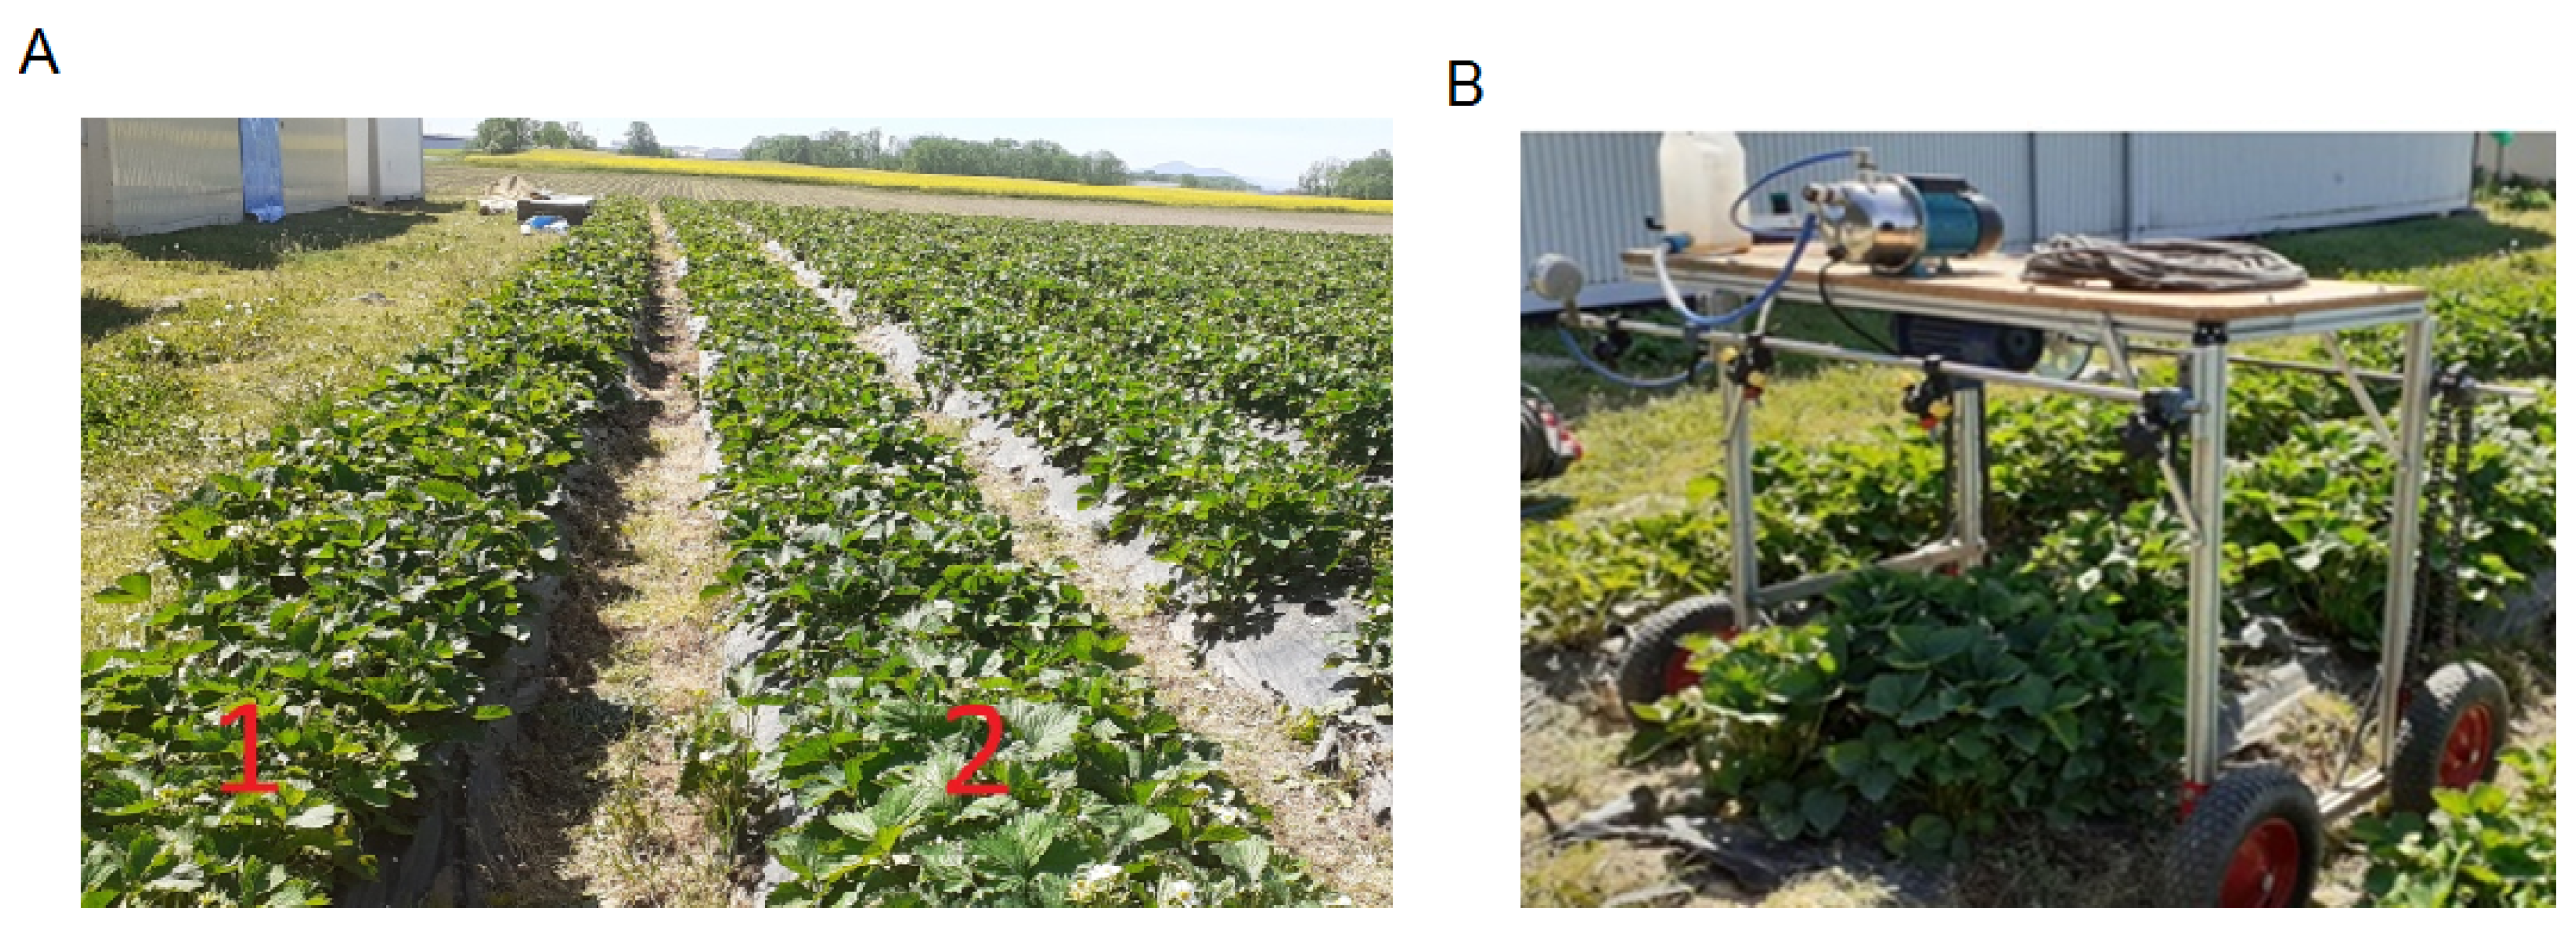
The fertilisation treatment was carried out using a spraying device that operated similarly to a self-propelled sprayer. Figure 1 shows the spraying device and the strawberry plantation where the experiment was carried out.

Figure 1.
The strawberry plantation with experimental plots marked as 1 and 2 (A), spraying device (B).
The experiments were conducted using two types of nozzles: standard single flat fan nozzles (XR) and air induction single flat fan nozzles (AIXR). The boom height was set at 0.5 m. Table 2 lists the other technical parameters and weather conditions.
Table 2.
The statistics of technical parameters and weather conditions during the experiment.
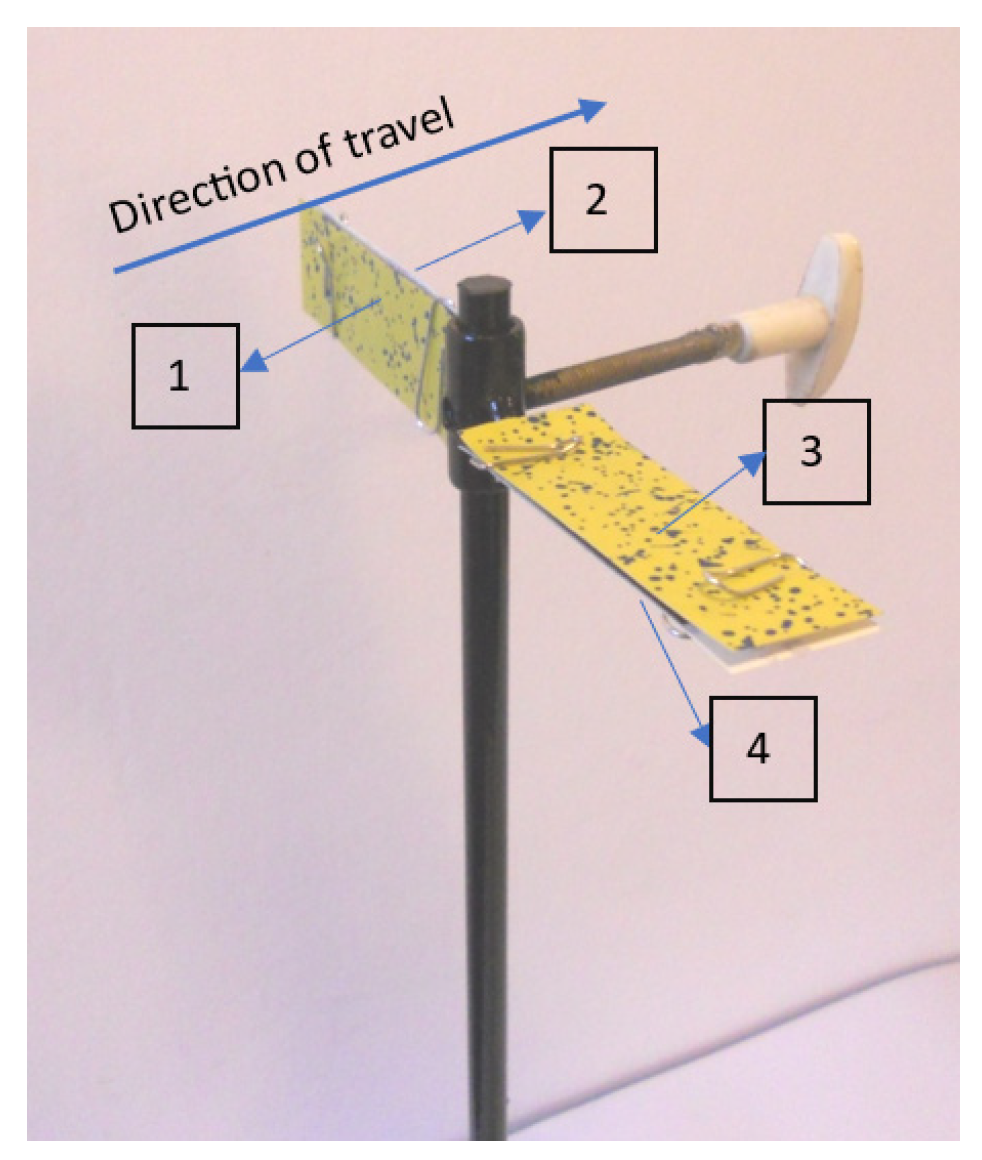
During the passage of the spraying device, three artificial plants with attached water-sensitive papers (76 mm × 26 mm, Syngenta Crop Protection AG, Basel, Switzerland) were positioned in the experimental plot to obtain horizontal and vertical surfaces. Artificial plants were used in the experiments to avoid changes in leaf position caused by atmospheric or apparent wind due to the movement of the aggregate. When spraying, the nozzles mounted on the boom are in a vertical plane perpendicular to the ground. This positioning of the nozzles causes the sprayed liquid to be deposited on vertical and/or horizontal surfaces. To ensure the repeatability of the tests, the water-sensitive paper was attached to an artificial plant in such a way as to create vertical and horizontal surfaces. The coverage of four different leaf surfaces shown in Figure 2 was determined as follows: the vertical transverse approach surface (1), the vertical transverse leaving surface (2), the upper level surface (3), and the bottom level surface (4).

Figure 2.
Location of water-sensitive papers on an artificial plant according to the sprayed surfaces.
After spraying, the water-sensitive papers were removed from the artificial plants and protected from moisture. The degree of coverage of the sprayed areas was determined through computer image analysis after scanning. A detailed discussion of the test rig and methodology for testing the coverage of sprayed surfaces is provided by Cieniawska et al. [28].
2.2. Artificial Neural Networks
Artificial Neural Networks (ANNs) are computer learning systems inspired by the functioning of the human nervous system. ANNs consist of layers of artificial neurons, which are simple information-processing units. The artificial neural network system requires at least two layers: an input layer that transfers input signals to the network and an output layer with artificial neurons. The multilayer perceptron (MLP) is the neural network used to model the relationships under study. In an MLP network, the signal from the input layer is processed through one or two hidden layers to the output layer. During training, a backpropagation algorithm adjusts the connection weights in an MLP.
A total of 217 data points were obtained from field measurements. The data set was then randomly divided into training and validation sets in an 80:20 ratio. The data were normalised within the range of 0 to 1. For this study, multilayer perceptron structures were created using Statistica v.13 software (TIBCO Software Inc., Tulsa, OK, USA). The input vector consisted of pressure, driving speed, temperature, and wind speed. Three independent models were created, each with an output parameter representing the coverage of (1) the vertical transverse approach surface, (2) the vertical transverse leaving surface, and (3) the upper level surface. For each model, we trained 2000 neural structures with one hidden layer, using a random initial connection weight matrix and various transfer functions of neurons, to determine the optimal number of neurons in the hidden layer. The number of neurons in the hidden layer ranged from 10 to 50.
Neural models are often considered as black-box models, making it impossible to analyse their internal structure and obtain additional information about the relationships under study. However, sensitivity analysis methods have been developed for neural networks, which provide valuable information about the modelled relationships. In this research the sensitivity analysis algorithm implemented in the Statistica v.13 software environment was employed. The results produced by the algorithm can be converted into the percentage effect of each independent variable on the output parameter of the model. This method has also been used in previous publications [24,29,30].
2.3. Criteria of Accuracy Assessment of Models
This research employed five metrics to evaluate the accuracy of neural models: coefficient of correlation (R), root mean squared error (RMSE), mean absolute error (MAE), mean absolute percentage error (MAPE), and Nash–Sutcliffe coefficient (NSC). The equations for calculating these metrics are described in Equations (1)–(5):
where Ypred is the absolute value calculated by the model, is the arithmetic mean of values calculated by the model, Ymeas is the absolute experimental value, is the arithmetic mean of experimental values, and n is the number of vectors in the data set.
In addition to the metrics described in Equations (1)–(5), it is also important to consider the model’s ability to generalise the knowledge contained in the training data. Therefore, Yoon et al. [31] proposed the generalisation ability (GA) metric, which is calculated according to Equation (6) and used as an additional parameter to assess the quality of the models:
where RMSEv is the root mean squared error for the validation data set and RMSEt is the root mean squared error for the training data set.
In this research the interpretation of the GA value suggested by El Bilali et al. [32] was used. If the GA value was between 0.75 and 1.35, the model was considered excellent. If the GA value was in the range <0.5;0.75)∪(1.35;2>, the model was considered good.
2.4. Optimisation
Evolutionary algorithms are frequently used to solve optimisation problems. These methods involve creating generations of potential solutions, which are encoded as vectors of binary or real numbers known as individuals. Some individuals are selected and then genetic operations, such as crossover and mutation, are performed on selected individuals to create new generations. Selection methods work by giving better individuals a higher probability of producing offspring. The quality of individuals is evaluated using an objective function, which requires a model that describes the relationship between the optimised parameters and the feature that characterises the quality of the solution. In this research neural models created in the Statistica v. 13 environment were used. The aim of the optimisation process was to maximise the degree of coverage. Therefore, the objective function was defined as the sum of the coverage of the surfaces under study. The genetic algorithm implemented in the Excel 2013 solver was used as the evolutionary algorithm. The parameters of the algorithm are detailed in Table 3.
Table 3.
Parameters of the genetic algorithm.
3. Results
Table 4 provides detailed statistics on the coverage of the areas under study. The coverage of the bottom level surface is not presented because this surface was not covered with spray liquid.
Table 4.
The statistics of experimental data.
In neural models, only linearly independent predictor variables should be considered. Therefore, Pearson’s correlation coefficients between the quantitative explanatory variables were calculated. The results are presented in Table 5.
Table 5.
Correlation coefficients between explanatory variables.
The data presented in Table 5 show that the correlation coefficients between explanatory variables are very low. Only the correlation coefficient between temperature and wind speed is statistically significant (p < 0.005) but the value of the coefficient is low enough to consider both variables in model development.
3.1. Artificial Neural Models
The three models based on multilayer perceptron neural networks were developed and then used for sensitivity analysis and the optimisation process. In each model the five input parameters were employed: pressure, driving speed, temperature, wind speed, and nozzle type. Depending on the output parameter the models were named as follows: MLP_UL for the coverage of the upper level surface, MLP_VTA for the coverage of the vertical transverse approach surface, and MLP_VTL for the coverage of the vertical transverse leaving surface. The structures (the number of nodes in the input layer—the number of neurons in the hidden layer—the number of neurons in the output layer) and accuracy parameters for the best MLP models are presented in Table 6.
Table 6.
Structures and error metrics of the best MLP neural models.
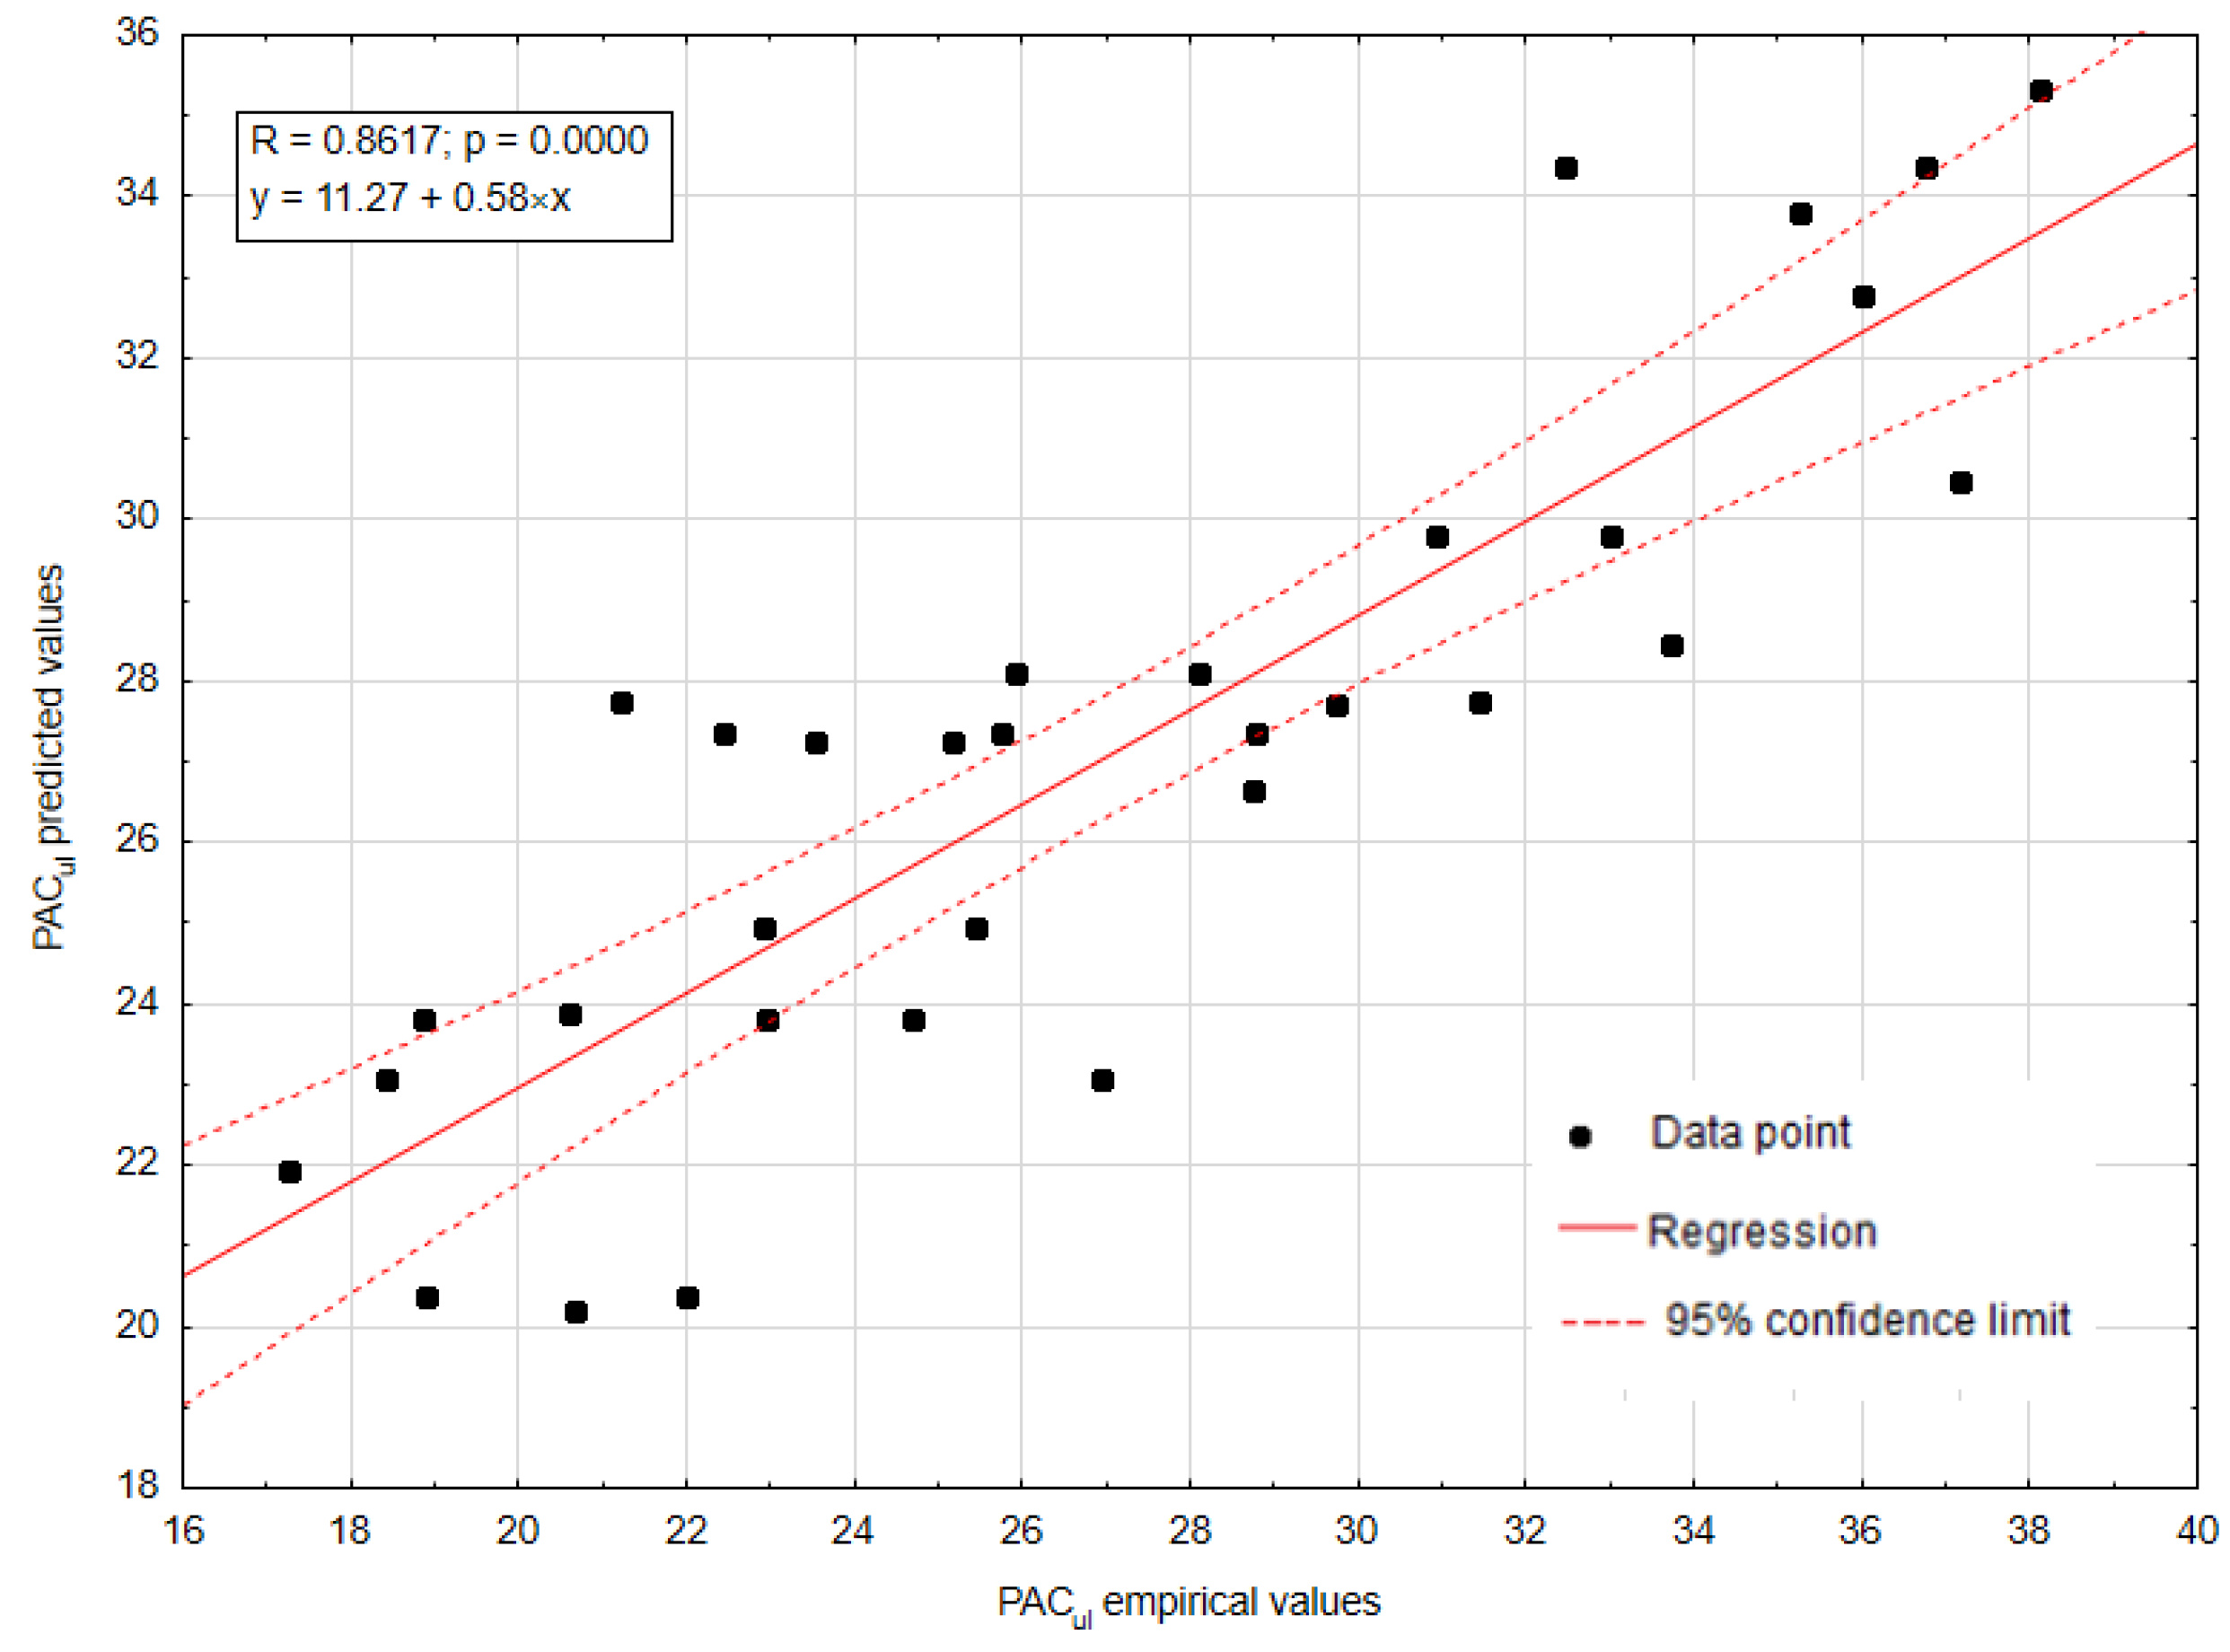
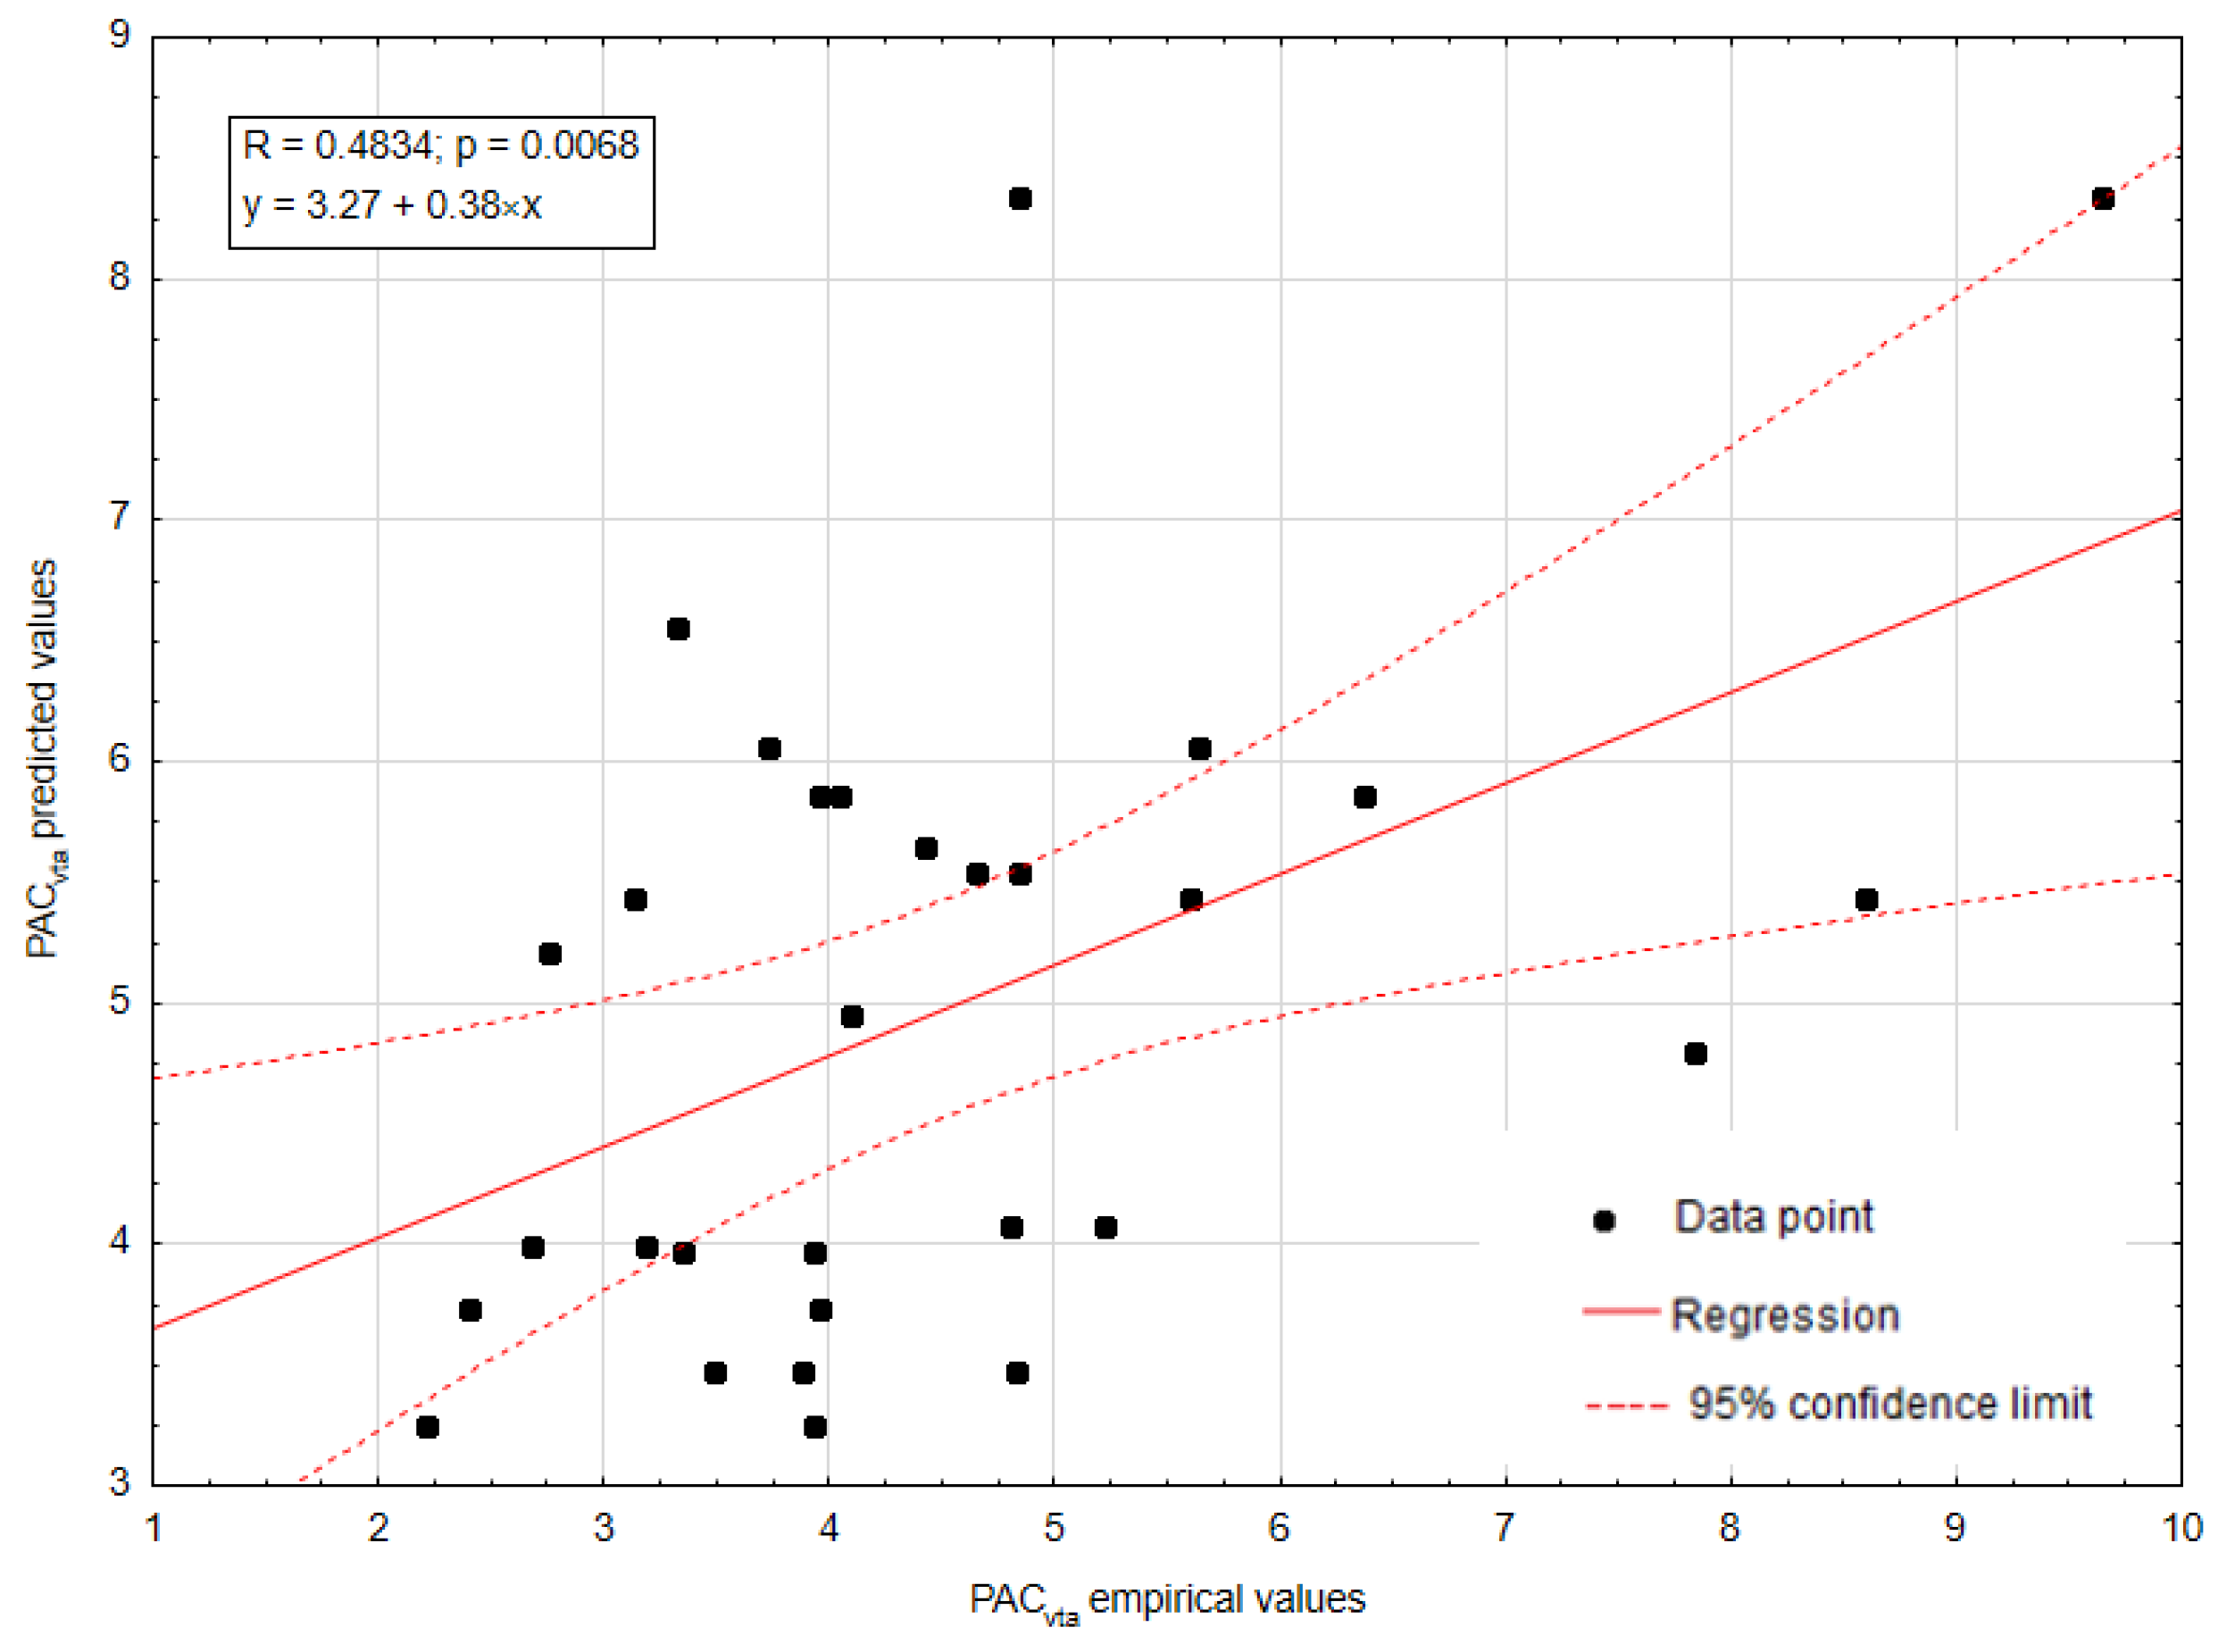
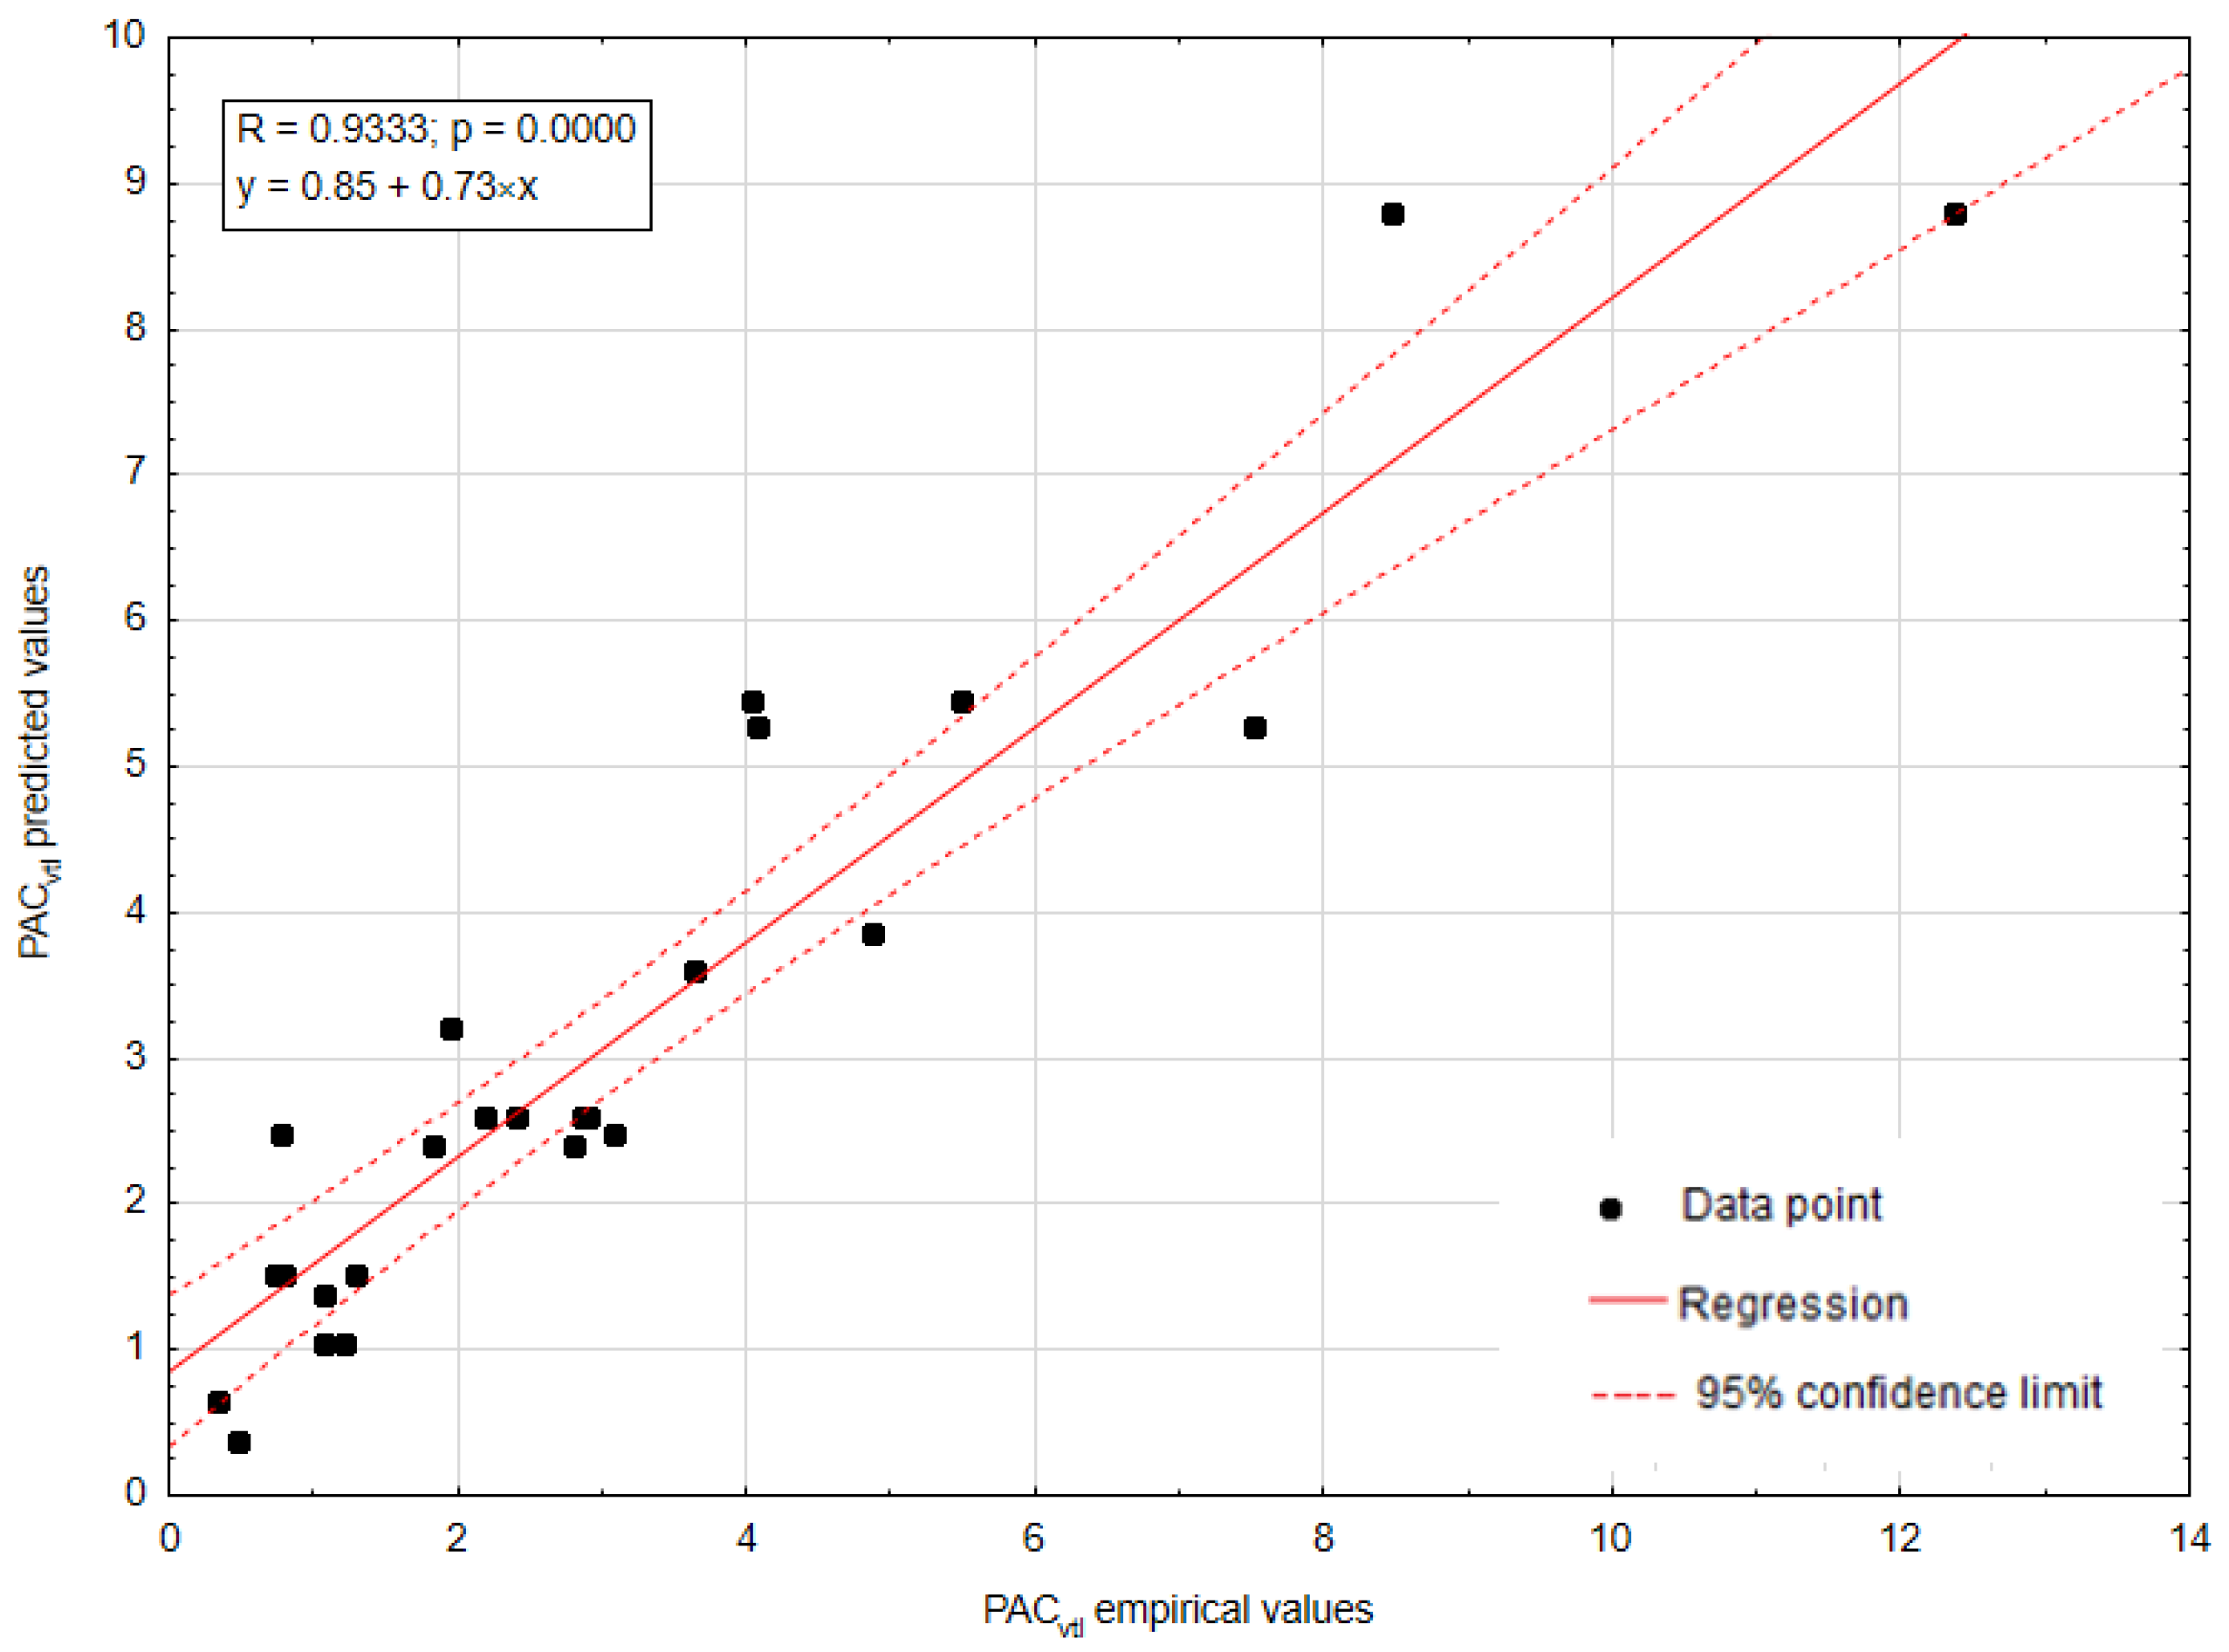
The MLP models of the coverage of the upper level surface (MLP_UL) and the coverage of the vertical transverse leaving surface (MLP_VTL) are highly accurate when considering the R-value and NSC metric for the training and validation dataset. The high correlation between the predicted and measured values of the coverage for the validation data set shows the good generalisation ability of the models. Significantly lower accuracy was achieved for the models with the coverage of the vertical transverse approach surface as the output parameter (MLP_VTA). The R-values calculated for this model were only 0.626 for the training data set and 0.483 for the validation data set. Based on the error metrics presented in Table 6, it can be stated that this model is of low practical value. Considering the generalisation ability, the models can be classified as excellent or good.
The results of the coverage of the vertical transverse approach surface were unexpected and may on one hand have been caused by the turbulence in the air as a result of the wind, and the apparent wind caused by the movement of the unit on the other. Therefore, large differences between the maximum and minimum values were recorded on this surface with low coverage. In addition, some liquid may have been deposited on the vertical transverse leaving surface and the upper level surface.
The tests were carried out on water-sensitive papers that were placed on artificial plants to form a surface on which spray coverage was analysed. The results obtained can therefore be compared with the authors’ previous work. The experiments conducted under laboratory conditions revealed that the upper level surface yielded the highest coverage values. This finding is consistent with the results presented in the publication [33]. The results confirm the lack of spray coverage on the bottom horizontal surface. However, there are differences in the coverage values on the vertical surfaces, with higher values obtained on the transverse approach surfaces compared to the transverse leaving surfaces [34]. These results may be useful for comparing and verifying the results of similar experiments in the future.
In Figure 3, Figure 4 and Figure 5, the performance of MLP models for the validation data set is presented.

Figure 3.
The scatter plot of predicted values versus measured values for MLP_UL model.

Figure 4.
The scatter plot of predicted values versus measured values for MLP_VTA model.

Figure 5.
The scatter plot of predicted values versus measured values for MLP_VTL model.
3.2. Sensitivity Analysis
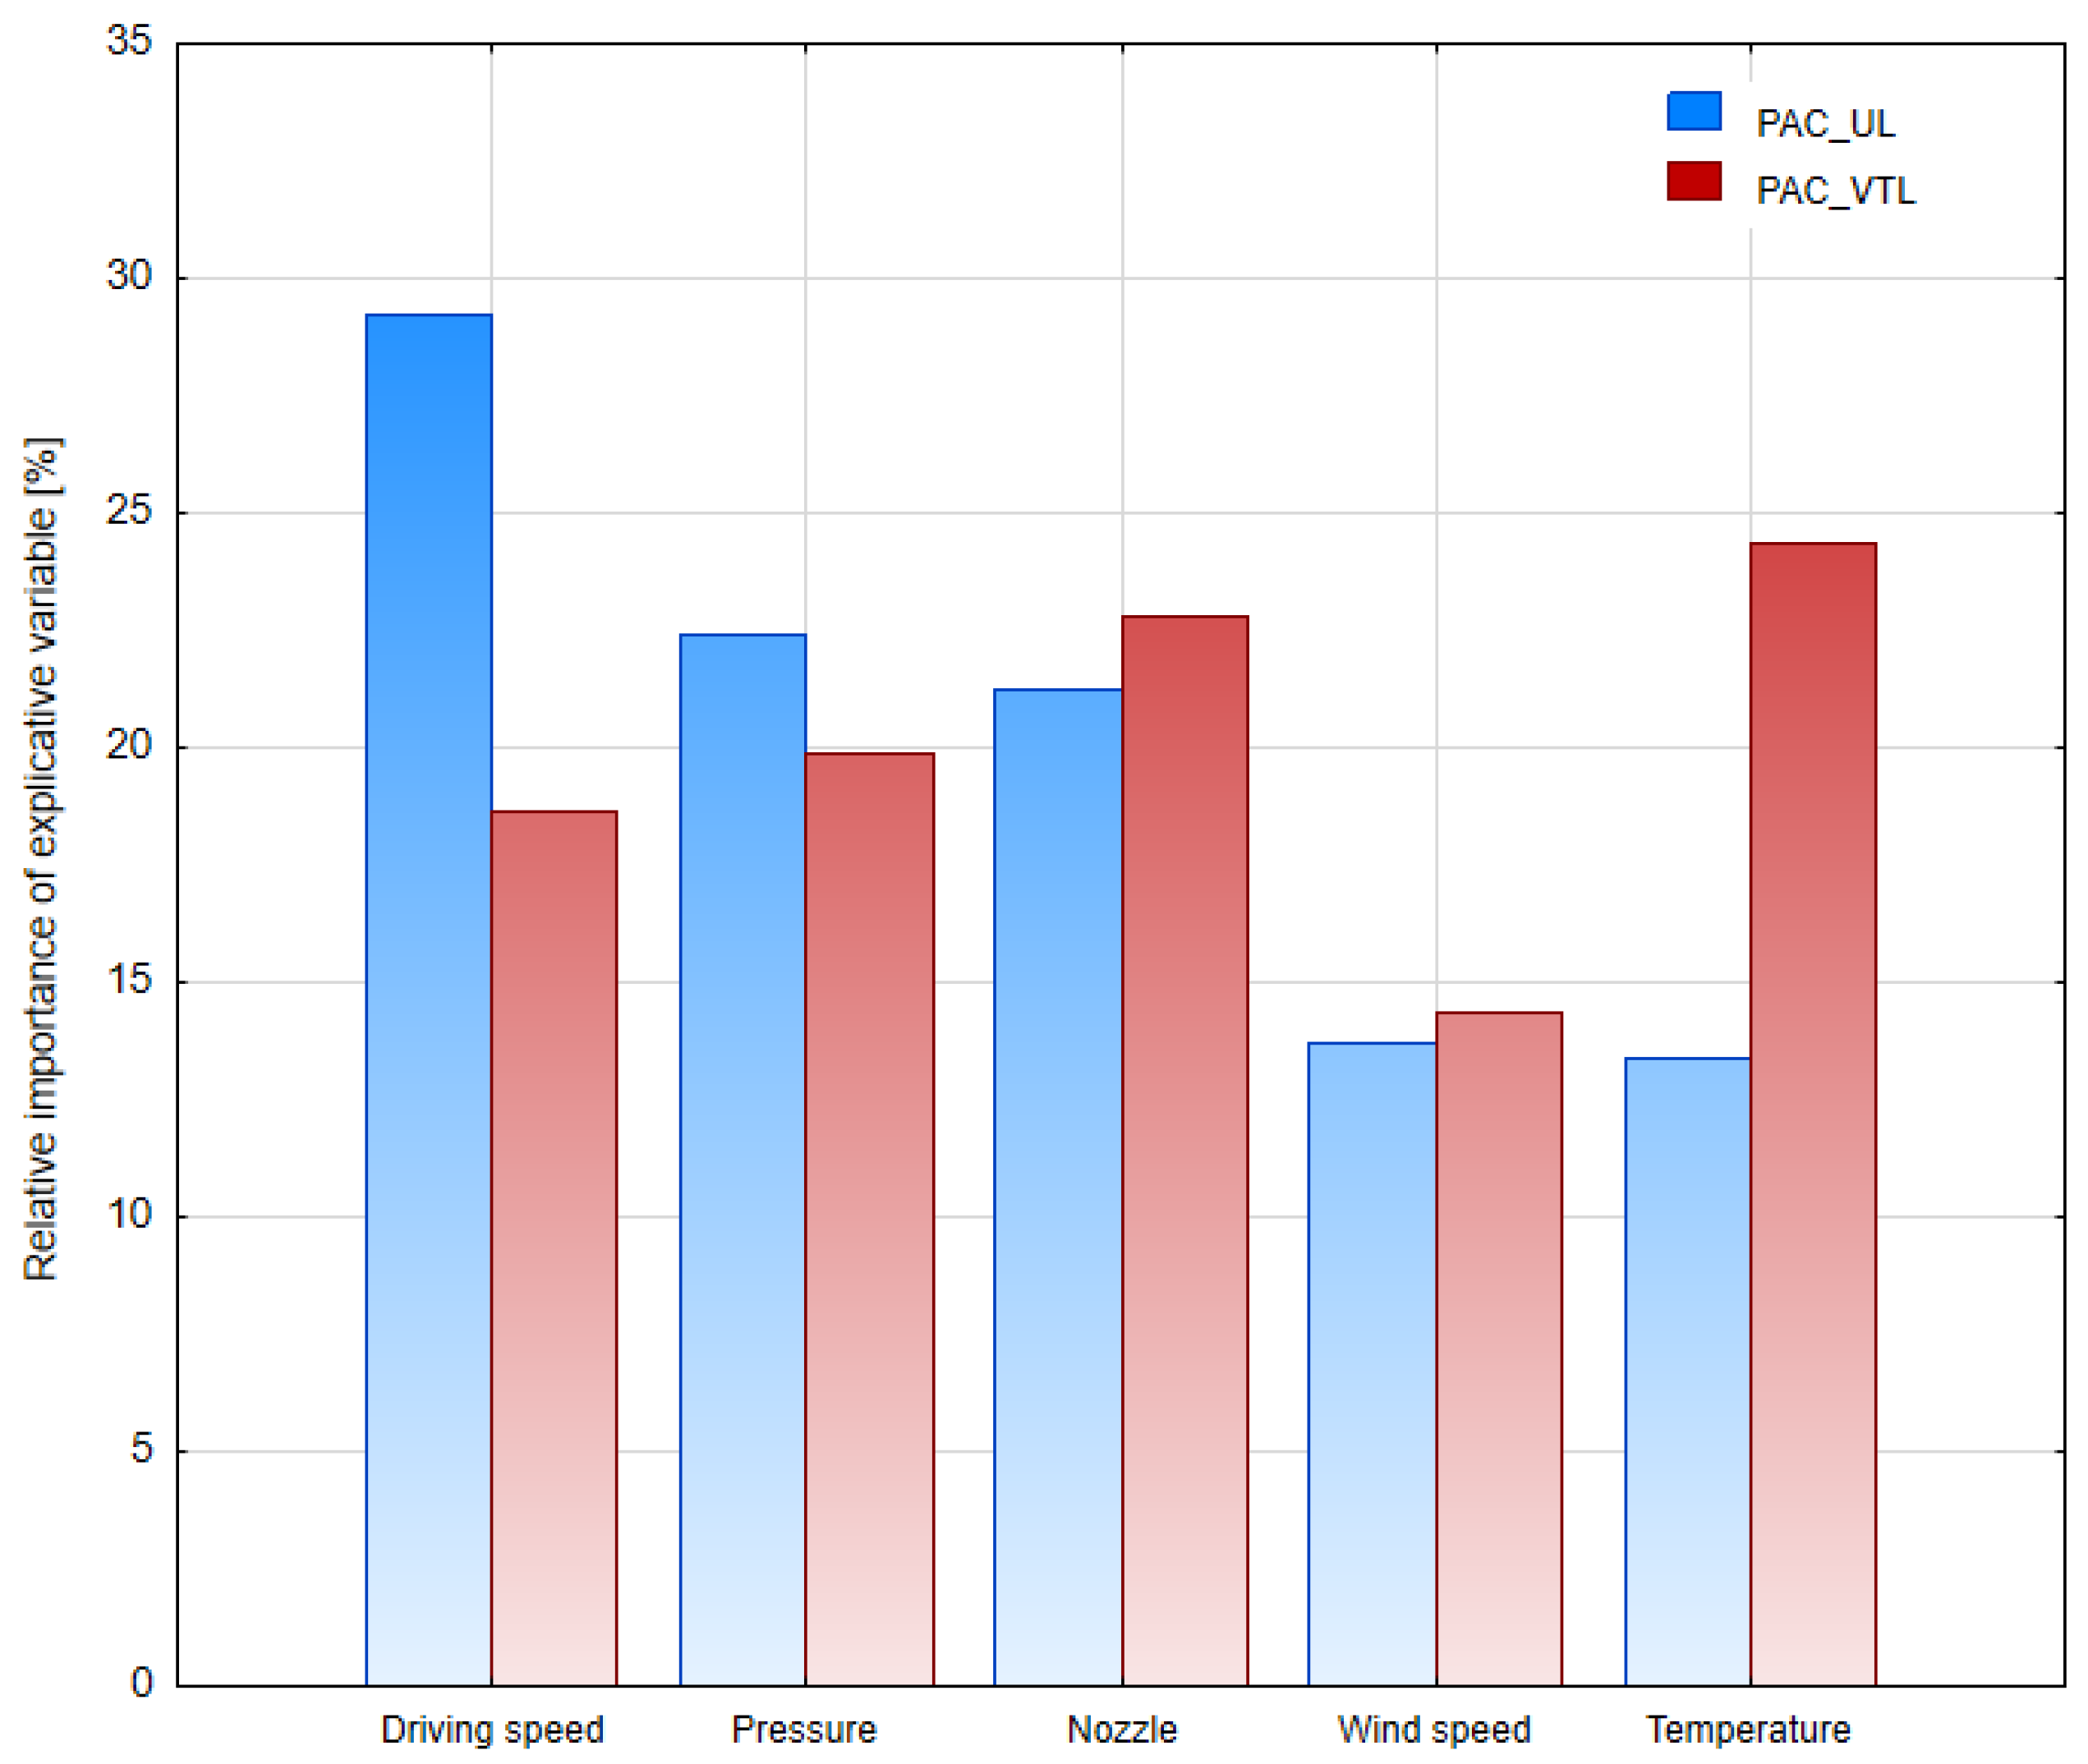
The sensitivity analysis of neural models is designed to determine the relative importance of the input variables. In this research only two models were of acceptable accuracy, therefore only the MLP_UL and MLP_VTL models were analysed. The sensitivity analysis of the MLP_VTA model might lead to misleading results. Figure 6 shows a percentage contribution of explicative variables to the average degree of coverage of the vertical transverse approach surface and the coverage of the upper level surface.

Figure 6.
The relative contribution of the input variables on the coverage of the vertical transverse leaving and the upper level surfaces.
The impact of technical and environmental parameters on coverage varies depending on the leaf surface. For the upper level surface, driving speed has the greatest impact on coverage, while temperature has the greatest impact on coverage for the vertical transverse leaving surface. Pressure and nozzle type were observed to have a significant impact on the coverage of both surfaces, while wind speed had a much smaller impact. It is important to note that the wind speed remained within the optimum range throughout the trials.
3.3. Optimisation
When optimising the spraying process, the goal is to achieve maximum spray coverage by selecting the appropriate technical parameter values. For this purpose, an objective function must be defined. In this study, neural models were used to define the objective function. As the MLP_VTA model has low accuracy, models for the vertical transverse leaving and upper level surface were used. The objective function was defined as the sum of the coverages of these surfaces, and it was maximised during optimisation.
Optimisation was carried out under different scenarios. In Scenario 1, it was assumed that all parameters, including pressure, driving speed, temperature, and wind speed, could be optimised for a specific nozzle type. In real life, however, the operator can only adjust the operational parameters. Weather conditions are only considered to the extent that the treatment is carried out when the temperature and wind speed are within acceptable limits. Therefore, the pressure and driving speed of each nozzle have been optimised for the extreme values of temperature and wind speed:
- Scenario 2—minimum temperature and minimum wind speed,
- Scenario 3—minimum temperature and maximum wind speed,
- Scenario 4—maximum temperature and minimum wind speed,
- Scenario 5—maximum temperature and maximum wind speed.
The data presented in Table 7 show that for the XR standard nozzles a higher coverage values were observed. The highest values were obtained at a driving speed of 1.4 m·s−1 and a pressure of 200 kPa, with lower wind speed and air temperature. To achieve high coverage with AIXR air induction nozzles, the liquid pressure should be increased to 400 kPa. Sapkota et al. [35] obtained comparable results in their experiments conducted under field conditions at wind speeds of 0.6–1.0 m·s−1. The experiment was conducted using XRC standard nozzles as well as AIXR and TTI air induction nozzles. The variable speed range was between 2.7 m·s−1 and 6.25 m·s−1 at a pressure of 207 kPa. The study indicates that the coverage rate decreases as driving speed increases, which is in line with our findings. Ferguson et al. [36] demonstrated higher coverage with XR nozzles than with AIXR nozzles. The experiments were conducted on rye crops at a driving speed of 2.14 m·s−1 and a pressure of 207 kPa. Legleiter and Johnson [37] achieved comparable coverage levels using standard XR and air induction AIXR nozzles.
Table 7.
The results of optimisation for various scenarios.
In another publication, Ferguson et al. [38] demonstrated that AIXR nozzles provided comparable crop coverage to standard nozzles. Creech et al. [39], on the other hand, found that XR nozzles provided the highest coverage in maize crops, while TTI nozzles were the most effective for applying crop protection products in soybean crops. The results of several studies indicate the need for further research on the impact of technical and technological factors, as well as the atmospheric conditions during spraying, on treatment quality.
4. Discussion
The study evaluated the effect of various technical and technological parameters on the coverage of sprayed surfaces. The research was carried out under field conditions. As in our study, Bahrouni et al. [40] conducted tests under field conditions using two nozzle types, three nozzle sizes (02, 03 and 05), three pressures (300, 400 and 600 kPa) and different wind speeds ranging from 1.0 to 3.0 m·s−1. During the spraying process, it is important to adjust the parameters that the operator can control, and these factors do not include wind speed. The authors confirmed that spray quality is influenced by nozzle type, nozzle size and liquid pressure, which correlates with our experimental results and those of other researchers, including Creech et al. [41] and Allagui et al. [42]. Furthermore, the researchers confirmed that liquid retention on the plants increased with higher spray pressure. It is important to note that the tests presented in this publication were conducted at a lower wind speed of 0.3–0.6 m·s−1, compared to the wind speed of 1.0–3.0 m·s−1 in the study by Bahrouni et al. [40]. Virk et al. [43] discovered that the coverage values in peanut cultivation varied depending on the type of nozzle used. The experiment consisted of seven tests to be carried out between 2018 and 2020. Standard nozzles (XR and XRC) and air induction nozzles (TADF and TDXL, TTI and TTI60) were selected for the tests. In three tests there was no statistically significant difference in coverage between the standard and air induction nozzles. In one test, a statistically significant higher coverage value was achieved with the standard XR nozzle (14.6%) than with the TADF air induction nozzle (10.2%). In the other three tests, the coverage produced by the air induction nozzles was significantly higher and the differences were in the range of 30–60%. Ferguson et al. [36] compared different samplers to assess the quality of the treatment based on the coverage of the sprayed areas. The selected samplers were Mylar washed (MW), Mylar image analysis (MIA), water-sensitive paper (WSP), and Kromekote (KK). The researchers concluded that the use of different samplers enables the quantification of the droplets deposited on plants during treatment. The test results for MW and WSP were almost identical, allowing for the determination of spray quality and the concentration of active ingredients. In contrast, the use of MIA provided information on the number of very fine droplets that settle on the plants, which are often not visible on the WSP or KK cards. The results obtained on KK indicate that in five out of six trials the coverage values were similar to those obtained on WSP.
The relationships between the technical and environmental parameters and spraying quality are complex, multidimensional, and non-linear. Therefore, various methods are used to model these relationships. Some models are based on the knowledge of the physical nature of the relationships being analysed. However, the construction of such models is a challenging task. The rapid development of machine learning techniques has made the process of building data-driven models more efficient. Azizpanah et al. [20] employed ANNs to develop models to predict drift based on wind velocity, nozzle height, volume median diameter and relative span factor. The authors trained various ANN structures and constructed highly accurate models (correlation between target and predicted values for test data set R > 0.99). Liu et al. [44] investigated the distribution of spray droplets within the canopy of cotton plants. The non-parametric Bayesian regression technique (Gaussian processes) was used to calculate droplet deposition in the upper, middle, and lower canopy layers based on the stratification porosity data. The model quality was satisfactory for the upper and middle layers (R > 0.9), but inaccurate for the lower layer (R = 0.58). Jiang et al. [45] developed a backpropagation neural network model to predict droplet coverage at any position within the canopy. The authors identified four input parameters that influenced droplet coverage: foliage area, volume density, and X, Y, and Z positions. They found the performance of the neural network model to be acceptable, with an R value of 0.73.
A model that accurately describes the relationship between operational parameters and the quality of the spray treatment can be utilised to estimate the quality of the treatment under specific conditions. However, some authors use predictive models to optimise the spraying process. Li et al. [46] used a genetic algorithm to determine the optimal values of four operational parameters (two angle variations and two independent angle iteration periods) to minimise the coefficient of variation of droplet deposition, which characterises the uniformity of deposition. Khan et al. [47] examined the correlation between forward speed, spray height, and spray pressure as independent variables and droplet density, and coverage percentage and volume median diameter as parameters describing spraying quality. The authors employed a response surface methodology to determine the optimal values of operational parameters for the application of fungicides, insecticides, and herbicides.
5. Conclusions
The quality and effectiveness of the spraying procedure depend on the appropriate technical and technological parameters, taking into account weather conditions. It is important to consider these factors when determining the optimal spraying conditions. Tests were carried out with two types of single-stream nozzles at varying driving speeds and liquid pressures, as well as wind speeds ranging from 0.3 to 0.6 m·s−1 and temperatures of 21–23 °C. Based on the experiments carried out, it was found that higher coverage values were obtained on the upper horizontal surfaces compared to the vertical surfaces. Regardless of the operating parameters used, the standard single flat fan nozzles covered the upper horizontal surfaces better. On the other hand, on the vertical transverse approach surfaces, higher coverage values were obtained with the air induction flat fan nozzles when higher liquid pressures were applied. Considering the coverage of the vertical transverse leaving surfaces, it can be concluded that higher coverage values were recorded with standard single flat fan nozzles, except when spraying at liquid pressures of 400 kPa and 200 kPa, an air temperature of 21 °C and a wind speed of 0.5–0.6 m·s−1. The bottom horizontal surfaces were not covered with liquid.
This study utilised artificial neural networks to develop models that demonstrate the relationship between the degree of crop coverage with spray liquid and the parameters of the spraying process and weather conditions. Highly accurate models were obtained for the coverage of the vertical transverse leaving surface and the upper level surfaces, which can be applied in practice. The correlation coefficient between the target and predicted values for the models was R = 0.933 and R = 0.862, respectively. The models were used to determine the degree of influence of the analysed process parameters on the coverage of individual leaf surfaces. The sensitivity analysis results indicate that the coverage of the upper level surface is primarily influenced by the driving speed, while the temperature during the spraying treatment has the greatest effect on the coverage of the vertical transverse leaving surface. Wind speed has a minor impact on the coverage of both surfaces.
Furthermore, optimisation was conducted for five treatment scenarios, where driving speed, liquid pressure, and nozzle type were optimised under extreme conditions of air temperature and wind speed. For the following conditions: XR nozzle, pressure = 200 kPa, driving speed = 1.4 m·s−1, temperature = 21.73 °C and wind speed = 0.32 m·s−1, the optimum spray coverage of 41.49% can be achieved. It is noteworthy that, for both types of nozzles, higher coverage values were achieved when a lower driving speed was employed. However, when using AIXR air induction nozzles, higher pressure values are recommended. The optimal conditions for the AIXR nozzles were found to be pressure = 400 kPa, driving speed = 1.4 m·s−1, temperature = 21 °C and wind speed = 0.33 m·s−1. For XR standard nozzles, the liquid pressure should be adjusted based on atmospheric conditions. For lower temperatures, the optimum pressure is 200 kPa for a wind speed of 0.30 m·s−1 and 270 kPa for a wind speed of 0.55 m·s−1. For a temperature of 23 °C, the optimum pressure is 340 kPa for a wind speed of 0.30 m·s−1 and 400 kPa for a wind speed of 0.55 m·s−1. The application artificial intelligence algorithms can determine the optimal spraying process parameters under real conditions. At the same time, this can provide valuable insights into the correct and optimal use of crop protection products.
Author Contributions
Conceptualization, B.C. and K.P.; methodology, B.C., K.P. and J.T.M.; validation, B.C., K.P. and P.K.; formal analysis, B.C. and K.P.; investigation, B.C., P.K., M.S. and M.B.; data curation, B.C., K.P. and J.T.M.; writing—original draft preparation, B.C., J.T.M. and K.P.; writing—review and editing, P.K.; visualization, K.P. and J.T.M. All authors have read and agreed to the published version of the manuscript.
Funding
This research received no external funding.
Institutional Review Board Statement
Not applicable.
Data Availability Statement
The raw data supporting the conclusions of this article will be made available by the authors on request.
Conflicts of Interest
The authors declare no conflicts of interest.
References
- Ministry of Agriculture. About Pesticides: Types, Names and Formulations; Ministry of Agriculture: Victoria, BC, Canada, 2017.
- EPA, South Australia. Safe and Effective Pesticide Use. A Handbook for Commercial Spray Operators. Available online: www.epa.sa.gov.au (accessed on 6 March 2024).
- OECD. Report on the State of the Knowledge—Literature Review on Unmanned Aerial Spray Systems in Agriculture; OECD Series on Pesticides; No. 105; OECD Publishing: Paris, France, 2021. [Google Scholar]
- Bessin, R. Kentucky Pesticide Education Program; University of Kentucky Department of Entomology: Lexington, KY, USA, 2016. [Google Scholar]
- Malik, R.K.; Pundir, A.; Dar, S.R.; Singh, S.K.; Gopal, R.; Shankar, P.R.; Singh, N.; Jat, M.L. Sprayers and Spraying Techniques—A Manual; CSISA: Dhaka, Bangladesh; IRRI: Los Baños, Philippines; CIMMYT: Texcoco, Mexico, 2012; 20p, Available online: https://repository.cimmyt.org/bitstream/handle/10883/1332/96765.pdf?sequence=1&isAllowed=y (accessed on 6 March 2024).
- Gil, E.; Arnó, J.; Llorens, J.; Sanz, R.; Llop, J.; Rosell-Polo, J.R.; Gallart, M.; Escolà, A. Advanced Technologies for the Improvement of Spray Application Techniques in Spanish Viticulture: An Overview. Sensors 2014, 14, 691–708. [Google Scholar] [CrossRef]
- Mattah, M.M.; Mattah, P.A.D.; Futagbi, G. Pesticide Application among Farmers in the Catchment of Ashaiman Irrigation Scheme of Ghana: Health Implications. J. Environ. Public Health 2015, 2015, 547272. [Google Scholar] [CrossRef]
- Ahmad, F.; Khaliq, A.; Qiu, B.; Sultan, M.; Ma, J. Advancements of Spraying Technology in Agriculture. In Technology in Agriculture; IntechOpen: London, UK, 2021. [Google Scholar] [CrossRef]
- Patel, M.K. Technological Improvements in Electrostatic Spraying and Its Impact to Agriculture during the Last Decade and Future Research Perspectives—A Review. Eng. Agric. Environ. Food 2016, 9, 92–100. [Google Scholar] [CrossRef]
- Abbas, I.; Liu, J.; Faheem, M.; Noor, R.S.; Shaikh, S.A.; Solangi, K.A.; Raza, S.M. Different Sensor Based Intelligent Spraying Systems in Agriculture. Sens. Actuators A Phys. 2020, 316, 112265. [Google Scholar] [CrossRef]
- United States EPA. Introduction to Pesticide Drift. 2022. Available online: https://www.epa.gov/reducing-pesticide-drift (accessed on 6 March 2024).
- Bartok, J.W., Jr. Sprayers and Spray Application Techniques, Center for Agriculture, Food, and the Environment. 2021. Available online: https://ag.umass.edu/greenhouse-floriculture (accessed on 6 March 2024).
- Damalas, C.A.; Eleftherohorinos, I.G. Pesticide Exposure, Safety Issues, and Risk Assessment Indicators. Int. J. Environ. Res. Public Health 2011, 8, 1402–1419. [Google Scholar] [CrossRef]
- Hanafi, A.; Hindy, M.; Ghani, S.A. Effect of Spray Application Techniques on Spray Deposits and Residues of Bifenthrin in Peas under Field Conditions. J. Pestic. Sci. 2016, 41, 49–54. [Google Scholar] [CrossRef] [PubMed]
- Kjær, C.; Bruus, M.; Bossi, R.; Løfstrøm, P.; Andersen, H.V.; Nuyttens, D.; Larsen, S.E. Pesticide Drift Deposition in Hedgerows from Multiple Spray Swaths. J. Pestic. Sci. 2014, 39, 14–21. [Google Scholar] [CrossRef]
- Nordgaard, A.; Correll, R. Sampling Strategies. In Integrated Analytical Approaches for Pesticide Management; Elsevier: Amsterdam, The Netherlands, 2018. [Google Scholar] [CrossRef]
- Teske, M.E.; Bird, S.L.; Esterly, D.M.; Curbishley, T.B.; Ray, S.L.; Perry, S.G. AgDRIFT®: A Model for Estimating near-Field Spray Drift from Aerial Applications. Environ. Toxicol. Chem. 2002, 21, 659–671. [Google Scholar] [CrossRef] [PubMed]
- Gu, C.; Zou, W.; Wang, X.; Chen, L.; Zhai, C. Wind Loss Model for the Thick Canopies of Orchard Trees Based on Accurate Variable Spraying. Front. Plant Sci. 2022, 13, 1010540. [Google Scholar] [CrossRef]
- Wang, M.; Rautmann, D. A Simple Probabilistic Estimation of Spray Drift—Factors Determining Spray Drift and Development of a Model. Environ. Toxicol. Chem. 2008, 27, 2617–2626. [Google Scholar] [CrossRef]
- Azizpanah, A.; Rajabipour, A.; Alimardani, R.; Kheiralipour, K.; Mohammadi, V. Precision Spray Modeling Using Image Processing and Artificial Neural Network. Agric. Eng. Int. CIGR J. 2015, 17, 65–74. [Google Scholar]
- Penaloza, E.A.G.; Mercaldi, H.V.; Oliveira, V.A.; Cruvinel, P.E. An Advanced Model Based on Analytical and Computational Procedures for the Evaluation of Spraying Processes in Agriculture. In Proceedings of the 2016 IEEE 10th International Conference on Semantic Computing, ICSC 2016, Laguna Hills, CA, USA, 4–6 February 2016. [Google Scholar] [CrossRef]
- Bird, S.L.; Perry, S.G.; Ray, S.L.; Teske, M.E. Evaluation of the AgDISP Aerial Spray Algorithms in the AgDRIFT Model. Environ. Toxicol. Chem. 2002, 21, 672–681. [Google Scholar] [CrossRef] [PubMed]
- Desmarteau, D.A.; Ritter, A.M.; Hendley, P.; Guevara, M.W. Impact of Wind Speed and Direction and Key Meteorological Parameters on Potential Pesticide Drift Mass Loadings from Sequential Aerial Applications. Integr. Environ. Assess. Manag. 2020, 16, 197–210. [Google Scholar] [CrossRef] [PubMed]
- Cieniawska, B.; Pentos, K. Average Degree of Coverage and Coverage Unevenness Coefficient as Parameters for Spraying Quality Assessment. Agriculture 2021, 11, 151. [Google Scholar] [CrossRef]
- Cieniawska, B.; Pentoś, K.; Łuczycka, D. Neural Modeling and Optimization of the Coverage of the Sprayed Surface. Bull. Pol. Acad. Sci. Tech. Sci. 2020, 68, 601–608. [Google Scholar] [CrossRef]
- Nadeem, M.; Diallo, C.; Nguyen-Quang, T.; Venkatadri, U.; Havard, P. Optimizing a Bi-Objective Mathematical Model for Minimizing Spraying Time and Drift Proportion. AgriEngineering 2019, 1, 418–433. [Google Scholar] [CrossRef]
- European Commission. Communication from the Commission to the European Parliament, the Council, the European Economic and Social Committee and the Committee of the Regions—A Farm to Fork Strategy for a Fair, Healthy and Environmentally-Friendly Food System COM, 2020, 381 Final. Available online: https://eur-lex.europa.eu/legal-content/EN/TXT/?uri=CELEX%3A52020DC0381 (accessed on 5 January 2024).
- Cieniawska, B.; Komarnicki, P.; Samelski, M.; Barć, M. Effect of Calcium Foliar Spray Technique on Mechanical Properties of Strawberries. Plants 2023, 12, 2390. [Google Scholar] [CrossRef] [PubMed]
- Kuźniar, P.; Pentoś, K.; Gorzelany, J. Evaluation of the Use of Machine Learning to Predict Selected Mechanical Properties of Red Currant Fruit (Ribes rubrum L.) Ozonized during Storage. Agriculture 2023, 13, 2125. [Google Scholar] [CrossRef]
- Pentoś, K.; Mbah, J.T.; Pieczarka, K.; Niedbała, G.; Wojciechowski, T. Evaluation of Multiple Linear Regression and Machine Learning Approaches to Predict Soil Compaction and Shear Stress Based on Electrical Parameters. Appl. Sci. 2022, 12, 8791. [Google Scholar] [CrossRef]
- Yoon, H.; Jun, S.C.; Hyun, Y.; Bae, G.O.; Lee, K.K. A Comparative Study of Artificial Neural Networks and Support Vector Machines for Predicting Groundwater Levels in a Coastal Aquifer. J. Hydrol. 2011, 396, 128–138. [Google Scholar] [CrossRef]
- El Bilali, A.; Moukhliss, M.; Taleb, A.; Nafii, A.; Alabjah, B.; Brouziyne, Y.; Mazigh, N.; Teznine, K.; Mhamed, M. Predicting Daily Pore Water Pressure in Embankment Dam: Empowering Machine Learning-Based Modeling. Environ. Sci. Pollut. Res. 2022, 29, 47382–47398. [Google Scholar] [CrossRef]
- Cieniawska, B.; Pentoś, K.; Szulc, T. Correlation and Regression Analysis of Spraying Process Quality Indicators. Appl. Sci. 2022, 12, 12034. [Google Scholar] [CrossRef]
- Dereń, K.; Cieniawska, B.; Szewczyk, A. The Average Coverage of Sprayed Objects Depending on the Coefficient of Spray Surface for the Selected Nozzles. Agric. Eng. 2016, 20, 31–41. [Google Scholar] [CrossRef]
- Sapkota, M.; Virk, S.; Rains, G. Spray Deposition and Quality Assessment at Varying Ground Speeds for an Agricultural Sprayer with and without a Rate Controller. AgriEngineering 2023, 5, 506–519. [Google Scholar] [CrossRef]
- Ferguson, J.C.; Hewitt, A.J.; O’Donnell, C.C.; Kruger, G.R. Comparison of Water-Sensitive Paper, Kromekote and Mylar Collectors for Droplet Deposition with a Visible Fluorescent Dye Solution. J. Plant Prot. Res. 2020, 60, 98–105. [Google Scholar] [CrossRef]
- Legleiter, T.R.; Johnson, W.G. Herbicide Coverage in Narrow Row Soybean as Influenced by Spray Nozzle Design and Carrier Volume. Crop Prot. 2016, 83, 1–8. [Google Scholar] [CrossRef]
- Ferguson, J.C.; Chechetto, R.G.; Hewitt, A.J.; Chauhan, B.S.; Adkins, S.W.; Kruger, G.R.; O’Donnell, C.C. Assessing the deposition and canopy penetration of nozzles with different spray qualities in an oat (Avena sativa L.) canopy. Crop Prot. 2016, 81, 14–19. [Google Scholar] [CrossRef]
- Creech Cody, F.; Henry, R.S.; Hewitt, A.J.; Kruger, G.R. Herbicide spray penetration into corn and soybean canopies using air-induction nozzles and a drift control adjuvant. Weed Technol. 2018, 32, 72–79. [Google Scholar] [CrossRef]
- Bahrouni, H.; Chaabane, H.; Marzougui, N.; Ben Meriem, S.; Bchini, H.; Ben Abdallah, M.A. Effect of Sprayer Parameters and Wind Speed on Spray Retention and Soil Deposits of Pesticides: Case of Artichoke Cultivar. Plant Prot. Sci. 2021, 57, 333–343. [Google Scholar] [CrossRef]
- Creech, C.F.; Henry, R.S.; Fritz, B.K.; Kruger, G.R. Influence of Herbicide Active Ingredient, Nozzle Type, Orifice Size, Spray Pressure, and Carrier Volume Rate on Spray Droplet Size Characteristics. Weed Technol. 2015, 29, 298–310. [Google Scholar] [CrossRef]
- Allagui, A.; Bahrouni, H.; M’Sadak, Y. Deposition of Pesticide to the Soil and Plant Retention During Crop Spraying: The Art State. J. Agric. Sci. 2018, 10, 104–115. [Google Scholar] [CrossRef]
- Virk, S.S.; Prostko, E.P.; Kemerait, R.C.; Abney, M.R.; Rains, G.C.; Powell, C.T.; Carlson, D.S.; Jacobs, J.L.; Tyson, W.G. On-Farm Evaluation of Nozzle Types for Peanut Pest Management Using Commercial Sprayers. Peanut Sci. 2021, 48, 87–96. [Google Scholar] [CrossRef]
- Liu, X.; Liu, X.; Li, Y.; Yuan, J.; Li, H. Predicting Spray Deposit Distribution within a Cotton Plant Canopy Based on Canopy Stratification Porosity and Gaussian Process Models. Biosyst. Eng. 2021, 204, 1–14. [Google Scholar] [CrossRef]
- Jiang, S.; Yang, S.; Xu, J.; Li, W.; Zheng, Y.; Liu, X.; Tan, Y. Wind Field and Droplet Coverage Characteristics of Air-Assisted Sprayer in Mango-Tree Canopies. Pest Manag. Sci. 2022, 78, 4892–4904. [Google Scholar] [CrossRef]
- Li, Y.; Yuan, J.; Liu, X.; Niu, Z.; Chen, B.; Liu, X. Spraying Strategy Optimization with Genetic Algorithm for Autonomous Air-Assisted Sprayer in Chinese Heliogreenhouses. Comput. Electron. Agric. 2019, 156, 84–95. [Google Scholar] [CrossRef]
- Khan, F.A.; Ghafoor, A.; Khan, M.A.; Chattha, M.U.; Kouhanestani, F.K. Parameter Optimization of Newly Developed Self-Propelled Variable Height Crop Sprayer Using Response Surface Methodology (RSM) Approach. Agriculture 2022, 12, 408. [Google Scholar] [CrossRef]
Disclaimer/Publisher’s Note: The statements, opinions and data contained in all publications are solely those of the individual author(s) and contributor(s) and not of MDPI and/or the editor(s). MDPI and/or the editor(s) disclaim responsibility for any injury to people or property resulting from any ideas, methods, instructions or products referred to in the content. |
© 2024 by the authors. Licensee MDPI, Basel, Switzerland. This article is an open access article distributed under the terms and conditions of the Creative Commons Attribution (CC BY) license (https://creativecommons.org/licenses/by/4.0/).