Next Article in Journal
The Presence of Arbuscular Mycorrhizal Fungi in the Rhizosphere of Transgenic Rapeseed Overexpressing a Trichoderma Thkel1 Gene Improves Plant Development and Yield
Previous Article in Journal
An Internet of Things-Based Cluster System for Monitoring Lactating Sows’ Feed and Water Intake
 
 
Correction published on 8 August 2024, see Agriculture 2024, 14(8), 1309.
Article

Spatial-Temporal Variations and Driving Factors of the Coupling and Coordination Level of the Digital Economy and Sustainable Rural Development: A Case Study of China

by
Wanxiang Nong
,
Jun Wen
* and
Jingyue He
College of Agriculture, Guangxi University, Nanning 530004, China
*
Author to whom correspondence should be addressed.
Agriculture 2024, 14(6), 849; https://doi.org/10.3390/agriculture14060849
Submission received: 14 May 2024 / Revised: 24 May 2024 / Accepted: 27 May 2024 / Published: 29 May 2024 / Corrected: 8 August 2024
(This article belongs to the Section Agricultural Economics, Policies and Rural Management)

Abstract

:
Sustainable rural development forms a robust foundation for economic and social sustainability. Moreover, the digital economy acts as a catalyst for advancing rural sustainable development by altering the distribution of production factors. Thus, this study concentrates on 30 provinces in China, constructing an evaluation index system for both the digital economy and rural sustainable development. The study employs various methods and models to analyze the spatiotemporal changes and driving factors affecting the coupling and coordination between these two aspects. The research findings are as follows: the coupling and coordination levels among provinces in China have been on the rise year by year. By 2022, the coupling and coordination levels of most provinces range between 0.5 and 0.6. Regional disparities are the primary determinant of the poor overall coupling and coordination level in China. In 2022, the coupling and coordination level in the eastern region is 0.6663, compared to 0.5420 in the central region and 0.5087 in the western region. Factors such as urbanization, industrial structure transformation, technological innovation, higher education, economic development, and government support significantly influence the coupling and coordination level. Nevertheless, their effects vary across regions, with a more pronounced impact in the eastern region than in the central and western regions. Therefore, this paper proposes policy recommendations, including infrastructure optimization, rural digitization promotion, regional resource allocation enhancement, cross-regional development mechanism exploration, and differentiated development strategy implementation.

1. Introduction

The rural economy is a critical component of the national economy, and its development is crucial for sustaining national economic growth. The development of agriculture, rural areas, and farmers plays a significant supporting role in the processes of modernization. Additionally, it plays a crucial role in maintaining social stability, cultural heritage, and ecological conservation. China, one of the most populous countries in the world, has a vast rural area and rural population. The living standards and development status of rural residents are directly related to China’s overall economic and social development. Therefore, the Chinese government has been continuously exploring and implementing policies in the rural sector for many years. The targeted poverty alleviation policy, implemented since 2013, has successfully helped tens of millions of impoverished people escape poverty. The “rural revitalization” strategy, proposed in 2018, has made positive contributions to promoting the upgrading of the rural economic structure, improving farmers’ living conditions, and fostering integrated urban-rural development. These efforts have created a unique experience in the development of rural China, providing valuable insights for China’s future development and for other countries and regions seeking to promote rural development.
The advent of the digital economy has introduced a new dimension to rural development, offering unprecedented opportunities and challenges for growth and transformation. Digital technologies, including big data, the Internet of Things (IoT), satellite remote sensing, and smart agricultural equipment, significantly enhance farmers’ precision in crop-growth management, pest and disease control, and water-resource utilization, thereby increasing yield and improving product quality [1]. Additionally, through e-commerce platforms, agricultural products can be sold directly to broader markets, modernizing economic development methods and fostering sustainable agricultural and rural development [2]. Furthermore, digital-education resources, such as online courses, provide rural residents with new skills, enhance their knowledge, and improve the economic potential of their communities [3]. Digital governance platforms also increase the transparency of government services and simplify administrative processes, making it easier for rural residents to enjoy government services [4]. However, despite the many benefits that the digital economy brings to rural areas, it also faces challenges such as the digital divide, skills mismatch, and insufficient infrastructure. Therefore, studying the digital economy in relation to sustainable rural development holds significant practical relevance.
This study is based on the basic indicator data from 30 provinces in China spanning the period from 2013 to 2022. It employs the entropy weight method and coupling–coordination model to analyze the coupling–coordination level between the digital economy and sustainable rural development, focusing on time variation and spatial characteristics. Furthermore, the study utilizes the Dagum Gini coefficient to analyze regional differences in coupling–coordination levels. Additionally, it uses kernel-density estimation to analyze the dynamic evolution of coupling–coordination development. Finally, a random effects panel Tobit model is employed to analyze the driving factors. The aim is to provide a case study for scholars with an interest in China’s rural development.

2. Literature Review and Relations Analysis

2.1. Literature Review

2.1.1. Related Research of the Digital Economy

The concept of the digital economy is pivotal in understanding the integration of information, computing, and communication technologies in modern economic frameworks. It serves as a cornerstone for business innovation, trade facilitation, and employment expansion through platforms such as social media networks, alongside advanced technologies including artificial intelligence and quantum computing [5]. The digital economy not only streamlines production and service delivery through online platforms, electronic payments, and internet commerce but also significantly boosts productivity and fosters innovation across diverse sectors [6]. In traditional industries, the adoption of new technologies and the promotion of digital transformation can improve productivity, help modernize these industries, and achieve sustainable economic growth [7].
Research on the digital economy is extensive and multifaceted. First, the evolution of technological innovation and management in Chinese enterprises underscores the significance of indigenous technological innovation capabilities and the establishment of enterprise innovation systems to support entrepreneurial and R&D activities [8]. The drive for innovation in technologies like artificial intelligence and 5G networks has significantly impacted China’s industrial structure and employment patterns, leading to long-term stable promotional effects [9]. Second, digital transformation enhances economic efficiency, resource allocation, and environmental optimization, playing a pivotal role in promoting corporate sustainability [10]. By utilizing modern digital technologies, enterprises can effectively manage innovative transformations, ensure the implementation of sustainable development principles, and enhance operational efficiency through metrics and strategic approaches [11]. Third, the development of information and communication technology (ICT) is considered essential for modern and dynamic societies, influencing areas such as marketing, finance, and digital aspects [12]. The development of institutional regulations in the ICT field can significantly enhance economic efficiency and promote innovation [13]. Fourth, the rapid development of China’s digital economy impacts urban environmental quality and residents’ health. Digital progress directly improves health and alleviates environmental pollution [14]. Nevertheless, the absence of corresponding digital infrastructure, high-tech talent, and overreliance on raw materials in a region may impede the regional development of the digital economy [15].
Overall, the digital economy is instrumental in generating employment opportunities, driving sustainable innovation, and promoting sustainable development [16]. This underscores that the development of the digital economy is a fundamental component of the global economic landscape, with profound potential to impact the economic and social development of various regions.

2.1.2. Research on the Digital Economy and Rural Development

Over time, research on the digital economy has expanded into the realm of rural development. Scholars are focusing on how the digital economy can foster sustainable development in rural areas, emphasizing ecological sustainability, economic growth, and social progress. This includes improving the quality of rural life, enhancing infrastructure, and boosting productivity, and involves promoting rural industries, labor migration, and financial development to advance economic progress [17]. Therefore, this study defines sustainable rural development as a development mode that promotes the long-term development of rural areas by improving the quality of life of rural residents, fostering the transformation and upgrading of the agricultural industry, and optimizing the rural ecological environment.
Among these, the positive impact of the digital economy on farmers’ income is a current focus of research. The “Internet+” technology refers to the penetration and integration of new generational information technologies such as big data and the Internet of Things into economic fields, promoting the development model of digital, intelligent, and information transformation of manufacturing enterprises [18]. It strengthens information exchange between regions, breaking information barriers between urban and rural areas as well as between domestic and foreign markets [19]. It also establishes a rural–urban link for knowledge workers, thereby facilitating information exchange and labor mobility [20]. In addition, the emergence of the digital economy has also given rise to new economic forms, promoting the construction of rural e-commerce, stimulating rural consumption, and providing new ways for farmers to increase their income [21]. In China, e-commerce has become a powerful tool for poverty alleviation in impoverished counties, enabling agricultural products to directly enter urban consumer markets [22].
Secondly, the upgrading and transformation of the agricultural industrial structure is also another research focus. The digital economy is transforming the agricultural production mode, optimizing traditional practices, and enhancing total factor productivity [23]. Driven by technologies such as artificial intelligence, the Internet of Things, and blockchain, the digital transformation of agriculture enhances quality through precise control and traceability [24]. At the same time, it will promote the integrated development of agricultural production, processing, circulation, sales and service, and promote the integration of rural industries [25]. This integration extends to rural logistics, where the digital economy is gradually merging, driving the industry towards digital transformation and sustainable development [26]. Moreover, the rural digital economy acts as a bridge between rural and urban areas, expanding market transactions and efficiency, and addressing issues like overcapacity and market information asymmetry [27]. In rural areas, the digital economy, by integrating with the traditional economy, promotes the sharing of information, knowledge, and other aspects, promoting the transformation of rural industrial structures [28].
Concurrently, the issue of ecological protection has emerged as a focal point within the digital economy discourse, particularly emphasizing the role of technology in sustainable development. The use of technology is recognized as crucial for fostering a sustainable digital economy [29]. In regions like China, the digital economy has become a driving force behind green innovation, offering strategies to lower carbon dioxide emissions, promote green economic growth, and transition traditional, polluting, and energy-intensive industries towards environmental sustainability [30]. The implementation of strategies such as “digital villages” has not only increased rural productivity but also implemented the broader Sustainable Development Goals and increasingly promoted sustainable agricultural cultural practices [31]. In addition, the expansion of digital finance makes it possible to adopt efficient and low-carbon agricultural technologies, thereby reducing agricultural carbon emissions and promoting green agricultural development [32].
Finally, the discussion focuses on the coupling–coordination mechanism between the digital economy and rural development. The development characteristics and influencing factors of the digital economy and rural revitalization were analyzed using the coupling–coordination degree and the grey correlation model [33]. The coupling–coordination degree model, the Dagum Gini coefficient, and the panel space metrology model were used to analyze the spatiotemporal differences between the coupled and coordinated development levels of China’s digital economy and rural revitalization [34]. The time evolution method and geographically weighted regression are employed to analyze the driving factors of the coupled and coordinated development levels of China’s digital economy and urban–rural integration [35]. The coupling–coordination degree model, the Theil index, and the Tobit model are used to analyze the spatiotemporal differences and influencing factors of the horizontal coupling–coordination levels of China’s marine economy and digital economy [36]. The coupled–coordination degree model and obstacle degree model were employed to analyze the obstacle factors of the coupled–coordination levels of agriculture, rural digitalization, and the food system [37].
Currently, despite extensive research by the academic community on the digital economy and rural areas, there is still a need to further explore the relationship between the digital economy and sustainable rural development. Therefore, based on addressing existing research gaps, this study utilizes data from 30 provinces in China to analyze the relationship between China’s digital economy and sustainable rural development using a variety of methods. The potential contributions of this paper are as follows: first, it explores the relationship between the digital economy and sustainable rural development in detail at the theoretical level, enriching the research content in this field. Second, the kernel density estimation method is employed to further analyze the dynamic evolution trend of the coupling–coordination level. Third, the paper analyzes the driving factors of the digital economy and sustainable rural development using a random effects Tobit model.

2.2. Relations Analysis

Through the review of the above relevant literature, it is evident that the impact of the digital economy on rural development is mainly concentrated in residents’ living standards, agricultural industry development, and the rural ecological environment. First, the emergence of rural e-commerce, promoted by the development of the digital economy and coupled with strengthened logistics infrastructure, not only creates new employment opportunities for rural areas but also expands the opportunities for rural residents to obtain various products and services. Rural residents utilize online platforms to access goods from urban areas and benefit from enhanced education and medical services through distance education and telemedicine solutions, which significantly enhance the convenience and comfort of rural life, thereby fundamentally raising the standard of living. Second, the use of Internet of Things (IoT) technology to monitor soil moisture and nutrient levels in real time, and the application of big data analytics to optimize crop quality and yield, signify the shift to smart agricultural management [38]. This access to information provides farmers with essential market data, including price trends and demand forecasts, which enhances agricultural productivity and promotes the transformation and upgrading of the agricultural industry. Third, digital innovation facilitates the development of precision agriculture, enabling the more targeted application of resources, including pesticides and fertilizers, to mitigate environmental degradation, reduce resource waste, and steer rural areas toward sustainable development.
After reviewing the relevant literature on the impact of rural development on the digital economy, it is clear that its impact is primarily concentrated in digital technologies, digital markets, and digital talent. First, the development of rural areas is heavily dependent on the enhancement of information and communication technology (ICT) infrastructure. This development is characterized by the rapid construction and upgrading of communication and information-technology infrastructures, which enhance digital-access capabilities and provide optimized connectivity and services across wider regions [39]. Second, as rural areas develop, so does the demand for digital technologies and services. Rural residents are increasingly using digital tools and platforms to sell agricultural products, access educational resources, and participate through social networks, and this expanded use has broadened the market reach of the digital economy [2]. Third, the unique needs of rural areas have driven innovation in digital technologies such as smart agriculture, telemedicine, and online education. These innovations promote the development of rural digital talent by addressing the specific needs of rural residents and providing advanced technologies [40].
Therefore, based on the previous analysis, the relationship between the digital economy and sustainable rural development is shown in Figure 1. As can be seen from the figure, the digital economy consists of three main components: digital infrastructure, digital-industry development, and digital-innovation level. The digital economy has a significant impact on sustainable rural development. First, the digital economy has improved the quality of life and living standards of rural residents by providing better education, health care, and public services in rural areas. Second, the application of digital technology in agriculture, such as intelligent irrigation, precision fertilization, and crop monitoring, has also improved the efficiency and output of agricultural production and promoted the intelligence of agricultural production. Third, digital technologies can also be used in environmental monitoring, pollution control, and resource management to help rural areas achieve sustainable development and promote ecological and environmental protection. The development of sustainable villages, in turn, promotes the development of the digital economy. Sustainable rural development includes the improvement of the living conditions of rural residents, the improvement of agricultural production conditions, and the upgrading of the rural environment. First, the income level of rural residents increases, resulting in an increase in the demand for electronic products, digital services, and online shopping, thus expanding the market for the digital economy. Second, the digital transformation of rural areas can facilitate the promotion and application of digital technologies, including smart agricultural technology, telemedicine, online education, and other technologies, thereby providing opportunities to promote the further development of digital technologies. Third, education and training can cultivate talents with digital skills, supply intellectual support for rural development, supply digital technical talents, and lay a solid foundation for the development of the digital economy.

3. Index System, Evaluation Methods, Research Area, and Data Source

3.1. Index System

3.1.1. Digital Economy

Based on the above analysis, this study develops a digital economy evaluation system from the three aspects of digital infrastructure, digital-industry development, and digital-innovation level, fully incorporating previous research results [35,41], and selects a total of 15 indicators. The specific indicators are presented in Table 1.
In the table, “+” represents a positive indicator, indicating that when the value of an indicator gradually increases, it positively impacts the development of the digital economy. The weight of each indicator of the digital economy is calculated using the entropy method, and the sum of the weights of the 15 indicators is 1. The weight of each indicator reflects its influence on the comprehensive evaluation system of the digital economy. The weight of income from the technology market as a percentage of GDP is the largest, indicating that this indicator has the highest impact on the comprehensive evaluation system of the digital economy.

3.1.2. Sustainable Rural Development

Based on the above analysis, this study develops an evaluation system for sustainable rural development from three aspects: the living conditions of rural residents, the level of agricultural production, and the level of rural environment. The study fully incorporates previous research results [42,43] and selects 27 indicators. The specific indicators are presented in Table 2.
In the table, “+” represent the same meanings as those in Table 1. “−” represents a negative indicator, indicating that when the value of an indicator gradually decreases, it positively impacts the sustainable rural development. The weight of each indicator of sustainable rural development is also calculated using the entropy method, and the sum of the weights of the 27 indicators is also 1. The weight of the living sewage treatment rate is the largest, indicating that this indicator has the highest influence on the comprehensive evaluation system of sustainable rural development.

3.2. Evaluation Methods

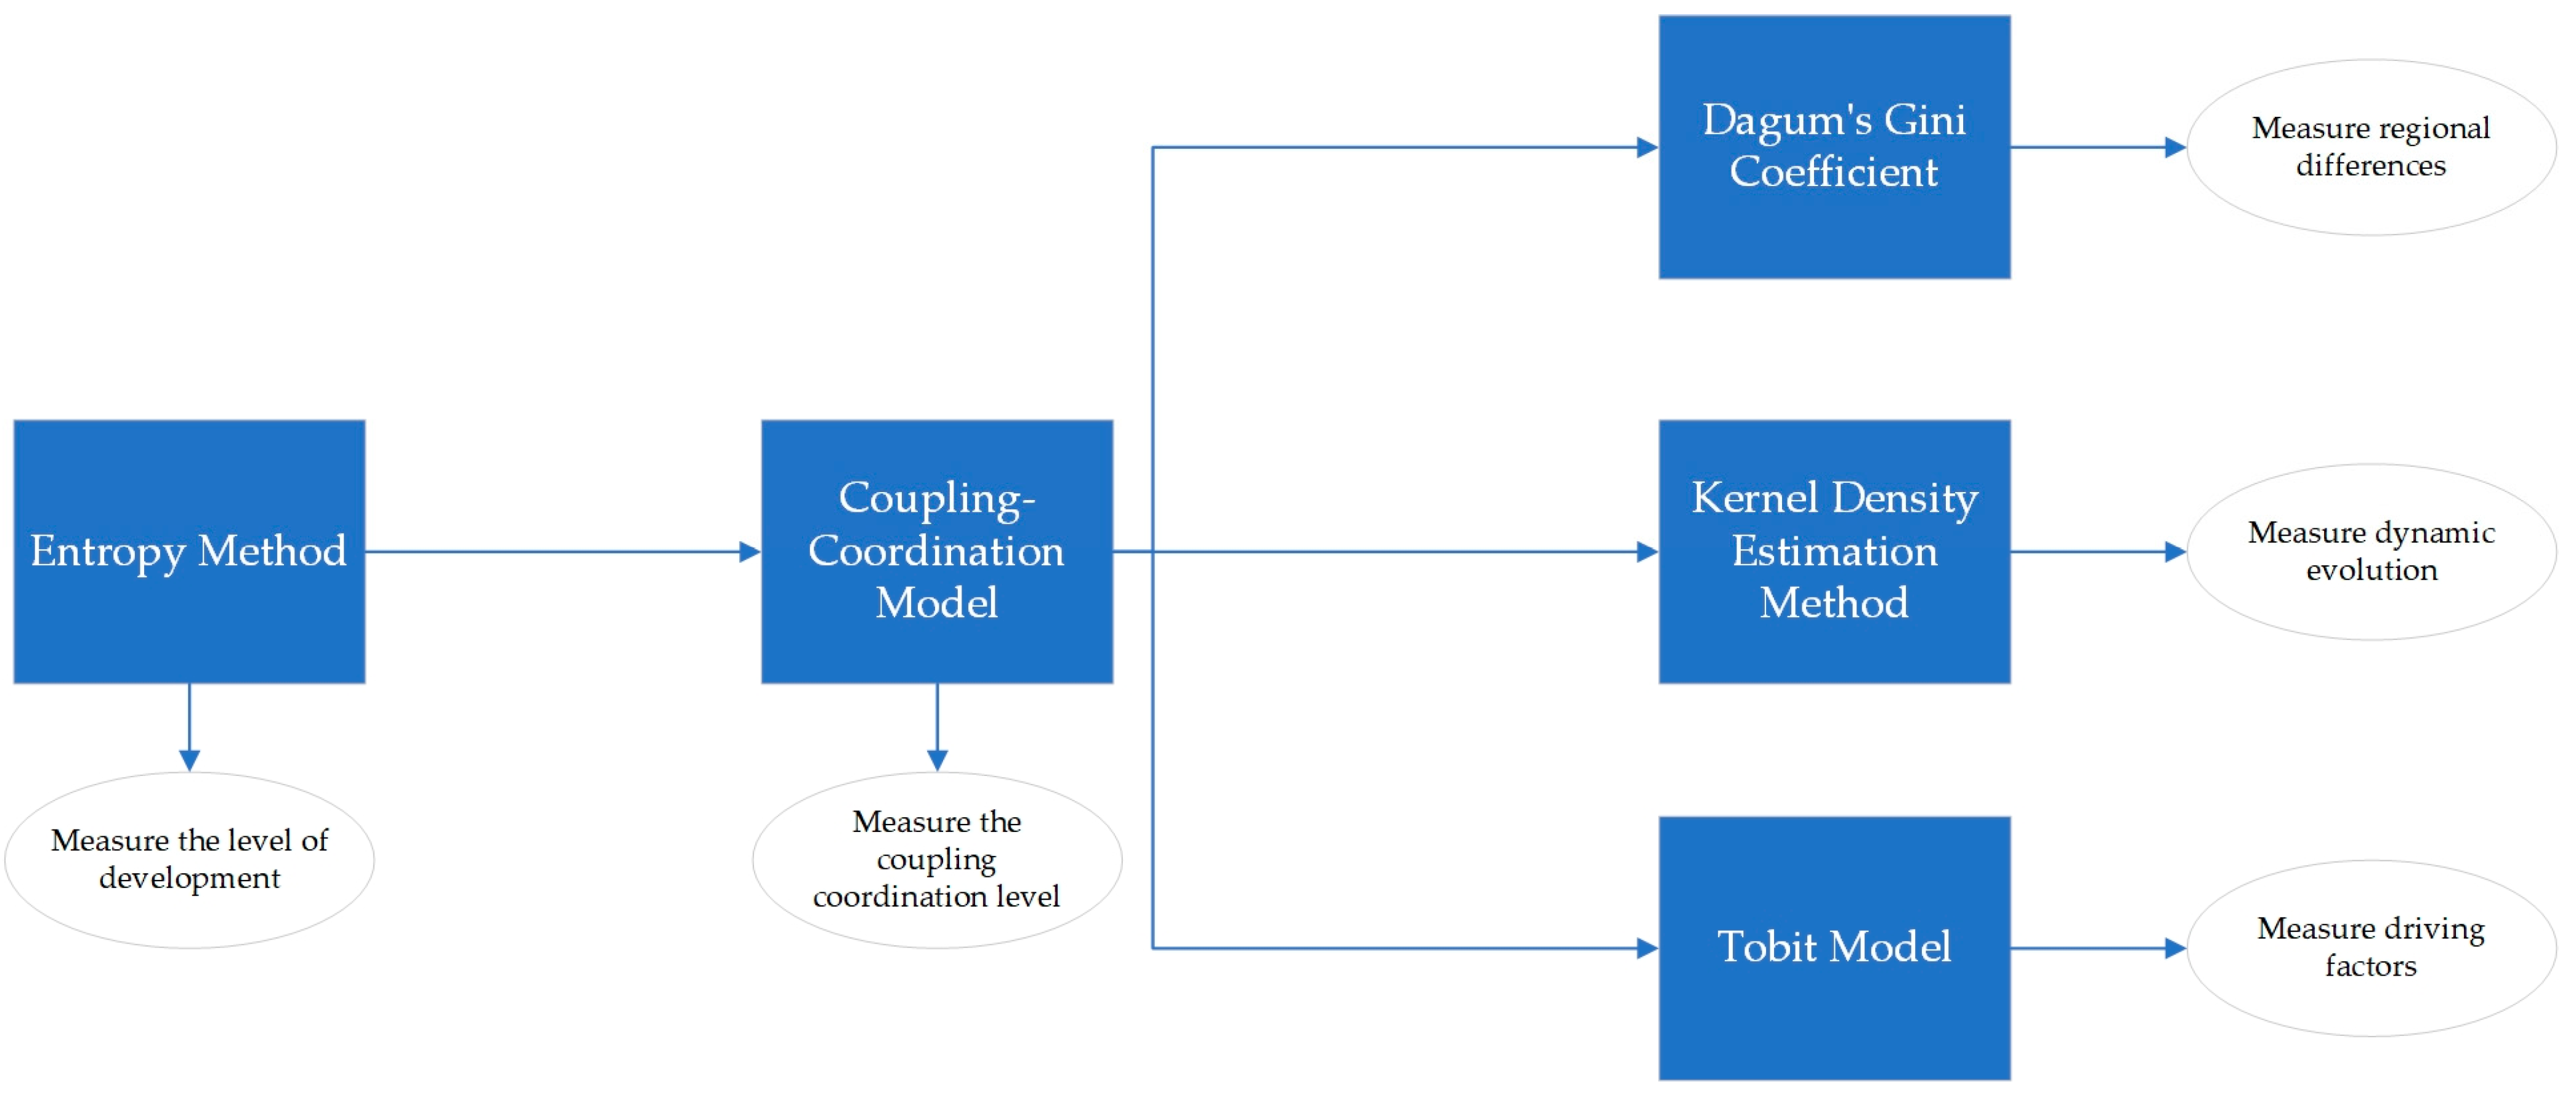
Based on the previous research, this paper utilizes the entropy method, the coupling–coordination model, the Dagum Gini coefficient, kernel density estimation, and the Tobit model to analyze the digital economy and sustainable rural development. The relationship between the various methods is shown in Figure 2.
The relationship between the methods and the model is illustrated in Figure 2. First, the level of development is measured by the entropy method, which provides basic data to be input into the coupled–coordination model. Second, the index of the coupling–coordination degree is measured by the coupling–coordination model. Third, using the Dagum Gini coefficient, kernel density estimation method, and Tobit model, respectively, we analyze the three dimensions of regional differences, dynamic evolution, and driving factors in depth.

3.2.1. Entropy Method

The concept of entropy is primarily applied to thermodynamics. In 1965, Zadeh first utilized the concept of entropy in analysis and decision-making [44]. The entropy method can objectively assign weights to indicators based on the amount of information. It has the effect of eliminating subjective factors [45]. To make the research more objective, the entropy method is adopted to measure and evaluate the levels of China’s digital economy and sustainable rural development. The specific steps are as follows:
1.
Data standardization
Given the different measurement units of the original evaluation data, it is necessary to employ the range method to standardize each indicator, utilize different calculation formulas for positive and negative indicators, perform non-negative processing on the standardized values, and uniformly add 0.001.
y i j = x i j min x i j m a x x i j min x i j + 0.001
y i j = m a x x i j x i j m a x x i j m i n x i j + 0.001
2.
Entropy calculation
p i j = y i j i = 1 m y i j
e j = 1 l n m i = 1 m p i j l n p i j
3.
Weight calculation
g i = 1 e j
w j = g j j = 1 m g j
4.
Evaluation index calculation
D j = j = 1 m w j × p i j
R j = j = 1 m w j × p i j
In this context, D j and R j , respectively, represent the development levels of the digital economy and sustainable rural development.

3.2.2. Coupling–Coordination Model

The concept of coupled coordination originates from physics and characterizes the degree of influence when two or more systems interact [37]. To explore the relationship between the digital economy and sustainable rural development, this study draws on the practices of noted scholars and employs the coupling–coordination model to analyze this relationship [46]. The specific calculation method is as follows:
C = 2 × D j × R j ( D j + R j ) 2
T = α D j + β R j , α + β = 1
D = C × T
In this context, C represents the degree of interaction between the digital economy and rural sustainable development subsystems. The coupling–coordination index D represents the effect of the overall coordinated development between the digital economy and rural sustainable development subsystems. Referencing the classifications of the coupling–coordination level by noted scholars, the coupling–coordination degree is divided into ten continuous coordination intervals [33], as depicted in Table 3.

3.2.3. Dagum Gini Coefficient

The Dagum Gini coefficient, first proposed by Argentine economist Camilo Dagum in 1980, is primarily used to measure income or wealth distribution inequality [47]. It is now also widely used to examine regional development disparities. Analyzing the Gini coefficient across different regions reveals regional development disparities and provides a basis for policymakers. Therefore, this study, referencing the work of noted scholars, decomposes the Gini coefficient into three components: intra-regional gap contribution, inter-regional gap contribution, and super-variable density contribution [48]. The specific calculation method is as follows:
G = 1 2 n 2 y ¯ j = 1 k h = 1 k i = 1 n j r = 1 n k | y j i y h r |
G j j = 1 2 n j 2 y ¯ i = 1 n j r = 1 n j | y j i y h r |
G j h = 1 n j n h ( y ¯ j + y ¯ h ) i = 1 n j r = 1 n j | y j i y h r |
G w = j = 1 k G j j p j s j
G n b = j = 2 k h = 1 j 1 G j h ( p j s h ) D j h
G t = j = 2 k h = 1 j 1 G j h ( p j s h ) ( 1 D j h )
In this context, G represents the overall Gini coefficient, G j j is the regional Gini coefficient, G j h is the inter-regional Gini coefficient, and G w represents the differences in the coupled and coordinated development levels of provinces within the region. G n b represents the differences in the level of coordinated development among the three regions. G t represents the degree of cross-influence in the coupling–coordination development level among the three regions.

3.2.4. Kernel Density Estimation Method

Kernel density estimation, first proposed by Rosenblatt in 1956, is primarily used to estimate unknown density functions in probability theory [49]. The density of each point within the variable range is estimated by summing the kernel function applied to each observation around that point [50]. Therefore, this study employs kernel density estimation to further analyze the absolute difference, change trend, ductility, and polarization trend in the coupling–coordination level between the digital economy and rural sustainable development. The following assumptions are posited for the density function of the coupling–coordination development level:
f ( x ) = 1 n h i = 1 n k ( x x i h )
k ( u ) = 1 2 π e x p ( u 2 2 )
In this context, n represents the total number of observations, x denotes observations that are independent and identically distributed, x i signifies the mean of all observations, and k u is the kernel density function.

3.2.5. Tobit Model

The Tobit model, an econometric model proposed by economist James Tobin in 1958, is primarily used to address statistical analysis issues in cases of truncated data [51]. It features two main characteristics: the choice equation model, which represents constraint conditions, and the variable equation model, applicable under continuous constraints [36]. The coupled–cooperative development level of the digital economy and sustainable rural development exhibits a random distribution with values ranging only between 0 and 1, making the Tobit model suitable for analysis. The specific formula is as follows:
y i t = α + β x i t + u i + ε i t , y i t > 0 0 , y i t 0
In this context, y i t represents the restricted dependent variable, x i t denotes the independent variable, α signifies the intercept term, β represents the regression parameter value, u i stands for individual effect, and ε i t denotes the random error term.

3.3. Research Area and Data Source

3.3.1. Research Area

Utilizing data spanning from 2013 to 2022 regarding China’s digital economy and sustainable rural development, this study encompasses 30 provinces (including municipalities directly under the Central Government and autonomous regions) in China. Owing to missing data from Hong Kong, Macao, Taiwan, and Tibet, these four provinces are excluded from the research area. To further explore developmental disparities between regions, this study adopted the regional classification system utilized by the National Bureau of Statistics of China: Beijing, Tianjin, Hebei, Liaoning, Shanghai, Jiangsu, Zhejiang, Fujian, Shandong, Guangdong, and Hainan were categorized as eastern regions. Shanxi, Inner Mongolia, Jilin, Heilongjiang, Anhui, Jiangxi, Henan, Hubei, and Hunan were classified as central regions. Guangxi, Chongqing, Sichuan, Guizhou, Yunnan, Shaanxi, Gansu, Qinghai, Ningxia, and Xinjiang were designated as western regions.

3.3.2. Data Source

The main sources of data are the China Statistical Yearbook, the China Rural Statistical Yearbook, the China Science and Technology Statistical Yearbook, the China Population and Employment Statistical Yearbook, the Survey Yearbook, the Statistical Bulletin of National Economic and Social Development, China’s economic and social Big Data Research Platform, and the Peking University Digital Financial Inclusion Index. Some missing data were supplemented by interpolation.

4. Empirical Results and Analysis

4.1. Measurement of the Digital Economy and Sustainable Rural Development Level

4.1.1. Digital Economy

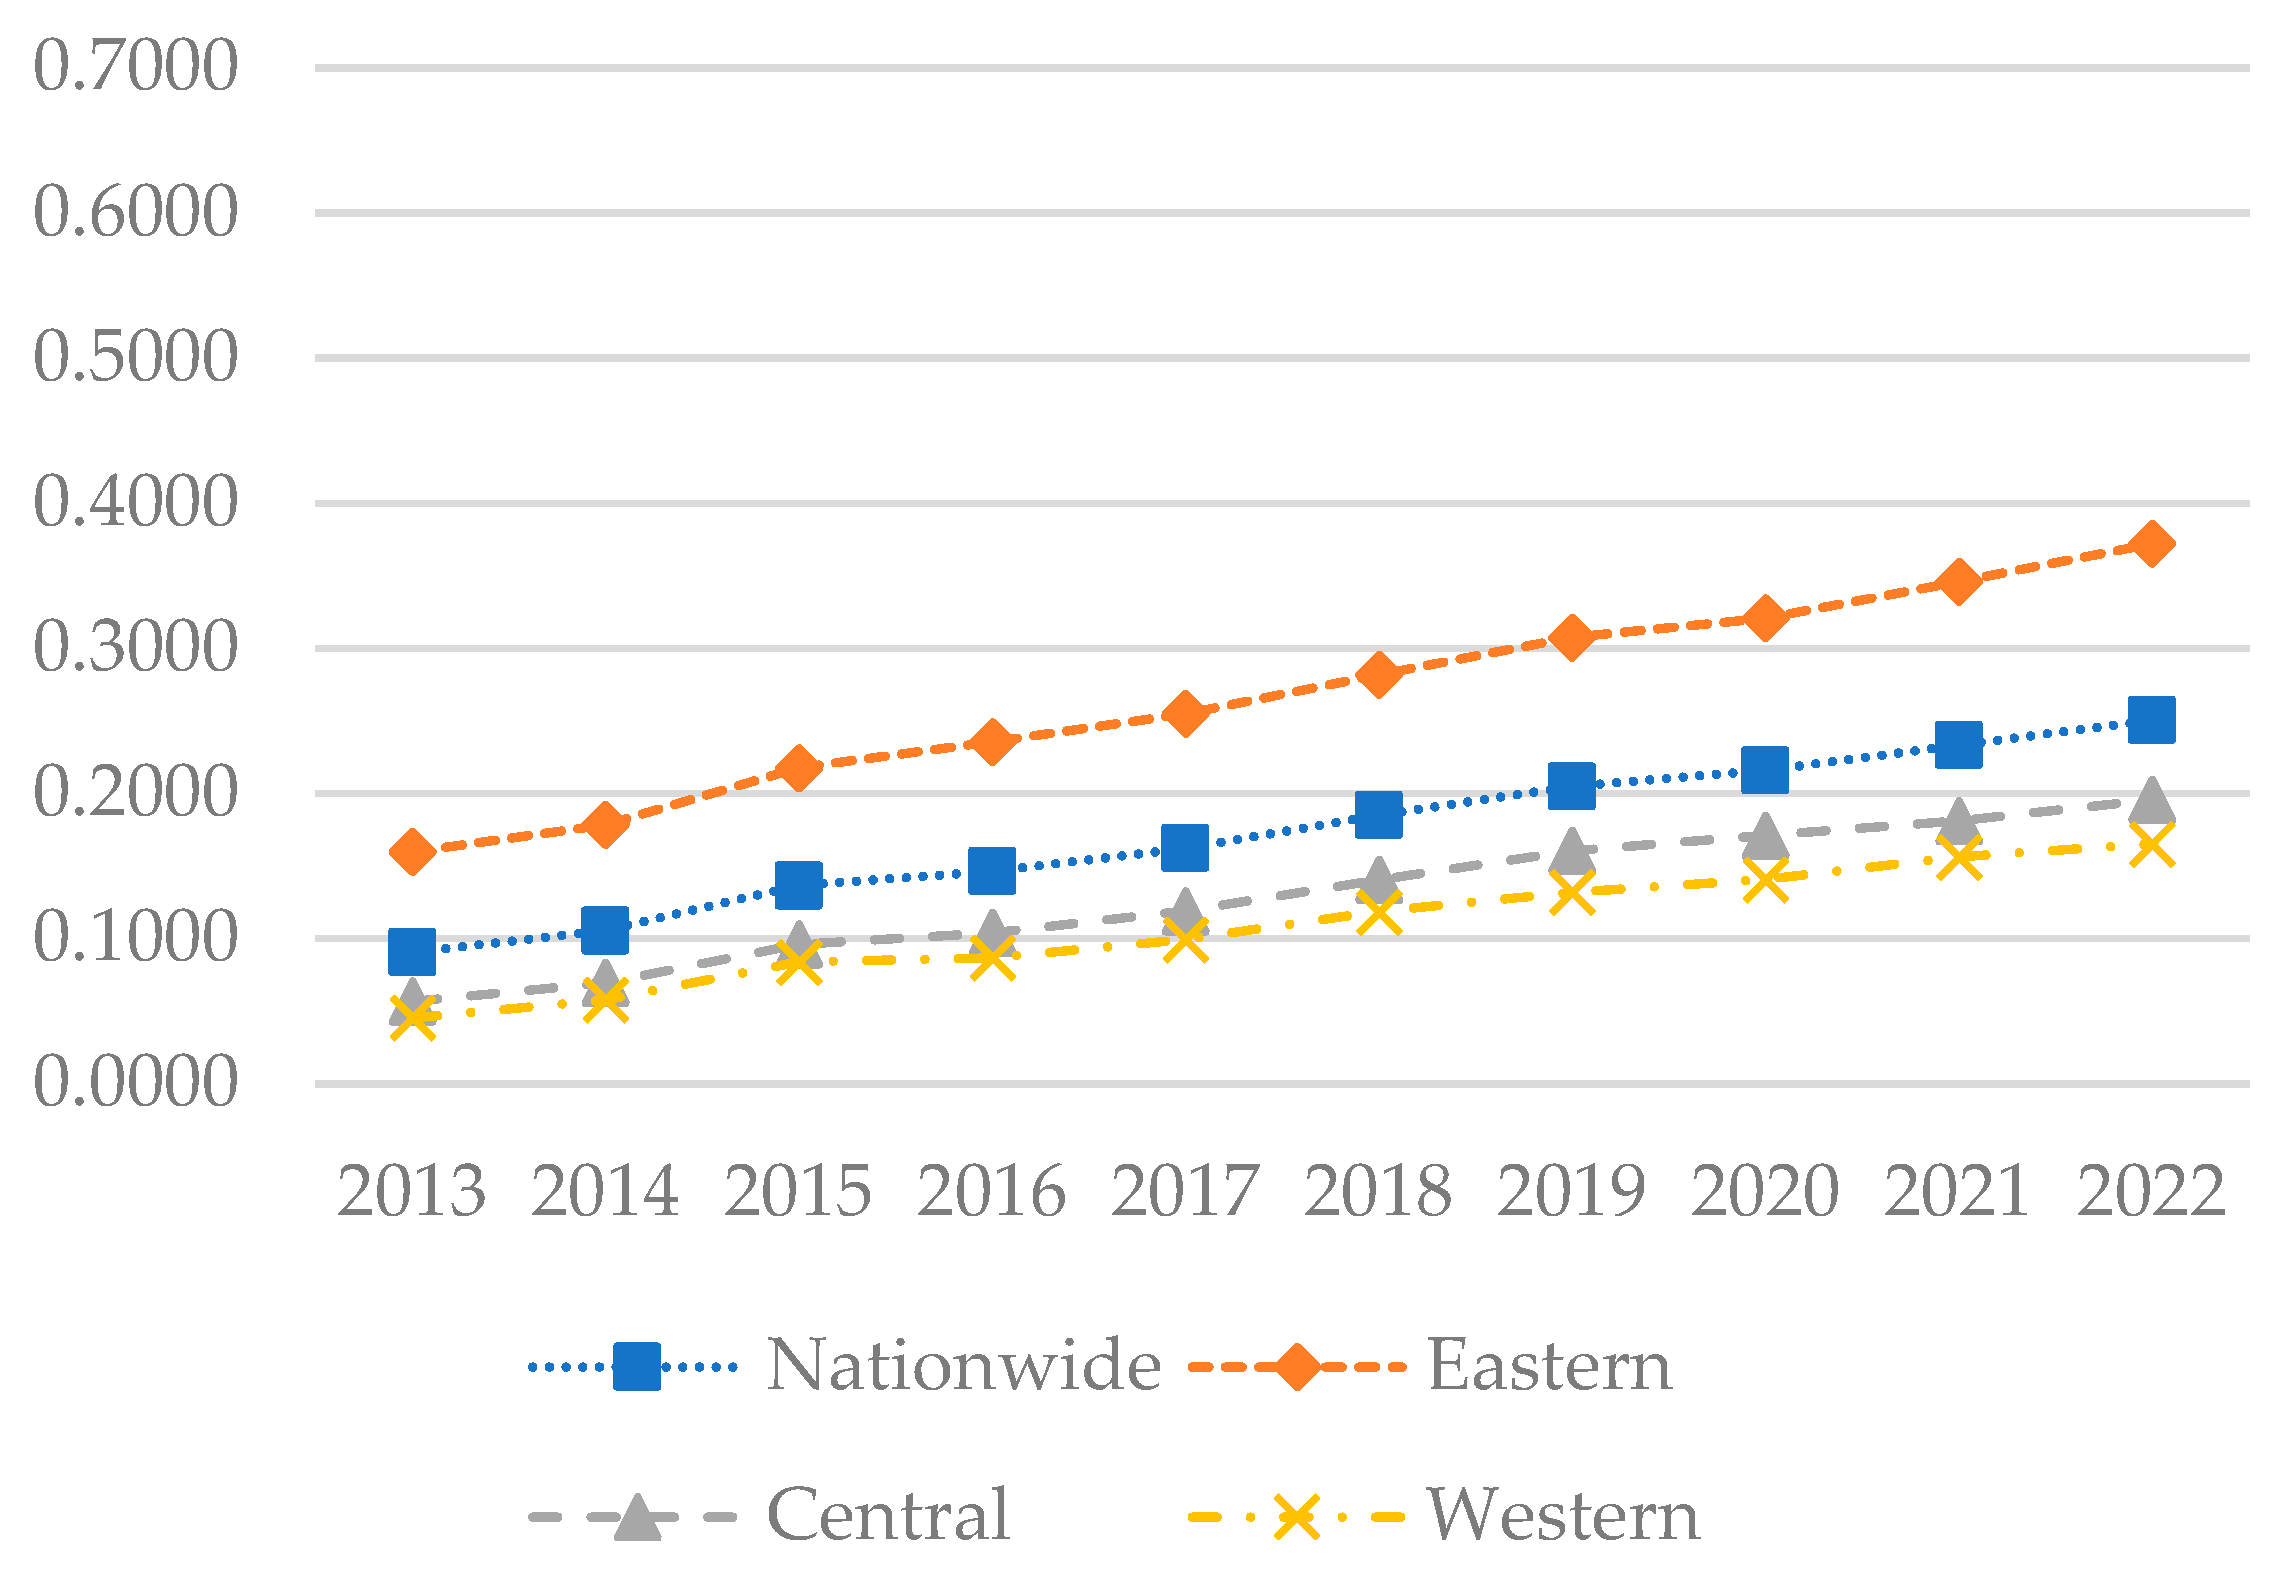
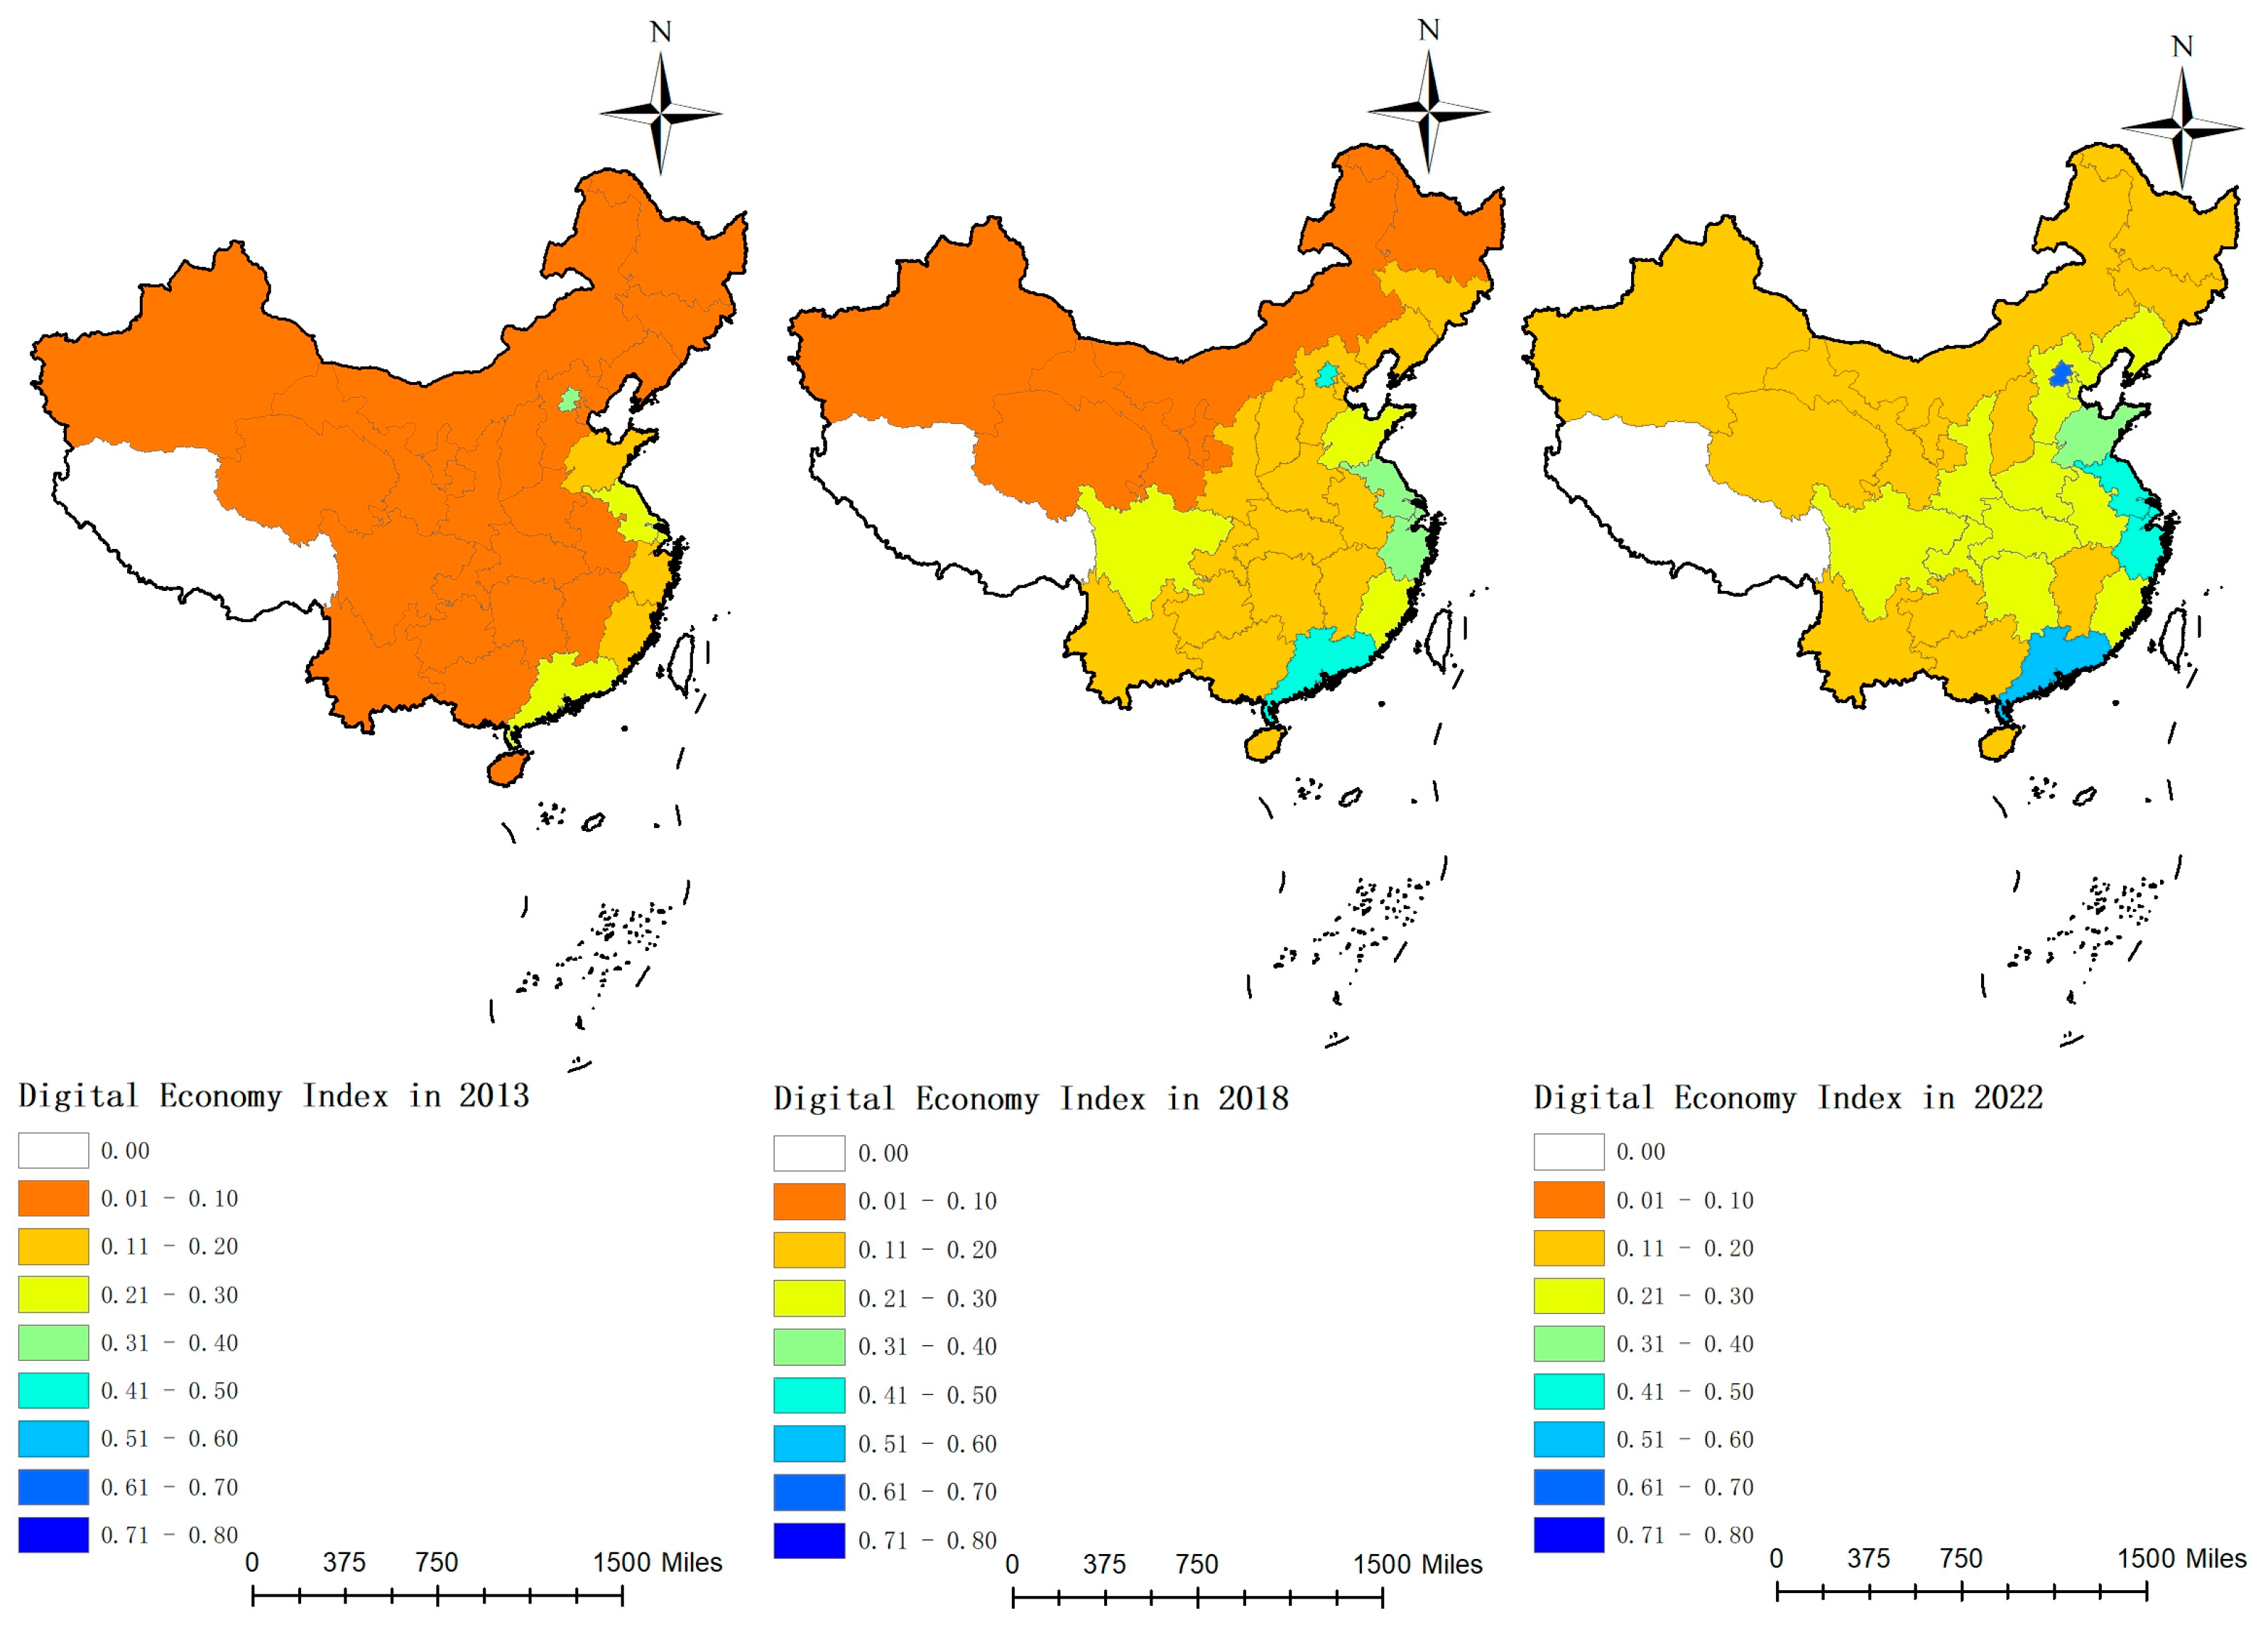
By constructing a comprehensive evaluation index system for the digital economy and employing the entropy method for calculation, this study assessed the overall development level of China’s digital economy from 2013 to 2022. The results are presented in Figure 3 and were visually analyzed using ArcGIS 10.8.1 for the years 2013, 2018, and 2022, as depicted in Figure 4.
Figure 3 illustrates that the national development index steadily increased during the sample period, from 0.0907 to 0.2504, indicating an improvement in the national digital economy. The development index in the eastern region exhibited rapid growth, from 0.1599 to 0.3723, surpassing other regions. Although growth in the central region was slower, it demonstrated an upward trend, increasing from 0.0566 to 0.1958. The western region, which had the lowest development index, increased from 0.0453 to 0.1654. Figure 4 indicates that in 2013, the digital economy development level was low across most areas, predominantly within the 0.0 to 0.1 range, reflecting China’s initially weak digital foundation. By 2018, the digital economy index had improved significantly, with development levels primarily in the 0.1 to 0.2 range. By 2022, the development level had further increased, particularly in the eastern region, where Beijing, Jiangsu, Shanghai, Zhejiang, and Guangdong exhibited digital economy development levels exceeding 0.4. Currently, the eastern region maintains a solid digital economy foundation, with most provinces now recording indices in the 0.4 to 0.6 range. The digital economy development levels in the central and western regions remain lower, with most provinces recording indices in the 0.1 to 0.3 range.
Since the introduction of the “Digital China” initiative in 2017, continuous digital upgrading and transformation of traditional industries have driven the rapid development of the digital economy, although significant regional imbalances persist. The eastern region, characterized by a solid economic foundation, comprehensive digital infrastructure, and an open market environment, enjoys a significant advantage in digital economy development. In contrast, the central and western regions, with their relatively weak digital infrastructure, are generally lagging behind. To foster the digital economy in these regions, macroeconomic control measures should be implemented to integrate these areas into the national digital development trajectory and facilitate the transfer of resources from the eastern to the central and western regions.

4.1.2. Sustainable Rural Development

By developing a sustainable rural development evaluation index system and employing the entropy method for calculation, this study assessed the level of sustainable rural development in China from 2013 to 2022. The results are presented in Figure 5 and were visually analyzed using ArcGIS 10.8.1 for the years 2013, 2018, and 2022, as illustrated in Figure 6.
Figure 5 illustrates that during the sample period, the national rural sustainable development index rose from 0.2511 to 0.4876. In the eastern region, this index climbed from 0.3292 to 0.5716, surpassing the national average and underscoring its leadership. Meanwhile, the central and western regions are experiencing slow but steady growth, with respective indices rising from 0.2199 to 0.4572 and from 0.1934 to 0.4225. Figure 6 reveals that in 2013, the rural development index was generally low across China, particularly in the western region, where indices predominantly ranged from 0.1 to 0.3. By 2018, rural development indices across all regions had improved significantly, particularly in several eastern provinces. In these provinces, the indices ranged from 0.5 to 0.6. In the central region, the development level primarily falls between 0.3 and 0.5. Meanwhile, the western region exhibits relatively lower levels of development, mainly concentrated between 0.2 and 0.4. By 2022, most eastern provinces recorded indices between 0.5 and 0.6, with some exceeding 0.6, including Beijing, Tianjin, and Zhejiang. The central region generally posted indices between 0.4 and 0.5. In the western region, although generally lower, indices in areas like Chongqing also reached 0.4 to 0.5.
In summary, following the implementation of the “Rural Revitalization” strategy, China’s rural sustainable development level has consistently improved year over year. By promoting the integration of urban and rural development and fostering rural specialty industries, there has been significant advancement in rural economic and social development. However, regional imbalances in development persist, with the eastern region outperforming others, while the western region, despite improvements, continues to grow at a slower rate than other regions. This disparity is primarily attributed to the economic development, industrial foundation, external investment, and infrastructure advantages in the eastern region. the central region benefits from its geographical position bridging the east and west, along with a relatively robust industrial foundation. Simultaneously, owing to poor natural conditions, inadequate infrastructure, and limited resources, the developmental level of the western region trails behind that of other regions. Hence, the western region may need to enhance policy support and allocate resources more effectively in the future to expedite its development.

4.2. Measurement of Coupling–Coordination Level

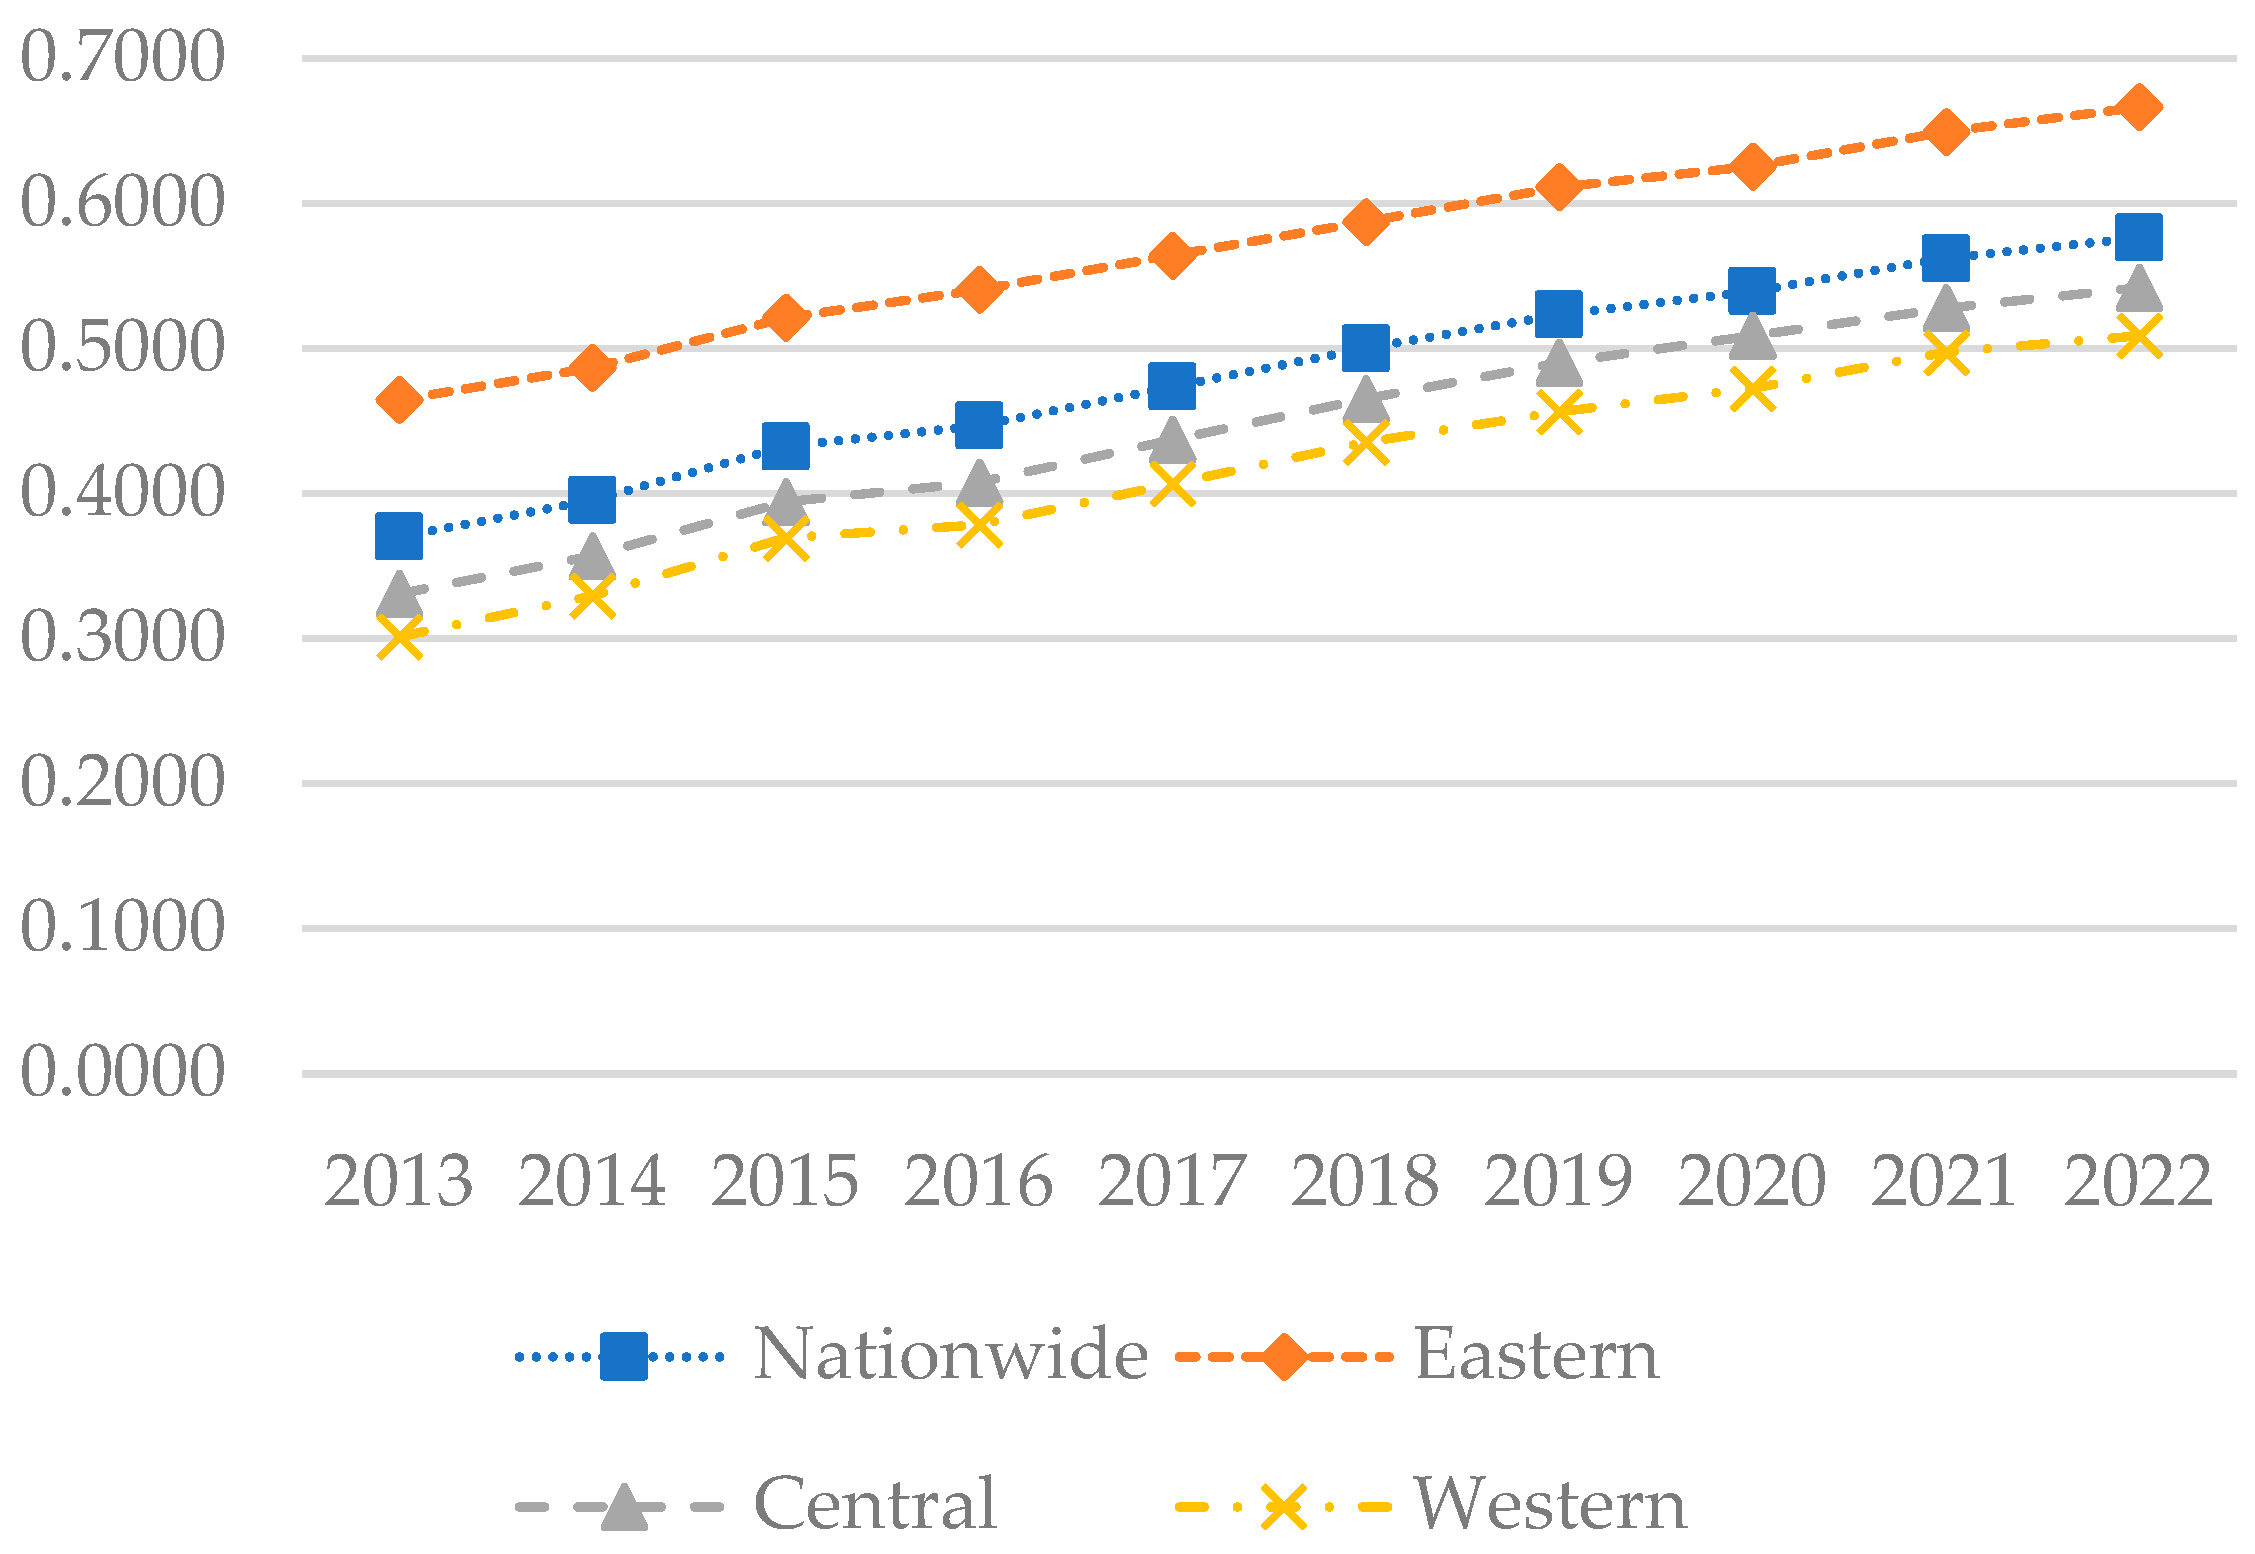
This study employs a coupling–coordination model to calculate the coupling–coordination degree between the digital economy and rural sustainable development. The results are presented in Figure 7 and were visually analyzed using ArcGIS 10.8.1 for the years 2013, 2018, and 2022, as depicted in Figure 8.
Figure 7 illustrates that during the sample period, the national coupling–coordination degree between the digital economy and rural sustainable development increased from 0.3700 to 0.5765, representing a gradual transition from a mildly uncoordinated state to a state of barely coordinated. In the eastern region, the coupling–coordination degree increased from 0.4646 to 0.6663, indicating a shift from near discoordination to primary coordination, likely attributable to the region’s higher level of economic development, substantial investment, and comprehensive infrastructure. Figure 8 indicates that in 2013, the coupling–coordination degree was generally low across most areas of China, concentrated mainly in the 0.3 to 0.4 range. However, the eastern coastal areas exhibited a higher coordination level, primarily ranging between 0.4 and 0.6, particularly in cities like Beijing, Shanghai, Jiangsu, and Zhejiang, where indices exceeded 0.5. By 2018, coordination in the eastern region had further strengthened, with most provinces ranging between 0.5 and 0.6. Similarly, in the central regions such as Henan and Hubei, and in the western regions like Sichuan and Chongqing, indices had also improved, also falling within the 0.5 to 0.6 range. By 2022, coupling–coordination indices had generally increased across all regions, with all provinces exceeding 0.4. In the eastern region, most provinces ranged between 0.6 and 0.8, while in the central region, most fell within the 0.5 to 0.6 range, and in the western region, most provinces were situated in the 0.4 to 0.6 range.
Overall, the coupling–coordination degree has generally increased, indicating a broader balance and coordination across economic, environmental, and social development. The eastern region, owing to its economic policy and geographical and market advantages, has consistently maintained a high coupling–coordination index, particularly evident in the economically developed coastal provinces. The central and western regions, albeit relatively lagging due to rural population outflow, weak economic foundations, and insufficient digital infrastructure, have nonetheless experienced rapid development following the implementation of the “Rural Revitalization” strategy in 2018.

4.3. Measurement of Regional Differences

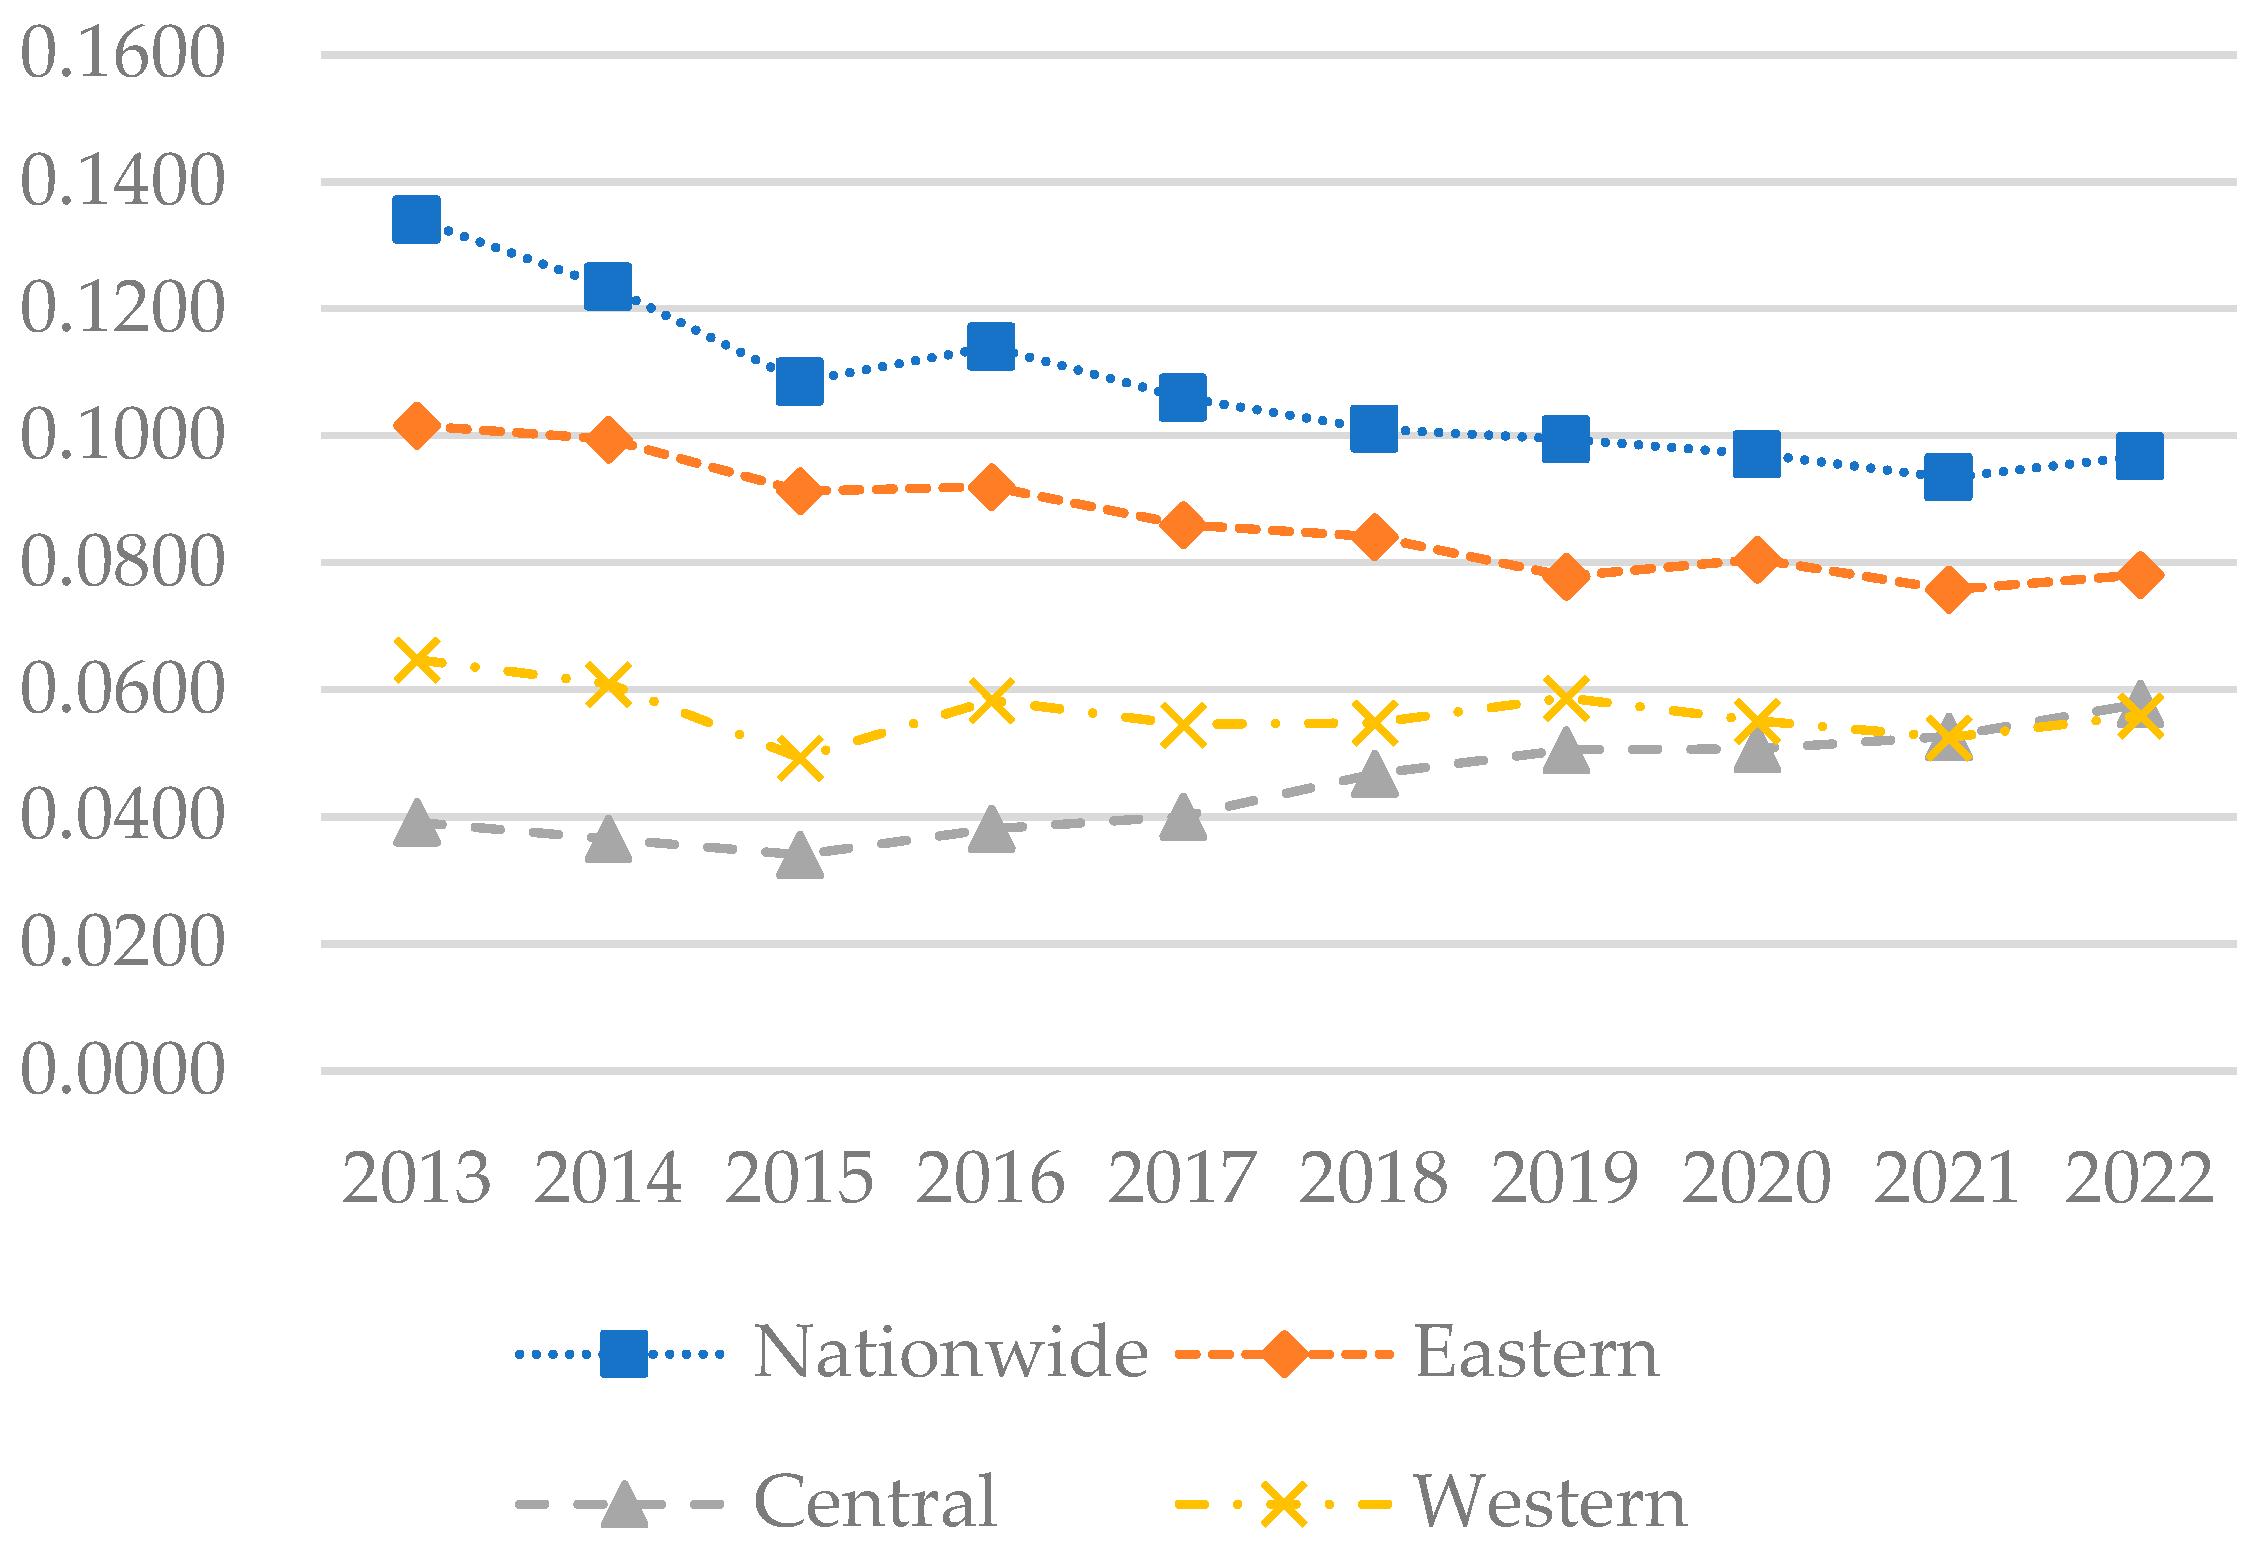
To further investigate the disparities in coupling–coordination development among different regions and their underlying causes, this study employs the Dagum Gini coefficient to analyze the coupling–coordination index. The analysis results are presented in Figure 9, Figure 10 and Figure 11.

4.3.1. Intra-Regional Disparities

From Figure 9, it is evident that the national Gini coefficient is gradually decreasing, suggesting that the overall disparity in coupled and coordinated development is narrowing. The Gini coefficients in the eastern and western regions have slightly decreased, suggesting that disparities in the level of coupling coordination within these regions have narrowed. However, since 2015, the Gini coefficient in the central region has exhibited an upward trend, indicating an increase in the internal disparities of coupled and coordinated development within the region. However, the Gini coefficient generally remains higher in the eastern region than in the Midwest. This disparity may arise from the stronger economic capabilities of provinces such as Shanghai, Beijing, Guangdong, Zhejiang, and Jiangsu, which have seen more significant development in the digital economy and rural areas, leading to marked imbalances with other provinces in the region, such as Hebei and Hainan.

4.3.2. Inter-Regional Disparities

Figure 10 illustrates that the Gini coefficients between the eastern and central, eastern and western, and central and western regions exhibit a gradually decreasing trend, suggesting that disparities in coupling and coordinated development between these regions are narrowing. However, the Gini coefficient remains highest between the eastern and western regions, indicating a significantly higher level of coupling coordination in the eastern region compared to the western, which underscores pronounced regional development disparities. This gap is partly attributed to the western region’s catch-up, supported by national policies. The eastern region’s advantages in education, technology, capital, and finance substantially surpass those of the western region in terms of digital economy and rural development. Conversely, the central and western regions display the lowest Gini coefficient, indicative of more similar economic development levels, potentially due to parallels in development strategies or industrial structures.

4.3.3. Sources and Contribution Rates of Disparities

Figure 11 demonstrates that inter-regional differences have been the primary driver of developmental disparities. The contribution of intra-regional disparities is relatively minor, suggesting more balanced development at smaller geographical scales, such as the provincial or municipal levels. Furthermore, the annual reduction in inter-regional disparities suggests that policy adjustments and resource allocation are effectively mitigating these disparities. Additionally, the modest contribution to the transfer intensity gap underscores the need for enhanced efforts to improve the efficiency and impact of resource transfers aimed at economically disadvantaged regions.

4.4. Dynamic Evolution Based on Kernel Density Estimation

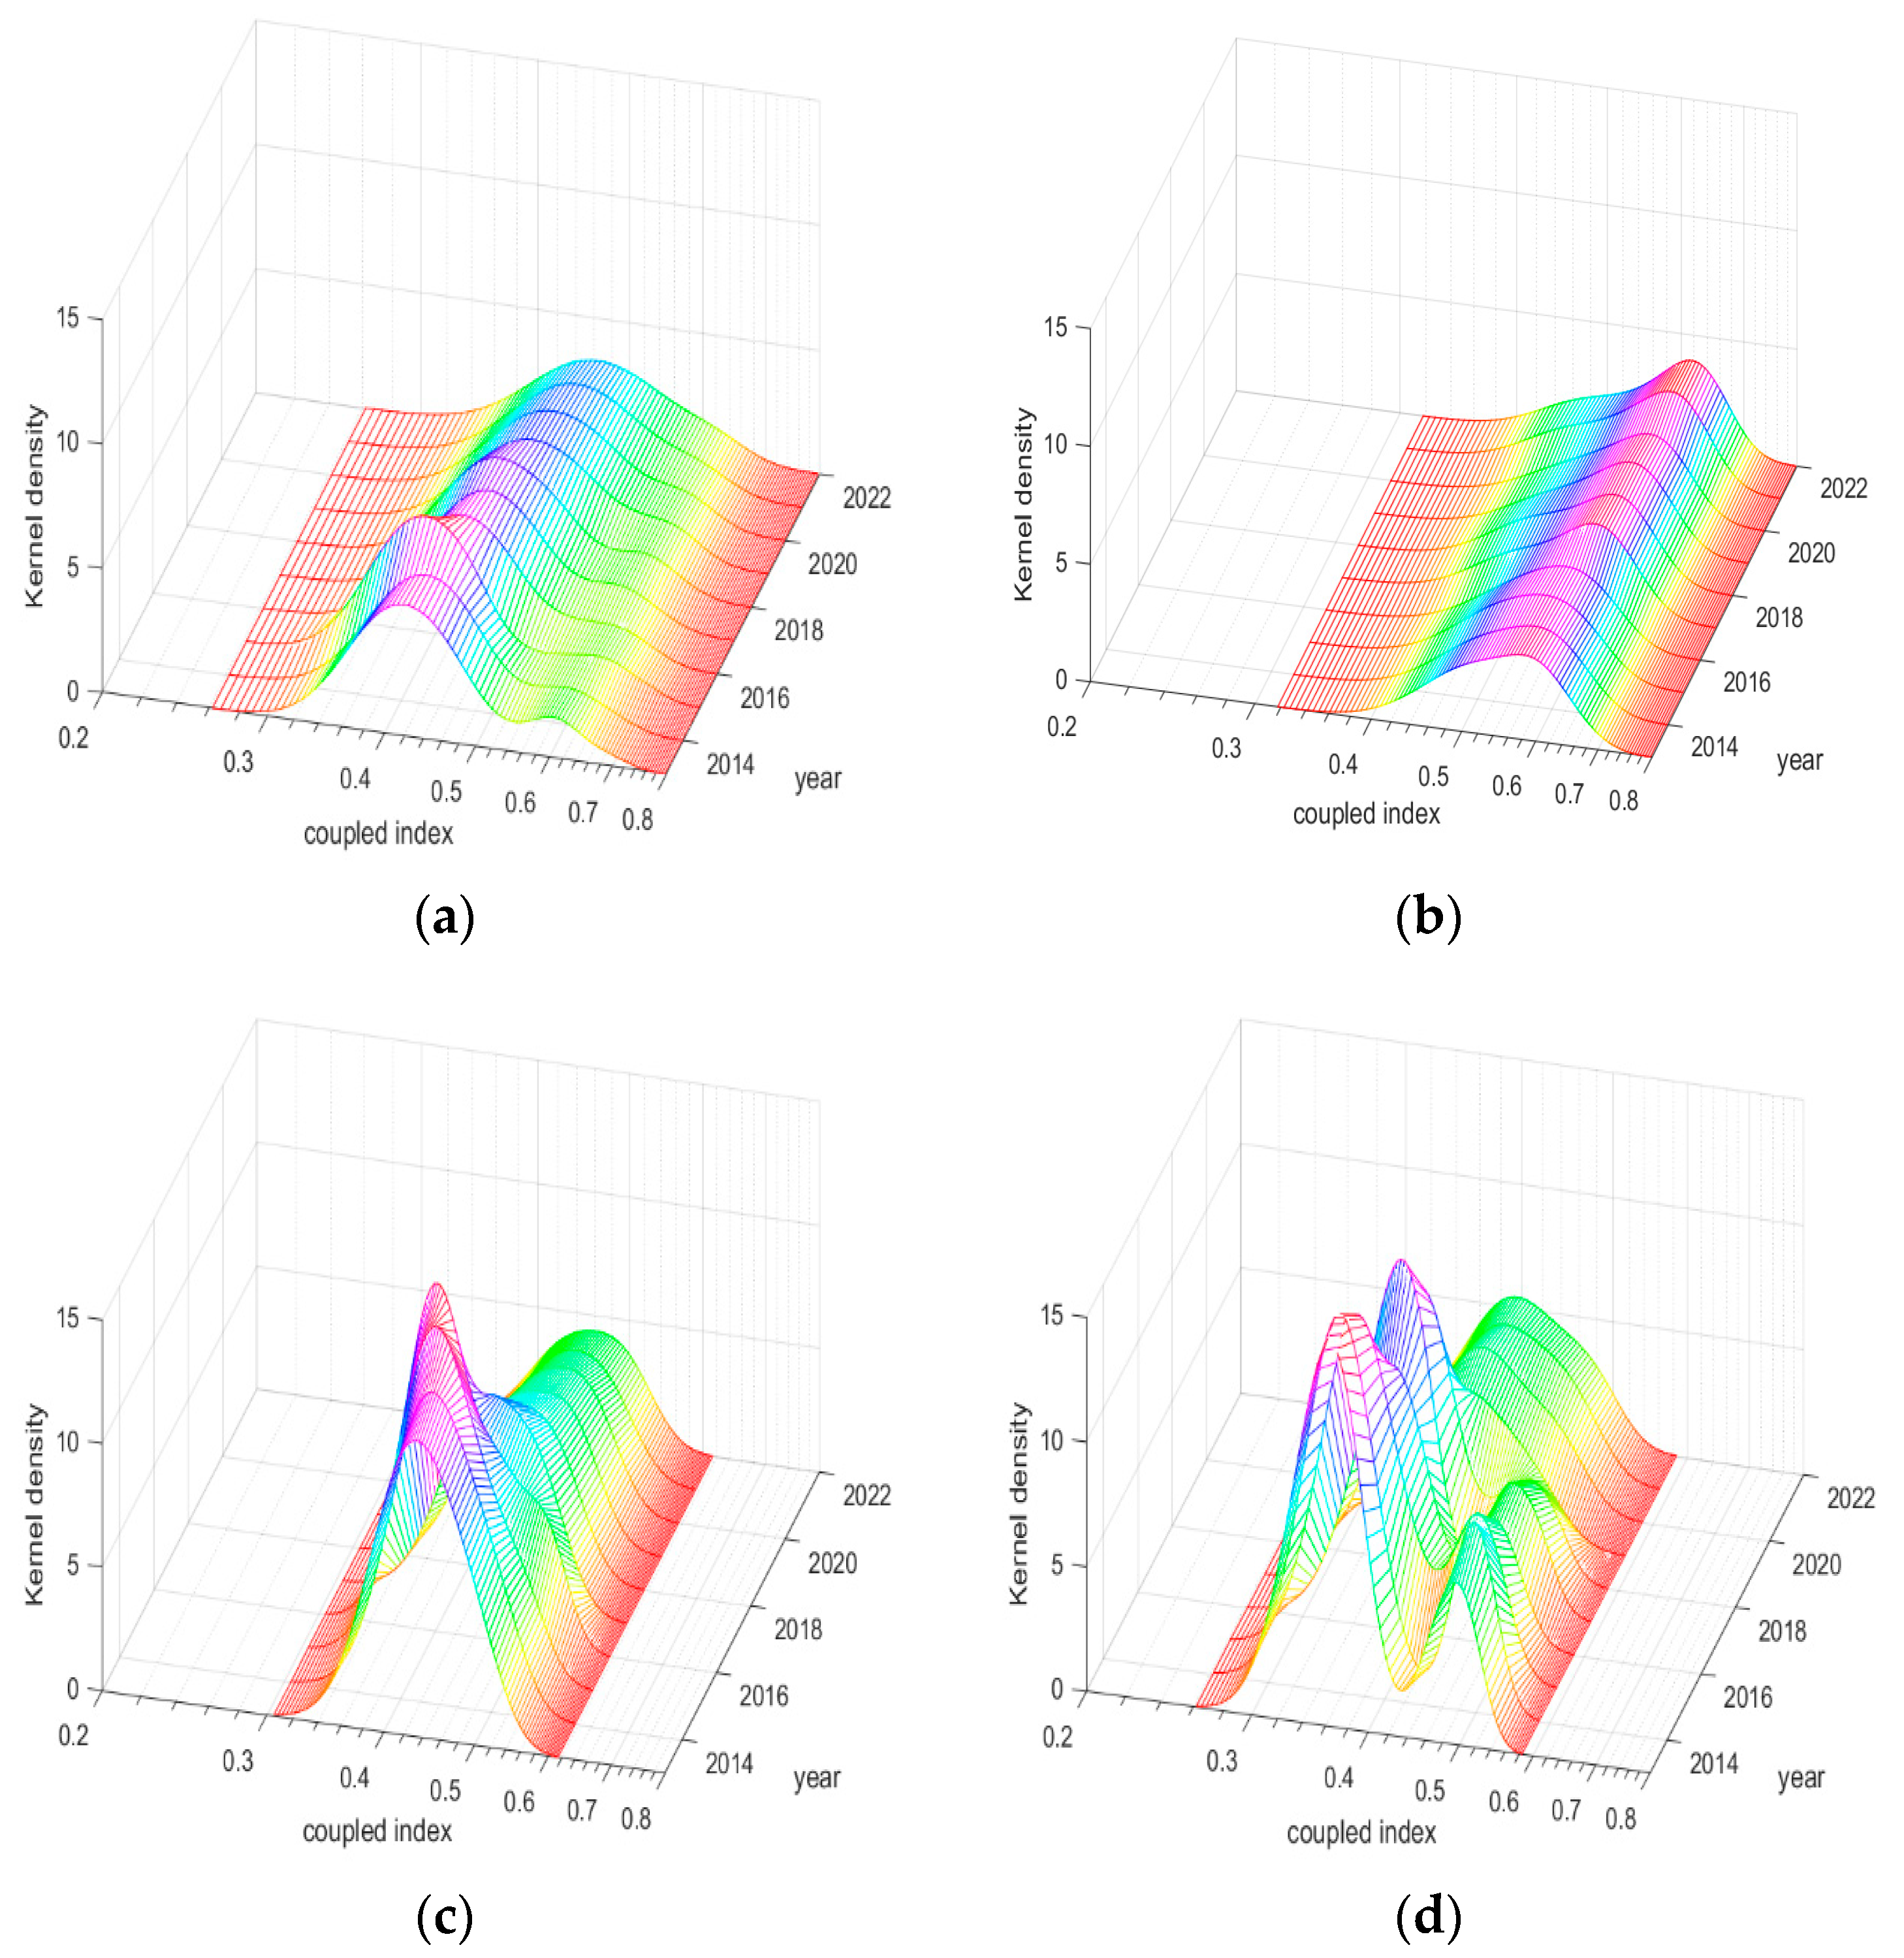
To gain deeper insights into the dynamic evolution of the coupling–coordination index, this study utilizes kernel density estimation for analysis. The analysis results are presented in Figure 12.
As illustrated in Figure 12a, the principal peak of the national nuclear density curve shifts rightward, and the peak value rises from 0.45 to 0.50, indicating an overall increase in the coupling–coordination level. The peak height exhibits a pattern of increasing twice before decreasing, while the peak width expands, suggesting a decrease in the concentration of the coupling–coordination level and a potential widening of inter-provincial disparities. The “right tail drag” observed in the nuclear density curve suggests that high coupling–coordination levels persist in Beijing, Zhejiang, Jiangsu, and Guangzhou. Regarding polarization differences, the horizontal distribution of coupling coordination has transitioned from bimodal to unimodal, with polarization demonstrating a decreasing trend at a concentration of approximately 0.5.
Figure 12b reveals that the principal peak of the nuclear density curve in the eastern region shifts rightward, and the peak value increases from 0.5 to 0.65, signifying an enhancement in the coupling–coordination level. The peak height increases and the peak width narrows, indicating a rise in concentration and a reduction in intra-regional disparities. The “left tail drag” phenomenon suggests the continued presence of provinces with lower development levels, such as Hainan. Figure 12c shows that the main peak of the nuclear density curve in the central region shifts rightward, with the peak value increasing from 0.45 to 0.5. The peak height follows an “increase-increase-decrease” pattern, while the peak width alternates between narrowing and widening, suggesting a decrease in concentration and an increase in intra-regional disparities. Figure 12d indicates that the main peak of the nuclear density curve in the western region moves from 0.35 to 0.40, signifying an improvement in the coupling–coordination level. The peak height exhibits a decreasing-increasing-decreasing trend, and the peak width expands, indicating an increase in regional disparities and a decrease in concentration. Regarding polarization differences, the shift from a double peak to a single peak at a concentration of 0.4 suggests a gradual weakening of the polarization trend.

4.5. Analysis of Driving Factors

4.5.1. Model Specification

To deepen our understanding of the drivers influencing the sustainable development of China’s digital economy and rural areas. Informed by relevant research results [52,53], it designates the level of coupling coordination as the dependent variable and considers urbanization (Urb), industrial structure transformation (Ind), technological innovation (Tec), higher education (Edu), economic development (Eco), and government support (Gov) as explanatory variables. The variables are defined as follows: urbanization is quantified by the urban-to-total population ratio; industrial structure transformation by the tertiary industry’s added value relative to GDP; technological innovation by the number of patents granted per capita; higher education by the number of higher education students per capita; economic development by GDP per capita; and government support by the ratio of local fiscal expenditure to GDP. Details of the specific model and calculation method are provided below:
D i t = α 0 + α 1 l n u r b i t + α 2 l n i n d i t + α 3 l n t e c i t + α 4 l n e d u i t + α 5 l n e c o i t + α 6 l n g o v i t + ε i t
In this model, D i t represents the degree of coupling coordination between the digital economy and sustainable rural development. α represents the undetermined coefficient, and ε represents the random error term.

4.5.2. Descriptive Statistics

Table 4 displays the characteristics of the variable data utilized in this study, encompassing sample size (N), mean value (mean), standard deviation (SD), minimum value (Min), and maximum value (Max). Descriptive statistics reveal that the maximum, minimum, and standard deviation of the coupling–coordination level between China’s digital economy and sustainable rural development are 0.7976, 0.2622, and 0.1147, respectively, suggesting significant disparities in this coordination across various provinces. Regarding control variables, notable differences exist among provinces in urbanization, industrial structure, technological innovation, higher education, economic development, and government support. However, the standard deviation is small, indicating a degree of representativeness.

4.5.3. Relations Analysis

Drawing on the previous analysis, Figure 13 illustrates the relationship between the digital economy, sustainable rural development, and various driving factors. The figure illustrates that the digital economy and sustainable rural development mutually reinforce each other and evolve in an integrated manner. The advancement of the digital economy can foster sustainable rural development, and conversely, the progress of sustainable rural areas can stimulate the advancement of the digital economy. Urbanization, industrial structure transformation, technological innovation, education level, economic development, and government support constitute a dynamic, interdependent system, in which each factor influences the others, collectively propelling the digital economy and sustainable rural development.

4.5.4. Empirical Result Analysis

Based on the results of the previous analysis, the coupling–coordination level between the development of the digital economy and rural development exhibits regional disparities. Consequently, panel Tobit regressions were conducted separately for the national, eastern, central, and western regions. For the national level, the LR statistic is 507.36 with a p-value of less than 0.0001. For the eastern region, the LR statistic is 162.79 with a p-value of less than 0.0001. For the central region, the LR statistic is 104.47 with a p-value of less than 0.0001. For the western region, the LR statistic is 126.60 with a p-value of less than 0.0001. By analyzing the LR and p-values for each region, it is found that both strongly refute the null hypothesis associated with using the panel Tobit model. Consequently, this study adopts a random effects panel Tobit model for regression analysis, with the results detailed in Table 5.
Table 5 clearly indicates that multiple factors significantly influence the coupling coordination between the digital economy and sustainable rural development. From a national perspective, all factors significantly contribute to China, with the regression coefficients ranked as follows: technological innovation (9.1788) > level of urbanization (0.3309) > industrial structure transformation (0.2606) > education level (0.2339) > economic development (0.1802) > government support intensity (0.0873). From a regional perspective, urbanization significantly impacts the eastern (coefficient = 0.2536, p = 0.01), central (coefficient = 0.5162, p = 0.01), and western (coefficient = 0.3129, p = 0.05) regions, with the order of impact being central > western > eastern. Industrial structure significantly influences the eastern (coefficient = 0.1850, p = 0.01), central (coefficient = 0.2450, p = 0.01), and western (coefficient = 0.2536, p = 0.01) regions, with the impact order being western > central > eastern. Technological innovation significantly affects the eastern (coefficient = 8.0466, p = 0.01), central (coefficient = 23.2170, p = 0.01), and western (coefficient = 11.4974, p = 0.10) regions, with the impact order being central > western > eastern. Education level significantly impacts the eastern (coefficient = 0.5143, p = 0.01) and central (coefficient = 0.3025, p = 0.05) regions, but not the western region (coefficient = 0.0734, p > 0.10), with the impact order being eastern > central > western. Economic development significantly influences the eastern (coefficient = 0.1977, p = 0.01), central (coefficient = 0.1403, p = 0.01), and western (coefficient = 0.1720, p = 0.01) regions, with the impact order being eastern > western > central. Government support intensity significantly affects the eastern region (coefficient = 0.2335, p = 0.01), while showing a positive but nonsignificant correlation in the central and western regions.
Further analysis reveals the following key findings. First, urbanization positively influences the coupled and coordinated development of all regions, particularly the central and western regions. This indicates that promoting urbanization facilitates rural-to-urban migration, creating more job opportunities and improved living standards for farmers, consequently enhancing public services and production conditions in rural areas. Second, the significant positive effect of industrial upgrading, particularly in the central and western regions, underscores the effectiveness of optimizing and upgrading the industrial structure in facilitating the flow of technology, talent, and capital, thereby meeting the needs of digital economy development and stimulating overall regional economic growth. Third, technological advancement has the most substantial impact on each region, significantly promoting coupled and coordinated development, emphasizing the enhancement of technological capabilities and the development of high-tech industries in driving the digital transformation of regional industries and rural development. Fourth, the impact of education level is less significant in the western region, possibly due to significant brain drain and relatively low allocation of educational resources, which restricts the role of education in fostering local economic and technological advancement. Fifth, economic conditions significantly affect all regions, particularly the eastern and western regions, emphasizing the role of economic growth in raising household incomes and boosting demand for digital products, thus creating more opportunities for the digital economy and rural development. Sixth, government influence has a positive impact only on the eastern region, underscoring the necessity of establishing a comprehensive financial support mechanism for rural development on a stable financial foundation. Nevertheless, the absence of financial support in the midwest region has restricted this effect.
Overall, technology level, education, industrial upgrading, and urbanization are key drivers of coupling coordination between the digital economy and sustainable rural development.

5. Conclusions, Suggestions and Limitations

5.1. Conclusions

With the development of the digital economy, the relationship between sustainable development and the digital economy is increasingly close. The sustainable development of rural areas plays a vital role in regional economic development and social stability. Therefore, based on data concerning China’s digital economy and sustainable rural development from 2013 to 2022, this study utilizes the entropy method, coupled coordination model, Dagum’s Gini coefficient, kernel density estimation, and Tobit model to analyze their inter-relations. Subsequently, the study draws the following conclusions.
First, although the development of China’s digital economy has improved year by year, its overall level remains low. In regional comparisons, the eastern region is the most advanced, followed by the central region, with the western region significantly lagging behind. The development disparities between provinces are particularly noticeable; for example, both Beijing and Guangdong have development indices exceeding 0.6, while in the western regions such as Xinjiang, Qinghai, Gansu, and Ningxia, the indices are less than 0.2. In contrast, the improvement in China’s rural sustainable development is more pronounced, with its overall level higher than that of the digital economy. Although there are still development disparities between provinces, these disparities are relatively smaller compared to those in the digital economy. Regionally, the rural development index in the eastern coastal areas usually ranges from 0.6 to 0.7, while in the central and western regions, it ranges from 0.4 to 0.5, with some provinces even exceeding 0.5.
Second, the level of coupling and coordination between China’s digital economy and rural sustainable development is improving annually, but the imbalance in development between regions remains significant. The eastern region leads the nation in this aspect, with its level of coupling and coordination higher than that in the central and western regions. At the provincial level, the eastern provinces of Guangdong, Jiangsu, Beijing, and Zhejiang perform better, with their level of coupling and coordination reaching the intermediate level. In contrast, the western regions such as Gansu, Qinghai, Ningxia, and Xinjiang have lower levels of coupling and coordination, close to a state of imbalance.
Third, disparities in development among provinces persist, resulting in significant intra-regional and interregional imbalances. Regional disparities are the primary drivers of unbalanced development. Among these regional disparities, the contrast between the eastern and western regions is most pronounced, exhibiting a significant development imbalance, whereas the disparities in the central and western regions are comparatively minor.
Fourth, while the degree of coupling and coordination between China’s digital economy and sustainable rural development is increasing annually, the development gap between provinces and regions is also widening. Particularly in the eastern region, provinces such as Beijing, Zhejiang, Jiangsu, and Guangdong continue to lead as high-level coordination regions, surpassing Hainan and other provinces in terms of development level.
Fifth, factors such as urbanization, industrial structure transformation, technological innovation, higher educational, economic development, and government support significantly influence the coupling and coordination between China’s digital economy and sustainable rural development. However, the impact of these factors on the coupling and coordination development varies by region, with the effectiveness of their influence ranked from highest to lowest as follows: eastern, central, and western regions.

5.2. Suggestions

First, it is necessary to increase investment in digital-infrastructure construction in rural and remote areas, enhance Internet coverage and quality, and establish the foundation for the popularization of the digital economy and sustainable rural development.
Second, through the promotion and application of new technologies such as the Internet of Things, big data, and artificial intelligence in rural areas, especially in agricultural operation and management, resource monitoring, and disaster warning, a number of new forms of rural industries are cultivated and developed, promoting rural industrial integration and digital transformation.
Third, improve the system and mechanism for economically developed provinces to support less developed provinces, promote cross-regional support measures with enterprise cooperation as the main driving force, and encourage enterprises from high-tech regions to invest and start businesses in other regions. These measures will not only promote the sustainable development of the digital economy and rural areas but also narrow the development gap between regions.
Fourth, actively explore the establishment of a cross-regional and cross-platform industrial coordination development mechanism, promote exchanges between low-development and high-development areas, and build a sharing platform to support the exchange and sharing of data, resources, technology, and knowledge. This effort aims to promote the construction of industrial parks and guide the orderly transfer of industries.
Fifth, in areas dominated by high-tech industries, optimize and upgrade the industrial structure based on the development of digital industries, while actively promoting the application of digital technologies in agriculture and rural areas, including the combination of digital economy with traditional manufacturing and service industries to create new economic growth points. For regions dominated by heavy industry, it is crucial to encourage the transfer of mature industries in high-tech areas, especially labor-intensive and resource-intensive industries. In regions dominated by agricultural production, it is essential to fully utilize the abundant natural resources and ecological environment to actively develop new industries, such as leisure agriculture and health tourism, and to promote industrial development focused on ecological resources.

5.3. Limitations

Although this study has explored aspects of the digital economy and sustainable rural development, it also has some limitations. First, the analysis only includes three regions, yet the development across provinces within each region varies significantly. Consequently, it is advisable to narrow the regional scope and divide it into seven regions. Second, while numerous factors influence the digital economy and sustainable rural development, this paper focuses only on six aspects: urbanization, industrial structure, technology, education, economic development, and government support, without providing a comprehensive analysis of all driving factors. Therefore, future research should delve deeper into subdividing geographical areas and identifying key driving factors.

Author Contributions

Writing—original draft, W.N.; Writing—review and editing, J.W.; Data curation, J.H. All authors have read and agreed to the published version of the manuscript.

Funding

This study was supported by the Humanities and Social Sciences Research Program (Grant No. 202300533) provided by the Department of Agriculture and Rural Development of Guangxi Zhuang Autonomous Region.

Institutional Review Board Statement

Not applicable.

Data Availability Statement

The raw data supporting the conclusions of this article will be made available by the authors on request.

Acknowledgments

The authors are grateful to the editors and the anonymous referees for their constructive and thorough comments, which contributed to the improvement of this study.

Conflicts of Interest

The authors declare no conflicts of interest.

References

  1. Saiz-Rubio, V.; Rovira-Más, F. From Smart Farming towards Agriculture 5.0: A Review on Crop Data Management. Agronomy 2020, 10, 207. [Google Scholar] [CrossRef]
  2. Dai, Y. Simulation of Agricultural Digital Economy Development and Policy Support System Based on Resource Sensitivity Index. Soft Comput. 2023, 27, 9077–9091. [Google Scholar] [CrossRef]
  3. Lai, J.-C.M.; Wang, C.-L.; Hsieh, M.-Y. A Research on Diversified Applications of Technological Education in the Development of Rural District Community Development Associations. Eng. Proc. 2023, 38, 18. [Google Scholar] [CrossRef]
  4. Xia, N.; Xie, J.; Yuan, Y.; Cao, Q.; Li, D. Research on the Influence of Digital Economy on Rural Governance. Front. Comput. Intell. Syst. 2022, 1, 5–10. [Google Scholar] [CrossRef]
  5. Peters, M.A. Digital Trade, Digital Economy and the Digital Economy Partnership Agreement (DEPA). Educ. Philos. Theory 2023, 55, 747–755. [Google Scholar] [CrossRef]
  6. Jizzakh Branch of the National University of Uzbekistan Named after Mirzo Ulugbek, Faculty of “Psychology”, 5230100—Economy (by Industries and Sectors), Student of Group 140-20, Uzbekistan; Dilshod Qizi, M.M. Strategies of Different Countries in the Field of Digital Economy. Am. J. Soc. Sci. Humanity Res. 2023, 3, 34–41. [Google Scholar]
  7. Mottaeva, A.; Khussainova, Z.; Gordeyeva, Y. Impact of the Digital Economy on the Development of Economic Systems. E3S Web Conf. 2023, 381, 02011. [Google Scholar] [CrossRef]
  8. Xie, F.; Li, B.; Xie, P. An Integrated Innovation Management Model from the Viewpoint Fitting Customer Value: Based on Chinese Cases. In Proceedings of the 2016 Portland International Conference on Management of Engineering and Technology (PICMET), Honolulu, HI, USA, 4–8 September 2016; pp. 1086–1097. [Google Scholar]
  9. Li, P. An Empirical Analysis of the Impact of Technological Innovation on China’s Total Employment. E3S Web Conf. 2021, 235, 02042. [Google Scholar] [CrossRef]
  10. Zhang, Y.; Jin, S. How Does Digital Transformation Increase Corporate Sustainability? The Moderating Role of Top Management Teams. Systems 2023, 11, 355. [Google Scholar] [CrossRef]
  11. Li, T.; Wen, J.; Zeng, D.; Liu, K. Has Enterprise Digital Transformation Improved the Efficiency of Enterprise Technological Innovation? A Case Study on Chinese Listed Companies. Math. Biosci. Eng. 2022, 19, 12632–12654. [Google Scholar] [CrossRef]
  12. Hutsaliuk, O.M.; Havrylova, N.V.; Krasnozhon, N.S. Info-communications in the system of innovative infra-structure of the national economy of the state. Econ. Innov. 2020, 22, 159–167. [Google Scholar] [CrossRef]
  13. Savchuk, R.; Bilous-Osin, T. Institutional support for the regulation of scientific activity in the context of digitalization. Balt. J. Econ. Stud. 2022, 8, 122–130. [Google Scholar] [CrossRef]
  14. He, Y.-T.; Zhang, Y.-C.; Huang, W.; Wang, R.-N.; He, L.-X.; Li, B.; Zhang, Y.-L. Impact of Digital Economic Development and Environmental Pollution on Residents’ Health: An Empirical Analysis Based on 279 Prefecture-Level Cities in China. BMC Public Health 2023, 23, 959. [Google Scholar] [CrossRef] [PubMed]
  15. Reunova, L.; Namitokova, Z.; Alikaeva, M. Impact of digitalization on the world economy development. MEST J. 2023, 11, 65. [Google Scholar] [CrossRef]
  16. Mohamed Abdel Razek Youssef, A. The Role of the Digital Economy in Sustainable Development. Int. J. Humanit. Lang. Res. 2022, 5, 13–25. [Google Scholar] [CrossRef]
  17. Wang, Y. The Impact of Financial Development and Rural Revitalization on High-Quality Economic Development—Empirical Analysis Based on Regional Provincial Data. Acad. J. Humanit. Soc. Sci. 2022, 5, 54–64. [Google Scholar]
  18. Li, Z.; Chen, J.; Zhang, Y. Can “Internet Plus” Enhance the Green Transition? The Moderating Roles of Environmental Regulation and Sewage Fee-to-Tax. Sustainability 2023, 15, 2854. [Google Scholar] [CrossRef]
  19. Mei, Y.; Miao, J.; Lu, Y. Digital Villages Construction Accelerates High-Quality Economic Development in Rural China through Promoting Digital Entrepreneurship. Sustainability 2022, 14, 14224. [Google Scholar] [CrossRef]
  20. Bürgin, R.; Mayer, H.; Kashev, A.; Haug, S. Far Away and yet so Close: Urban–Rural Linkages in the Context of Multilocal Work Arrangements. Reg. Stud. Reg. Sci. 2022, 9, 110–113. [Google Scholar] [CrossRef]
  21. Wang, Y.; Peng, Q.; Jin, C.; Ren, J.; Fu, Y.; Yue, X. Whether the Digital Economy Will Successfully Encourage the Integration of Urban and Rural Development: A Case Study in China. Chin. J. Popul. Resour. Environ. 2023, 21, 13–25. [Google Scholar] [CrossRef]
  22. Peng, C.; Ma, B.; Zhang, C. Poverty Alleviation through E-Commerce: Village Involvement and Demonstration Policies in Rural China. J. Integr. Agric. 2021, 20, 998–1011. [Google Scholar] [CrossRef]
  23. Huang, T. Research on the Mechanism and Path of Digital Economy Promoting Green Development of the Agricultural Sector. FSST 2023, 5, 63–67. [Google Scholar]
  24. Hassoun, A.; Marvin, H.J.P.; Bouzembrak, Y.; Barba, F.J.; Castagnini, J.M.; Pallarés, N.; Rabail, R.; Aadil, R.M.; Bangar, S.P.; Bhat, R.; et al. Digital Transformation in the Agri-Food Industry: Recent Applications and the Role of the COVID-19 Pandemic. Front. Sustain. Food Syst. 2023, 7, 1217813. [Google Scholar] [CrossRef]
  25. Zhang, Z.; Sun, C.; Wang, J. How Can the Digital Economy Promote the Integration of Rural Industries—Taking China as an Example. Agriculture 2023, 13, 2023. [Google Scholar] [CrossRef]
  26. Shu, H.; Zhan, L.; Lin, X.; Zhou, X. Coordination Measure for Coupling System of Digital Economy and Rural Logistics: An Evidence from China. PLoS ONE 2023, 18, e0281271. [Google Scholar] [CrossRef] [PubMed]
  27. Zhong, X. Agricultural and Rural Digitalisation in Regional Sustainable Development: A Comparative Study between China and the European Union. Cogn. Sustain. 2023, 2. [Google Scholar] [CrossRef]
  28. Qin, J. Research on the Role and Mechanism of Digital Economy Boosting Rural Revitalization under the Background of Big Data. Int. J. Sci. Eng. Appl. 2023, 60–61. [Google Scholar] [CrossRef]
  29. Wang, Z.; Zhao, Y. Energy Strategy for Sustainable Development of Rural Areas Based on the Analysis of Sustainable Digital Economy. Front. Psychol. 2021, 12, 788026. [Google Scholar] [CrossRef] [PubMed]
  30. An, Q.; Wang, R.; Wang, Y.; Pavel, K. The Impact of the Digital Economy on Sustainable Development: Evidence from China. Front. Environ. Sci. 2024, 12, 1341471. [Google Scholar] [CrossRef]
  31. Yang, C.; Ji, X.; Cheng, C.; Liao, S.; Obuobi, B.; Zhang, Y. Digital Economy Empowers Sustainable Agriculture: Implications for Farmers’ Adoption of Ecological Agricultural Technologies. Ecol. Indic. 2024, 159, 111723. [Google Scholar] [CrossRef]
  32. Zhang, H.; Guo, K.; Liu, Z.; Ji, Z.; Yu, J. How Has the Rural Digital Economy Influenced Agricultural Carbon Emissions? Ag-ricultural Green Technology Change as a Mediated Variable. Front. Environ. Sci. 2024, 12, 1372500. [Google Scholar] [CrossRef]
  33. Wang, Y.; Huang, Y.; Zhang, Y. Coupling and Coordinated Development of Digital Economy and Rural Revitalisation and Analysis of Influencing Factors. Sustainability 2023, 15, 3779. [Google Scholar] [CrossRef]
  34. Du, M.; Huang, Y.; Dong, H.; Zhou, X.; Wang, Y. The Measurement, Sources of Variation, and Factors Influencing the Coupled and Coordinated Development of Rural Revitalization and Digital Economy in China. PLoS ONE 2022, 17, e0277910. [Google Scholar] [CrossRef] [PubMed]
  35. Man, J.; Liu, J.; Cui, B.; Sun, Y.; Sriboonchitta, S. Coupling and Coordination between Digital Economy and Urban–Rural Inte-gration in China. Sustainability 2023, 15, 7299. [Google Scholar] [CrossRef]
  36. Liu, Y.; Jiang, Y.; Pei, Z.; Xia, N.; Wang, A. Evolution of the Coupling Coordination between the Marine Economy and Digital Economy. Sustainability 2023, 15, 5600. [Google Scholar] [CrossRef]
  37. Li, Y.; Chen, Y. The Spatiotemporal Characteristics and Obstacle Factors of the Coupled and Coordinated Development of Agricultural and Rural Digitalization and Food System Sustainability in China. Front. Sustain. Food Syst. 2024, 8, 1357752. [Google Scholar] [CrossRef]
  38. Ingole, K.; Padole, D. Design Approaches for Internet of Things Based System Model for Agricultural Applications. In Proceedings of the 2023 11th International Conference on Emerging Trends in Engineering & Technology—Signal and Information Processing (ICETET—SIP), Nagpur, India, 28 April 2023; pp. 1–5. [Google Scholar]
  39. Liu, W.; Tang, W.; Kang, Y. Research on the Integrated Development of Digital Economy and Rural Society under the Back-ground of Common Prosperity. Front. Bus. Econ. Manag. 2023, 7, 199–204. [Google Scholar] [CrossRef]
  40. Sun, N.; Song, Y.; Wang, X.; Peng, Y.; Wang, Y. Digital Rural Construction under the Background of Rural Revitalization: Takes Fengxian County of Jiangsu Province as an Example. Front. Bus. Econ. Manag. 2022, 5, 34–37. [Google Scholar] [CrossRef]
  41. Lin, K.; Zhang, X.; Hou, J. Evaluation of China’s Provincial Digital Economy Development Level and Its Coupling Coordination Relationship. PLoS ONE 2023, 18, e0288614. [Google Scholar] [CrossRef]
  42. Sun, L.; Zhu, C. Impact of Digital Inclusive Finance on Rural High-Quality Development: Evidence from China. Discrete Dyn. Nat. Soc. 2022, 2022, 7939103. [Google Scholar]
  43. Zhou, X.; Du, M.; Dong, H. Spatial and Temporal Effects of China’s Digital Economy on Rural Revitalization. Front. Energy Res. 2023, 11, 1061221. [Google Scholar] [CrossRef]
  44. Zadeh, L.A. Fuzzy Sets. Inf. Control 1965, 8, 338–353. [Google Scholar] [CrossRef]
  45. Ouadfel, S.; Abd Elaziz, M. A Multi-Objective Gradient Optimizer Approach-Based Weighted Multi-View Clustering. Eng. Appl. Artif. Intell. 2021, 106, 104480. [Google Scholar] [CrossRef]
  46. Huang, J.; Shen, J.; Miao, L. Carbon Emissions Trading and Sustainable Development in China: Empirical Analysis Based on the Coupling Coordination Degree Model. Int. J. Environ. Res. Public Health 2020, 18, 89. [Google Scholar] [CrossRef] [PubMed]
  47. Dagum, C. Decomposition and Interpretation of Gini and the Generalized Entropy Inequality Measures. Statistica 1997, 57, 295–308. [Google Scholar]
  48. Yan, J.; Tang, Z.; Guan, Y.; Xie, M.; Huang, Y. Analysis of Measurement, Regional Differences, Convergence and Dynamic Evolutionary Trends of the Green Production Level in Chinese Agriculture. Agriculture 2023, 13, 2016. [Google Scholar] [CrossRef]
  49. Rosenblatt, M. Remarks on Some Nonparametric Estimates of a Density Function. Ann. Math. Stat. 1956, 27, 832–837. [Google Scholar] [CrossRef]
  50. Senga Kiesse, T.; Corson, M.S. The Utility of Less-Common Statistical Methods for Analyzing Agricultural Systems: Focus on Kernel Density Estimation, Copula Modeling and Extreme Value Theory. Behaviormetrika 2023, 50, 491–508. [Google Scholar] [CrossRef]
  51. Amemiya, T. Tobit Models: A Survey. J. Econom. 1984, 24, 3–61. [Google Scholar] [CrossRef]
  52. Li, K.; Jiang, L. The Impact of Digital Economy on Urban-Rural Income Gap: A Case Study of Anhui Province. Front. Sci. Eng. 2023, 3, 70–76. [Google Scholar] [CrossRef]
  53. Liu, J.; Fang, Y.; Ma, Y.; Chi, Y. Digital Economy, Industrial Agglomeration, and Green Innovation Efficiency: Empirical Analysis Based on Chinese Data. J. Appl. Econ. 2024, 27, 2289723. [Google Scholar] [CrossRef]
Figure 1. Relations analysis of the digital economy and sustainable rural development.
Agriculture 14 00849 g001
Figure 2. Relations analysis of measurement methods.
Agriculture 14 00849 g002
Figure 3. The levels of digital economy development in each region of China from 2013 to 2022.
Agriculture 14 00849 g003
Figure 4. The levels of digital economy development in each province of China from 2013 to 2022.
Agriculture 14 00849 g004
Figure 5. The levels of sustainable rural development in each region of China from 2013 to 2022.
Agriculture 14 00849 g005
Figure 6. The levels of sustainable rural development in each province of China from 2013 to 2022.
Agriculture 14 00849 g006
Figure 7. The level of coupling and coordination in each region of China from 2013 to 2022.
Agriculture 14 00849 g007
Figure 8. The level of coupling and coordination in each province of China from 2013 to 2022.
Agriculture 14 00849 g008
Figure 9. Intra-regional disparities of the coupling and coordination index in each region of China from 2013 to 2022.
Agriculture 14 00849 g009
Figure 10. Inter-regional disparities of the coupling and coordination index in each region of China from 2013 to 2022.
Agriculture 14 00849 g010
Figure 11. Sources and contribution rates of the differences in the coupling and coordination index of China from 2013 to 2022.
Agriculture 14 00849 g011
Figure 12. Kernel density plot of coupling and coordination index in each region of China from 2013 to 2022. (a) Nationwide; (b) Eastern; (c) Central; (d) Western.
Agriculture 14 00849 g012
Figure 13. Relations analysis of explanatory variables, digital economy, and sustainable rural development.
Agriculture 14 00849 g013
Table 1. Index system for evaluating the digital economy.
Main IndexFirst-Tier IndexesSecond-Tier IndexesNature of IndicatorsWeight
Digital EconomyDigital InfrastructureNumber of internet access ports+0.0483
Number of internet broadband users+0.0536
Number of internet domain names+0.1097
Long-distance optical cables per square kilometer+0.1061
Number of mobile phones per 100 people+0.0230
Digital-Industry DevelopmentSoftware business revenue as a percentage of GDP+0.1175
Income from the technology market as a percentage of GDP+0.1312
E-commerce revenue as a percentage of GDP+0.0628
Number of computers per hundred people+0.0369
Number of companies per hundred that have websites+0.0093
Digital-Innovation levelExtent of coverage of digital-inclusive finance+0.0245
Depth of coverage of digital-inclusive finance+0.0288
Degree of digitalization of inclusive finance+0.0246
Expenditure on research and experimental development+0.1067
Number of research and experimental personnel+0.1169
Table 2. Index system for evaluating sustainable rural development.
Main IndexFirst-Tier IndexesSecond-Tier IndexesNature of IndicatorsWeight
Sustainable rural developmentThe living conditions of rural residents Minimum living security standards for rural residents+0.0732
Rural radio program coverage rate+0.0062
Rural television program coverage rate+0.0077
Number of cars per hundred rural residents+0.0615
Number of mobile phones per hundred rural residents+0.0148
Number of health technicians per thousand rural residents+0.0579
Number of healthcare beds per thousand rural residents+0.0350
Number of teachers per thousand rural elementary students+0.0234
Number of village committees per ten thousand rural residents+0.0604
The level of agricultural productionPer capita disposable income of rural residents+0.0486
Per capita consumption expenditure of rural residents+0.0462
Gini coefficient of rural residents0.0103
Urban–rural income ratio0.0180
Grain production per hectare+0.0488
Total value of production per hectare+0.0639
Total agricultural output value per agricultural worker+0.0477
Total horsepower of agricultural machinery per agricultural worker+0.0634
Proportion of primary and tertiary industries’ added value to GDP+0.0314
The level of rural environmentHousehold waste treatment rate+0.0036
Housing area per rural resident+0.0484
Living sewage treatment rate+0.1143
Water supply coverage rate+0.0210
Forest coverage rate+0.0515
Amount of fertilizer used per thousand hectares0.0163
Amount of pesticides used per thousand hectares0.0067
Amount of agricultural plastic film used per thousand hectares0.0080
Amount of diesel used per hectare0.0116
Table 3. Evaluation criteria for coupling coordination.
Coupling CoordinationCoupling Effect LevelRepresent Symbol
(0, 0.1)Extreme dysregulationA
(0.1, 0.2)Severe dysregulationB
(0.2, 0.3)Moderate outrangeC
(0.3, 0.4)Mild disordersD
(0.4, 0.5)On the verge of imbalanceE
(0.5, 0.6)Barely coordinatedF
(0.6, 0.7)Junior coordinationG
(0.7, 0.8)Junior coordinationH
(0.8, 0.9)Good coordinationI
(0.9, 1.0)Quality coordinationJ
Table 4. Descriptive statistics of variables.
VariableNMeanSDMinMax
Index3000.48190.11470.26220.7976
Urb3000.61390.11380.37890.8960
Ind3000.49540.09120.32000.8376
Tec3000.00160.00170.00010.0093
Edu3000.13950.02840.07580.2036
Eco30010.94430.43169.996612.1559
Gov3000.25040.10160.10660.6430
Table 5. Model regression result.
Variable(1)(2)(3)(4)
NationwideEasternCentralWestern
Urb0.3309 ***
(0.0675)
0.2536 ***
(0.0955)
0.5162 ***
(0.1781)
0.3129 **
(0.1549)
Ind0.2606 ***
(0.0278)
0.1850 ***
(0.0694)
0.2450 ***
(0.0367)
0.2536 ***
(0.0577)
Tec9.1788 ***
(1.2653)
8.0466 ***
(1.8142)
23.2170 ***
(4.6117)
11.4974 *
(6.5267)
Edu0.2339 **
(0.0960)
0.5143 ***
(0.1711)
0.3025 **
(0.1528)
0.0743
(0.2047)
Eco0.1802 ***
(0.0126)
0.1977 ***
(0.0218)
0.1403 ***
(0.0256)
0.1720 ***
(0.0307)
Gov0.0873 ***
(0.0301)
0.2335 ***
(0.0797)
0.0648
(0.0414)
0.0190
(0.0631)
_cons−1.8916 ***
(0.1067)
−2.0695 ***
(0.1911)
−1.5609 ***
(0.2033)
−1.7390 ***
(0.2600)
Sigma.u0.0629 ***
(0.0088)
0.0699 ***
(0.0162)
0.0458 ***
(0.0130)
0.0453 ***
(0.0111)
Sigma.e0.0119 ***
(0.0005)
0.0122 ***
(0.0009)
0.0097 ***
(0.0008)
0.0118 ***
(0.0009)
N30011090100
Note: The symbols *, **, and *** denote significance at the 10%, 5%, and 1% levels, respectively. Standard error is indicated in ().
Disclaimer/Publisher’s Note: The statements, opinions and data contained in all publications are solely those of the individual author(s) and contributor(s) and not of MDPI and/or the editor(s). MDPI and/or the editor(s) disclaim responsibility for any injury to people or property resulting from any ideas, methods, instructions or products referred to in the content.