Article

Pisum sativum L. ‘Eso’: Metabolic Profiling of Yellow Seeds to Define the Optimal Harvest Time

1
Department of Chemistry, University of Rome Sapienza, Piazzale Aldo Moro 5, 00185 Rome, Italy
2
Department of Environmental Biology, University of Rome Sapienza, Piazzale Aldo Moro 5, 00185 Rome, Italy
3
NMR-Based Metabolomics Laboratory, University of Rome Sapienza, Piazzale Aldo Moro 5, 00185 Rome, Italy
4
R&D Azienda Agricola Aureli Mario, Via Mario Aureli, n.7, 67050 Ortucchio, Italy
*
Author to whom correspondence should be addressed.
Agriculture 2024, 14(6), 855; https://doi.org/10.3390/agriculture14060855
Submission received: 24 April 2024 / Revised: 20 May 2024 / Accepted: 28 May 2024 / Published: 29 May 2024
(This article belongs to the Special Issue Feature Papers in Agricultural Product Quality and Safety)

Abstract

:
The yellow pea (Pisum sativum L. ‘Eso’, sin. Lathyrus oleracaeus Lam.(YP)) is an annual herbaceous plant that belongs to the Fabaceae family. Peas, along with other legumes, are an excellent source of proteins and essential amino acids; the yellow variety is known for maintaining a good protein profile even if subjected to industrial processing. However, the presence of antinutrients, such as phytates and oligosaccharides, limits its consumption as a fresh legume to its use as a source of isolated proteins or for animal feed. The aim of the study is to evaluate the changes in the entire phytochemical profile of YP seeds as a function of the harvest time. YPs harvested at about 40, 50, 60, and 70 days from sowing were examined by high-resolution NMR spectroscopy employing 1H-NMR, 1H-1H TOCSY, and 1H-13C HSQC. In total, 40 molecular species were identified and quantified; it was observed that there was a monotonous decrease in amino acids, carbohydrates, and secondary metabolites as a function of time. Antinutrient levels increased, but only in later sampling times. This study identified the optimal harvest time for yellow peas “Eso” in the fortieth day from sowing, adding new information about the best nutritional outcome for humans.

Graphical Abstract

1. Introduction

One of the major challenges of the modern era is to deal with the sustainable production of food to feed an increasing population. According to the Food and Agriculture Organization (FAO)’s estimation (2021), crop productivity must double by 2050 to meet the global demand for food and nutrition. However, the unpredictable and dynamic nature of changing global climate conditions makes the productivity scenario of available crops not promising. By 2080, the productivity of many crops is expected to decrease by around 50% in many parts of the world [1,2].
Increasing the crop productivity to meet the world’s burgeoning populations food needs in the presence of various biotic and abiotic stresses, has become the major challenge for crop scientists and producers in the era of emergence of niche consumer trends, and increasing demand for plant-based proteins expected to aid market growth. For this reason, the development of sustainable agricultural practices, as well as crop varieties containing more suitable nutritional traits will be essential to sustainably grow high-yielding crops.
FAO defines “pulses” as legumes harvested for their dry, edible seed, which is directly consumed (2021). The legume family (Fabaceae or Leguminosae) is the third largest flowering with over 20,000 species distributed around the globe. With a domestication history of nearly 10,000 years ago, the pea (Pisum sativum L.) was one of the first genetic model legumes used to learn about basic genetic principles in 1865 [3]. Up to now, peas, especially yellow and green cotyledon varieties, are the fourth most important cultivated legume (9.96 m ha) globally, after common beans (Phaseolus vulgaris L.; 33 m ha), cowpeas (Vigna unguiculata L.; 14.4 m ha), and chickpeas (Cicer arietinum L.; 13.7 m ha) with an estimated production value of 4 million USD in 2021 for dry peas [4]. These legumes have long been recognized for their high nutrient density as readily available source of proteins that have an almost complete amino acid profile [5], complex carbohydrates, high dietary fibers, vitamins, minerals, and bioactive molecules with numerous health benefits in several human diseases such as diabetes and cardiovascular and degenerative morbidities [6,7].
Being adapted to a cooler climate, peas require mean a seasonal temperature of 10–18 °C for optimum growth with harvesting times from 8 to 12 weeks [8] after seeding. Although, historically, it is a cool season crop, its area is now extending to warmers regions of the world due to the development of cultivars more resilient to certain abiotic stresses [9].
The yellow pea (YP) is a high protein and low-fat content variety for human and livestock consumption with a high grain yield, diffused since 8–9000 years ago in Asia and the Middle East [10]. It is known to be more suitable for thermal and physical industrial treatments or processes [11], and for maintaining good protein [12] and amino acid profiles with cooking [12] compared to the more common green peas. YPs as a food are particularly important given the high content of essential amino acids, in particular glutamine, lysine, and leucine, generally lacking in purely vegetarian diets [13].
Among YPs, the variant ‘Eso’ was registered by SELGEN, Czech Republic, Sibřina on 23 January 2012, and is one of the most interesting breeds for its high yield of nitrogenous substances [14]. ‘Eso’ is a semi-leafless variety and has a bushy habit and good standability. The vegetative cycle of the cultivar is medium–early, with moderate resistance to fungi and pea diseases and high seed yield, homogeneous color, and edible portion of the plant.
Despite the well-known health benefits and functional proprieties, interest in yellow peas is often lower than animal-derived foods [15,16]. This has been attributed in part to their less digestible protein and starch fractions and the presence of anti-nutritional factors such as phytic acid, trypsin inhibitors, and polyphenols that could reduce mineral bioavailability, inhibit activity of several enzymes such as trypsin and pepsin, affect starch digestion and the glycemic index [17,18], and reduce amino acids availability [19]. Polyphenols can form cross-linked complexes with proteins, making them unavailable during digestion as well as inhibiting digestive enzymes such as trypsin and amylase [18]. On the other hand, several studies have shown positive effects of some of these antinutrients as bioactive components such as antioxidant and cancer risk-reducing effects [19]. It is well known that the plant development processes change the phytochemical composition of plants and that this in turn addresses the possible uses of these products [20,21]. For example, it was observed that by carefully choosing the harvesting time of purple carrots, it is possible to differentiate between roots to be employed as food and others to be used as a source of bioactive compounds [21]. Indeed, the antioxidant, antimicrobial, and antifungal properties of the secondary metabolites in the seeds are known in the literature [22] and, in general, their positive effects linked to consumption on health and on the diet as a whole [23]. In view of this, it is important to optimize these parameters according to targeted agronomic strategies and to obtain a good product for nutrition.
The aim of the study is to evaluate the changes in the entire phytochemical profile of YP seeds as a function of the harvest time, achieved using the ripening of pods, in order to define the most suitable harvest time on the basis of the phytochemical composition of YP seeds in terms of lesser antinutrients, and higher free amino acids and nutrients. This approach is from the perspective of improving the consumption of whole yellow peas as a more sustainable source of proteins and micronutrients for human.

2. Materials and Methods

2.1. Plant Materials

Yellow peas Pisum sativum L. ‘Eso’ were acquired from the company RV Venturioli (Pianoro, Bo, Italy) and they were planted in the Fucino plain by Aureli Mario S.S. Agricola company (Ortucchio, AQ, Italy). The location is situated at 41°52′ N latitude and 12°12′ E longitude with a mean altitude of 680 m above sea level. Seeds were planted in May and harvested at about 40, 50, 60, and 70 days from sowing (n = 6 for each sampling), the last point representing full maturity and, therefore, comparable to commercially available seeds.

2.2. Sample Preparation

Approximately 0.5 g of sample was weighed, stored at −80 °C, and extracted following a modified Bligh–Dyer protocol [21]. Briefly, each sample was ground in a mortar with liquid nitrogen and added to a cold mixture composed of chloroform (2 mL), methanol (2 mL), and water (1.5 mL). The samples were stirred, stored at 4 °C overnight, and then centrifuged for 30 min at 4 °C with a rotation speed of 11,000 rpm. The upper hydrophilic and the lower organic phases were carefully separated and dried under nitrogen flow. The hydrophilic phase was resuspended in 0.7 mL of D2O containing 3-(trimethylsilyl)-propionic-2,2,3,3-d4 acid sodium salt (TSP, 2 mM) as an internal chemical shift and concentration standard. The hydrophilic phase was suspended then analyzed by 1H-NMR.

2.3. NMR Experiments

The NMR experiments were carried out on at 298 K on a JNM-ECZ 600R (JEOL Ltd., Tokyo, Japan) spectrometer operating at the proton frequency of 600 MHz and equipped with a multinuclear z-gradient inverse probe head. The mono-dimensional 1H NMR experiments were carried out for quantitative analysis, employing a presaturation pulse sequence for water suppression with a time length of 2 s, a spectral width of 9.03 KHz and 64 k data points, corresponding to an acquisition time of 5.81 s. The pulse length of 90° flip angle was set to 8.3 μs, the recycle delay was set to 5.72 s.
Bidimensional 1H-1H TOCSY and 1H-13C HSQC experiments were acquired according to Spinelli et al., 2022 [24] for the resonance assignment, along with literature data [24,25]. Quantities were expressed in mg/100 g through comparison of the relative integrals with the reference concentration and normalized to the number of protons (TSP: 9 protons) and to the starting fresh weight of the sample.

2.4. Statistical Analysis

MATLAB® R2023a (MathWorks, Natick, MA, USA) with the Statistics and Machine Learning Toolbox package was used as the program for univariate and multivariate analysis, with a home-built script.
Data were mean-centered and then autoscaled to equalize the importance of the variation of each variable. The analysis was carried out by combining multivariate data with the design experiment using ANOVA-simultaneous component analysis (ASCA) [26]. It operates by partitioning the variance of different samples in effect matrices:
X = X A + E
where the original matrix X is decomposed by the ASCA model based on the factors taken into consideration. In this case, it only considered the time factor XA and the matrix E, for the rest of the variance. The choice of the number of simultaneous components (SC) was due to the number of groups present in the experimental design; for XA, given that four groups of samples were considered, the rank of this factor was 3. Confidence intervals of the SC loadings were estimated by 10,000 bootstrap procedures [27].
The contribution of each of the different partitions of the matrix X were accounted by the sum of squares (SSQ) to estimate the effect of each factor. The significance of each effect was estimated by a permutation test with 10,000 randomizations, by checking if the experimental results were outside the 95th percentile of the distribution of SSQ for the data with randomized labels [28].
A univariate one-way ANOVA was performed. The Shapiro–Wilk test was performed on each variable to assess data normality prior to the one-way ANOVA, while to verify the homoscedasticity condition, the Brown Forsythe [29] test was carried out, with a significance value of 0.05. If these conditions were not met, a non-parametric ANOVA test was carried out with a Kruskal–Wallis test [30].
For the ANOVA-positive variables, using Bonferroni [31], a pairwise multiple comparison test was applied to determine which categories were discriminated by these metabolites (p < 0.05).
A Spearman’s correlation heatmap was also performed for each harvesting time employing a home-built script.

3. Results

A representative spectrum of YP hydroalcoholic extract is reported in Figure S1. Comparing the spectra at the different harvesting times, only quantitative differences were observed, and not qualitative ones. A total of 43 metabolites were identified and 40 of them were quantified (Supplementary Figures S2–S5). A resonance assignment was carried out on the basis of the signal chemical shift, multiplicity, TOCSY (Figure S6), and HSQC (Figure S7) correlations. The 1H chemical shifts, multiplicity, and the 13C chemical shifts of the identified molecules are reported in Supplementary Table S1. In particular, molecules belonging to the classes of amino acids (alanine (Ala), asparagine (Asn), aspartate (Asp), arginine (Arg), γ-aminobutyric acid (GABA), glutamine (Gln), glutamate (Glu), histidine (His), leucine (Leu), isoleucine (Ile), lysine (Lys), phenylalanine (Phe), threonine (Thr), tryptophan (Trp), tyrosine (Tyr), valine (Val)), organic acids (acetic acid (AA), citric acid (CA), formic acid (FA), fumaric acid (FumA), malic acid (MA), succinic acid (SA)), carbohydrates (sucrose (S), galactose (Gal), glucose (G), xylose (X)); oligosaccharides (raffinose, stachyose, Raff + Stach, quantified together), verbascose (Verb)); secondary metabolites (hydroxycinnamic acid (4-HCA), indole-3-acetic acid (I3AA), caffeic acid (CafAc), hydroxyphenyl acetate (OHPheAc), trigonelline (Trig), rutin-glycoside (Rut)); and other compounds (phytic acid (Phy), choline (Chn), adenosine X-phosphate (AXP), guanosine X-phosphate (GXP), uridine (U), and uridine X-phosphate (UXP)) were observed.
For quantification, only the molecules whose diagnostic resonances were free of superimposition were chosen, and their amounts are reported in Table 1 and expressed as mg/100 g of fresh weight.
When comparing amino acids, the ANOVA test (Table 1, Figure S8) showed the first harvesting group characterized by a higher amino acid content than the other three classes of samples. Only tryptophan, phenylalanine, and histidine levels were not significantly different among the groups.
Higher levels of organic acids were observed in the group on the 40th day of collection as compared to all other groups, with the exception of citric acid, malic acid, and hydroxyphenylacetic acid, whose levels were not significantly different by comparing the groups through ANOVA testing.
Regarding the carbohydrate group, carbohydrates such as xylose, glucose, and galactose were higher in YP harvested at 40th day, while verbascose was not significantly different compared to other groups. On the contrary, oligosaccharide (stachiose + raffinose) levels increased in peas harvested after 40 days (with a 2-fold increase).
Uridine and phosphorylated uridine levels were higher in the harvesting groups following the first, while phosphorylated guanosine levels were lower in these groups, and phosphorylated adenine levels did not change. Intriguingly, the phytic acid levels increased significantly in the groups following day 40 (an increase of two orders of magnitude), as well as the choline and trigonelline levels, while rutin-glycoside was lower in the samples harvested after 40 days. Indole-3-acetic acid levels did not change as a function of harvesting time.
To better understand the changes occurring in YP seeds as a function of harvesting time, an ASCA model was developed based on NMR data. For the significance of the model, a permutation test was carried out, showing high significance for the time factor (p < 0.0001) (Supplementary Figure S9).
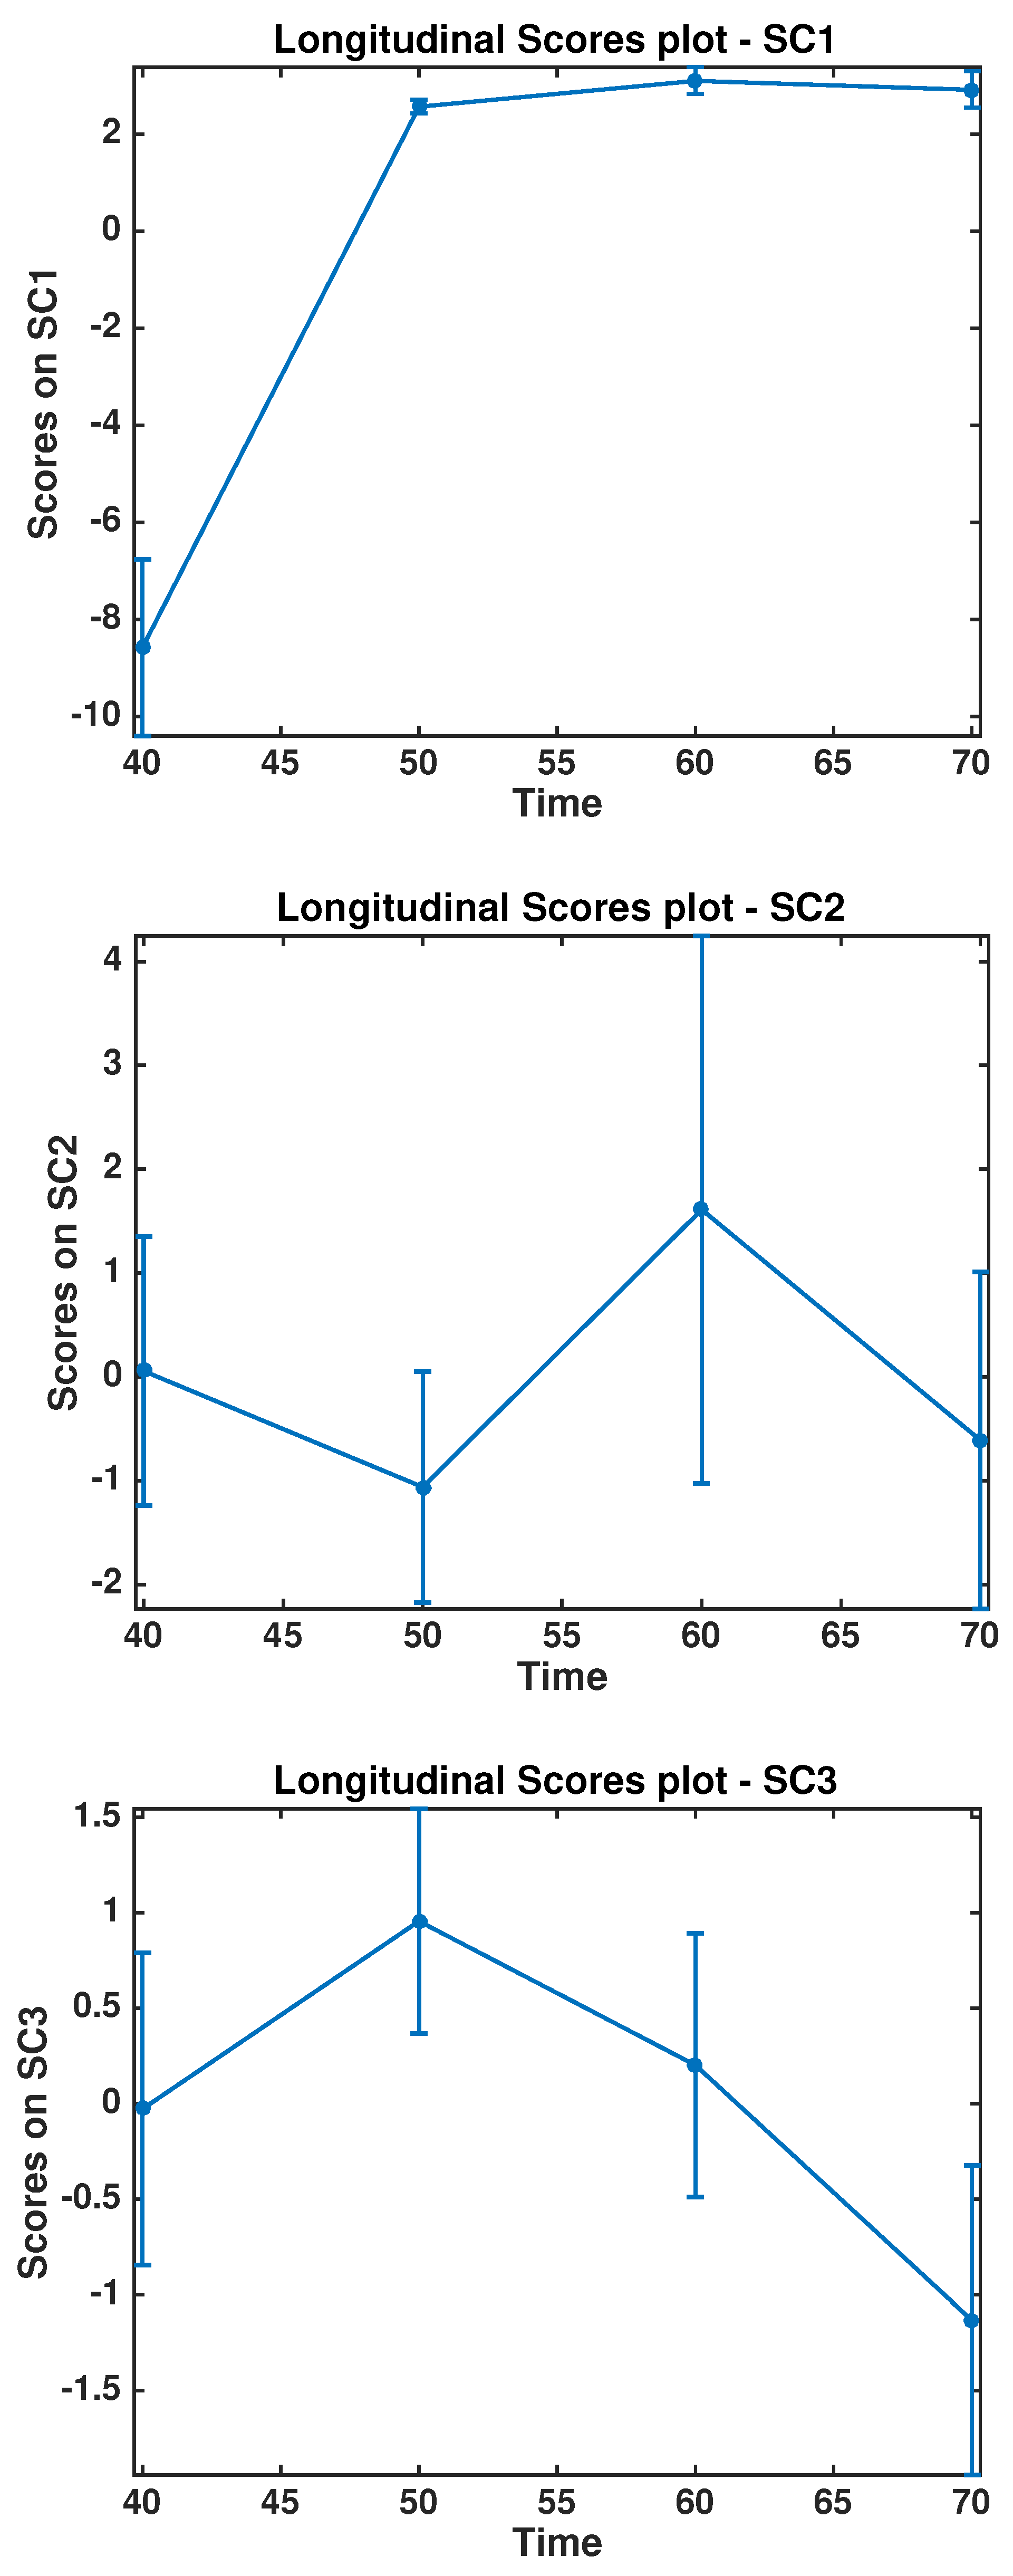
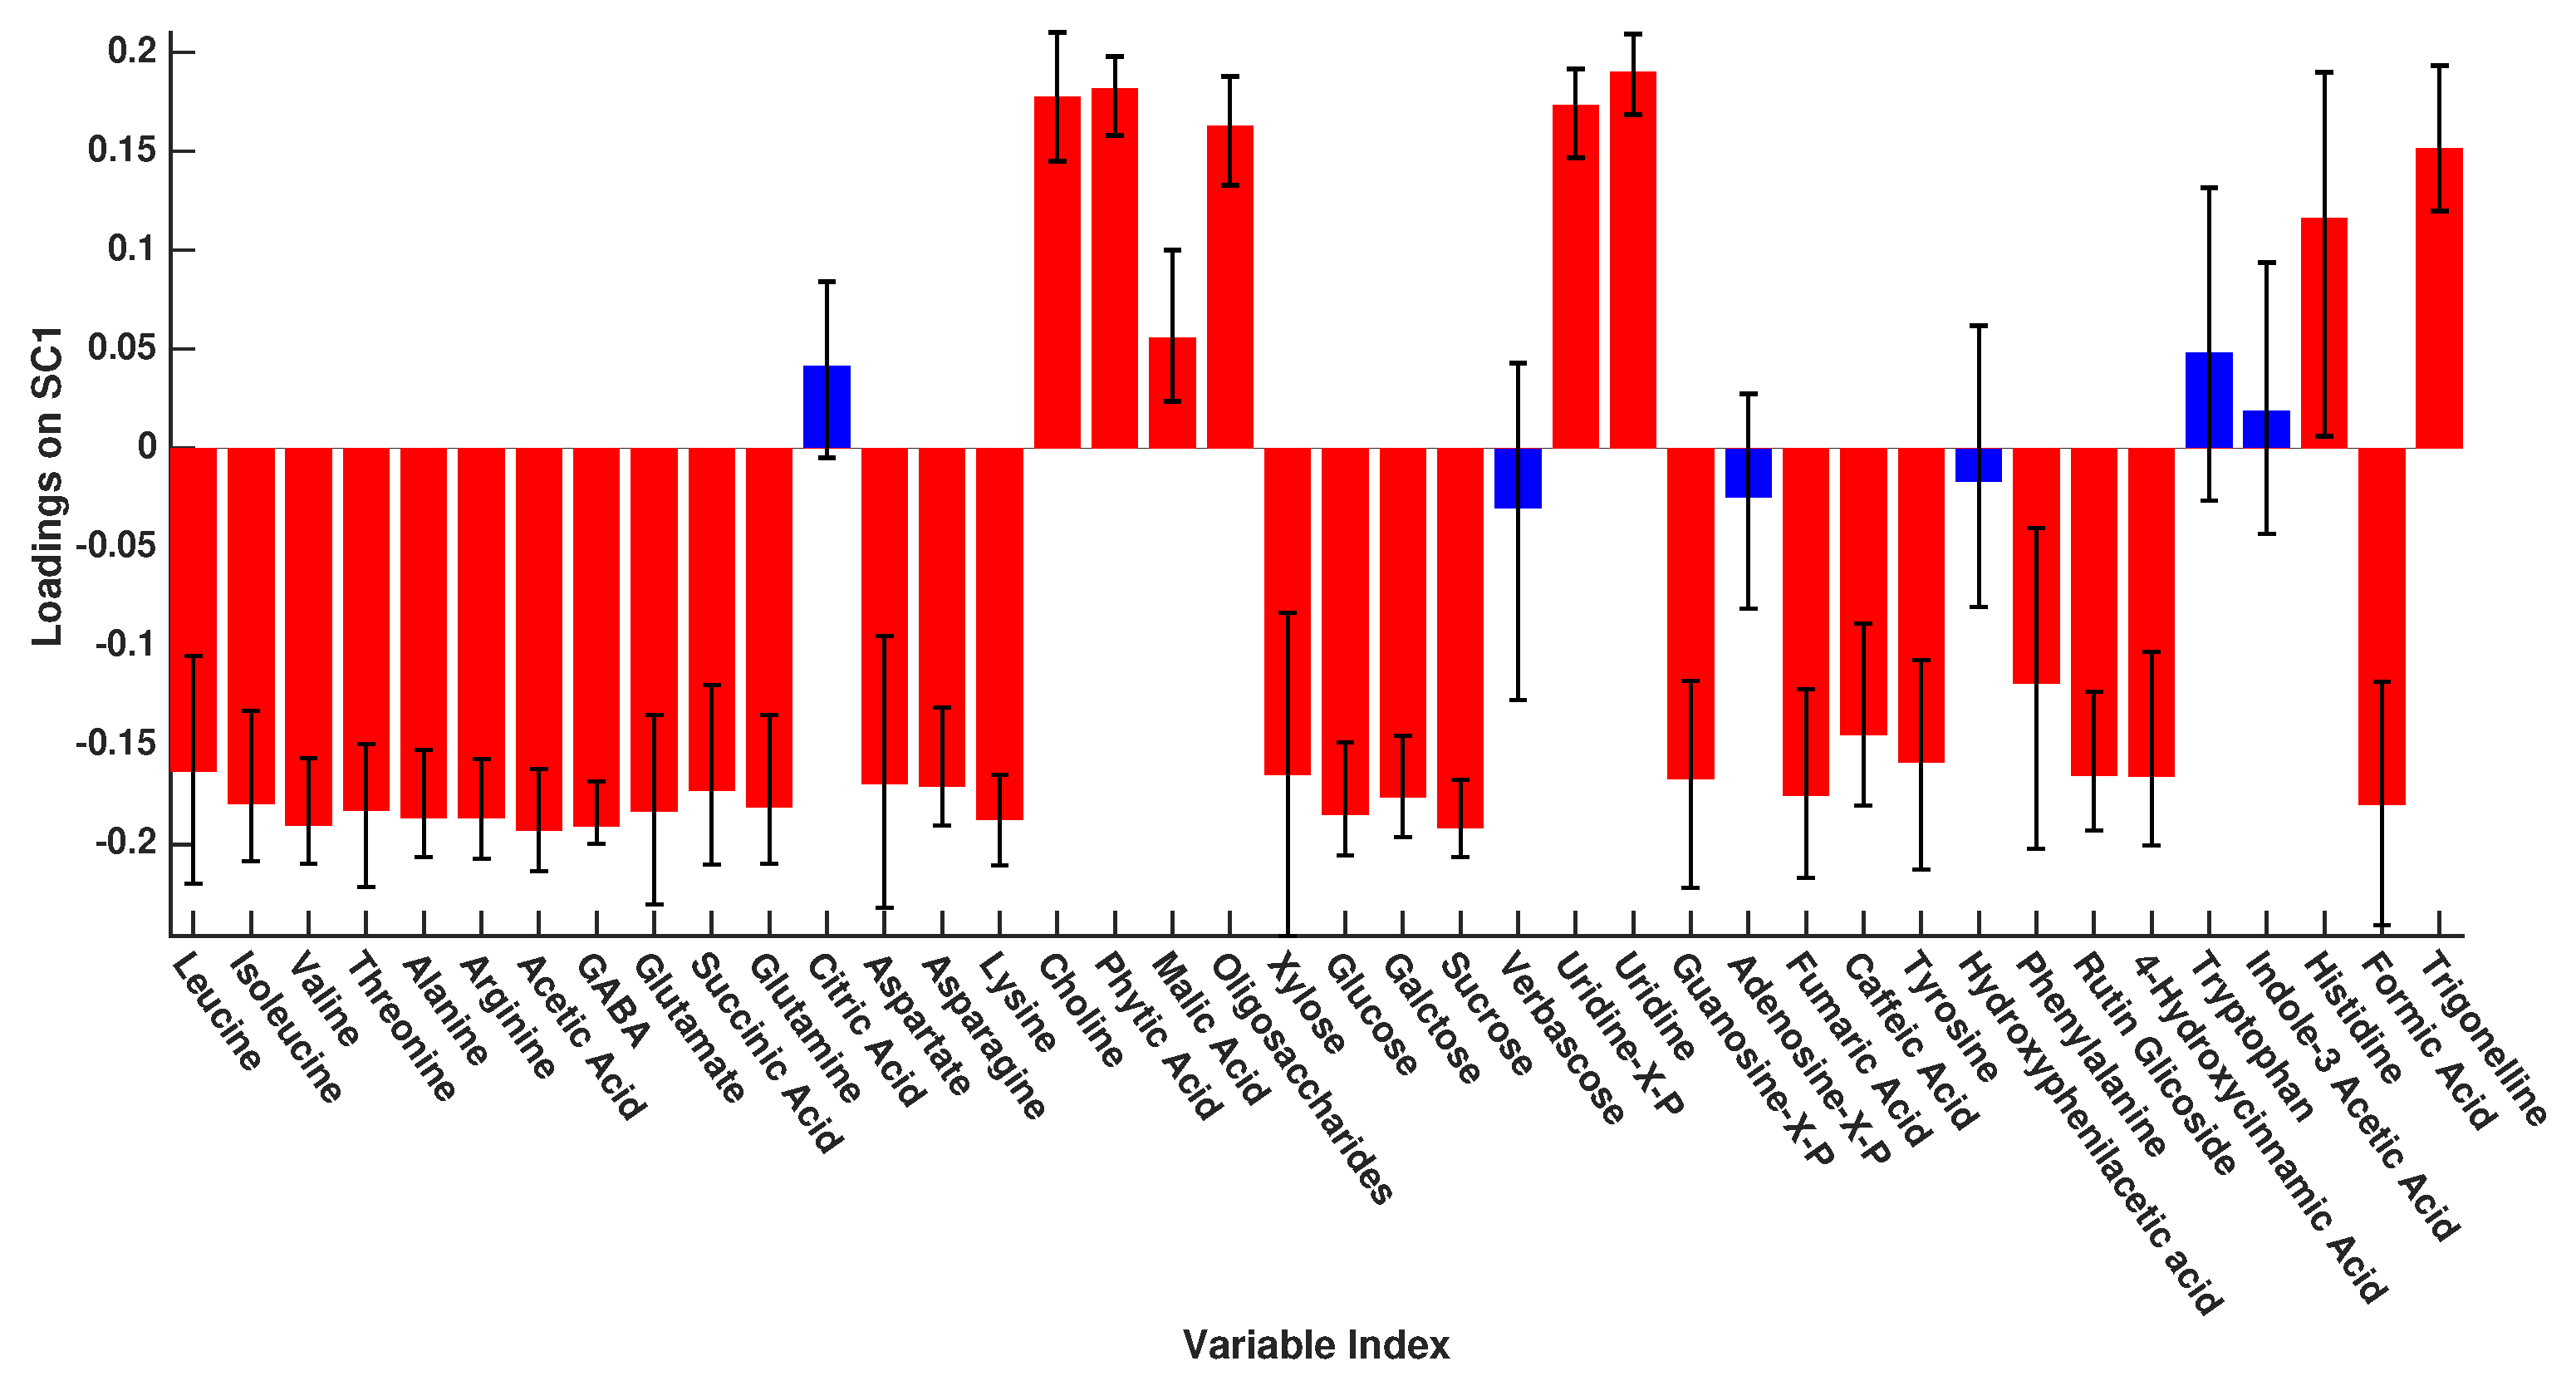
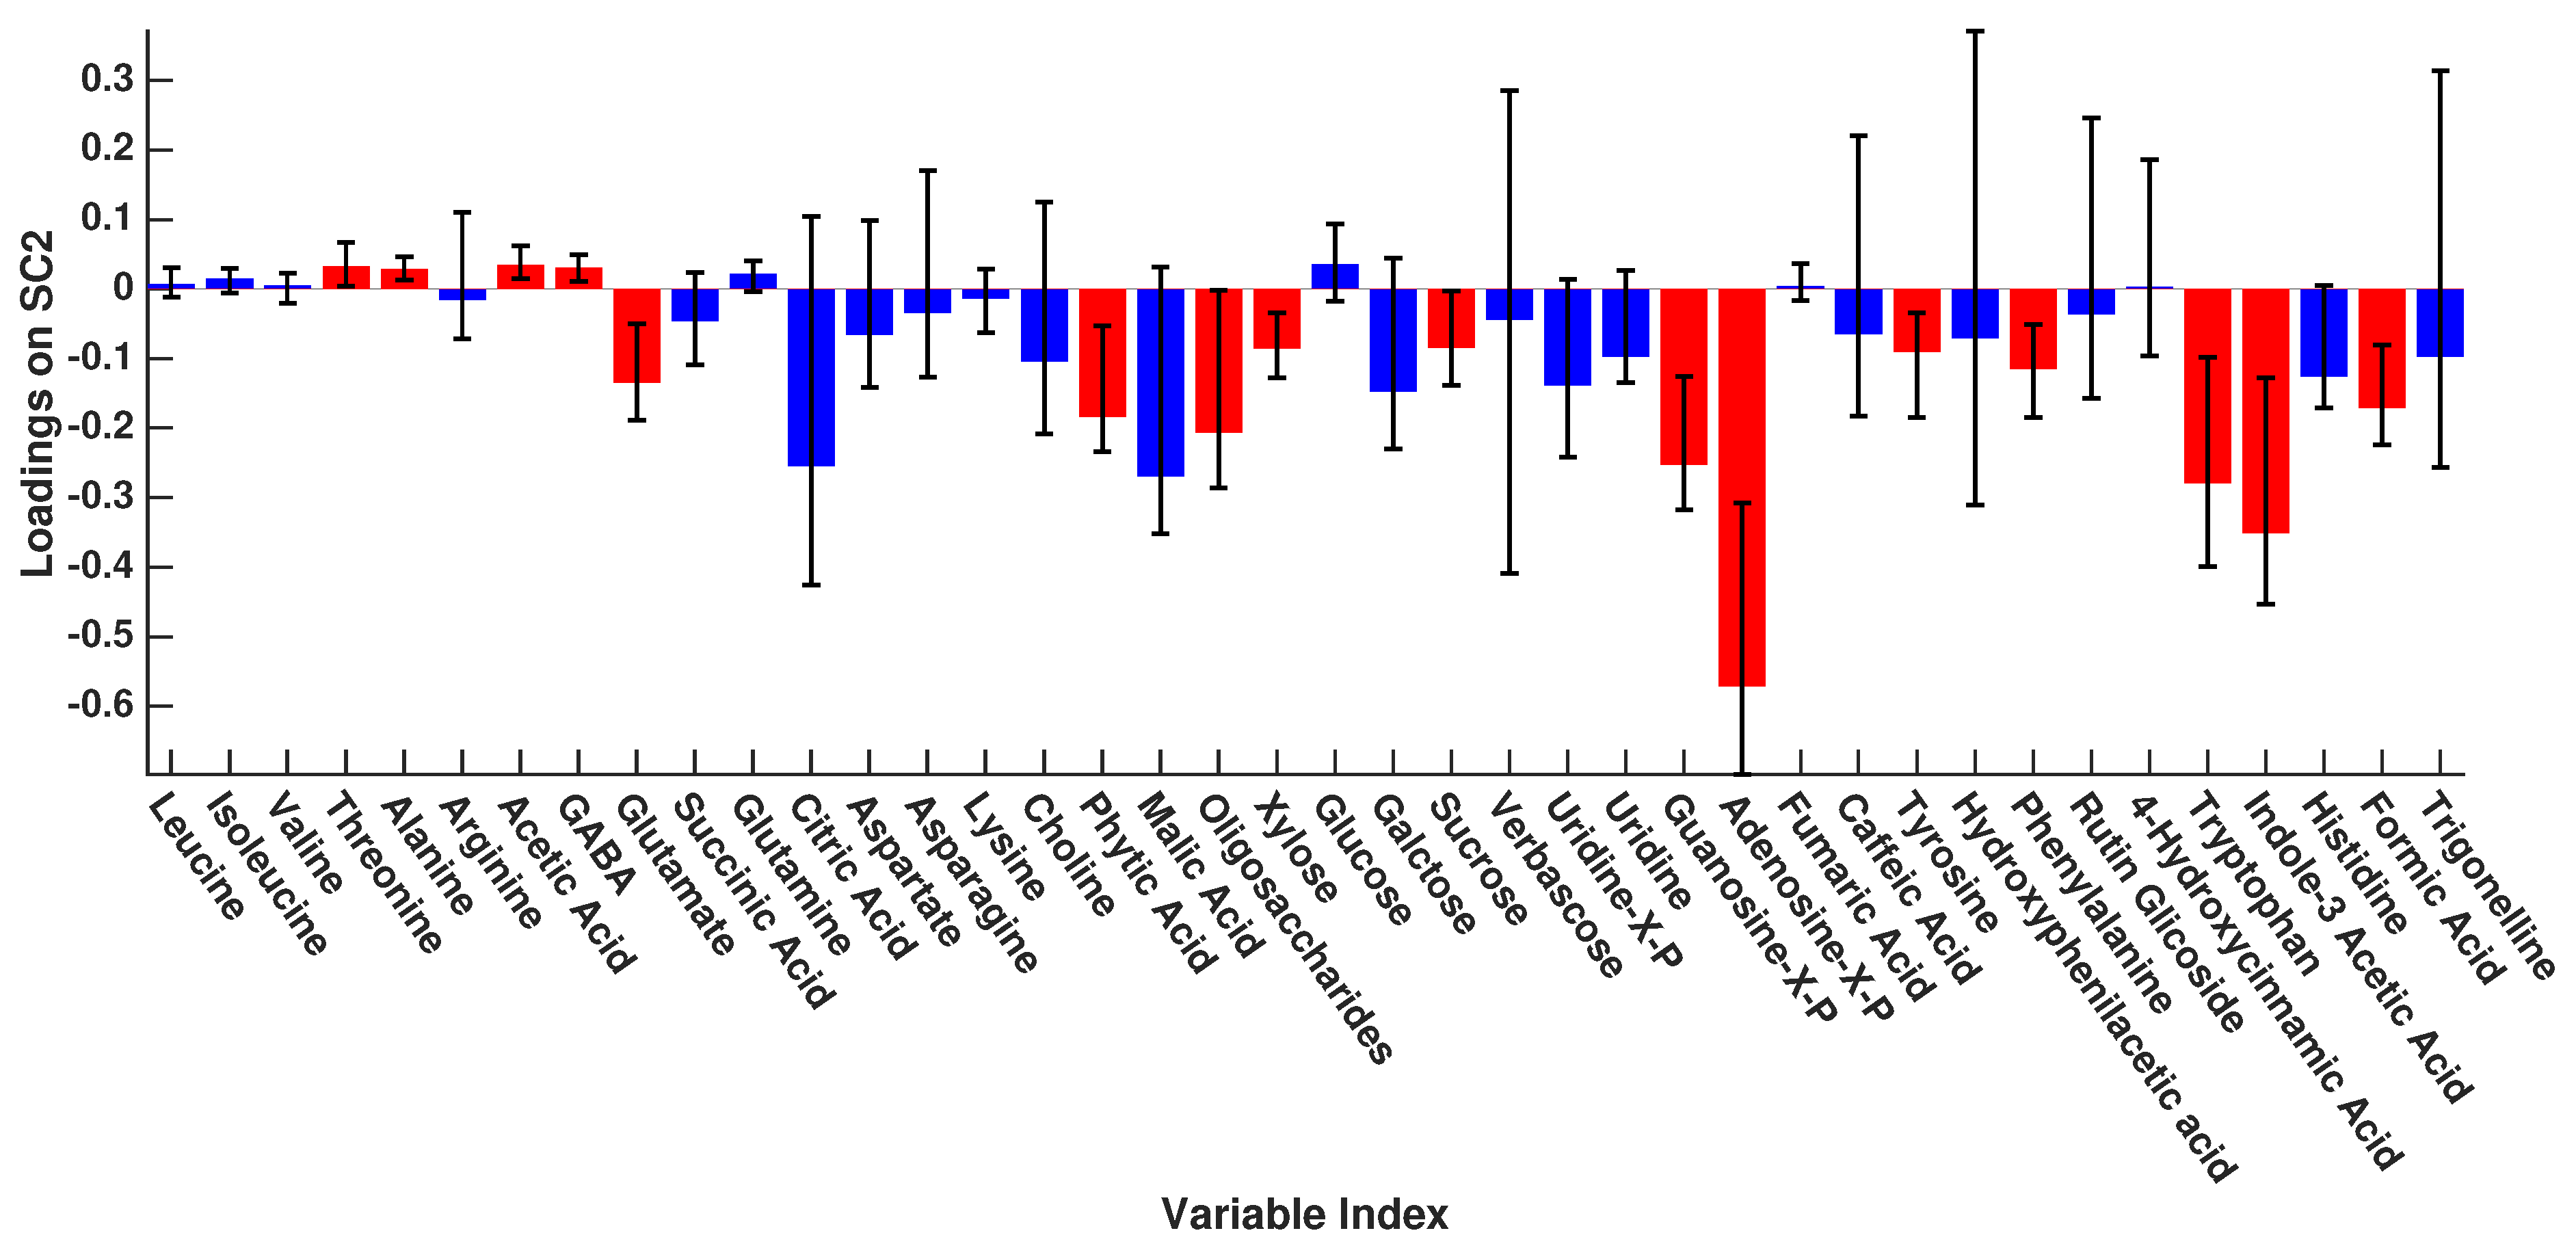
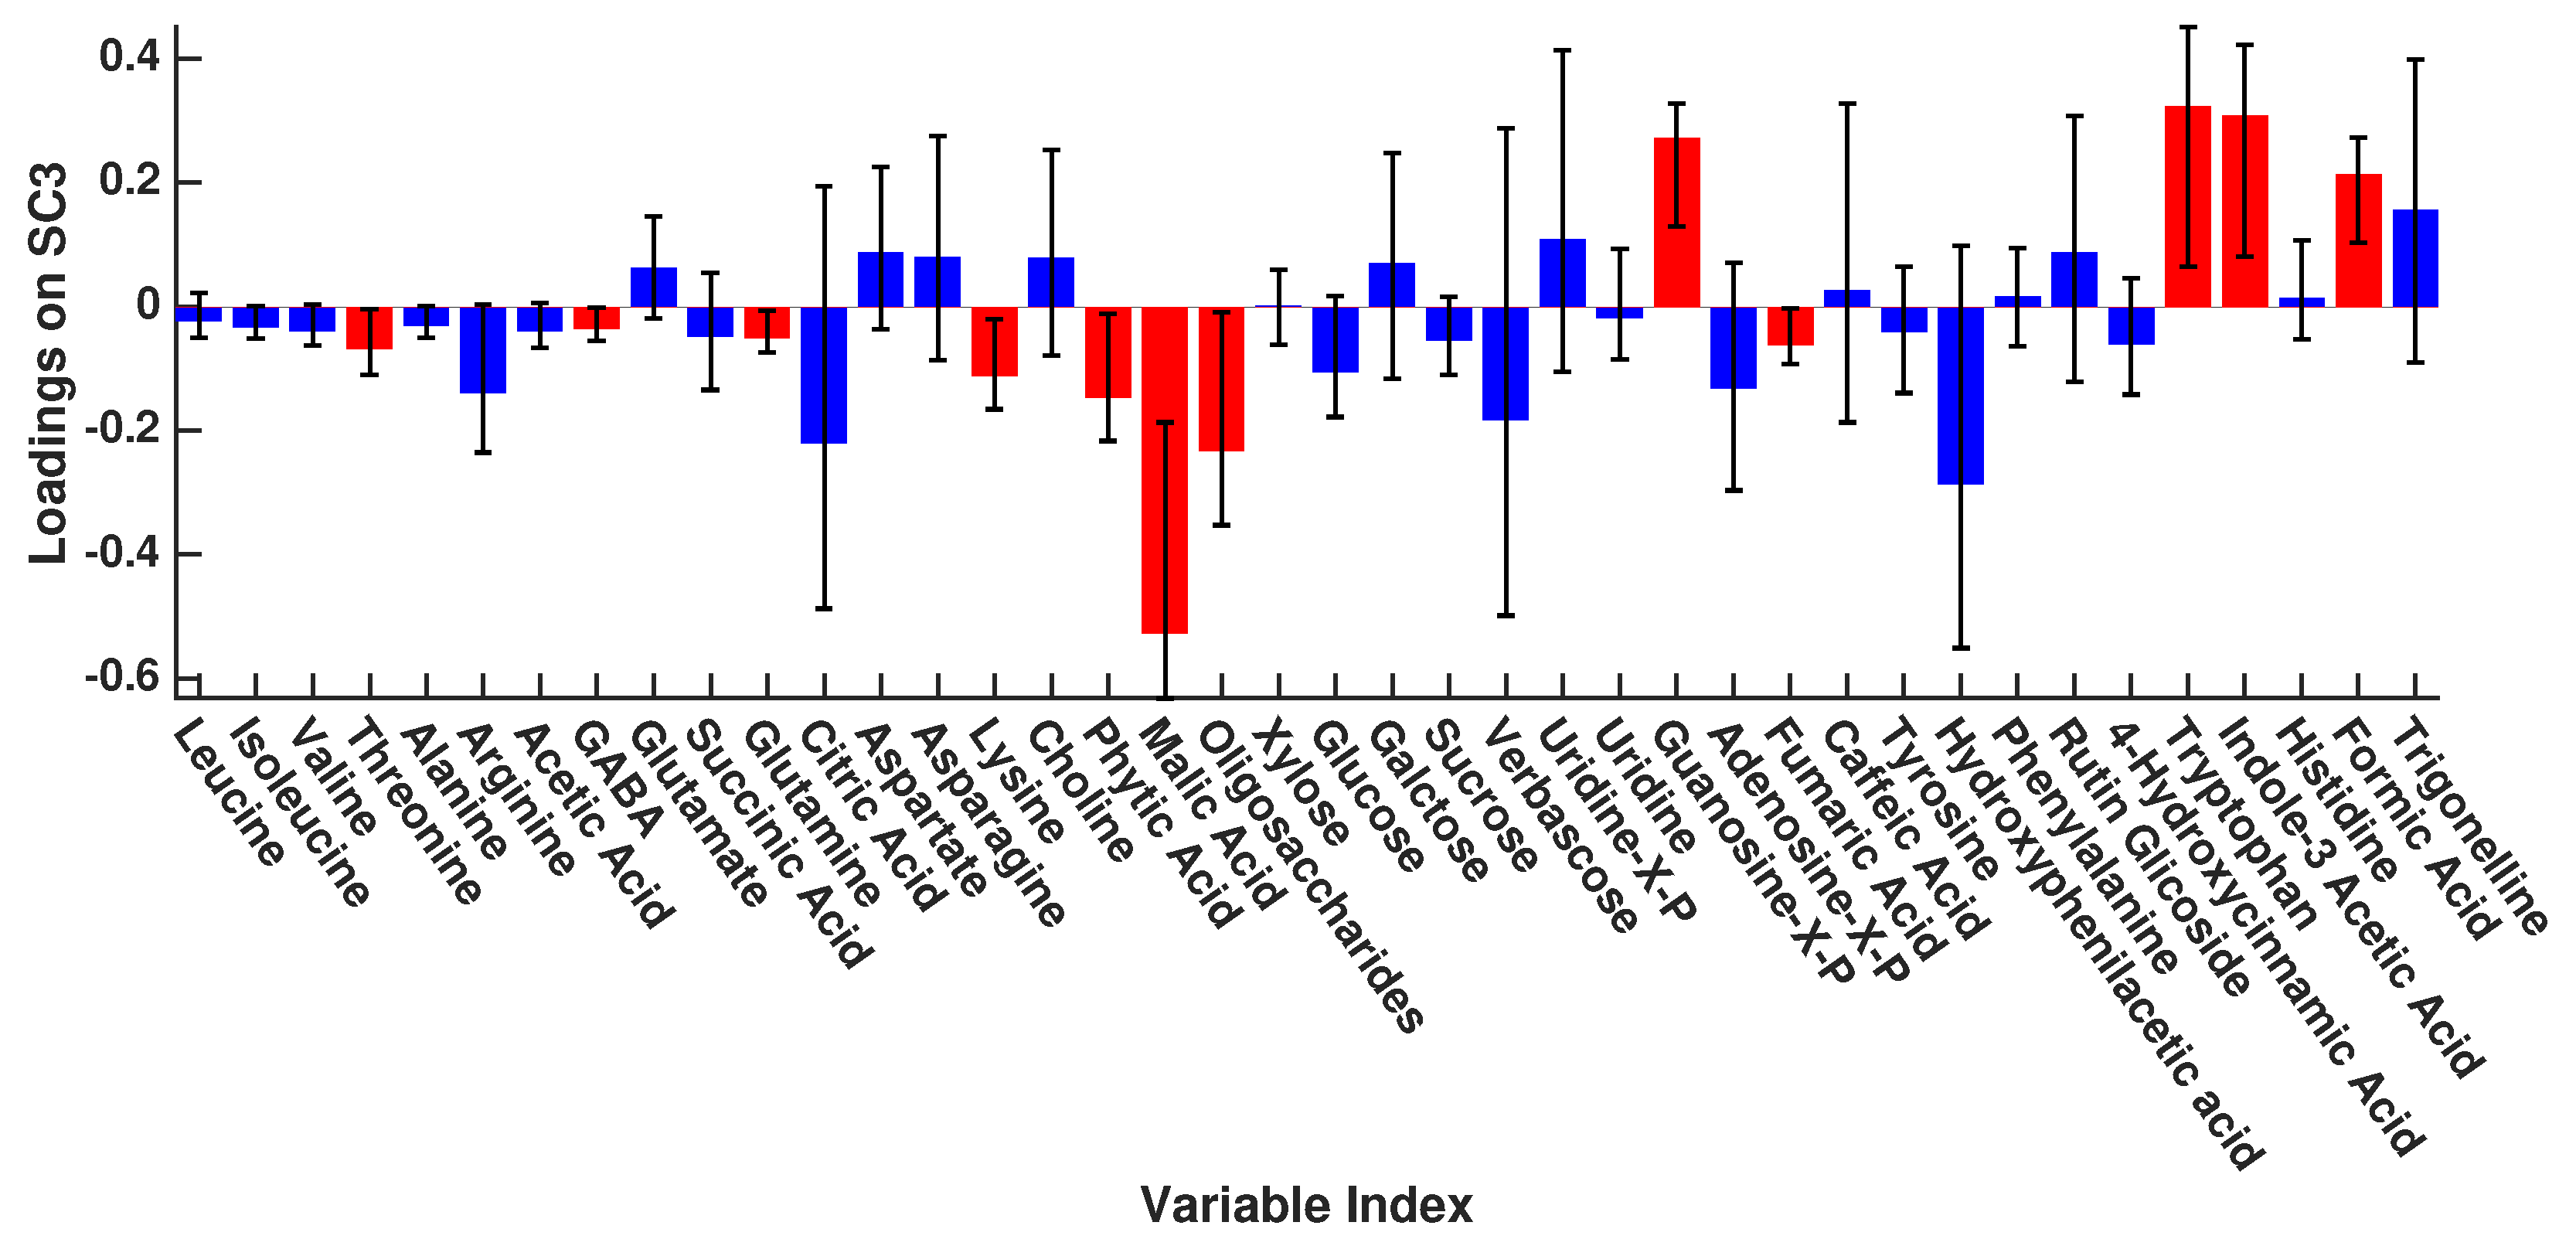
The main observable difference between sample groups in the ASCA model was associated with the 40th day of collection compared to the rest (Figure 1). To better understand the variations between the samples of the different collections with respect to the metabolites, longitudinal scores plots (i.e., the representation of the scores along each component as a function of harvesting time) are reported in Figure 2. Figure 3, Figure 4 and Figure 5 collect the loadings for the three SCs, together with their confidence intervals, which allow interpreting the observed differences in terms of the measured metabolites.
For the longitudinal scores plot along SC1, a change associated with the samples between the 40th and 50th day of harvest can be observed. Along the SC2, the variation occurring at the 60th day is shown, and for the SC3, it is possible to see a variation at 50 days and which then changes trend up to 70 days. Bidimensional scatterplots for SC1 vs. SC2 and SC1 vs. SC3 are also reported in the Supporting Information (Supplementary Figures S10 and S11).
Along the SC1, higher metabolites for the 40th day (Table S2) have a negative loadings value, such as amino acids, low molecular weight organic acids, carbohydrates, nitrogenous bases, and secondary metabolites. Positive loadings indicate variables that decreased for the 40th day of harvest compared to latter harvesting times such as antinutrients (oligosaccharides and phytic acid), choline, malic acid, uridine, uridine-XP, trigonelline, and amino acid histidine.
On the SC2, the variables with negative loadings increased slightly at the 50th day and then decreased at 60th, returning to the initial level at 70th day of harvest. This trend is mainly observed for glutamate, antinutrients such as phytic acid and oligosaccharides, xylose, guanosine-XP, adenosine-XP, aromatic amino acids such as phenylalanine, tyrosine and tryptophan, indole-3-acetic acid, and formic acid. An opposite trend was observed for amino acids threonine, alanine, GABA, and acetic acid.
Significant loadings on SC3 show, for the positive ones, the variables that systematically diminished after the 50th day of harvest, such as guanosine-XP, tryptophan, indole-3-acetic acid, and formic acid. For latter harvests time (60th and 70th), an increase in antinutrients such as phytic acid and oligosaccharides, malic acid and amino acids threonine, GABA, and glutamine were instead observable.

4. Discussion

The composition of mature seed is the cumulative effect of events throughout seed development and is a consequence of the supply of carbon, nitrogen, and other resources from the maternal plant and seed-based metabolism. Peas are an important source of amino acids, proteins, and other nutrients for human and livestock consumption, playing a central role in the sustainable production food to feed an increasing population and meeting global food demand. The growing demand for proteins and/or amino acids is known both in the Western World and in developing countries [32,33], and this has also led to the consideration of non-traditional sources such as insect-based flours which are being discussed in Europe [34,35].
Yellow peas are mainly utilized as feed for animals, but their use as an alternative protein source is increasing for humans. For example, isolated proteins could be used to produce dairy and meat substitutes. A higher consumption of fresh or transformed yellow peas should be desirable for their higher content of essential amino acids as compared to other vegetable flours. However, the presence of antinutrients such as phytate or some oligosaccharides (stachyose or raffinose) can reduce the absorption of fundamental minerals or gut fermentation, decreasing the acceptance of the consumers. These problems could be overcome optimizing the YP production processes, but very little useful information is available [8,36].
Among the factors that could be easily influenced, the choice of harvest time is very promising. Traditionally, peas are left to dry attached to the plant until the optimal time, and during the numerous days of waiting (between 40 and 60 depending on the variety), numerous biochemical processes are active capable of altering not only the amino acid content, but also of the rest of the phytochemical profile of the seed.
From the presented analysis, it was possible to observe that the change in the phytochemical profile of different ‘Eso’ YP seeds correlated with different harvesting times.
The observed free amino acid profile reflects the protein composition known in the literature for peas [37]. In particular, there are high quantities of the essential amino acids leucine, isoleucine, valine, and threonine, making them attractive for human nutrition [38,39]. The aromatic amino acids phenylalanine, tryptophan, and tyrosine are also found, which can be synthesized by plants but not by humans or animals, who must obtain them through diet [40]. Compared to other plant-based protein, it was also found that YP has higher lysine content [41].
It is known that amino acids are energetic precursors and are involved in redox regulation, and in the synthesis of secondary metabolites such as phenylpropanoids and alkaloids [42]. The present study showed that the highest concentration of amino acids was observed at 40 days, and that it dramatically decreased at 50 and 60 days, then slightly increased at 70 days throughout the developmental process. With the maturity and senescence of the plant, there may be two reasons for the decrease in amino acids. First, amino acids could be involved in the synthesis of storage proteins. Second, the complete oxidation of amino acids produces the energy required to meet the special needs of certain organs, such as stressed leaves or roots. Nonetheless, the molecular mechanism of regulation of amino acid catabolism in plants is complex and unclear so far [43].
The decrease found for the different harvesting times can be also associated with the drying effect of the seeds left in the field; the highest amino acid content was on the 40th day of harvesting, when the seeds had not yet completely yellowed. The observed trend of free amino acids and the decrease in monosaccharides and sucrose could be associated with the non-enzymatic glycosylation of proteins and amino acids, which has been previously found in other drying seeds [44].
Moreover, it is known in the literature that the ingestion of free amino acids in the diet, compared to the consumption of protein-bound amino acids, is correlated with a more rapid absorption and availability of amino acids in the circulation [45] for the body’s use. Therefore, for this cultivar, an early harvest could provide more absorbable forms of amino acids.
A decrease in the levels of all carbohydrates was also observed according to the seed development, except for oligosaccharides. It is known that green seeds capitalize on photosynthesis to improve carbon efficiency [46,47]. The decrease in sugars also provides an indication of carbon loss relative to that converted to biomass during seed ripening. The observed carbohydrates (Table S1) can be divided into two categories: monosaccharides such as glucose, galactose, xylose, and fructose (in this study observed but not quantified), the disaccharide sucrose, and the more complex oligosaccharides such as raffinose, stachyose, and verbascose. The oligosaccharides are involved in various functions, including regulation of the response to abiotic stress [48]. The higher contents observed in later harvests are probably employed by the plant to reduce the protein denaturation caused by hydric stress and general protection against desiccation damage [49]. It is important to highlight that these oligosaccharides are antinutrients since they are not digestible by humans but by their microbiota and, therefore, can cause several problems such as flatulence due to the metabolism of intestinal methanogenic bacteria [50]. However, recent articles have shown that consumption of raffinose-like oligosaccharides can also be related to an improvement of the gut microbiota ecology, in particular with the increase in the Bifidobacteria and Lactobacilli, which are characteristic for a healthy microbiota [51,52].
A metabolite linked with carbohydrate biosynthesis is myo-inositol, which in seeds is phosphorylated to phytic acid (inositol hexa kis phosphate). This molecule represents the majority of the phosphorus in legume seeds, serving as phosphorus reservoirs and also as signalling molecules in biotic and abiotic stresses [53,54]. Although inositol phosphates can be considered as antinutrients due to their chelating capacity that reduces the absorption of useful ions such as iron, zinc, magnesium, and calcium [54,55], the chelating abilities have been associated with antioxidant properties, heavy metal toxicity reduction, and amelioration of heart disease [56]. Both oligosaccharides as well as phytic acid are significantly more abundant in later harvests than the earliest one (Table 1, Figure 2), and given their antinutrient effects, it further confirms the hypothesis that an early harvest could be more beneficial for human nutrition.
It is known in the literature that YP, together with other legumes belonging to the Fabaceae family, produce many types of secondary metabolites in response to biotic and abiotic adaptation reactions [57]. Of these, in the univariate and multivariate models (Table 1, Figure 1, Figure 2, Figure 3, Figure 4, Figure 5), hydroxycinnamic and caffeic acids, rutin, and trigonelline discriminate the earliest harvested seeds from the later groups. A decrease in content was recorded in subsequent harvests for all except trigonelline, whose content doubled, starting from the 50th day. Observing the Spearman’s correlations calculated for the individual harvest times (Supporting Figures S12–S15), we note with interest that only at 40 days there were strong direct correlations between the secondary metabolites and their amino acid precursors, while these were highly non-significant for the subsequent harvests [58]. Phenolic acids have various pharmacological activities, such as anti-inflammatory, anti-anxiety, and anti-depressive activities [59]. Some of them are connected to the polymer of the cell wall through covalent bonds, which is crucial to the process of plant immune mechanism [60]. The predominant phenolic acid detected at 40 days in yellow peas was hydroxycinnamic acid (HCA). Its levels decreased according to seed development. While HCA is not believed to be essential for human survival, it exerts a number of important health benefits. Its ability to form resonance-stabilized phenoxy radicals makes it a powerful radical scavenger and antioxidant. As such, it could help to protect cells against the detrimental effects of free radicals and ROS that are formed under oxidative stress and cause a range of detrimental effects including neurodegeneration [61]. It has been suggested that this antioxidant behavior helps to control oxidative stress in wounded tissues and accelerates wound repair. Previous studies have shown that low-temperature stress can effectively promote the accumulation of secondary metabolites and play an important role in regulating secondary metabolites and improving plant cold resistance [62]. In response to cold stress, plants usually synthesize more phenolic acids and flavonoids, thereby enhancing the thickness of cell walls and helping to prevent chilling injury and cell collapse under cold stress. It is worth noting that early harvesting times (40 days) had the highest levels of caffeic acid, while a decrease was observed according to higher temperatures that occurred at late harvest times.
The nitrogenous bases uridine, uridine phosphate, and guanosine phosphate also significantly discriminate between the different groups, with guanosine phosphate undergoing a decrease until the 60th day of harvest and a slight increase for the last set of samples. A similar trend was observed for adenosine phosphate (Figure 1, Figure 2 and Figure 3, Table 1), where a decrease on the 60th day and an increase on the 70th day of harvest was observed. These trends suggest a shift in the metabolism of the nucleotides of the already dried YP, i.e., from the 50th day onwards. This same set of samples seemed to be undergoing a shift also for the secondary metabolite metabolism, marked by the high content of phenylalanine, tyrosine, and tryptophan (Figure 3), common precursors of many molecules synthetized as response to abiotic stresses [57,63]. These stresses could be associated with the aging as well as over-drying of the seed. Moreover, all the evidenced metabolites are known in the literature to show antioxidant, anti-inflammatory, and positive properties for the immune system, in addition to conferring more resilience to environmental stresses, further confirming that the optimal harvest time for this cultivar to be at 40 days [2,58,63,64,65,66,67,68,69].

5. Conclusions

The present study showed the changes occurring in the nutritional profile of seeds already ripe and left to dry in the field, therefore, suggesting how the choice of the harvest time could be employed to define their application. Indeed, seeds harvested at 40 days could be regarded as a source of free amino acids, more easily digested than proteins. Moreover, this harvest time was also the one with the lowest content of antinutrients. The combination of these factors also makes this time and this product optimal for possible human food use, especially for the growing plant-based meat market [60]. At the same time, seeds harvested at later times could be employed as a source of prebiotics, mainly oligosaccharides.
The understanding of the dynamics and mechanisms of plant metabolome alterations and their biological functions is a fundamental step to defining optimal agricultural practices or how the culture conditions could be employed to diversify the production. In this context, metabolite profiling strategies are invaluable tools to access the information concerning the best design of cultivation experiments (under controlled or field conditions), the standardization of robust protocols for sample harvesting, extraction, and chemical analysis, and the establishment of the most suitable workflow for data analysis, data integration (with other metadata or omics results, for example), and biological interpretation of results.

Supplementary Materials

The following supporting information can be downloaded at: https://www.mdpi.com/article/10.3390/agriculture14060855/s1, Figure S1: 1H Spectrum of yellow pea hydroalcoholic extract; Figure S2: 1H Spectrum of yellow pea hydroalcoholic extract, 0.9–3.2 ppm; Figure S3: 1H Spectrum of yellow pea hydroalcoholic extract, 3.2–5.5 ppm; Figure S4: 1H Spectrum of yellow pea hydroalcoholic extract, 5.5–7.7 ppm; Figure S5: 1H Spectrum of yellow pea hydroalcoholic extract, 7.7–9 ppm; Figure S6: Bidimensional 1H-1H TOCSY spectrum of yellow pea; Figure S7: Bidimensional 1H-13C HSQC spectrum of yellow pea; Table S1: Metabolites identified in the 1H NMR spectrum of the aqueous extracts of yellow peas; Figure S8A–D: Boxplot of significant variables (p < 0.05) in one-way ANOVA test; Figure S9: ASCA permutation test for time factor XA; Figure S10: Scores plot scatterplot for SC1 and SC2 for time factor XA.; Figure S11: ASCA scores plot scatterplot for SC1 and SC3 for time factor XA; Figure S12: Spearman’s correlation heatmap, ‘Eso’ cultivar, 40th day of harvest; Figure S13: Spearman’s correlation heatmap, ‘Eso’ cultivar, 50th day of harvest; Figure S14: Spearman’s correlation heatmap, ‘Eso’ cultivar, 60th day of harvest; Figure S15: Spearman’s correlation heatmap, ‘Eso’ cultivar, 70th day of harvest.

Author Contributions

Conceptualization, E.B., A.M., A.T., W.A. and F.M.; methodology and analysis, A.P., F.S, O.G., M.D.R. and F.M. software, A.P. and F.M.; validation, A.P., F.S., O.G. and M.D.R.; writing—review and editing, A.P., F.S., A.M. and E.B.; funding acquisition, E.B. and F.S. All authors have read and agreed to the published version of the manuscript.

Funding

This research was funded by SEED PNR 302_21_U-GOV.

Institutional Review Board Statement

Not applicable.

Data Availability Statement

Data supporting the results are included in the article. The datasets used and/or analyzed during the current study are available from the corresponding author on reasonable request.

Conflicts of Interest

The authors declare no conflicts of interest.

References

  1. Mbow, C.; Rosenzweig, C.; Barioni, L.G.; Benton, T.G.; Herrero, M.; Krishnapillai, M.; Liwenga, E.; Pradhan, P.; Rivera-Ferre, M.G.; Sapkota, T.; et al. Climate Change and Land: Summary for Policymakers. An IPCC Special Report on Climate Change, Desertification, Land Degradation, Sustainable Land Management, Food Security, and Greenhouse Gas Fluxes in Terrestrial Ecosystems 2019; Intergovernmental Panel on Climate Change (IPCC): Geneva, Switzerland, 2019. [Google Scholar]
  2. Zhang, H.; Yasmin, F.; Song, B.-H. Neglected Treasures in the Wild—Legume Wild Relatives in Food Security and Human Health. Curr. Opin. Plant Biol. 2019, 49, 17–26. [Google Scholar] [CrossRef] [PubMed]
  3. Mendel, G. Experiments in Plant Hybridization. Verhandlungen des Naturforschenden Vereines in Brünn, Bd. IV für das Jahr Abhandlungen, 3–47. 1865. Available online: http://www.esp.org/foundations/genetics/classical/gm-65.pdf (accessed on 12 September 2023).
  4. FAOSTAT. Available online: https://www.fao.org/faostat/en/#data/QV/visualize (accessed on 12 September 2023).
  5. Taherian, A.; Mondor, M.; Lamarche, F. Enhancing Nutritional Values and Functional Properties of Yellow Pea Protein via Membrane Processing. In Peas: Cultivation, Varieties and Nutritional Uses; Nova Science Publishers: Hauppauge, NY, USA, 2012; pp. 1–48. [Google Scholar]
  6. Kumari, T.; Deka, S.C. Potential Health Benefits of Garden Pea Seeds and Pods: A Review. Legume Sci. 2021, 3, e82. [Google Scholar] [CrossRef]
  7. Boye, J.; Zare, F.; Pletch, A. Pulse Proteins: Processing, Characterization, Functional Properties and Applications in Food and Feed. Food Res. Int. 2010, 43, 414–431. [Google Scholar] [CrossRef]
  8. Borreani, G.; Peiretti, P.G.; Tabacco, E. Effect of Harvest Time on Yield and Pre-Harvest Quality of Semi-Leafless Grain Peas (Pisum sativum L.) as Whole-Crop Forage. Field Crops Res. 2007, 100, 1–9. [Google Scholar] [CrossRef]
  9. Devi, J.; Sagar, V.; Mishra, G.P.; Jha, P.K.; Gupta, N.; Dubey, R.K.; Singh, P.M.; Behera, T.K.; Prasad, P.V.V. Heat Stress Tolerance in Peas (Pisum sativum L.): Current Status and Way Forward. Front. Plant Sci. 2023, 13, 1108276. [Google Scholar] [CrossRef] [PubMed]
  10. Weiss, E.; Zohary, D.; Hopf, M. Domestication of Plants in the Old World: The Origin and Spread of Domesticated Plants in Southwest Asia, Europe, and the Mediterranean Basin, 4th ed.; Oxford University Press: Oxford, UK, 2012; ISBN 978-0-19-954906-1. [Google Scholar]
  11. Wray, S.; Cenkowski, S. Nutritional Changes of Yellow Peas during Infrared Processing. Trans. ASAE 2002, 45, 1023–1027. [Google Scholar] [CrossRef]
  12. Nosworthy, M.G.; Franczyk, A.J.; Medina, G.; Neufeld, J.; Appah, P.; Utioh, A.; Frohlich, P.; House, J.D. Effect of Processing on the in Vitro and in Vivo Protein Quality of Yellow and Green Split Peas (Pisum sativum). J. Agric. Food Chem. 2017, 65, 7790–7796. [Google Scholar] [CrossRef] [PubMed]
  13. Mariotti, F.; Gardner, C.D. Dietary Protein and Amino Acids in Vegetarian Diets—A Review. Nutrients 2019, 11, 2661. [Google Scholar] [CrossRef] [PubMed]
  14. Searching in Database of Plant Varieties/the Czech National List. Available online: https://eagri.cz/public/app/sok/odrudyNouVF.do (accessed on 12 September 2023).
  15. Boye, J.I.; Ma, Z. Finger on the Pulse. Food Sci. Technol. 2012, 26, 20–24. [Google Scholar]
  16. Smith, C.E.; Mollard, R.C.; Luhovyy, B.L.; Anderson, G.H. The Effect of Yellow Pea Protein and Fibre on Short-Term Food Intake, Subjective Appetite and Glycaemic Response in Healthy Young Men. Br. J. Nutr. 2012, 108 (Suppl. 1), S74–S80. [Google Scholar] [CrossRef]
  17. Bellaio, S.; Zamprogna Rosenfeld, E.; Jacobs, M.; Basu, S.; Kappeler, S. PARGEM, the Technology for a New Family of Healthy, Safe, and Convenient Food Ingredients Based on Partial Germination. In Proceedings of the AACC International Annual Meeting, Hollywood, FL, USA, 30 September–3 October 2012. [Google Scholar]
  18. Deshpande, S.S. (Ed.) Toxicants and Antinutrients in Plant Foods. In Handbook of Food Toxicology; Chapter 10; CRC Press: Boca Raton, FL, USA, 2002; pp. 321–386. [Google Scholar]
  19. Lajolo, F.M.; Genovese, M.I.; Pryme, I.F.; Dale, T.M. Beneficial (Antiproliferative) Effects of Different Substances. Recent Advances of Research in Antinutritional Factors in Legume Seeds 8 of 9 | RIB EREAU ET AL. and Oilseeds. In Proceedings of the Fourth International Workshop on Antinutritional Factors in Legume Seeds and Oilseeds, Toledo, Spain, 8–10 March 2004; Muzquiz, M., Hill, G.D., Cuadrado, C., Pedrosa, M.M., Burbano, C., Eds.; Wageningen Academic Publishers: Wageningen, The Netherlands, 2004; pp. 123–135. [Google Scholar]
  20. Sciubba, F.; Tomassini, A.; Giorgi, G.; Brasili, E.; Pasqua, G.; Capuani, G.; Aureli, W.; Miccheli, A. NMR-Based Metabolomic Study of Purple Carrot Optimal Harvest Time for Utilization as a Source of Bioactive Compounds. Appl. Sci. 2020, 10, 8493. [Google Scholar] [CrossRef]
  21. Giampaoli, O.; Sciubba, F.; Conta, G.; Capuani, G.; Tomassini, A.; Giorgi, G.; Brasili, E.; Aureli, W.; Miccheli, A. Red Beetroot’s NMR-Based Metabolomics: Phytochemical Profile Related to Development Time and Production Year. Foods 2021, 10, 1887. [Google Scholar] [CrossRef]
  22. Hadrich, F.; Arbi, M.E.; Boukhris, M.; Sayadi, S.; Cherif, S. Valorization of the Peel of Pea: Pisum Sativum by Evaluation of Its Antioxidant and Antimicrobial Activities. J. Oleo Sci. 2014, 63, 1177–1183. [Google Scholar] [CrossRef] [PubMed]
  23. Wu, D.-T.; Li, W.-X.; Wan, J.-J.; Hu, Y.-C.; Gan, R.-Y.; Zou, L. A Comprehensive Review of Pea (Pisum sativum L.): Chemical Composition, Processing, Health Benefits, and Food Applications. Foods 2023, 12, 2527. [Google Scholar] [CrossRef] [PubMed]
  24. Spinelli, V.; Brasili, E.; Sciubba, F.; Ceci, A.; Giampaoli, O.; Miccheli, A.; Pasqua, G.; Persiani, A.M. Biostimulant Effects of Chaetomium globosum and Minimedusa polyspora Culture Filtrates on Cichorium intybus Plant: Growth Performance and Metabolomic Traits. Front. Plant Sci. 2022, 13, 879076. [Google Scholar] [CrossRef]
  25. Kim, H.K.; Choi, Y.H.; Verpoorte, R. NMR-Based Metabolomic Analysis of Plants. Nat. Protoc. 2010, 5, 536–549. [Google Scholar] [CrossRef] [PubMed]
  26. van Rooyen, J.; Marini, F.; Orth, S.H.; Oyeyinka, S.A.; Simsek, S.; Manley, M. Effect of wheat roasting conditions and wheat type on short-wave infrared (SWIR) spectral data of whole and milled wheat by ANOVA-simultaneous component analysis. Spectrochim. Acta Part A: Mol. Biomol. Spectrosc. 2023, 303, 123160. [Google Scholar] [CrossRef] [PubMed]
  27. Rust, A.; Marini, F.; Allsopp, M.; Williams, P.J.; Manley, M. Application of ANOVA-simultaneous component analysis to quantify and characterise effects of age, temperature, syrup adulteration and irradiation on near-infrared (NIR) spectral data of honey. Spectrochim. Acta Part A: Mol. Biomol. Spectrosc. 2021, 253, 119546. [Google Scholar] [CrossRef] [PubMed]
  28. Bevilacqua, M.; Bucci, R.; Materazzi, S.; Marini, F. Application of near infrared (NIR) spectroscopy coupled to chemometrics for dried egg-pasta characterization and egg content quantification. Food Chem. 2013, 140, 726–734. [Google Scholar] [CrossRef]
  29. Brown, M.B.; Forsythe, A.B. Robust Tests for the Equality of Variances. J. Am. Stat. Assoc. 1974, 69, 364–367. [Google Scholar] [CrossRef]
  30. Stevens, J.P. Intermediate Statistics: A Modern Approach; Routledge: London, UK, 2007; ISBN 978-0-8058-5465-7. [Google Scholar]
  31. Peluso, A.; Glen, R.; Ebbels, T.M.D. Multiple-Testing Correction in Metabolome-Wide Association Studies. BMC Bioinform. 2021, 22, 67. [Google Scholar] [CrossRef]
  32. Andreoli, V.; Bagliani, M.; Corsi, A.; Frontuto, V. Drivers of Protein Consumption: A Cross-Country Analysis. Sustainability 2021, 13, 7399. [Google Scholar] [CrossRef]
  33. Henchion, M.; Hayes, M.; Mullen, A.M.; Fenelon, M.; Tiwari, B. Future Protein Supply and Demand: Strategies and Factors Influencing a Sustainable Equilibrium. Foods 2017, 6, 53. [Google Scholar] [CrossRef] [PubMed]
  34. Payne, C.L.R.; Dobermann, D.; Forkes, A.; House, J.; Josephs, J.; McBride, A.; Müller, A.; Quilliam, R.S.; Soares, S. Insects as Food and Feed: European Perspectives on Recent Research and Future Priorities. J. Insects Food Feed 2016, 2, 269–276. [Google Scholar] [CrossRef]
  35. Mancini, S.; Moruzzo, R.; Riccioli, F.; Paci, G. European Consumers’ Readiness to Adopt Insects as Food. A Review. Food Res. Int. 2019, 122, 661–678. [Google Scholar] [CrossRef] [PubMed]
  36. Pursley, A.A.; Biligetu, B.; Warkentin, T.; Lardner, H.A.; Penner, G.B. Effect of Stage of Maturity at Harvest for Forage Pea (Pisum sativum L.) on Eating Behavior, Ruminal Fermentation, and Digestibility When Fed as Hay to Yearling Beef Heifers. Transl. Anim. Sci. 2019, 4, 149–158. [Google Scholar] [CrossRef]
  37. Shanthakumar, P.; Klepacka, J.; Bains, A.; Chawla, P.; Dhull, S.B.; Najda, A. The Current Situation of Pea Protein and Its Application in the Food Industry. Molecules 2022, 27, 5354. [Google Scholar] [CrossRef]
  38. Tömösközi, S.; Lásztity, R.; Haraszi, R.; Baticz, O. Isolation and Study of the Functional Properties of Pea Proteins. Nahrung 2001, 45, 399–401. [Google Scholar] [CrossRef]
  39. World Health Organization. Protein and Amino Acid Requirements in Human Nutrition. Report of a Joint WHO/FAO/UNU Expert Consultation; WHO Technical Report Series No. 935; WHO: Geneva, Switzerland, 2005. [Google Scholar]
  40. Han, Q.; Phillips, R.S.; Li, J. Editorial: Aromatic Amino Acid Metabolism. Front. Mol. Biosci. 2019, 6, 22. [Google Scholar] [CrossRef]
  41. Gorissen, S.H.M.; Crombag, J.J.R.; Senden, J.M.G.; Waterval, W.A.H.; Bierau, J.; Verdijk, L.B.; van Loon, L.J.C. Protein Content and Amino Acid Composition of Commercially Available Plant-Based Protein Isolates. Amino Acids 2018, 50, 1685–1695. [Google Scholar] [CrossRef]
  42. Hausler, R.E.; Ludewig, F.; Krueger, S. Amino Acids—A Life between Metabolism and Signaling. Plant Sci. 2014, 229, 225–237. [Google Scholar] [CrossRef] [PubMed]
  43. Hildebrandt, T.M.; Nunes Nesi, A.; Araújo, W.L.; Braun, H.P. Amino Acid Catabolism in Plants. Mol. Plant 2015, 8, 1563–1579. [Google Scholar] [CrossRef] [PubMed]
  44. Veselova, T.V.; Veselovsky, V.A.; Obroucheva, N.V. Deterioration Mechanisms in Air-Dry Pea Seeds during Early Aging. Plant Physiol. Biochem. 2015, 87, 133–139. [Google Scholar] [CrossRef] [PubMed]
  45. Weijzen, M.E.G.; van Gassel, R.J.J.; Kouw, I.W.K.; Trommelen, J.; Gorissen, S.H.M.; van Kranenburg, J.; Goessens, J.P.B.; van de Poll, M.C.G.; Verdijk, L.B.; van Loon, L.J.C. Ingestion of Free Amino Acids Compared with an Equivalent Amount of Intact Protein Results in More Rapid Amino Acid Absorption and Greater Postprandial Plasma Amino Acid Availability without Affecting Muscle Protein Synthesis Rates in Young Adults in a Double-Blind Randomized Trial. J. Nutr. 2022, 152, 59–67. [Google Scholar] [CrossRef] [PubMed]
  46. Schwender, J.; Ohlrogge, J.; Shachar-Hill, Y. Understanding flux in plant metabolic networks. Curr. Opin. Plant Biol. 2004, 7, 309–317. [Google Scholar] [CrossRef] [PubMed]
  47. Allen, M.R.; Frame, D.J.; Huntingford, C.; Jones, C.D.; Lowe, J.A.; Meinshausen, M.; Meinshausen, N. Warming caused by cumulative carbon emissions towards the trillionth tonne. Nature 2009, 458, 1163–1166. [Google Scholar] [CrossRef]
  48. Lahuta, L.B.; Górecki, R.J.; Zalewski, K.; Hedley, C.L. Sorbitol Accumulation during Natural and Accelerated Ageing of Pea (Pisum sativum L.) Seeds. Acta Physiol. Plant 2007, 29, 527–534. [Google Scholar] [CrossRef]
  49. Salvi, P.; Varshney, V.; Majee, M. Raffinose Family Oligosaccharides (RFOs): Role in Seed Vigor and Longevity. Biosci. Rep. 2022, 42, BSR20220198. [Google Scholar] [CrossRef]
  50. Horbowicz, M.; Obendorf, R.L. Seed Desiccation Tolerance and Storability: Dependence on Flatulence-Producing Oligosaccharides and Cyclitols—Review and Survey. Seed Sci. Res. 1994, 4, 385–405. [Google Scholar] [CrossRef]
  51. Kanwal, F.; Ren, D.; Kanwal, W.; Ding, M.; Su, J.; Shang, X. The Potential Role of Nondigestible Raffinose Family Oligosac-Charides as Prebiotics. Glycobiology 2023, 33, 274–288. [Google Scholar] [CrossRef] [PubMed]
  52. Elango, D.; Rajendran, K.; Van der Laan, L.; Sebastiar, S.; Raigne, J.; Thaiparambil, N.A.; El Haddad, N.; Raja, B.; Wang, W.; Ferela, A.; et al. Raffinose Family Oligosaccharides: Friend or Foe for Human and Plant Health? Front. Plant Sci. 2022, 13, 829118. [Google Scholar] [CrossRef] [PubMed]
  53. Loewus, F.A. Phytate Metabolism with Special Reference to Its Myo-Inositol Component. In Mobilization of Reserves in Germination; Nozzolillo, C., Lea, P.J., Loewus, F.A., Eds.; Recent Advances in Phytochemistry; Springer: Boston, MA, USA, 1983; pp. 173–192. ISBN 978-1-4684-1167-6. [Google Scholar]
  54. Bohn, L.; Meyer, A.S.; Rasmussen, S.K. Phytate: Impact on Environment and Human Nutrition. A Challenge for Molecular Breeding. J. Zhejiang Univ. Sci. B 2008, 9, 165–191. [Google Scholar] [CrossRef] [PubMed]
  55. Schlemmer, U.; Frølich, W.; Prieto, R.M.; Grases, F. Phytate in Foods and Significance for Humans: Food Sources, Intake, Processing, Bioavailability, Protective Role and Analysis. Mol. Nutr. Food Res. 2009, 53 (Suppl. 2), S330–S375. [Google Scholar] [CrossRef]
  56. Muzquiz, M.; Varela, A.; Burbano, C.; Cuadrado, C.; Guillamon, E.; Pedrosa, M.M. Bioac-Tive Compounds in Legumes: Pronutritive and Antinutritive Actions, Implications for Nutrition and Health. Phytochem. Rev. 2012, 11, 227–244. [Google Scholar] [CrossRef]
  57. Wink, M. Evolution of Secondary Metabolites in Legumes (Fabaceae). S. Afr. J. Bot. 2013, 89, 164–175. [Google Scholar] [CrossRef]
  58. De-la-Cruz Chacón, I.; Riley-Saldaña, C.A.; González-Esquinca, A.R. Secondary Metabolites during Early Development in Plants. Phytochem. Rev. 2013, 12, 47–64. [Google Scholar] [CrossRef]
  59. Kumar, N.; Goel, N. Phenolic acids: Natural versatile molecules with promising therapeutic applications. Biotechnol. Rep. 2019, 20, e00370. [Google Scholar] [CrossRef]
  60. Stuper-Szablewska, K.; Perkowski, J. Phenolic acids in cereal grain: Occurrence, biosynthesis, metabolism and role in living organisms. Crit. Rev. Food Sci. Nutr. 2019, 59, 664–675. [Google Scholar] [CrossRef]
  61. El-El-Seedi, H.R.; Taher, E.A.; Sheikh, B.Y.; Anjum, S.; Saeed, A.; AlAjmi, M.F.; Moustafa, M.S.; Al-Mousawi, S.M.; Farag, M.A.; Hegazy, M.-E.F.; et al. Hydroxycinnamic acids: Natural sources, biosynthesis, possible biological activities, and roles in Islamic medicine. In Studies in Natural Products Chemistry; Elsevier: Amsterdam, The Netherlands, 2018; Volume 55, pp. 269–292. [Google Scholar] [CrossRef]
  62. Thakur, M.; Bhattacharya, S.; Khosla, P.K.; Puri, S. Improving production of plant secondary metabolites through biotic and abiotic elicitation. J. Appl. Res. Med. Aromat. Plants 2019, 12, 1–12. [Google Scholar] [CrossRef]
  63. Witte, C.-P.; Herde, M. Nucleotide Metabolism in Plants. Plant Physiol. 2020, 182, 63–78. [Google Scholar] [CrossRef]
  64. Roy, F.; Boye, J.I.; Simpson, B.K. Bioactive Proteins and Peptides in Pulse Crops: Pea, Chickpea and Lentil. Food Res. Int. 2010, 43, 432–442. [Google Scholar] [CrossRef]
  65. Espíndola, K.M.M.; Ferreira, R.G.; Narvaez, L.E.M.; Silva Rosario, A.C.R.; da Silva, A.H.M.; Silva, A.G.B.; Vieira, A.P.O.; Monteiro, M.C. Chemical and Pharmacological Aspects of Caffeic Acid and Its Activity in Hepatocarcinoma. Front. Oncol. 2019, 9, 541. [Google Scholar] [CrossRef] [PubMed]
  66. Chua, L.S. A Review on Plant-Based Rutin Extraction Methods and Its Pharmacological Activities. J. Ethnopharmacol. 2013, 150, 805–817. [Google Scholar] [CrossRef] [PubMed]
  67. Zhou, J.; Chan, L.; Zhou, S. Trigonelline: A Plant Alkaloid with Therapeutic Potential for Diabetes and Central Nervous System Disease. Curr. Med. Chem. 2012, 19, 3523–3531. [Google Scholar] [CrossRef] [PubMed]
  68. Tohge, T.; Watanabe, M.; Hoefgen, R.; Fernie, A. Shikimate and Phenylalanine Biosynthesis in the Green Lineage. Front. Plant Sci. 2013, 4, 62. [Google Scholar] [CrossRef]
  69. Ahmad, M.; Qureshi, S.; Akbar, M.H.; Siddiqui, S.A.; Gani, A.; Mushtaq, M.; Hassan, I.; Dhull, S.B. Plant-Based Meat Alternatives: Compositional Analysis, Current Development and Challenges. Appl. Food Res. 2022, 2, 100154. [Google Scholar] [CrossRef]
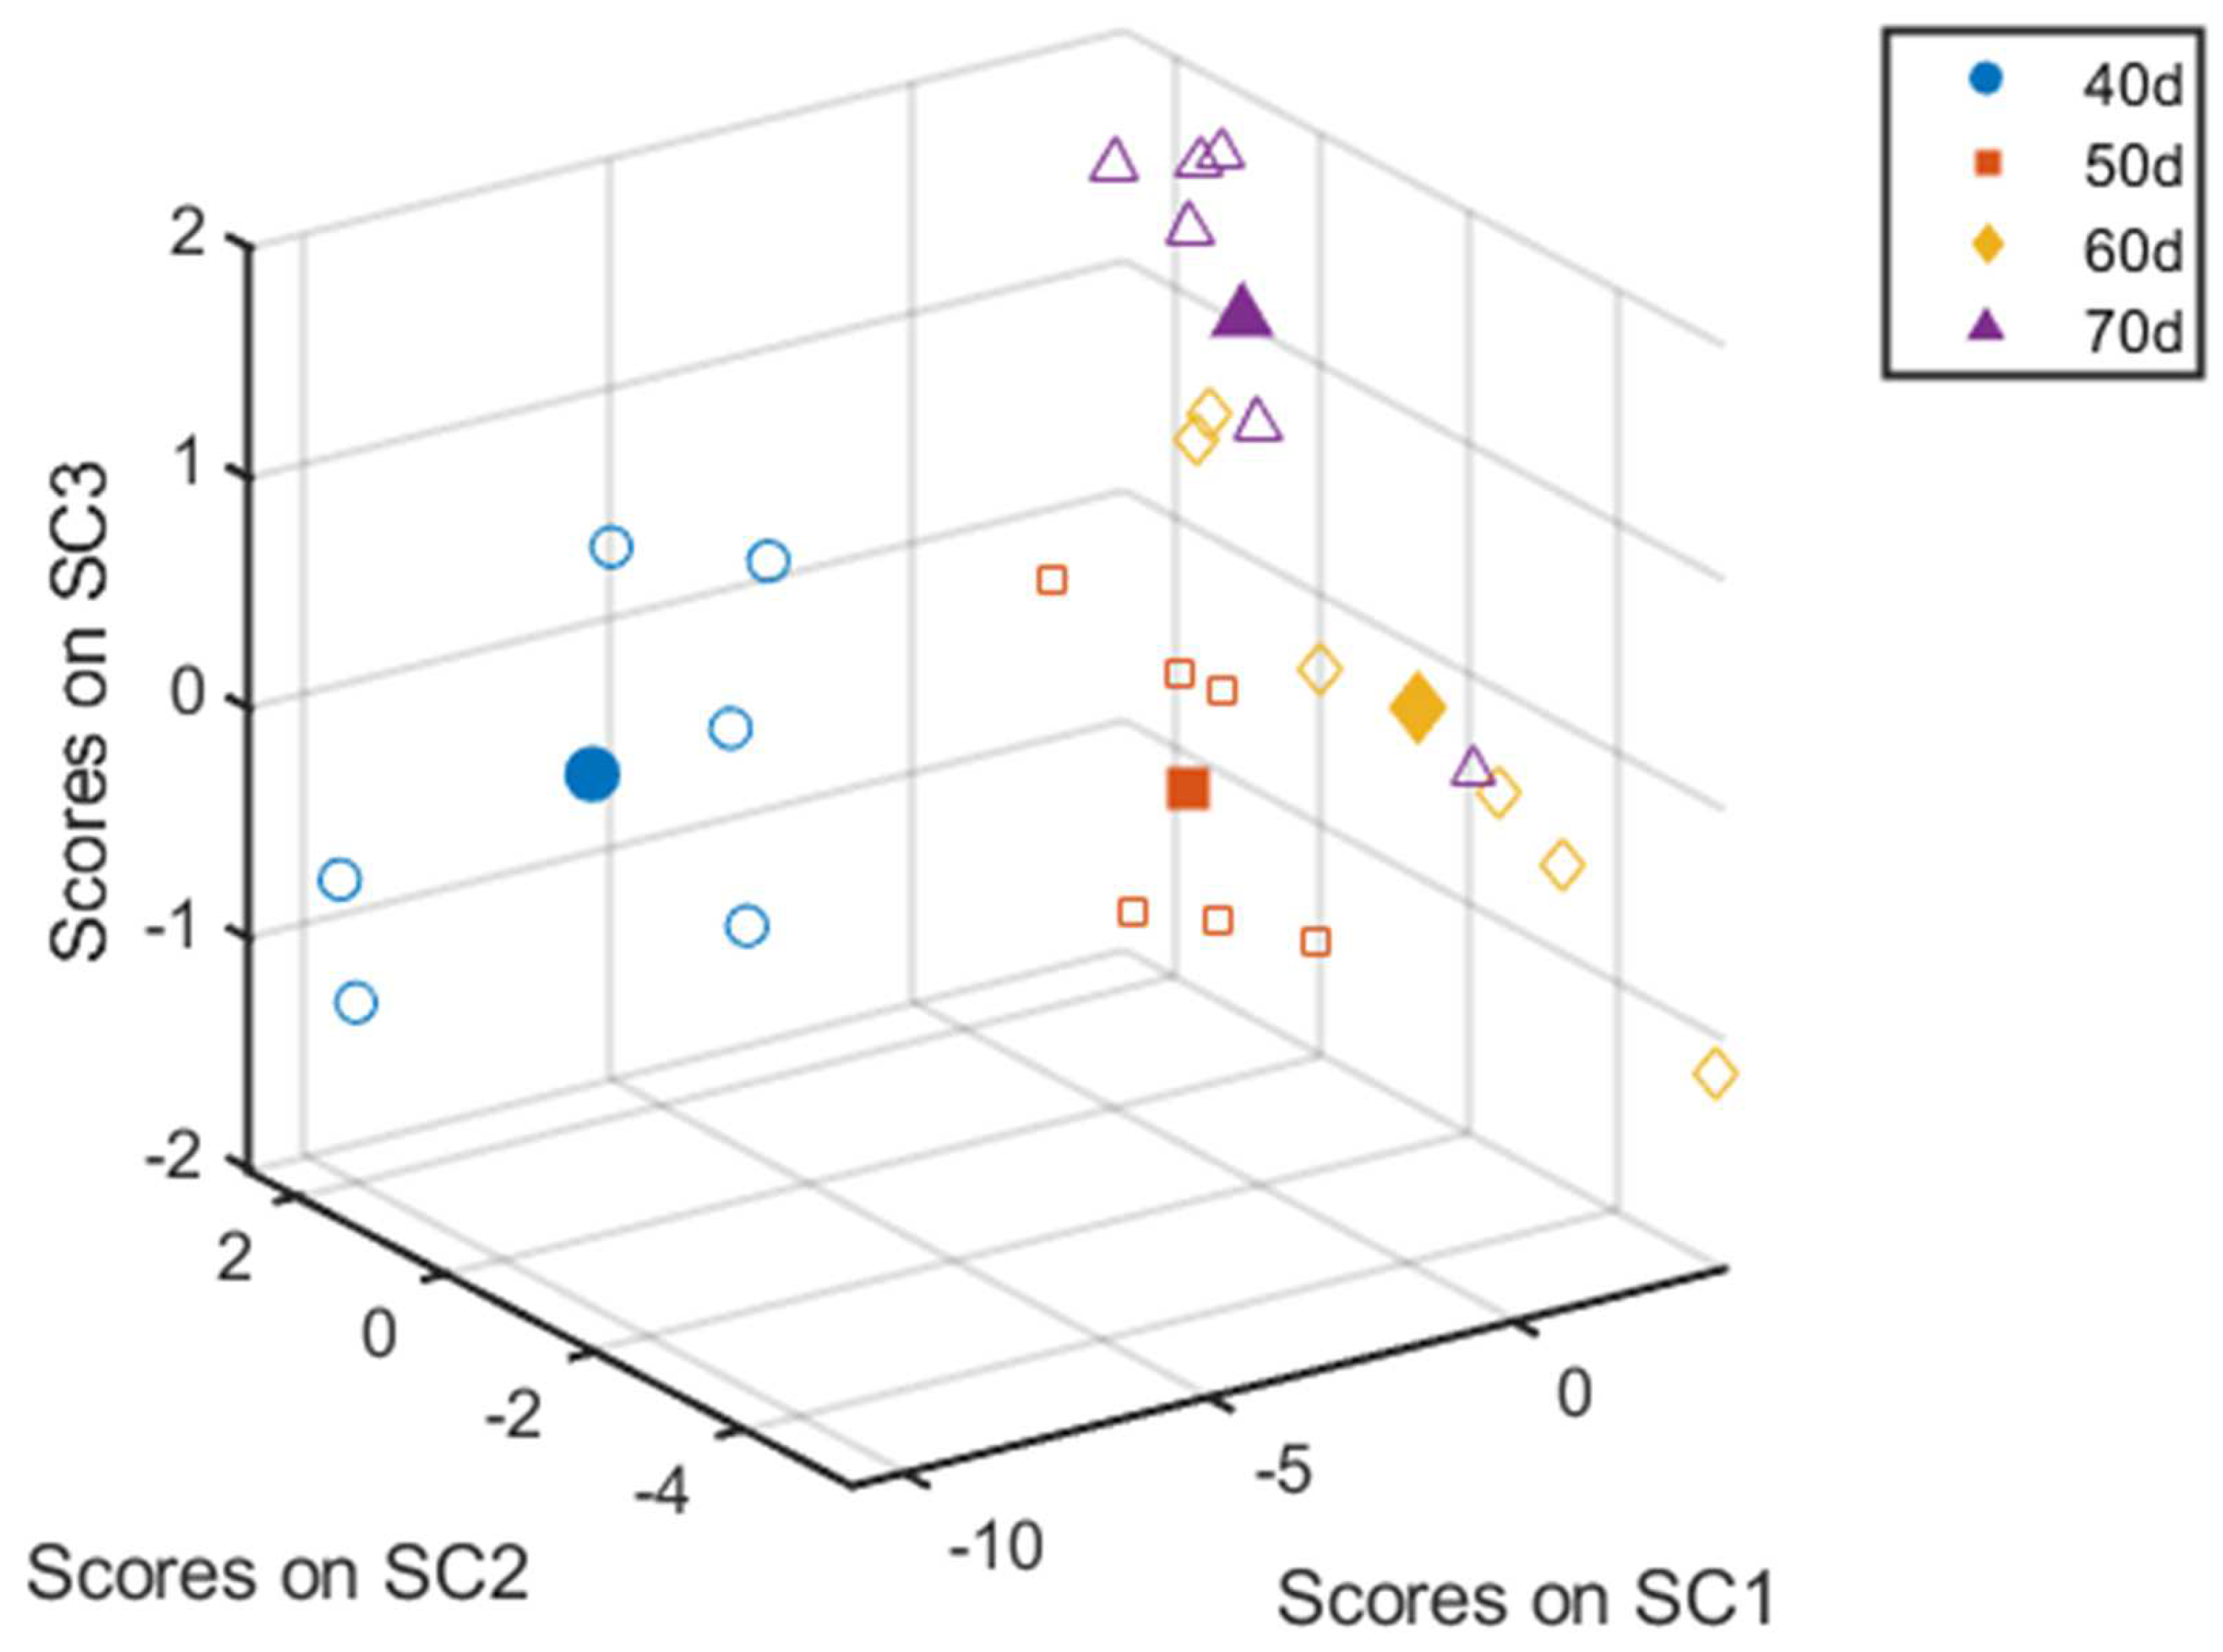
Figure 1. ASCA Scores plot for SC1, SC2, and SC3 for time factor XA, accounting for, respectively, 93.94%, 3.92%, and 2.14% of explained variance. Filled symbols are scores for each factor level, while empty ones are scores after projection of the residuals.
Agriculture 14 00855 g001
Figure 2. Plots of ASCA Scores along SC1, SC2, and SC3 (accounting for respectively 93.94%, 3.92%, and 2.14% of the explained variance) for time factor XA as a function of harvesting time.
Agriculture 14 00855 g002
Figure 3. ASCA loadings plot on SC1 for time factor XA. Significant variables are reported in red, whose confidence bounds do not cross the threshold of 0.
Agriculture 14 00855 g003
Figure 4. ASCA loadings plot SC2 for time factor XA. Significant variables are reported in red, whose confidence bounds do not cross the threshold of 0.
Agriculture 14 00855 g004
Figure 5. ASCA loadings plot on SC3 for time factor XA. Significant variables are reported in red, whose confidence bounds do not cross the threshold of 0.
Agriculture 14 00855 g005
Table 1. Quantification of each metabolite from the 1H spectrum and significance with the ANOVA test. The significant variables of the ANOVA test were indicated with “a”, “b”, “c”, and “d” for the significant differences in one way-ANOVA with p < 0.05.
MoleculeAmount (mg/100 g)
40th Day of Harvest50th Day of Harvest60th Day of Harvest70th Day of Harvest
Amino Acids
Arginine246.392 ± 32.61 a73.76 ± 13.54 b70.87 ± 27.21 b90.78 ± 23.28 b
Glutamate168.086 ± 67.492 a0.702 ± 0.294 b0.547 ± 0.472 b4.73 ± 7.17 b
Alanine162.031 ± 52.503 a1.647 ± 0.385 b1.685 ± 1.01 b2.421 ± 0.918 b
Aspartate105.176 ± 22.558 a46.88 ± 9.091 b38.87 ± 17.67 b38.85 ± 16.27 b
GABA84.714 ± 20.612 a0.212 ± 0.133 b0.476 ± 0.073 b1.01 ± 1.09 b
Threonine77.822 ± 28.036 a1.354 ± 0.152 b2.762 ± 1.858 b4.591 ± 4.359 b
Glutamine71.953 ± 10.192 a36.897 ± 4.994 b27.178 ± 6.197 b31.96 ± 4.95 b
Valine34.402 ± 8.278 a2.264 ± 0.239 b1.389 ± 0.257 b2.521 ± 1.513 b
Asparagine28.834 ± 6.777 a15.09 ± 2.545 b12.423 ± 3.855 b12.9 ± 2.37 b
Isoleucine19.149 ± 7.976 a0.792 ± 0.094 b0.507 ± 0.095 b0.902 ± 0.569 b
Phenylalanine8.662 ± 5.512 a4.732 ± 0.575 a3.446 ± 0.467 b4.296 ± 1.031 a
Leucine5.481 ± 3.046 a0.799 ± 0.044 b0.664 ± 0.153 b0.778 ± 0.232 b
Tyrosine5.087 ± 2.572 a1.375 ± 0.189 b0.732 ± 0.075 b1.346 ± 0.857 b
Lysine4.449 ± 0.989 a0.679 ± 0.063 b0.585 ± 0.143 b0.953 ± 0.455 b
Histidine3.544 ± 4.204 a7.354 ± 0.625 b6.608 ± 1.192 a7.233 ± 0.746 a
Tryptophan1.459 ± 1.366 a2.413 ± 0.3 a1.628 ± 0.489 a1.774 ± 0.447 a
Organic Acids
Citric acid73.891 ± 7.924 a82.547 ± 17.109 a74.546 ± 18.95 a88.409 ± 16.729 a
Acetic acid46.783 ± 8.94 a1.137 ± 0.14 b1.508 ± 0.468 b1.688 ± 0.85 b
4-Hydroxycinnamic acid3.436 ± 0.889 a1.698 ± 0.163 b1.666 ± 0.524 b1.759 ± 0.206 b
Succinic acid3.059 ± 1.287 a0.532 ± 0.323 b0.294 ± 0.232 b0.556 ± 0.148 b
Caffeic Acid1.545 ± 0.324 a1.016 ± 0.126 a0.921 ± 0.273 b0.968 ± 0.239 b
Malic acid1.415 ± 0.276 a1.573 ± 0.289 a1.46 ± 0.445 a1.961 ± 0.308 a
Hydroxyphenylacetic acid1.133 ± 0.173 a1.072 ± 0.153 a1.074 ± 0.212 a1.161 ± 0.106 a
Fumaric acid0.861 ± 0.36 a0.111 ± 0.01 b0.098 ± 0.035 b0.136 ± 0.043 b
Formic acid0.394 ± 0.066 a0.198 ± 0.04 b0.111 ± 0.037 b0.126 ± 0.02 b
Carbohydrates
Sucrose2569 ± 241.83 a1017.7 ± 83.47 b804.3 ± 201.97 b1021.7 ± 134.9 b
Oligosaccharides 430.86 ± 35.36 a1042 ± 150.99 b944.9 ± 241.81 b1193 ± 190.76 b
Xilose43.641 ± 19.669 a13.354 ± 3.239 b7.794 ± 1.967 b11.586 ± 2.725 b
Galactose7.125 ± 0.563 a4.162 ± 0.527 b3.231 ± 1.023 b3.687 ± 0.878 b
Glucose5.514 ± 1.413 a0.569 ± 0.151 b0.735 ± 0.298 b0.947 ± 0.668 b
Verbascose1.425 ± 0.323 a1.301 ± 0.126 a1.303 ± 0.266 a1.395 ± 0.349 a
Other Compounds
Trigonelline14.27 ± 2.39 a30.53 ± 3.60 b28.059 ± 8.99 b27.896 ± 4.332 b
Choline6.49 ± 1.97 a23.852 ± 3.094 b21.917 ± 5.062 b22.654 ± 3.257 b
Phytate4.33 ± 1.78 a305.284 ± 38.07 b264.56 ± 69.41 b346.66 ± 55.00 b
Rutin-Glycoside4.12 ± 0.577 a2.385 ± 0.339 b2.132 ± 0.757 b2.124 ± 0.589 b
Adenosine Phosphate3.59 ± 0.275 a3.763 ± 0.542 a2.718 ± 0.904 c3.77 ± 0.537 d
Guanosine Phosphate2.65 ± 0.437 a1.663 ± 0.312 b0.937 ± 0.331 c1.107 ± 0.206 b
Indole-3-Acetic acid2.21 ± 1.16 a2.876 ± 0.324 a2.026 ± 0.602 a2.292 ± 0.408 a
Uridine Phosphate0.352 ± 0.114 a3.97 ± 0.477 b3.38 ± 0.602 b3.592 ± 1.266 b
Uridine0.197 ± 0.03 a2.85 ± 0.166 b2.673 ± 0.5 b2.921 ± 0.358 b
Disclaimer/Publisher’s Note: The statements, opinions and data contained in all publications are solely those of the individual author(s) and contributor(s) and not of MDPI and/or the editor(s). MDPI and/or the editor(s) disclaim responsibility for any injury to people or property resulting from any ideas, methods, instructions or products referred to in the content.