Article

Estimation of Energy Balance throughout the Growing–Finishing Stage of Pigs in an Experimental Pig Barn

1
Department of Biosystems Engineering, Institute of Smart Farm, Gyeongsang National University, Jinju 52828, Republic of Korea
2
Department of Environmental Science and Disaster Management, Noakhali Science and Technology University, Noakhali 3814, Bangladesh
3
Future Regions Research Centre, Ararat Jobs and Technology Precinct, Federation University, Ballarat 3350, Australia
4
Department of Smart Farm, Institue of Smart Farm, Gyeongsang National University, Jinju 52828, Republic of Korea
*
Author to whom correspondence should be addressed.
Agriculture 2024, 14(6), 862; https://doi.org/10.3390/agriculture14060862
Submission received: 27 March 2024 / Revised: 27 May 2024 / Accepted: 28 May 2024 / Published: 30 May 2024
(This article belongs to the Section Farm Animal Production)

Abstract

:
Monitoring the energy inputs and outputs in pig production systems is crucial for identifying potential imbalances and promoting energy efficiency. Therefore, the objective of this study was to measure the energy input, output, and losses during the growing–finishing phase of pigs from 1 September to 1 December 2023. A Livestock Environment Management System (LEMS) was used to measure the temperature, humidity, airflow, and water consumption levels inside the barn, and a load cell was used to measure the body weight of pigs. Furthermore, a bomb calorimetric test was conducted to measure the energy content of pigs’ manure. While calculating energy balance in the experimental barn, it was found that energy from feed and water contributed approximately 81% of the total input energy, while the remaining 19% of energy came from electrical energy. Regarding output energy, manure, and body weight accounted for about 69%, while around 31% was lost due to pig activities, maintaining barn temperature and airflow, and illuminating the barn. In conclusion, this study suggested methods to calculate energy balance in pig barns, offering valuable insights for pig farmers to enhance their understanding of input and output energy in pig production.

1. Introduction

Energy resources such as fossil fuels (e.g., coal, oil, and natural gas), nuclear energy, and renewable energy (e.g., solar and wind) are used to generate energy [1,2]. Currently, fossil fuels dominate this production, meeting 75–85% of the world’s energy demand, while nuclear and renewable sources contribute smaller shares of 5–10% and 2–10%, respectively [3]. However, fossil fuels are finite, and their use significantly contributes to environmental issues such as air pollution and greenhouse gas emissions, exacerbating climate change [4,5]. Therefore, it is important to use energy sustainably, and achieving a balance between the input and output is crucial. In terms of total energy consumption, the industrial sector is estimated to be the highest consumer of energy, accounting for 45–50%, followed by transportation (15–30%), residential and commercial (15–22%), agriculture (5–10%), and public services (5–10%) [6,7].
Within agriculture, the livestock sector is a notable energy consumer, utilising energy for feed production, animal transportation, and barn management [8]. Fossil energy, in particular, is crucial in producing, processing, and transporting animal feeds, which constitute over 70% of the total energy used in livestock operations [9,10]. Moreover, the energy requirement for managing livestock barns and their growth depends on a variety of purposes, including the location of the barn, climate conditions around the barn area, barn structures and materials used in the barn, and the species of livestock [11,12]. Additionally, among different livestock species, pigs are the highest consumer of energy [13]. This high energy use is due to their homeothermic nature, requiring an average environmental temperature range of 16–25 °C needed to maintain their well−being [14]. Pigs need substantial energy to regulate their body temperature, support growth, and carry out daily activities. All biological activities of pigs are dependent on body temperature, which boosts the rate of metabolic processes. Otherwise, their biological activity may fail, and pigs will not grow properly [15,16]. For this reason, pig barns located in colder regions require more energy to maintain the barn environment compared to other animal barns [17]. For instance, South Korea experiences cold temperatures for approximately 8–9 months of the year, as the country is located in a colder region, and the pork production volume in South Korea increased by 17.45% from 2015 to 2021, which could be attributed in part to the high demand for pork [18]. To meet this demand, an optimal temperature and humidity level in pig barns need to be maintained. Consequently, pig production in Korea is the highest consumer of energy among the livestock sectors [18]. However, since South Korea has limited domestic fossil fuel resources, the country imports energy resources from other countries to meet its requirements [19]. Therefore, it is important to consider ways to increase the efficiency of energy use in this sector to support sustainable pig production practices and reduce the use of non−renewable energy. To promote sustainable pig production, it is essential to measure and optimise energy use in pig barns.
The energy balance in a pig barn encompasses the energy consumed through feed and the energy expended in activities such as movement, growth, thermoregulation, and metabolism [20]. Monitoring this balance helps identify inefficiencies and areas for improvement. Key factors in optimising energy use include maintaining appropriate temperature and humidity levels, providing suitable bedding, and addressing health issues that affect energy utilisation [21,22]. Therefore, by regularly monitoring the energy flow of a pig barn, it is possible to optimise energy use and promote energy efficiency.
Despite existing research on energy flows in pig barns, there remains a need for comprehensive studies focusing on the growing–finishing phase, which has higher energy requirements compared to other phases of the pig life cycle [23]. For example, growing–finishing pigs have higher energy requirements than lactating pigs [17]. Moreover, the feed energy consumption by pigs increased with the increase in age, with the highest at the growing–finishing phase [14,24]. Similarly, the water consumption rate is also high in the growing–finishing phases of pigs, which leads to the highest energy consumption in this phase [25]. To better understand the energy input and output in the growing–finishing phase, monitoring energy balance is important. However, previous studies often limited their scope to specific energy uses like ventilation, heating, water as well as feed energy required for pig growth [17,23,25] and they did not fully account for energy losses due to pig activities or the energy generated by pig manure. Additionally, they did not use any specific materials such as expanded polystyrene that could promote energy efficiency while maintaining the barn environment in pig production. Despite numerous studies regarding energy balance in pig barns, the detailed investigation of energy input, energy output, energy loss by the pig activities, and materials that promote efficient energy use for barn environment management in the growing–finishing phase of pigs are still limited.
Therefore, the objective of the current study is to compute the energy balance during the growing–finishing phase of pigs in an experimental pig barn. Specifically, this study aimed to calculate input energy from feed, heating, ventilation, light, and water, as well as output energy from pig body weight and manure, and address the energy losses resulting from physical activity, fasting heat production, barn airflow maintenance, and water wastage by pigs.

2. Materials and Methods

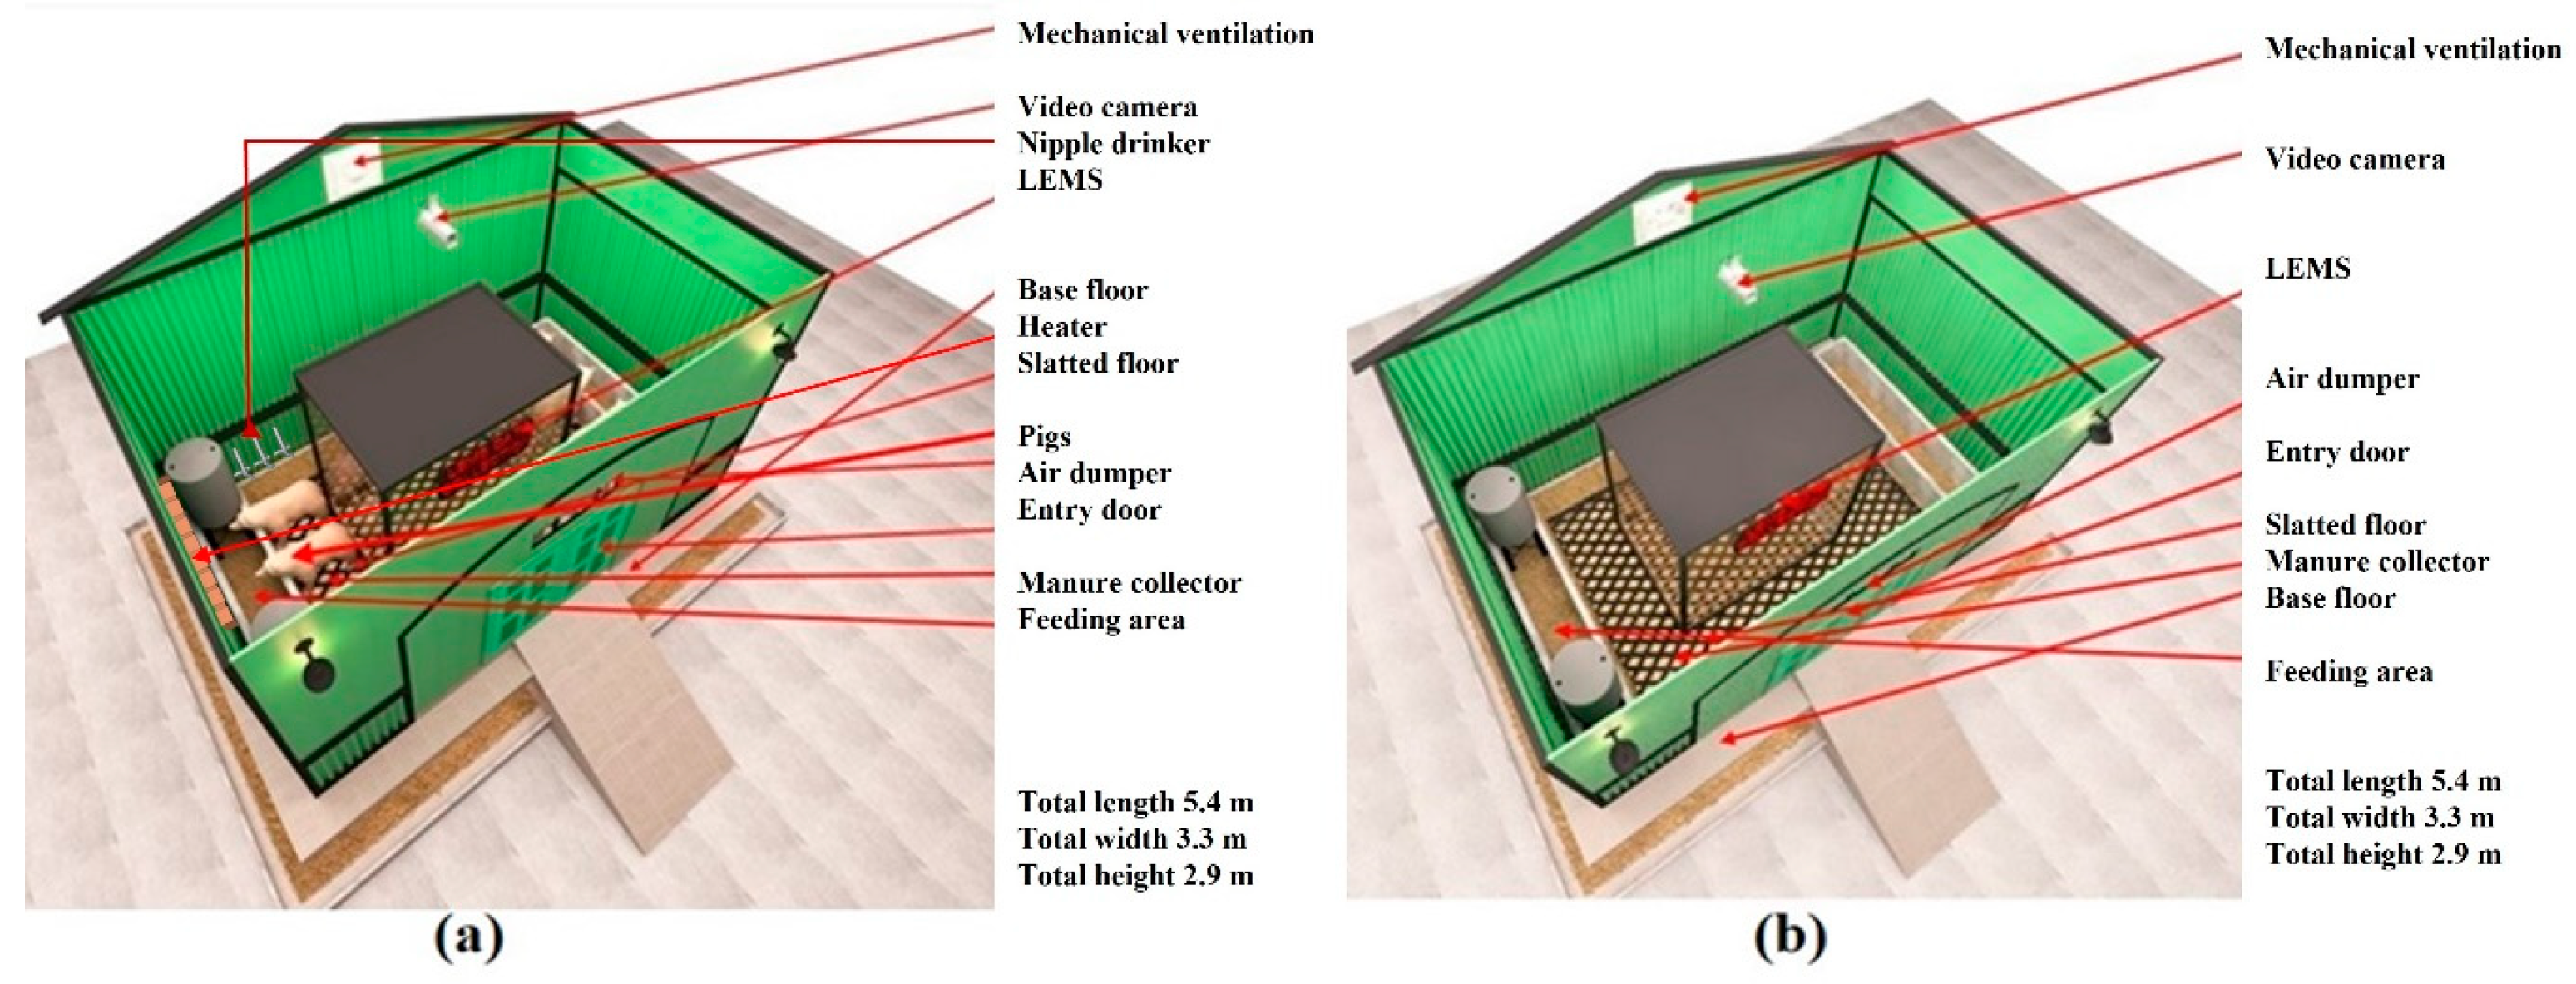
2.1. Experimental Pig Barn Features

This study was conducted in two experimental pig barns located at the Smart Farm Systems Laboratory (SFSL) at Gyeongsang National University (latitude 35°9′6.14″ N, longitude 128°5′44.40″ E, and altitude 44 m). Each barn had dimensions that were 5.4 m in length, 3.3 m in width, and 2.9 m in height, resulting in the total area of the barn being 17.82 m2. The walls and ceiling were made of expanded polystyrene materials, which is significantly better than other materials such as concrete to prevent heat loss [26], and had a thickness of 5 cm, while the slatted floor was made of plastic and positioned 40 cm above ground level. Two stainless steel boxes were placed underneath the slatted floor to collect manure, and each box covered half of the area of the slatted floor. The barns were equipped with a ventilated exhaust fan (Daeryun Industry Co., Ltd., Wanjusandan, Republic of Korea) opposite the main entrance, which was placed 1.44 m above the ground. An air damper was also installed over the front door at a height of 1.77 m above the base floor, to ensure smooth airflow with a flow rate of 0.17 m3/s.

2.2. Experimental Design and Data Collection Process

This research was carried out as an independent experiment with a group of six 65−day−old Yorkshire breed pigs from 1 September to 1 December 2023. Two pig barns were used throughout the experiment period, namely the experimental pig barn (B1) and an empty pig barn (B2), as depicted in Figure 1. The B1 was used to raise the pigs, while B2 was left empty where no pigs were reared and used to compare environmental parameters with B1. The environmental parameters, including temperature (°C) and humidity (%), were recorded in both barns at 10 min intervals using a Livestock Environment Management System (LEMS). A small room was attached to B1 for monitoring data collection systems, observing the pig’s behaviour, and addressing any potential health problems. Moreover, a water pump and tank were installed outside of B1 to meet the necessary water requirements of the pigs. Several measures were taken to provide a suitable environment for the pigs during the experiment. Firstly, proper illumination of the B1 during daytime was achieved by the installation of four lights in the ceiling. Secondly, a heating system was installed in B1 to maintain comfortable temperature and humidity levels inside the barn. The heating system was placed 1.3 m above the ground to the wall that is next to the entrance door. Before the start of the experiment, the research team visited several commercial barns to discuss temperature and humidity fluctuations inside the barn with the farm’s consultant. According to the consultants’ suggestions, the experimental period was selected to coincide with optimal environmental conditions in the barn. Furthermore, external environmental parameters, including temperature and humidity data, were recorded at 10 min intervals using a highly advanced weather sensor produced by Campbell Scientific, which is located in the Logan, UT, USA (MetPRO).
In this study period, a group of six pigs with nearly equal weights (31 ± 0.85 kg on average) were chosen and provided a diet known as the Growing Pigs Late Feed 10 as shown in Table 1. In the B1, the pigs were housed in a specially designed slatted floor, which was equipped with both feeding and drinking apparatus. To assure an equal distribution of diet between all pigs, the diet was provided according to 5% of their body weight twice a day, at 9 a.m. and 5 p.m., as suggested by Basak et al. [27]. The consumption of feed was calculated based on daily records of the feed provided and the amount left in the feeder. Moreover, the feeder was equipped with a load cell to accurately measure the weight of the pigs, which was determined by computing the average of the weights recorded twice a day. Furthermore, to ensure smooth water drinking for any size of pig, three nipple drinkers with different heights were installed inside the B1. To measure the amount of water consumed by the pigs, a water flow meter was installed outside the B1, which was connected to the nipple drinkers. Additionally, a sink was installed below the nipple drinkers to collect the wastewater directly into the wastewater tank, and a digital balance was used to measure the weight of the water automatically. Moreover, the waste products of the pigs, including urine and feces, were cleaned at 23−day intervals based on the capacity of the manure box. A digital balance was installed underneath the manure box to measure the weight of the manure at 24 h intervals.

2.2.1. Growing–Finishing Phase of Pigs

In this experiment, the growing–finishing phase of pigs was divided into four growing phases, designated as growing phase 1 (GP1), growing phase 2 (GP2), growing phase 3 (GP3), and growing phase 4 (GP4), with each growing phase consisting of 23 days. The input, output, and loss of energy in the B1 were calculated and compared among each growing phase. In this study, each growing phase was divided by following the process of Mihina et al. [13]. Mihina et al. [13] experimented to study the variation of GHG emissions in the growing–finishing phase of poultry, where they divided the growing–finishing phase into four growing phases (each consisting of 10 days).

2.2.2. Calculation of Input Energy

In this study, the feed and electrical energy (light, ventilation, heating, and pumping water) are considered input energy.

Feed Energy

In this experimental session, the Growing Pigs Late Feed 10 diet was provided as pig feed. The amount of component content per kg of feed was determined from the package level, as shown in Table 1. As per the manufacturer’s description, 1 kg of feed contained 3500 kilocalories (14.7 MJ). The amount of feed energy provided during the experiment period was calculated using Equation (1).
EF   ( MJ ) = FA ( kg )   ×   14.7   ( MJ kg )
where EF is the energy intake through feed and FA is the amount of feed intake by pigs. The consumption of feed was calculated based on daily records of the feed provided and the amount left in the feeder. Moreover, the feed intake was measured using the total mean of the 6 pigs’ group.

Electrical Energy

During the experimental period, a 500−watt electrical heating system was operated to maintain the temperature and humidity levels inside the barn, and four 100−watt lights were utilised to illuminate the barn during the day. A 350−watt ventilation fan was used to ensure smooth airflow (measured average flow rate of 0.17 m3/s) inside the B1, which is aligned with the study of Basak et al. [27]. Heating was not required during the growing phase 1 due to favourable temperature and humidity conditions. However, in growing phase 2, the heater was used for 15 h (6 p.m.–9 a.m.), and in growing phase 3, it was used for 19 h (4 p.m.–11 a.m.). During growing phase 4, heating was provided continuously for 24 h. Additionally, the lights were turned on from 8 a.m. to 6 p.m., and the ventilation fan ran continuously for 24 h in all growing phases. Therefore, the energy usage for heating, light, and ventilation was calculated using Equation (2).
EH   or   EL   or   EV ( MJ ) = P ( w )   ×   T   ( s )   ×   10 6
EH is the energy used for heating, EL is the energy used for light, EV is the energy used for ventilation, P is the power (w), and T is the time (s).

Water Pumping Energy

A 746−watt water pump was utilised to meet the water demands of the pigs. The water pump can pump 40 L of water per minute. A 1000 L water tank was used, and it took approximately 25 min of continuous operation to fill the tank. Furthermore, the amount of water (L) utilised by the pigs was measured daily. Additionally, in calculating the energy used for pumping water, the actual power consumption of the water pump can vary depending on factors such as suction depth, discharge pressure, and the length of pipes. Therefore, the hydraulic power required for pumping water was calculated using the following Equation (3):
P hydraulic   = ρ × g × H × Q η
where Phydraulic is the hydraulic power required (watt), ρ is the density of water (kg/m3), g is the acceleration due to gravity (m/s2), Q is the flow rate (m3/s), η is the efficiency of the pump, and H is the total head (m).
The total head (H) is the sum of the suction head, discharge head, and friction losses, which is calculated using the following Equation (4):
H = Hs + Hd + Hf
where Hs is the suction head (m). Hd is the discharge head (m). Hf is the friction loss (m).
Friction losses were estimated using the Darcy–Weisbach Equation (5):
H f = f   × L D × v 2 2 g
where f is the friction factor (dimensionless), L is the length of the pipe (m), D is the diameter of the pipe (m), and v is the velocity of water in the pipe (m/s).
The energy used for pumping water was calculated using Equation (6).
EPW   ( MJ ) = P hydraulic ( w )   ×   TMP   ( s )   ×   10 6
EPW is the energy used for pumping water (MJ), TMP is the time required for water pumping (s), and P is the power of the pump (w).

2.2.3. Calculation of Output Energy

In this study, pigs’ body growth and manure energy were considered as output energy, following the approach taken by Lammers et al. [28]. They conducted an experiment about the energy and carbon inventory of pig production systems, where they considered pigs’ body growth and manure energy as output energy.

Manure Energy

The weight of the manure was measured every 24 h. However, the samples of the manure were collected to test its energy content at 23−day intervals. Before sampling the manure, it was completely homogenised, and then collected in six samples (100 g each), which were used to measure its energy content, as followed by the manure sampling procedure of Gaworski et al. [29]. They conducted an experiment on biogas production using pig manure in which they thoroughly homogenised all the manure and collected samples for biogas production. The samples were dried at 55 °C for 48 h to measure the dry matter (DM) content per 100 g sample, and the energy was calculated from the DM using the bomb calorimetric method as described by Moir et al. [30].

Growth Energy

The amount of energy utilised for pigs’ body growth was determined by subtracting the output energy (manure energy) and energy loss due to pigs’ activity, which includes physical activity, fasting heat production, and water wasted by pigs, using the procedure outlined by Kil et al. [23]. Kil et al. [23] conducted experiments on the energy evaluation of pigs’ growth, where they measured the actual energy used for pigs’ growth by subtracting the output energy and energy loss from pigs. Therefore, the energy utilised for pigs’ growth was calculated by using Equation (7).
EG =   { ( EF + EPW ) ( EM + EA + FHP + EWW ) }
where EG is the energy utilised for growth, EF is energy intake through feed, EPW is the energy used for pumping water, EM is the energy found in manure, EA is the energy used for pigs’ physical activity, FHP is the energy used for fasting heat production, and EWW is wastewater energy (MJ).

2.2.4. Calculation of Energy Loss

The energy loss in the barn was influenced by several factors such as energy loss by pig physical activity (feeding, standing, playing, drinking, etc.), fasting heat production (respiration, thermoregulation, and metabolism), maintaining proper airflow of the barn through a ventilation fan, water wasted by pigs, maintaining the barn temperature using heater, and illuminating the barn using lights.

Physical Activity and Fasting Heat Production Energy

The energy was used for pig physical activity and fasting heat production was calculated to follow the equation of Kil et al. [23]. The energy used for physical activity and fasting heat production was calculated using Equations (8) and (9), respectively.
EA   ( MJ ) = 0.107   ×   ( Body   weight ,   kg ) 0.75
where EA is the net energy for physical activity (MJ). The regression coefficient value is 0.107, which indicates the relationship between the net energy used for physical activity. The power of 0.75 is a scaling factor that calculates the relationship between body weight and metabolic rate.
FHP   MJ = { 0.70   ×   53.6   kcal   ×   M 0.75   ×   0.0042   ( MJ kcal ) }
where FHP represents the net energy for fasting heat production, also known as the operational energy requirement for maintenance (MJ) [31,32], and M denotes the metabolic body weight (kg). An amount of 53.6 is the value of an empirical constant, representing the energy requirement per unit of metabolic body weight. The value 0.70 is the coefficient for maintenance efficiency, adjusting the theoretical basal metabolic rate to match the observed energy requirement for maintenance in a fasting state.

Wastewater and Ventilation Energy

The volume of water (in litres) wasted by pigs was measured daily from the wastewater tank using a load cell, and the amount of energy previously required to pump this amount of water was calculated using Equation (6). Moreover, the energy lost to maintain the airflow of the barn through the ventilation fan was calculated using Equation (2).

Heating and Light Energy

The heating energy lost to maintain barn temperature and the light energy used to illuminate the barn were calculated using Equation (2).

2.3. Calculation of Energy Balance

The energy balance of pigs throughout their growing–finishing phase was calculated using Equation (11).
IE = ( OE + EL )
where IE is the input energy, OE is the output energy, and EL is the energy loss.
According to the parameters considered in this study, the above equation is as follows:
( EF + EH + EL + EV + EPW ) = { ( EG + EM ) + ( EA + FHP + EWW + EAF +   EH + EL ) }  
where all units are measured with a Megajoule (MJ). EAF is the energy used for maintaining barn airflow, and other abbreviations are mentioned above.

2.4. Data Analysis

Throughout the experimental period, data from the data logger of LEMS, the weather station, and the load cell were recorded and saved in Microsoft Excel 2022. The data management process involved converting 10 min average data into different average datasets such as hourly, daily, 23−day (phase−wise average), and the entire experimental session average. For statistical analyses, the Statistical Package for the Social Sciences (IBM SPSS Statistics 22.0.0.0, New York, NY, USA) was used, including analysis of variance. Graphical illustrations were performed using Origin Pro 9.5.5 (OriginLab, Northampton, MA, USA).

3. Results and Discussion

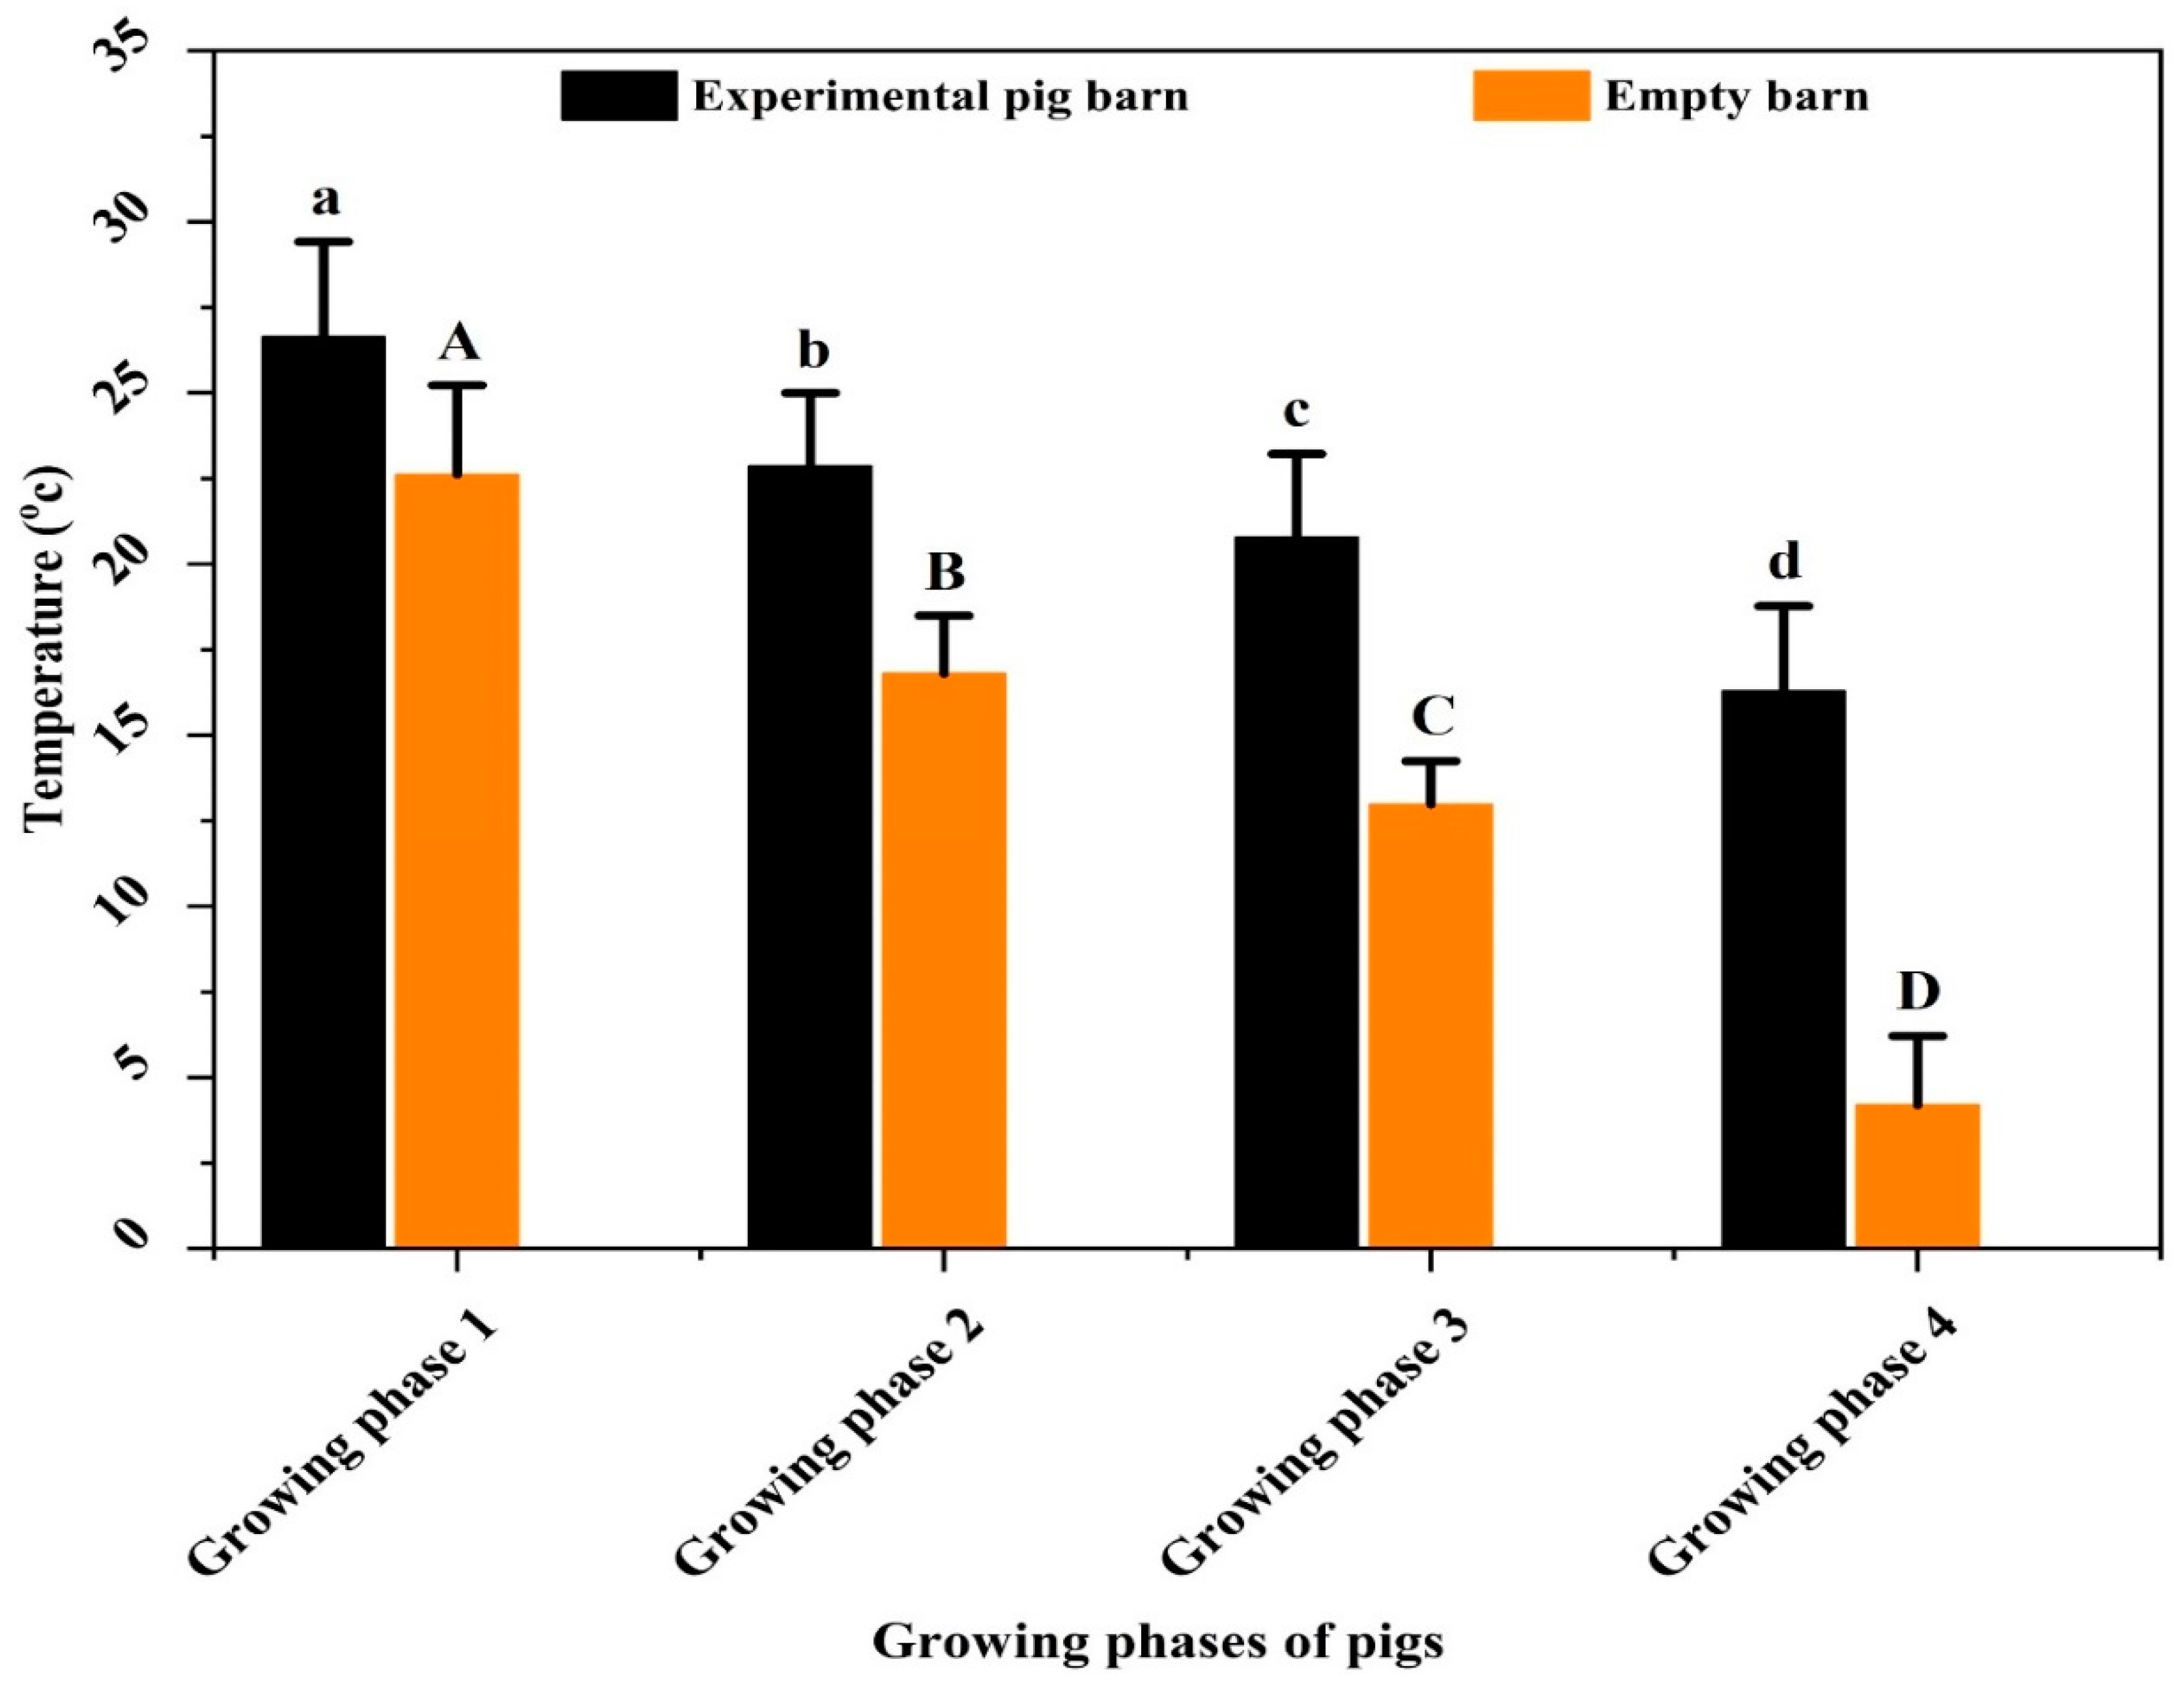
3.1. Summary of the Environmental Parameters

In this study, variations in air temperature and humidity were analysed in two different pig barns, B1 and B2, as well as in the outside environment. The experimental period was characterised by a range of temperatures and humidities. It was found that B1 had an air temperature ranging from 12.78 to 30.58 °C, while B2 ranged from 0.27 to 26.10 °C, and the outside environment varied from −3.58 to 24.72 °C. Relative humidity in B1, B2, and the outside environment were measured at 53.88 to 80.50%, 30.64 to 97.78%, and 33.79 to 88.01%, respectively, throughout the experimental session. The daily average temperature in B1 was observed to be inversely correlated with the daily average humidity (r = −0.547). However, the correlation value was very low, which could be attributed to the implementation of extra heating and mechanical ventilation in B1. Similarly, Basak et al. [33] obtained similar findings and reported an inverse correlation between barn temperature and humidity (r = −0.61) when additional heating was implemented to control the internal environment. On the other hand, Mylostyvyi and Izhboldina [34] observed a high correlation (r = −0.88) between temperature and humidity in an uninsulated naturally ventilated pig building during the summer season, where they did not control the barn’s internal environment by putting in extra heating and mechanical ventilation.
The mean air temperature in B1 and B2 during different growing phases is depicted in Figure 2. The average air temperature recorded in GP1, GP2, GP3, and GP4 were 26.64 ± 2.77 °C, 22.90 ± 2.14 °C, 20.8 ± 2.43 °C, and 16.30 ± 2.47 °C, respectively, in B1, while in B2, the corresponding temperatures were 22.60 ± 2.61 °C, 16.80 ± 2.00 °C, 13 ± 1.27 °C, and 4.20 ± 2.02 °C, respectively. Among the growing phases, the average maximum air temperature was recorded in GP1, while GP4 had the average minimum air temperature. According to the ANOVA test of the dataset, the daily average temperature was significantly different (p < 0.05) among growing phases in both barns. Moreover, the daily average temperature level showed a downward trend among growing phases due to changes in the outside environment. Misra et al. [35] reported that changes in external environmental parameters have a positive impact on changes in internal environmental parameters. Furthermore, the temperature levels of B1 were found to be comparatively higher than B2, which could be attributed to the use of expanded polystyrene materials and an electrical heater in B1. Moon et al. [26] reported that the use of expanded polystyrene materials could help to prevent heat loss, which aligns with this study’s findings.

3.2. Energy Input concerning Different Growing Phases of Pigs

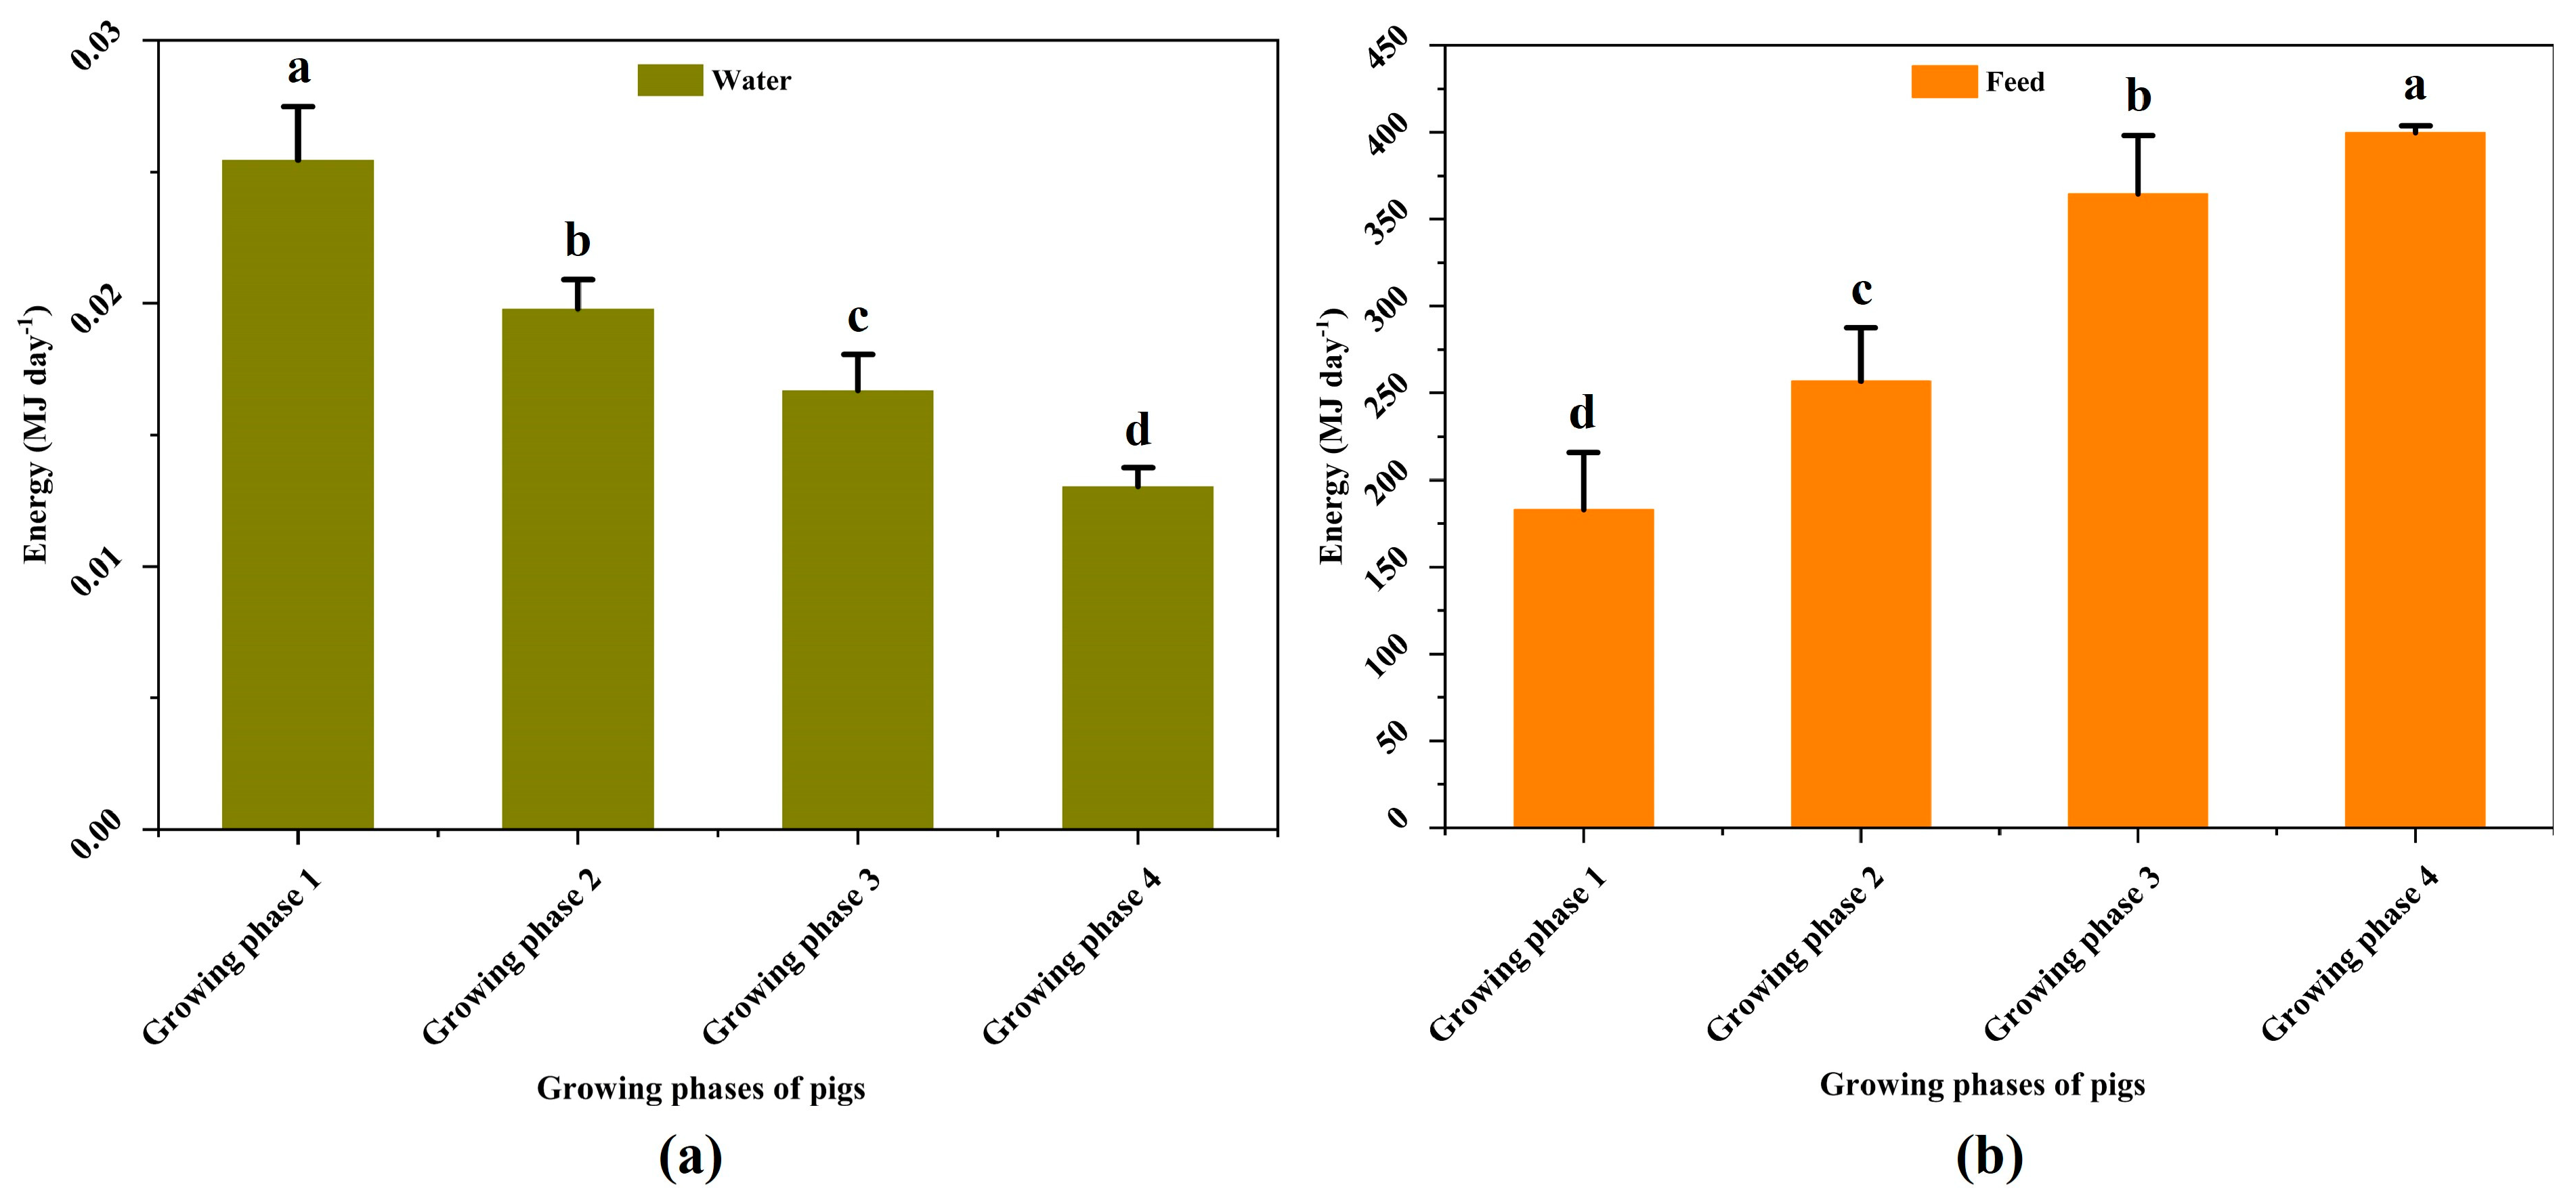
3.2.1. Measurement of Input Energy from Feed and Water

This section explains the energy input through feed and water during the different growing phases of pigs, as shown in Figure 3. The mean feed energy input during GP1, GP2, GP3, and GP4 were 183.04 ± 32.79 MJ, 256.74 ± 31.04 MJ, 364.57 ± 33.47 MJ, and 399.62 ± 4.08 MJ, respectively. Similarly, the average water energy input during these growing phases was 0.025 ± 0.002 MJ, 0.019 ± 0.001 MJ, 0.016 ± 0.001 MJ, and 0.013 ± 0.001 MJ, respectively. The study analysis revealed a significant difference (p < 0.05) in the feed and water energy consumed by pigs across different growing phases.
The study findings indicate an increasing trend in feed energy consumption as pigs age, consistent with the studies by Basak et al. [33] and Rodríguez−Estévez et al. [24]. Basak et al. [33] reported that feed energy consumption increases with pig age, while Rodríguez−Estévez et al. [24] reported that pigs require more energy in the finishing phase compared to the early phase. Additionally, a low standard deviation value of input feed energy was observed in GP4, indicating that pigs consumed a consistent amount of feed energy during this phase. This finding is consistent with Taylor et al.’s [36] study, which reported that energy consumption during the final phase of pig growth (maturity level) was almost constant each day. Moreover, a decreasing trend in water energy input was observed from GP1 to GP4, as mature pigs spent less time playing with nipple drinkers, resulting in less water intake compared to earlier phases. Misra et al. [35] reported similar findings, suggesting that mature pigs tend not to play with nipple drinkers like young pigs, resulting in reduced water input as they age, which is consistent with this study’s findings.

3.2.2. Measurement of Input Energy from Ventilation Fan, Heater, and Light

Table 2 presents the average electrical energy utilised for managing the barn environment during various growth phases. Heating energy was not required during GP1 due to suitable temperature and humidity conditions for pig growth. However, heating energy of 27 MJ, 34.20 MJ, and 43.20 MJ were used during GP2, GP3, and GP4, respectively, due to changes in the external environmental parameters such as temperature and humidity. Misra et al. [35] reported that alterations in external environmental parameters positively affect internal environmental parameters. The usage of light energy was consistent across all growth phases to provide illumination in the barn. Similarly, ventilation energy was uniformly utilised throughout all growth phases, maintaining an average airflow rate of 0.17 m3/s. Chen et al. [37] stated that a comfortable environment for pigs in a small pig barn requires a minimum average airflow rate of 0.13–0.15 m3/s, which aligns with the findings of this study.

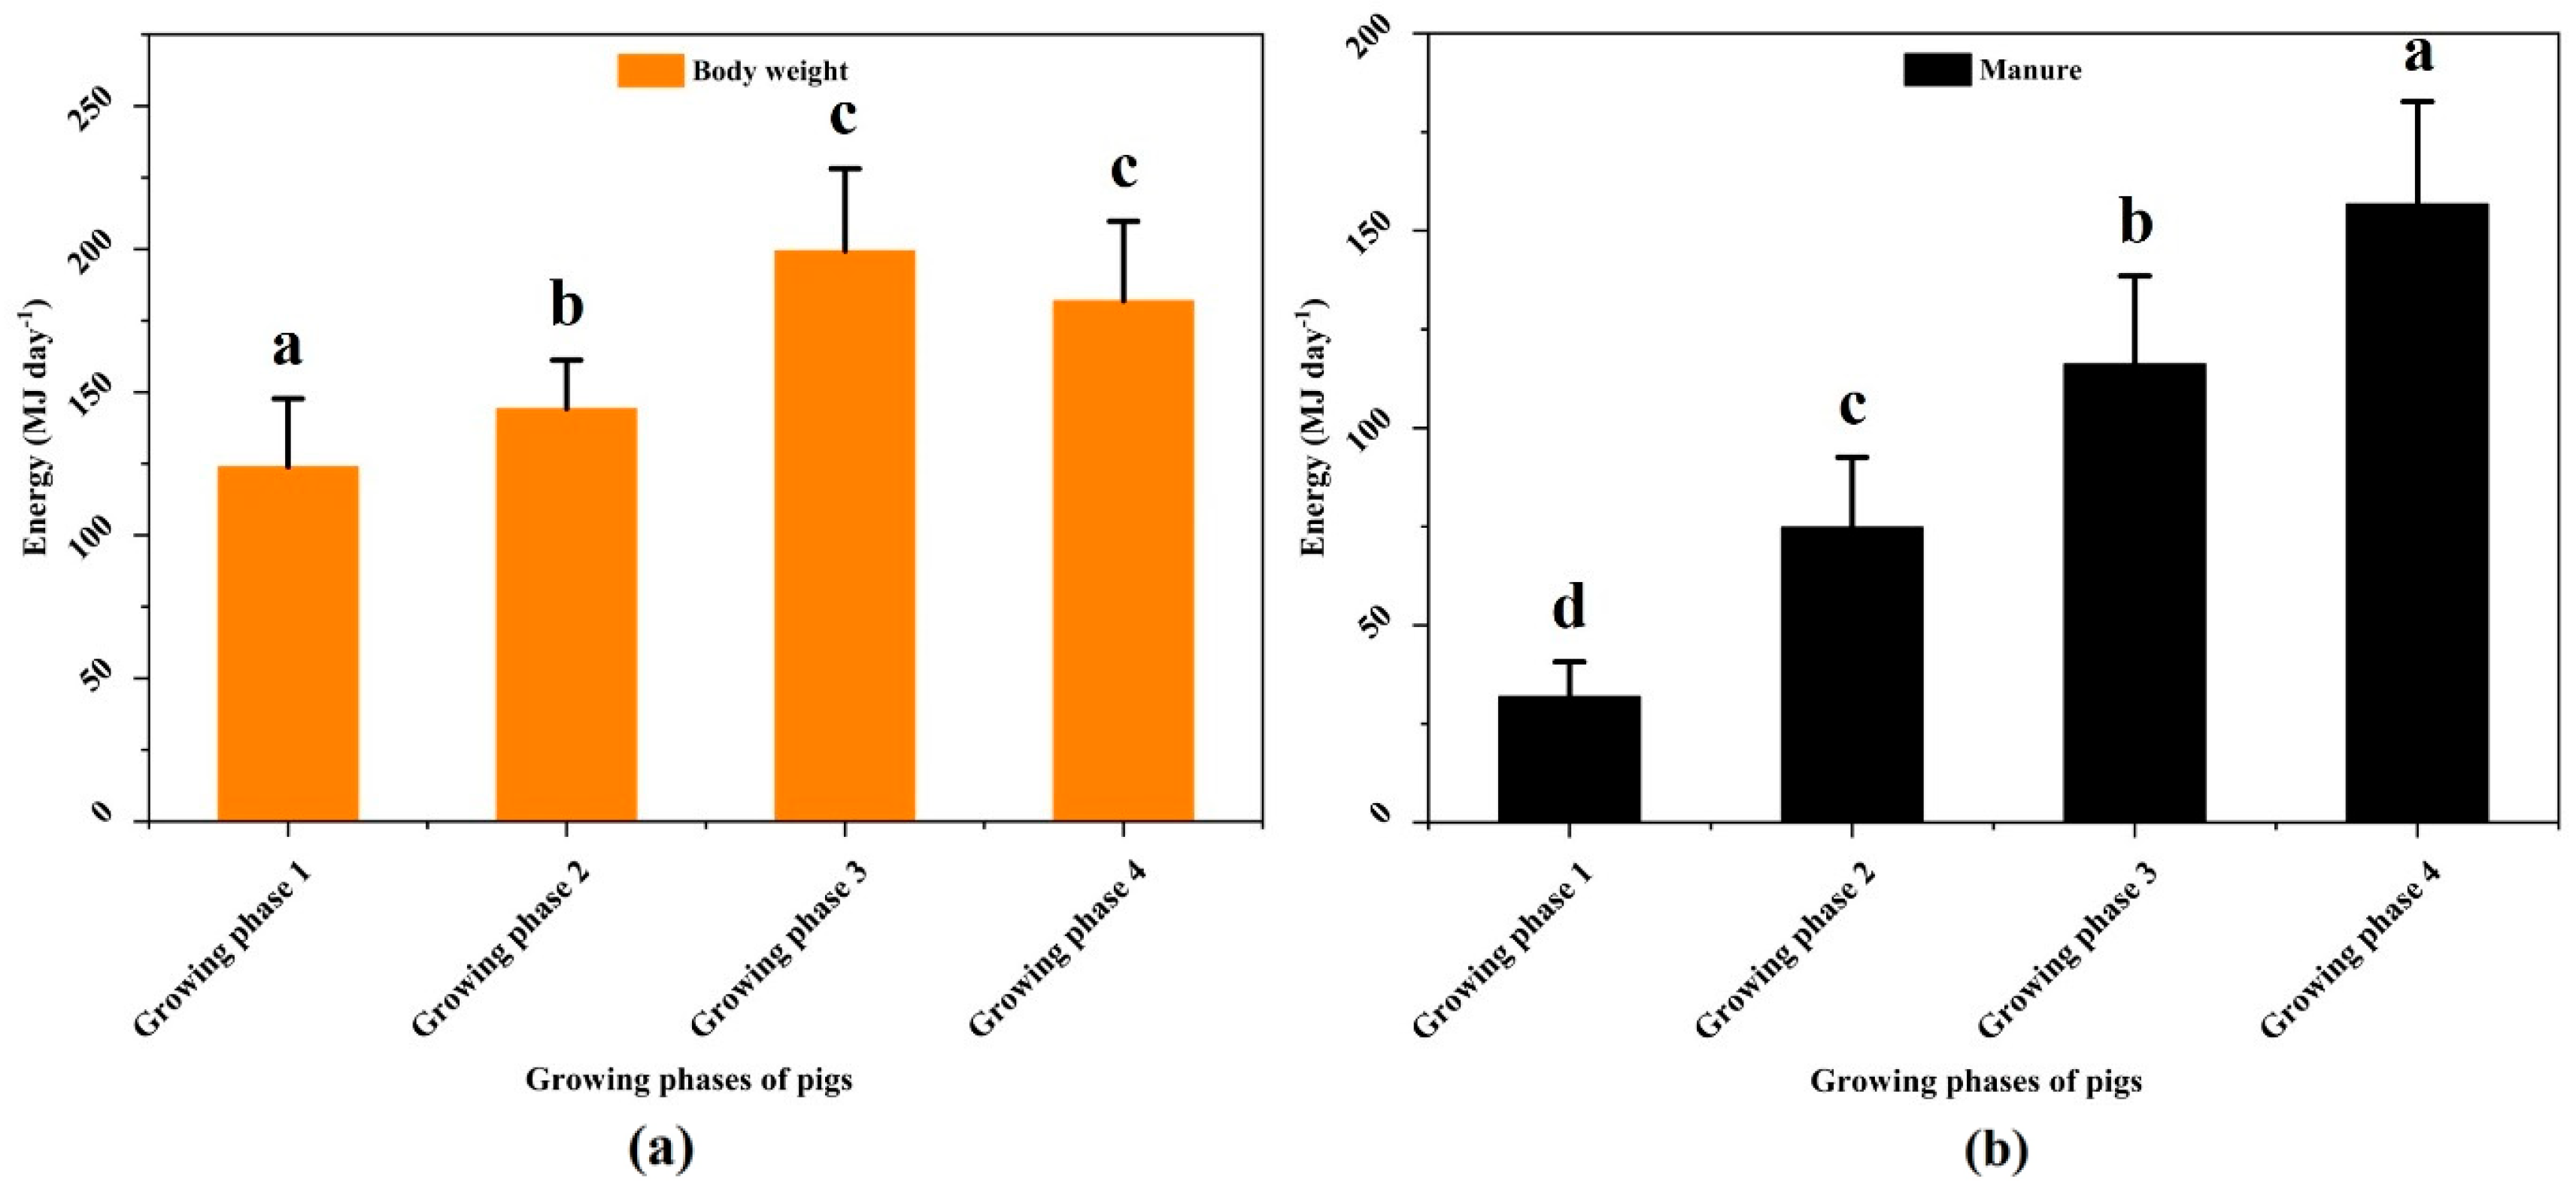
3.3. Energy Output concerning Different Growing Phases of Pigs

This section presents the energy output of pigs through body weight and manure during different growing phases, as illustrated in Figure 4. The mean energy output through the body weight of pigs during GP1, GP2, GP3, and GP4 were 123.88 ± 23.87, 144.21 ± 16.97, 199.40 ± 28.71, and 181.90 ± 27.82 MJ, respectively. Additionally, the average energy output through the manure of pigs during GP1 to GP4 were 31.90 ± 8.79, 74.78 ± 17.75, 116.22 ± 22.34, and 156.77 ± 25.94 MJ, respectively. The energy output through the body weight of pigs was found to be significantly different among GP1 to GP3 (p < 0.05), while in GP3 to GP4, it was not statistically significant (p = 0.104). Moreover, the energy output through the body weight of pigs during GP4 was lower than GP3, as pigs required more energy for maintaining physical activity and fasting heat production at the maturity level. This finding is consistent with the results of previous studies by Labussière et al. [38] and Taylor et al. [36], who reported that when pigs reach the maturity level (finishing phase), their body weight does not change as much as it does in earlier phases due to the higher energy demand for maintaining physical activity and fasting heat production.
This study also found that the energy output through the manure of pigs was significantly different among growing phases (p < 0.05). There was an increasing trend in energy output through the manure of pigs among growing phases due to the consumption of feed energy increasing with the increasing growing phases and pigs’ age, leading to the production of more feces. This finding is supported by the studies of Basak et al. [33] and Moir et al. [30], who reported that the production of feces increases with the age of pigs and mice, respectively. In summary, this section highlights the energy output of pigs through body weight and manure during different growing phases, which can provide valuable insights into the energy utilisation of pigs in pig production systems.

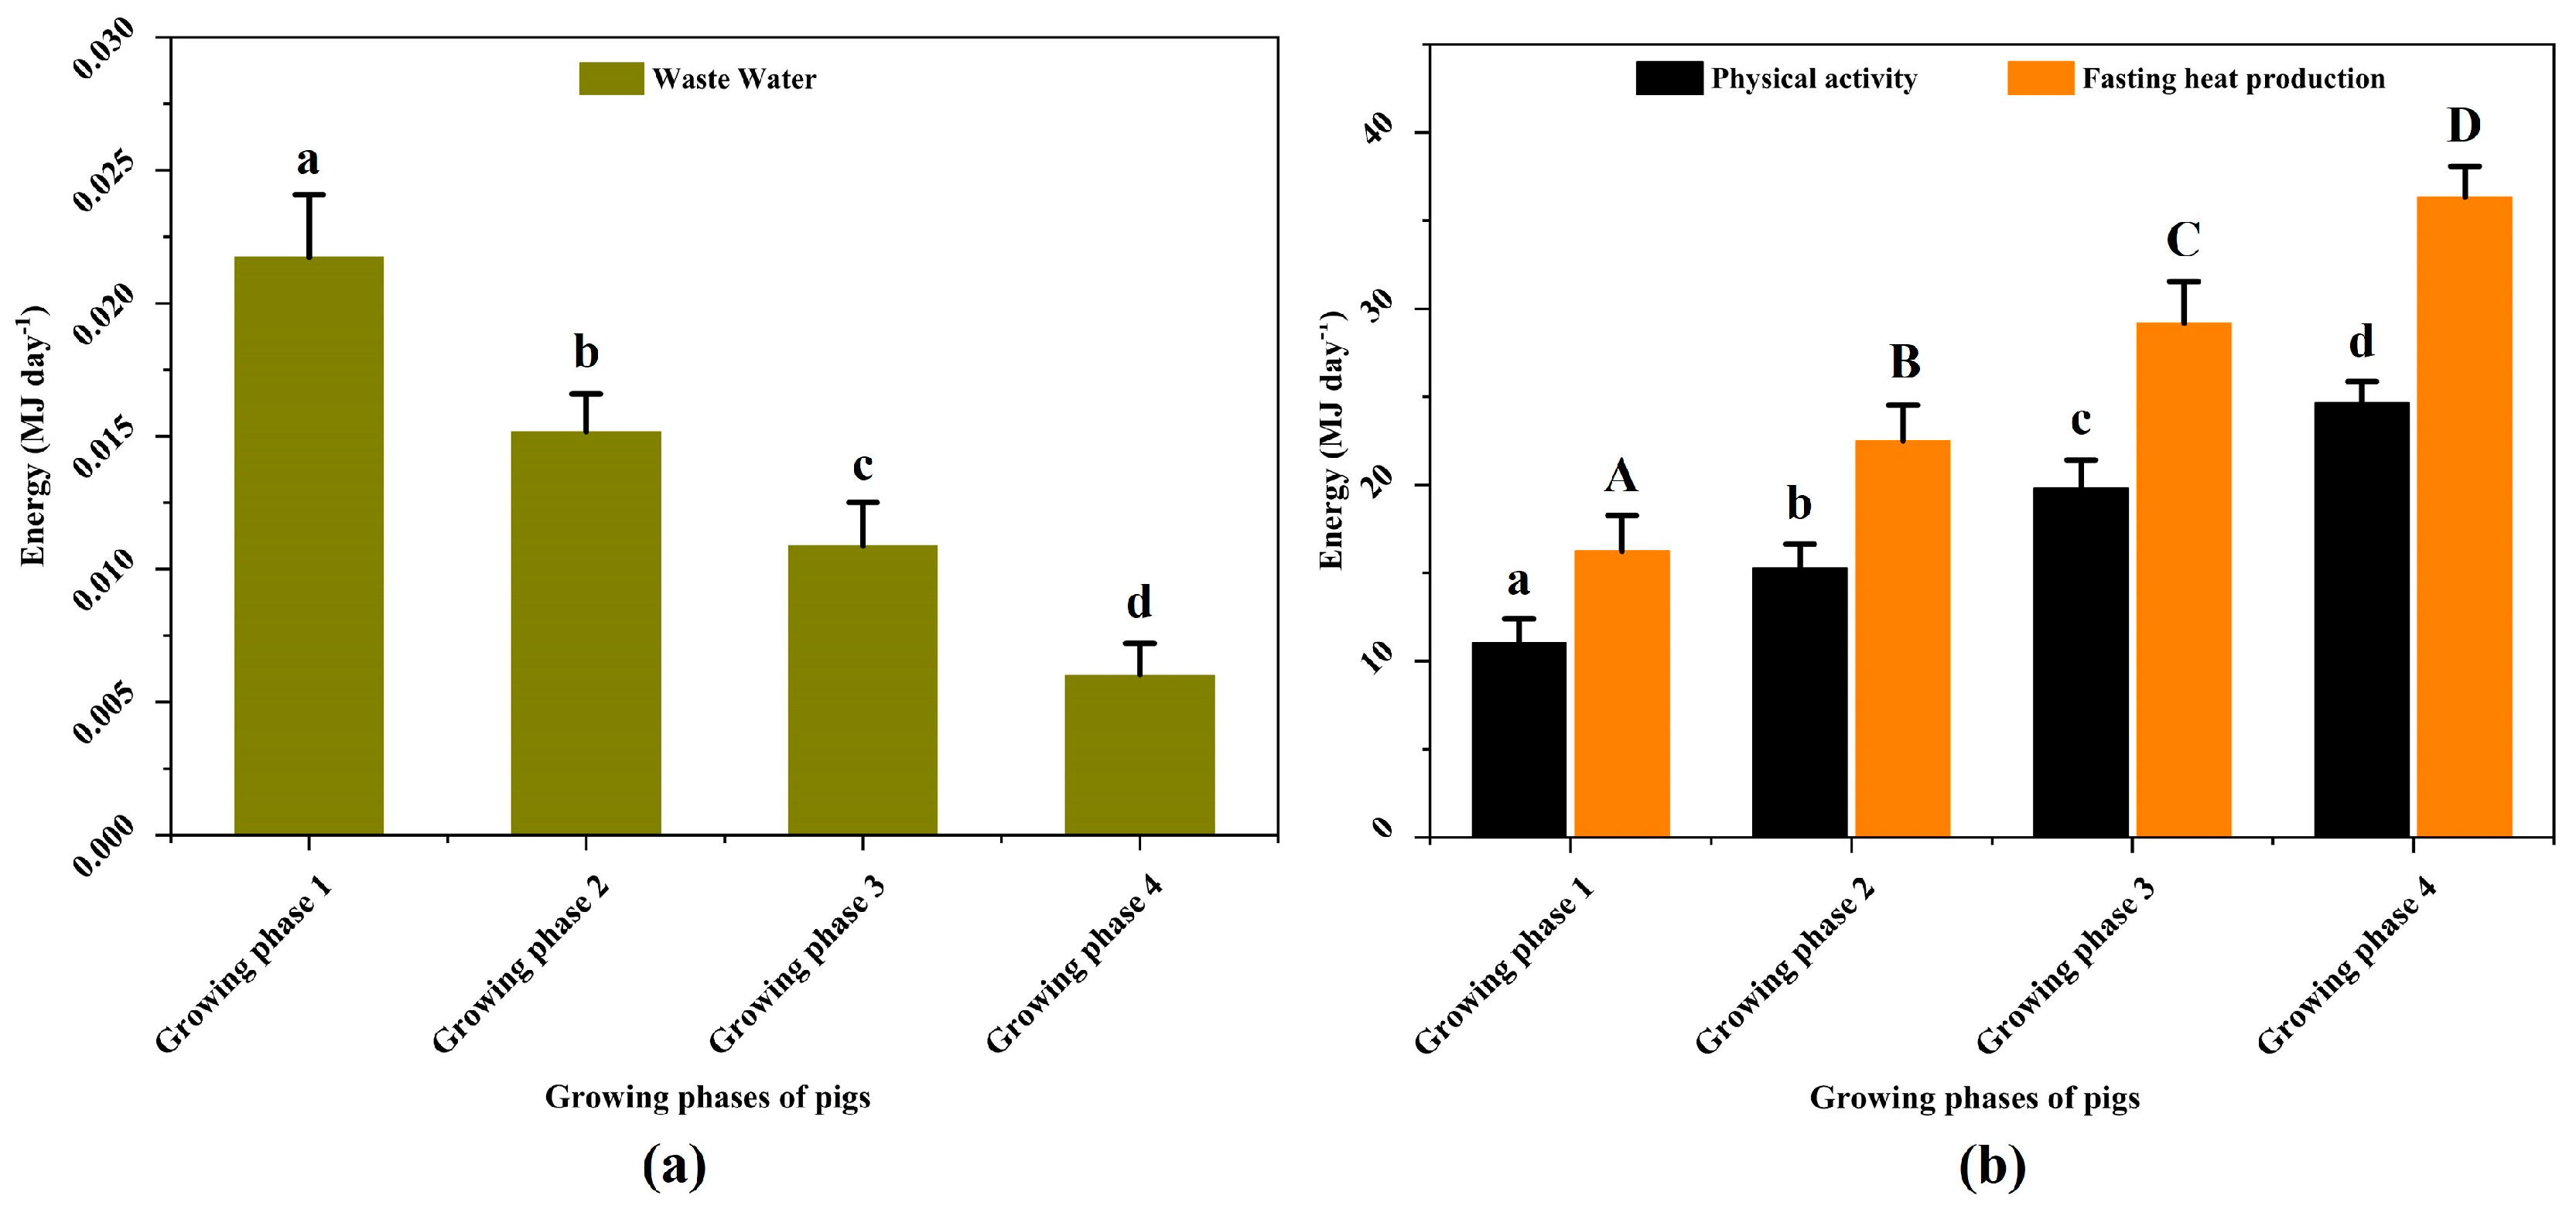
3.4. Energy Loss by Pigs’ Different Activities According to Different Growing Phases

Figure 5 illustrates the energy lost by pigs through various activities, including wastewater, physical activity, and fasting heat production, during different growth phases. The average energy lost due to water waste during GP1, GP2, GP3, and GP4 were 0.022 ± 0.002 MJ, 0.015 ± 0.001 MJ, 0.011 ± 0.002 MJ, and 0.006 ± 0.001 MJ, respectively. In contrast, the mean energy lost due to physical activity during these growth phases were 11.03 ± 1.38 MJ, 15.27 ± 1.38 MJ, 19.81 ± 1.61 MJ, and 24.67 ± 1.20 MJ, respectively, and the energy lost due to fasting heat production were 16.24 ± 2.03 MJ, 22.49 ± 2.02 MJ, 29.17 ± 2.37 MJ, and 36.31 ± 1.76 MJ, respectively.
This study revealed a significant difference (p < 0.05) in the amount of energy lost through these three processes during different growth phases. Specifically, the amount of energy lost through wastewater decreased with increasing growth phases, possibly due to young pigs spending more time playing with nipple drinkers, resulting in more wastewater [35]. Other studies have also found that energy lost through wastewater decreases with increasing pig age [39]. However, the amount of energy lost due to physical activity and fasting heat production increased with increasing growth phases, possibly due to the pig’s body weight rising during different growing phases [32].

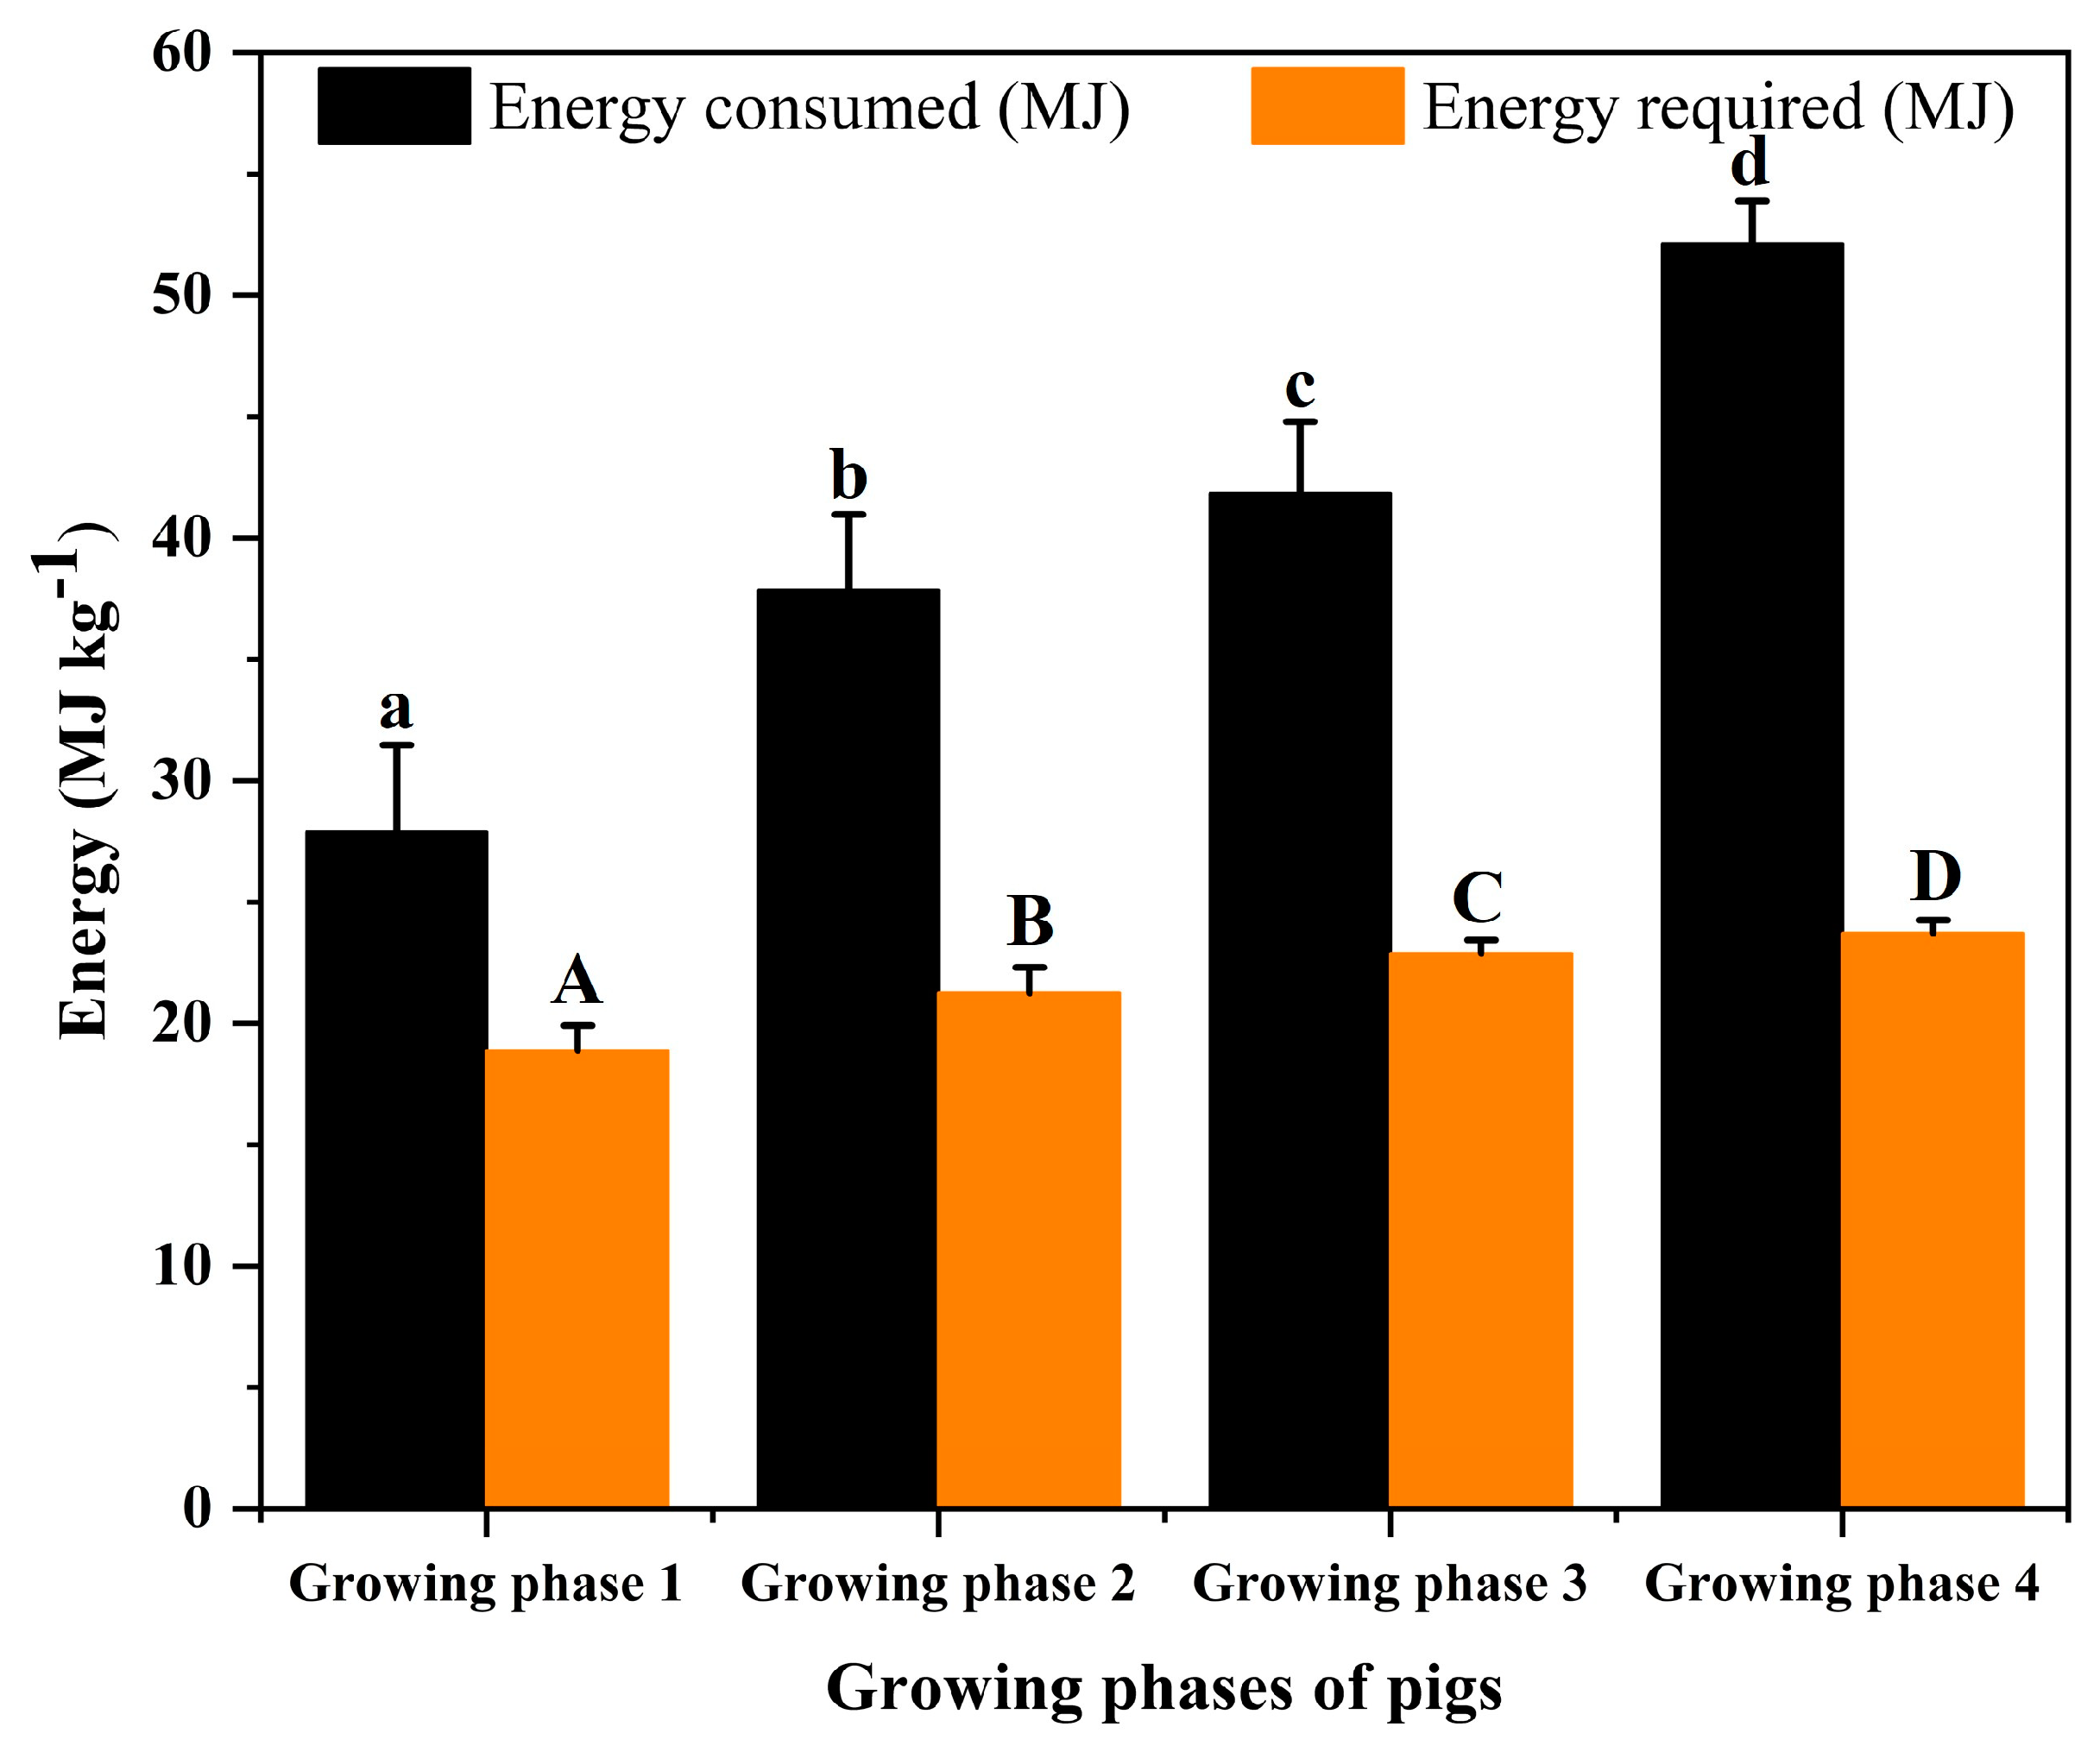
3.5. Energy Required per kg of Body Weight Gain across Different Growing Phases

Figure 6 displays the average feed energy consumed over the energy required per kg of body weight gain during different growing phases. The actual energy required for 1 kg of body weight gain was calculated by subtracting all forms of energy loss. The results revealed that the average energy consumed per kg of body weight gain throughout GP1, GP2, GP3, and GP4 were 27.90 ± 3.57, 37.85 ± 3.12, 41.84 ± 2.96, and 52.11 ± 1.79 MJ, respectively. However, the mean actual energy required for 1 kg of body weight gain in GP1, GP2, GP3, and GP4 were 18.88 ± 1.05, 21.26 ± 1.45, 22.88 ± 0.55, and 23.71 ± 0.54 MJ, respectively. A significant difference in the energy consumed and required for 1 kg of body weight gain during different growing phases was observed (p < 0.05).
Moreover, it was also observed that the feed energy conversion rate for 1 kg of body weight gain decreased with increasing growing phases, while the actual energy required per kg of weight gain increased with increasing growing phases. This increase could be attributed to the fact that pigs in the early phases of growth tend to gain body weight faster than those in the finishing phases. As pigs reach maturity, their body requires more energy to maintain bodily functions and growth, resulting in an increase in their energy requirements compared to early phases, as noted by previous studies [24,36,40].
This study observed that the average actual energy required for 1 kg of body weight gain during the experiment period was 21.67 MJ, which is lower than the values reported by Lammers et al. [25]. Lammers et al. [25] reported that pigs require 29.30 MJ of energy per kg of body weight gain in hoop barns, while in conventional barn systems, they require 28.80 MJ. However, Paris et al. [9] found that the energy required for 1 kg of body weight gain was 22.70 MJ, which is higher than our study findings. Previous studies have shown that factors such as diet and environmental conditions can affect the energy requirements for pig growth. Therefore, future studies should consider these factors when determining the energy requirements for pigs.

3.6. Energy Balance of the Experimental Pig Barn

Table 3 represents the energy balance during the growing–finishing phase of pigs in the experimental pig barn. In this study, the input energy was derived from three sources: 80.97% from feed, 0.01% from water, and the remaining 19.02% from electrical energy utilised for lighting, ventilation, and heating of the barn. The percentage of electrical energy input used for managing the barn environment was found to be lower in this study compared to other studies. Specifically, Paris et al. [9] reported that around 27% of the total input energy was used for managing the barn environment, while Markou et al. [41] measured approximately 29% of the total input energy used for the barn management environment.
Regarding the calculated energy output, it was found that the pigs’ body weight and manure accounted for 69.20% of the total energy. This result is slightly better than the output energy reported by Frorip et al. [8] and Kwak et al. [18]. Frorip et al. [8] reported that around 65% of the total energy was output, while Kwak et al. [18] measured slightly higher output energy accounting for 67.20%. This could be due to providing feed equivalent to 5% of the pig’s body weight, which Basak et al. [27] suggested as an appropriate amount of diet for pigs. Additionally, proper diet management can reduce health problems and promote energy efficiency, as noted by Kil et al. [23] and Li & Patience [42].
When calculating the overall energy loss, it was found to be 11.78% and 8.13% due to pigs’ different activities (physical activity, fasting heat production, and wastewater) and proper airflow management of the barn, respectively. This percentage is lower than the value reported by Kil [32] and Bilardo et al. [43]. Kil [32] reported that 15.40% of energy was lost by pigs’ different activities, while Bilardo et al. [43] measured that around 17% of total energy was used to manage the barn airflow. The remaining 10.89% of energy was used to manage the barn temperature and illuminate the barn. In summary, the diet and barn used in this study promoted energy efficiency and comfort for pigs’ growth, resulting in a higher energy output compared to other studies.

4. Conclusions

The experiment aimed to calculate the energy balance during the growing–finishing phase of pigs in an experimental pig barn. To achieve this goal, this study measured the electrical energy used to manage the barn environment, the actual energy required for each kg of body weight gain, and the energy flow throughout different growing phases. The study results showed that electrical energy use significantly increased with the increasing growth phases (p < 0.05) due to changing environmental conditions. Furthermore, the actual energy required for each kg of body weight gain significantly varied among different phases of growth (p < 0.05), with an average of 21.69 MJ per kg during the experimental period. This study also found that the energy input for all pigs was significantly different among different growing phases (p < 0.05) when calculating the energy flow under different growing phases. However, the energy output through pigs’ body weight was not significantly different between GP3 and GP4 (p = 0.104), whereas the energy output through pigs’ manure was statistically significant (p < 0.05). Additionally, the energy lost through water wasted by pigs decreased with increasing phases of growth, while the energy lost due to physical activity and fasting heat production increased significantly (p < 0.05). Finally, when calculating the overall energy balance throughout the growing–finishing phase of pigs, it was found that around two−thirds of the total energy was output through pig body weight and manure, while one−third of the energy was lost due to pigs’ different activities and barn environment management. However, since this study was conducted during the winter season in an experimental pig barn, further research is needed to estimate the energy balance for pigs in commercial pig barns across different growing phases and seasons.

Author Contributions

Conceptualisation, N.C.D.; methodology, N.C.D.; software, N.C.D.; validation, J.K.B., S.-w.J. and M.-y.K.; formal analysis, N.C.D.; investigation, N.C.D.; resources, H.-t.K.; data curation, N.C.D., B.P., S.K., D.-y.K., S.-w.J., E.-w.S., J.K. and M.-y.K.; writing—original draft preparation, N.C.D.; writing—review and editing, H.-t.K., J.K.B., S.K. and B.P.; visualisation, N.C.D. and J.K.B.; supervision, H.-t.K.; project administration, H.-t.K.; funding acquisition, H.-t.K. All authors have read and agreed to the published version of the manuscript.

Funding

This research has been financially supported by the Korea Institute of Planning and Evaluation for Technology in Food, Agriculture, Forestry and Fisheries (IPET) through the Technology Commercialization Support Program, funded by the Ministry of Agriculture, Food and Rural Affairs (MAFRA) (1545026476).

Institutional Review Board Statement

The experiments were conducted in compliance with the guidelines provided by the Gyeongsang National University’s animal experimentation committee and received approval from the Institutional Animal Care Committee (approval number: GNU–150508–R0029). All authors followed the ethical guidelines and safety procedures carefully during the experimental period.

Data Availability Statement

The datasets generated during and/or analysed during the current study are available from the corresponding author upon reasonable request.

Acknowledgments

The authors would like to thank the Korea Institute of Planning and Evaluation for Technology in Food, Agriculture, Forestry and Fisheries (IPET) through the Technology Commercialization Support Program, funded by the Ministry of Agriculture, Food and Rural Affairs (MAFRA) (1545026476) for their financial support to conduct this research.

Conflicts of Interest

The authors declare no conflicts of interest.

References

  1. Chudy-Laskowska, K.; Pisula, T. An Analysis of the Use of Energy from Conventional Fossil Fuels and Green Renewable Energy in the Context of the European Union’s Planned Energy Transformation. Energies 2022, 15, 7369. [Google Scholar] [CrossRef]
  2. Igliński, B.; Pietrzak, M.B.; Kiełkowska, U.; Skrzatek, M.; Kumar, G.; Piechota, G. The Assessment of Renewable Energy in Poland on the Background of the World Renewable Energy Sector. Energy 2022, 261, 125319. [Google Scholar] [CrossRef]
  3. Mkhwanazi, Z. Production of Biocoal from Wastewater Sludge-Biomass Feedstock. Master’s Thesis, Chemical Engineering Faculty of Engineering and the Built Environment Durban U, Durban, South Africa, 2022. [Google Scholar]
  4. Brockway, P.E.; Owen, A.; Brand-Correa, L.I.; Hardt, L. Estimation of Global Final-Stage Energy-Return-on-Investment for Fossil Fuels with Comparison to Renewable Energy Sources. Nat. Energy 2019, 4, 612–621. [Google Scholar] [CrossRef]
  5. Rehman, A.; Radulescu, M.; Cismaș, L.M.; Cismaș, C.M.; Chandio, A.A.; Simoni, S. Renewable Energy, Urbanization, Fossil Fuel Consumption, and Economic Growth Dilemma in Romania: Examining the Short- and Long-Term Impact. Energies 2022, 15, 7180. [Google Scholar] [CrossRef]
  6. Jia, S.P.; Mao, B.H.; Liu, S.; Sun, Q.P. Calculation and Analysis of Transportation Energy Consumption Level in China. Jiaotong Yunshu Xitong Gongcheng Yu Xinxi/J. Transp. Syst. Eng. Inf. Technol. 2010, 10, 22–27. [Google Scholar] [CrossRef]
  7. Nejat, P.; Jomehzadeh, F.; Taheri, M.M.; Gohari, M.; Muhd, M.Z. A Global Review of Energy Consumption, CO2 Emissions and Policy in the Residential Sector (with an Overview of the Top Ten CO2 Emitting Countries). Renew. Sustain. Energy Rev. 2015, 43, 843–862. [Google Scholar] [CrossRef]
  8. Frorip, J.; Kokin, E.; Praks, J.; Poikalainen, V.; Ruus, A.; Veermäe, I.; Lepasalu, L.; Schäfer, W.; Mikkola, H.; Ahokas, J. Energy Consumption in Animal Production. Agron. Res. 2012, 10, 39–48. [Google Scholar]
  9. Paris, B.; Vandorou, F.; Balafoutis, A.T.; Vaiopoulos, K.; Kyriakarakos, G.; Manolakos, D.; Papadakis, G. Energy Use in Greenhouses in the EU: A Review Recommending Energy Efficiency Measures and Renewable Energy Sources Adoption. Appl. Sci. 2022, 12, 5150. [Google Scholar] [CrossRef]
  10. Benavides, P.T.; Cai, H.; Wang, M.; Bajjalieh, N. Life-Cycle Analysis of Soybean Meal, Distiller-Dried Grains with Solubles, and Synthetic Amino Acid-Based Animal Feeds for Swine and Poultry Production. Anim. Feed Sci. Technol. 2020, 268, 114607. [Google Scholar] [CrossRef]
  11. Garcia-Launay, F.; van der Werf, H.M.G.; Nguyen, T.T.H.; Le Tutour, L.; Dourmad, J.Y. Evaluation of the Environmental Implications of the Incorporation of Feed-Use Amino Acids in Pig Production Using Life Cycle Assessment. Livest. Sci. 2014, 161, 158–175. [Google Scholar] [CrossRef]
  12. Kebreab, E.; Liedke, A.; Caro, D.; Deimling, S.; Binder, M.; Finkbeiner, M. Environmental Impact of Using Specialty Feed Ingredients in Swine and Poultry Production: A Life Cycle Assessment. J. Anim. Sci. 2016, 94, 2664–2681. [Google Scholar] [CrossRef] [PubMed]
  13. Mihina, Š.; Sauter, M.; Palkovičová, Z.; Karandušovská, I.; Brouček, J. Concentration of Harmful Gases in Poultry and Pig Houses. Anim. Sci. Pap. Rep. 2012, 30, 395–406. [Google Scholar]
  14. Chandra, N.; Jayanta, D.; Basak, K.; Paudel, B.; Eun, N.; Byeong, K.; Moon, E.; Tae, H. Emission of CO2 in a Livestock Barn Based on Diurnal Activities and Various Growing Stages of Pigs. Air Qual. Atmos. Health 2023, 2, 1443–1454. [Google Scholar] [CrossRef]
  15. Süli, T.; Halas, M.; Benyeda, Z.; Boda, R.; Belák, S.; Martínez-Avilés, M.; Fernández-Carrión, E.; Sánchez-Vizcaíno, J.M. Body Temperature and Motion: Evaluation of an Online Monitoring System in Pigs Challenged with Porcine Reproductive & Respiratory Syndrome Virus. Res. Vet. Sci. 2017, 114, 482–488. [Google Scholar] [CrossRef]
  16. Cervantes, M.; Antoine, D.; Valle, J.A.; Vásquez, N.; Camacho, R.L.; Bernal, H.; Morales, A. Effect of Feed Intake Level on the Body Temperature of Pigs Exposed to Heat Stress Conditions. J. Therm. Biol. 2018, 76, 1–7. [Google Scholar] [CrossRef] [PubMed]
  17. Sharpe, K.T.; Reese, M.H.; Buchanan, E.S.; Tallaksen, J.E.; Janni, K.A.; Johnston, L.J. Electrical and thermal energy consumption in midwest commercial swine facilities. Appl. Eng. Agric. 2018, 34, 857–864. [Google Scholar] [CrossRef]
  18. Kwak, Y.; Shin, H.; Kang, M.; Mun, S.-H.; Jo, S.-K.; Kim, S.-H.; Huh, J.-H. Energy Modeling of Pig Houses: A South Korean Feasibility Study. Energy Strateg. Rev. 2021, 36, 100672. [Google Scholar] [CrossRef]
  19. Wang, W.; Fan, L.W.; Zhou, P. Evolution of Global Fossil Fuel Trade Dependencies. Energy 2022, 238, 121924. [Google Scholar] [CrossRef]
  20. Asl, R.; Lammers, P.J.; Honeyman, M.S.; Leaflet, A.S.R. Energy Balance in Pig Production Systems: A Progress Report Energy Balance in Pig Production Systems: A Progress Report. Iowa State Univ. Anim. Ind. Rep. 2008, 654. [Google Scholar] [CrossRef]
  21. Quiniou, N.; Noblet, J.; van Milgen, J.; Dubois, S. Modelling Heat Production and Energy Balance in Group-Housed Growing Pigs Exposed to Low or High Ambient Temperatures. Br. J. Nutr. 2001, 85, 97–106. [Google Scholar] [CrossRef]
  22. Baxter, E.M.; Adeleye, O.O.; Jack, M.C.; Farish, M.; Ison, S.H.; Edwards, S.A. Achieving Optimum Performance in a Loose-Housed Farrowing System for Sows: The Effects of Space and Temperature. Appl. Anim. Behav. Sci. 2015, 169, 9–16. [Google Scholar] [CrossRef]
  23. Kil, D.Y.; Kim, B.G.; Stein, H.H. Feed Energy Evaluation for Growing Pigs. Asian-Australas. J. Anim. Sci. 2013, 26, 1205–1217. [Google Scholar] [CrossRef] [PubMed]
  24. Rodríguez-Estévez, V.; Sánchez-Rodríguez, M.; García, A.; Gómez-Castro, A.G. Feed Conversion Rate and Estimated Energy Balance of Free Grazing Iberian Pigs. Livest. Sci. 2010, 132, 152–156. [Google Scholar] [CrossRef]
  25. Lammers, P.J.; Kenealy, M.D.; Kliebenstein, J.B.; Harmon, J.D.; Helmers, M.J.; Honeyman, M.S. Energy Use in Pig Production: An Examination of Current Iowa Systems. J. Anim. Sci. 2012, 90, 1056–1068. [Google Scholar] [CrossRef] [PubMed]
  26. Moon, B.E.; Kim, H.T.; Kim, J.G.; Ryou, Y.S.; Kim, H.T. A Fundamental Study for Development of Unglazed Transpired Collector Control System in Windowless Pig House. J. Agric. Life Sci. 2016, 50, 175–185. [Google Scholar] [CrossRef]
  27. Basak, J.K.; Paudel, B.; Shahriar, S.A.; Deb, N.C.; Kang, D.Y.; Tae Kim, H. Prediction of Drinking Water Requirements by Applying Statistical and Machine Learning Models in Growing-Finishing Stage of Pigs. Comput. Electron. Agric. 2023, 210, 107934. [Google Scholar] [CrossRef]
  28. Lammers, P.J.; Honeyman, M.S.; Harmon, J.D.; Helmers, M.J. Energy and Carbon Inventory of Iowa Swine Production Facilities. Agric. Syst. 2010, 103, 551–561. [Google Scholar] [CrossRef]
  29. Gaworski, M.; Jabłoński, S.; Pawlaczyk-Graja, I.; Ziewiecki, R.; Rutkowski, P.; Wieczyńska, A.; Gancarz, R.; Łukaszewicz, M. Enhancing Biogas Plant Production Using Pig Manure and Corn Silage by Adding Wheat Straw Processed with Liquid Hot Water and Steam Explosion. Biotechnol. Biofuels 2017, 10, 259. [Google Scholar] [CrossRef] [PubMed]
  30. Moir, L.; Bentley, L.; Cox, R.D. Comprehensive Energy Balance Measurements in Mice. Curr. Protoc. Mouse Biol. 2016, 6, 211–222. [Google Scholar] [CrossRef]
  31. Ayoade, D.I.; Kiarie, E.; Neto, T.; Nyachoti, C.M. Net Energy of Diets Containing Wheat-Corn Distillers Dried Grains with Soluble as Determined by Indirect Calorimetry, Comparative Slaughter, and Chemical Composition Methods. J. Anim. Sci. 2012, 90, 4373–4379. [Google Scholar] [CrossRef]
  32. Kil, D.Y. Digestibility and Energetic Utilization of Lipids by Pigs. Doctoral Dissertation, University of Illinois at Urbana-Champaign, Champaign, IL, USA, 2008; 222p. [Google Scholar]
  33. Basak, J.K.; Arulmozhi, E.; Moon, B.E.; Bhujel, A.; Kim, H.T. Modelling Methane Emissions from Pig Manure Using Statistical and Machine Learning Methods. Air Qual. Atmos. Health 2022, 15, 575–589. [Google Scholar] [CrossRef]
  34. Mylostyvyi, R.; Izhboldina, O. Climate Assessment in Modern Sustainable Cattle Barns Using Temperature-Humidity Index; Publishing House “Baltija Publishing”: Riga, Latvia, 2019. [Google Scholar] [CrossRef]
  35. Misra, S.; Bokkers, E.A.M.; Upton, J.; Quinn, A.J.; O’Driscoll, K. Effect of Environmental Enrichment and Group Size on the Water Use and Waste in Grower-Finisher Pigs. Sci. Rep. 2021, 11, 16380. [Google Scholar] [CrossRef] [PubMed]
  36. Taylor, C.; Guy, J.; Bacardit, J. Prediction of Growth in Grower-Finisher Pigs Using Recurrent Neural Networks. Biosyst. Eng. 2022, 220, 114–134. [Google Scholar] [CrossRef]
  37. Chen, H.; Li, S.; Zheng, X.; Liu, C.; Kuzyakov, Y. Annual Greenhouse Gas Emissions from Sheepfolds and Cattle Sheds. Soil Use Manag. 2022, 38, 369–380. [Google Scholar] [CrossRef]
  38. Labussière, E.; van Milgen, J.; de Lange, C.F.M.; Noblet, J. Maintenance Energy Requirements of Growing Pigs and Calves Are Influenced by Feeding Level. J. Nutr. 2011, 141, 1855–1861. [Google Scholar] [CrossRef] [PubMed]
  39. Little, S.B.; Browning, G.F.; Woodward, A.P.; Billman-Jacobe, H. Water Consumption and Wastage Behaviour in Pigs: Implications for Antimicrobial Administration and Stewardship. Animal 2022, 16, 100586. [Google Scholar] [CrossRef] [PubMed]
  40. Wang, L.; Hu, Q.; Wang, L.; Shi, H.; Lai, C.; Zhang, S. Correction: Predicting the Growth Performance of Growing-Finishing Pigs Based on Net Energy and Digestible Lysine Intake Using Multiple Regression and Artificial Neural Networks Models. J. Anim. Sci. Biotechnol. 2022, 13, 10, Erratum in J. Anim. Sci. Biotechnol. 2022, 13, 128. [Google Scholar] [CrossRef] [PubMed]
  41. Markou, G.; Balafoutis, T.; Mohamed, E.; Papadakis, G.; Michael, P.; Janssen, R. The Cyprus Energy Profile for the Animal Sector: Current Situation and Energy Saving Measures in Combination with RES; European Commission: Brussels, Belgium, 2017. [Google Scholar]
  42. Li, Q.; Patience, J.F. Factors Involved in the Regulation of Feed and Energy Intake of Pigs. Anim. Feed Sci. Technol. 2017, 233, 22–33. [Google Scholar] [CrossRef]
  43. Bilardo, M.; Comba, L.; Cornale, P.; Costantino, A.; Fabrizio, E. Relation between Energy Use and Indoor Thermal Environment in Animal Husbandry: A Case Study. E3S Web Conf. 2019, 111, 01042. [Google Scholar] [CrossRef]
Figure 1. Schematic diagram of experimental pig barn with pigs (a), empty barn without pigs (b) for measuring temperature, and humidity levels using LEMS.
Agriculture 14 00862 g001
Figure 2. The bar graph depicts the temperature (mean ± stdev.) of the experimental pig barn (B1), an empty barn (B2) throughout different growing phases. Different symbols above the same colour bars indicate statistical significance across various growth phases at p < 0.05, as determined by Tukey’s post hoc test.
Agriculture 14 00862 g002
Figure 3. Average energy input through water (a) and feed (b) concerning different growing phases. Different symbols above the same colour bars indicate statistical significance across various growth phases at p < 0.05, as determined by Tukey’s post hoc test.
Agriculture 14 00862 g003
Figure 4. Average energy output through body weight (a) and feed (b) concerning different growing phases. Different symbols above the same colour bars indicate statistical significance across various growth phases at p < 0.05, as determined by Tukey’s post hoc test.
Agriculture 14 00862 g004
Figure 5. Mean energy loss due to wasting water (a), physical activity, and fasting heat production (b) across different growing phases. Different symbols above the same colour bars indicate statistical significance across various growth phases at p < 0.05, as determined by Tukey’s post hoc test.
Agriculture 14 00862 g005
Figure 6. Mean feed energy consumed over energy required per kg of body weight gain throughout different growing phases of pigs. Different symbols above the same colour bars indicate statistical significance across various growth phases at p < 0.05, as determined by Tukey’s post hoc test.
Agriculture 14 00862 g006
Table 1. Nutritional composition (%) and metabolisable energy (kcal) provided to pigs (Growing Pigs Late Feed 10).
IngredientsNutritional Composition
Fat (raw)>4.5
Ash (raw)<8
Protein (raw)<18
Fiber (raw)<10.0
Calcium>0.5
Lysine>0.9
Raw protein (metabolisable)>12.0
Phosphorus<1.2
Energy (metabolisable)3500
The feed offered to the pigs is commercial concentrate.
Table 2. Mean electrical energy used for barn environment management for all pigs throughout different growing phases.
Growing PhasesItemsEnergy (MJday−1)Energy Used during Different Growing Phases (%)
Growing phase 1Lights14.40
Electrical heating
Ventilation fan30.24
Total energy44.6415.78
Growing phase 2Lights14.40
Electrical heating27.00
Ventilation fan30.24
Total energy71.6425.32
Growing phase 3Lights14.40
Electrical heating34.20
Ventilation fan30.24
Total energy78.8427.86
Growing phase 4Lights14.40
Electrical heating43.20
Ventilation fan30.24
Total energy87.8431.04
Table 3. Overall energy balance during growing–finishing phase of pigs in an experimental pig barn.
SystemItemsEnergy Use during Experiment (MJ)Energy (%)
InputFeed27,691.2780.97
Water1.720.01
Lights1324.803.87
Electrical heating2401.207.02
Ventilation fan2782.088.13
Total 34,201.07100.00
OutputManure8732.5725.53
Energy content in pig’s body14,934.1843.67
Total 23,666.7569.20
LossWastewater1.240.01
Physical activity 1627.754.76
Fasting heat production2397.267.01
Maintenance of barn airflow2782.088.13
Maintenance of barn temperature2401.207.02
Illuminate the barn1324.803.87
Total10,534.3230.80
Disclaimer/Publisher’s Note: The statements, opinions and data contained in all publications are solely those of the individual author(s) and contributor(s) and not of MDPI and/or the editor(s). MDPI and/or the editor(s) disclaim responsibility for any injury to people or property resulting from any ideas, methods, instructions or products referred to in the content.

