Article

Transformation and Sequestration of Total Organic Carbon in Black Soil under Different Fertilization Regimes with Straw Carbon Inputs

1
Heilongjiang Academy of Black Soil Conservation and Utilization, Key Laboratory of Black Soil Protection and Utilization, Ministry of Agriculture and Rural Affairs, Heilongjiang Academy of Agricultural Sciences, Harbin 150086, China
2
College of Resources and Environmental Science, Northeast Agricultural University, Harbin 150030, China
3
Institute of Plant Nutrition and Resource, Beijing Academy of Agricultural and Forestry Science, Beijing 100097, China
*
Authors to whom correspondence should be addressed.
Agriculture 2024, 14(6), 887; https://doi.org/10.3390/agriculture14060887
Submission received: 9 April 2024 / Revised: 1 June 2024 / Accepted: 3 June 2024 / Published: 4 June 2024
(This article belongs to the Section Agricultural Soils)

Abstract

:
In the context of the carbon peak and carbon-neutral era, it is crucial to effectively utilize maize straw as a resource for achieving carbon (C) sequestration and emission reduction in rural agriculture. Maize straw carbon undergoes two processes after being added to the soil: mineralization (decomposition) and humification (synthesis) by soil animals and microorganisms. These processes contribute to the reintegration of carbon into the agroecosystem’s carbon cycle. However, understanding of the transformation and stabilization of straw carbon, as well as the differences in C fixation capacity in soils with various fertilization treatments in black soils, remains limited. This study aims to quantify the relationship between straw carbon input and organic carbon sequestration in various fertilization treatments of black soil. Based on a long-term positional fertilization trial (45 years) in black soil, 13C-labeled maize straw (1.5 g in 120 g of dry soil) was applied and combined with an in situ incubation method using carborundum tubes. Throughout the 360-day trial, we observed the influence of fertilization on soil total organic C levels, organic carbon δ13C values, maize straw addition rate, and straw C fixation capacity. The decomposition of straw was most prominent during the initial 60 days of the incubation period, followed by a gradual decrease in the rate of decomposition. Compared with day 0, the SOC δ13C value and straw C residue rate were highest in the no-fertilization treatment (CK) after 360 days of incubation. The amount of organic carbon transformed and fixed in the soil was significantly higher in the organic fertilizer treatment (M) compared to other treatments, highlighting the stronger decomposition, transformation, and carbon fixation capacity of straw carbon in the M treatment. Moreover, the highest carbon storage of 43.23 Mg·ha−1 was observed in the M fertilization treatment after 360 days, which was significantly different from other treatments (p < 0.05). The study demonstrates that soil with low fertility exhibits increased sequestration potential for straw carbon. Additionally, organic fertilizer input would increase soil organic carbon storage and facilitate straw carbon conversion.

1. Introduction

Soil organic carbon (SOC) is the largest carbon pool in terrestrial ecosystems and plays a crucial role in soil fertility, sustainable agricultural development, global carbon sequestration, emission reduction, increased crop yields, and climate change mitigation [1,2]. Continuous inputs of organic matter are necessary to promote the transformation, replenishment, enhancement, and maintenance of SOC and soil fertility. Microbial assimilation of carbon from straw inputs may induce the microbial mineralization of SOC from the original soil source, facilitated by nutrient availability [3,4]. A meta-analysis of 94 exogenous organic carbon mineralization incubations found that farmland ecosystem SOC decomposition is primarily influenced by exogenous organic carbon [5]. The amount of SOC is mainly controlled by the balance between organic matter inputs and outputs due mainly to decomposition [6]. The turnover of SOC is a highly intricate process. Understanding the complex processes governing SOC turnover and the interactions between exogenous organic materials and native SOC after their addition to the soil is crucial for comprehending soil carbon sequestration mechanisms.
Black soils, covering 4.23 million square kilometers worldwide and accounting for 3.2% of the land area and 28.6% of all soil types, are highly productive soils [7]. In the last two decades, grain production on black soil in the northeast region of China has increased due to the high soil fertility and intensive farming practices. However, soil degradation, caused by erosion, organic matter depletion, and acidification, poses a significant challenge in these areas. Soil degradation in northeastern black soil regions has garnered significant attention in China. Under natural conditions, the average SOC content of black soils in the northeast is 100 g·kg−1, but land use can reduce it by half. If the agricultural management is not proper, the SOC content will continue to decline [8]. Straw return is a highly effective and sustainable method for increasing SOC storage in agricultural fields. It plays a crucial role in carbon sequestration and greenhouse gas emissions reduction [9]. Increased application of organic fertilizers with conventional tillage has been shown to increase SOC pools in croplands, indicating that organic fertilizer application can promote SOC fixation [10]. However, a comprehensive understanding of the dynamics of straw carbon in soil and its impact on SOC fixation in black soils with varying fertility levels is still lacking. Addressing these knowledge gaps is vital for understanding SOC fixation, improving soil fertility, and promoting sustainable agricultural development.
Stable carbon isotope techniques have been extensively employed in the investigation of organic carbon turnover in agricultural soils [11]. Rubino et al. [12] conducted experiments using 13C-labeled dead leaf litter, revealing that carbon in 0–5 cm of soil is mainly derived from external carbon inputs from dead leaf litter, while the primary source of SOC originates from the transformation of humus-like substances present in the 5–20 cm of soil. Therefore, the present study combined the stable carbon isotope technique with the carborundum tube method to perform in situ incubation experiments in the field. The objective was to investigate the fate and turnover process of organic carbon in black soils with varying fertility under long-term fertilizer treatment conditions. This integrated approach facilitates a comprehensive analysis of the contribution of exogenous organic carbon to the SOC content of agricultural soils, thereby elucidating the fundamental principles that govern SOC turnover.

2. Materials and Methods

2.1. Site Description

This study was conducted at the Key Field Scientific Observatory Experimental Station for Black Soil Ecology and Environment of the Ministry of Agriculture and Rural Affairs in Harbin (E 126°51′28″, N 45°50′37″). The station, established in 1979, is located in the temperate monsoon climate zone at an elevation of 151 m. The annual average temperature is 3.6 °C, with an average sunshine duration of 2600~2800 h. The frost-free period lasts for approximately 150 days, and the annual precipitation is around 500 mm. The soil type is black soil, classified as Mollisol according to the US Department of Agriculture Soil Taxonomy [13]. The planting system at the experimental station involves a long-term rotation of wheat, soybean, and maize. The basic properties of the initial plow layer (0~20 cm) of soil are as follows: organic carbon content is 15.5 g·kg−1, total nitrogen content is 1.47 g·kg−1, total phosphorus (P2O5) content is 1.07 g·kg−1, total potassium (K2O) content is 25.16 g·kg−1, alkaline nitrogen content is 151 mg·kg−1, available phosphorus content is 51 mg·kg−1, available potassium content is 200 mg·kg−1, and pH value was 7.2 in 1979 [14].

2.2. Experimental Design

The carborundum tubes were employed to conduct the in situ field experiment. In 2021, four treatments were selected from the experimental station, including: (1) no fertilizer treatment (CK); (2) single application of chemical fertilizer treatment (NPK); (3) single application of organic fertilizer (M); (4) combined application of organic fertilizer and chemical fertilizer (MNPK). The basic soil properties and fertilizer application rates for each treatment are detailed in Table 1 and Table 2.
In the spring of 2021, undisturbed soil samples from the 0~20 cm soil layer under different treatments were collected. The crops for the season were maize. After removing plant roots and other impurities, the samples were air-dried until the moisture content reached the plastic limit of the soil (approximately 22% to 25% moisture content). The large soil clumps were gently broken along the fragile zone, allowing them to pass through a 2 mm sieve, and then further air-dried at room temperature. A portion of the air-dried soil was retained as a control without any straw addition (0 g of straw added). The air-dried soil (120 g) from each treatment was taken and mixed with maize straw (0.5~1 cm, 1.5 g), equivalent to actual crop straw returning to the field. The mixture was then filled into carborundum tubes (38 mm of the inner diameter, 55 mm of the outer diameter, 155 mm of the height, 8.5 mm tube wall thickness, and 140 μm by 70 μm pore size where only water molecules, organic C, and air could penetrate the wall while mycorrhizae and plant roots could not pass) and buried in the corresponding 0~20 cm soil layer of the field for in situ field incubation on 20 May 2021. Each treatment has three repetitions. The distance between each tube was 5 cm. Soil samples were collected at different time points, specifically, at 60 days (20 July 2021), 150 days (20 October 2021), and 360 days (20 May 2022) after incubation. During sampling, the carborundum tubes were inverted and gently shaken to release all the soil samples. A four-point method was used to collect 40 g of soil sample from each tube. The remaining soil was carefully placed back into the carborundum tubes, resealed, and buried back into the corresponding soil layers. After being air-dried, the soil samples were pulverized and sieved for the determination of soil nutrients and other indicators. The basic properties of the 13C-labeled maize straw are as follows: δ13C value of 247‰, carbon content of the maize straw used is 356 g·kg−1, nitrogen content is 10.2 g·kg−1, and the carbon-to-nitrogen ratio is 34.90.

2.3. Measurement Methods

After soil collection, visible straw residues were removed. The soil samples were air-dried at 40 °C and then ground using a mortar and pestle through a 100-mesh sieve. The determination of SOC was conducted using the potassium dichromate volumetric method. The soil bulk density was measured using a sampling ring cutter. The soil δ13C value was analyzed via an elemental analyzer coupled to an isotope ratio mass spectrometer (EA-IRMS, VarioIsotope Cube—Isoprime precision, Elementar, Langenselbold, Hesse, Germany). The basic principle and measurement process of EA-IRMS analysis are as follows: the sample is combusted at high temperature (combustion tube temperature at 920 °C and reduction tube temperature at 600 °C), and the organic carbon content is measured using a Thermal Conductivity Detector (TCD, Agilent 7890A, Agilent Technologies, Alto Palo, CA, USA). The residual gases are then passed through a CO2/N2 vent and entered into a mass spectrometer via a diluter. The δ13C value is determined by a stable isotope ratio mass spectrometer.

2.4. Calculations Method

(1)
The calculation formula [15] for the proportion of maize straw-derived carbon in SOC (Fmaize, %) is as follows:
F m a i z e = δ 13 C s a m p l e δ 13 C c o n t r o l 0 / δ 13 C m a i z e 0 δ 13 C c o n t r o l 0
where: δ13Csample represents the δ13C value of SOC with added maize straw, δ13Ccontrol0 represents the δ13C value of soil samples before incubation without adding straw, and δ13Cmaize0 represents the δ13C value of soil with added straw before incubation.
(2)
The calculation formula [16] for the content of maize straw-derived carbon (Cmaize, g·kg−1) in SOC is as follows:
C m a i z e = C s a m p l e × F m a i z e
where: Csample (g·kg−1) represents the total organic carbon content in the soil.
(3)
The calculation formula [17] for the residue rate of maize straw-derived carbon in soil (Rmaize, %) is as follows:
R m a i z e = F m a i z e × C s a m p l e × 100 / C m a i z e 0
where: Cmaize0 (g·kg−1) represents the carbon content of maize straw.
(4)
The calculation formula [18] for the stabilization rate of SOC (S, kg·m−2·day−1) is as follows:
S = S O C t S O C 0 × B D × d × 10 / t
where SOCt (g kg−1) and SOC0 (g kg−1) represent the initial organic carbon content and the organic carbon content at the sampling time. t is the incubation period in days, BD is the soil bulk density (g·cm−3), and d is the soil layer thickness of 20 cm.
(5)
The SOC stock is the amount of organic carbon in a fixed soil layer per unit land area, usually expressed in Mg·ha−1. The calculation for SOC stock is carried out using the following formula:
M = C i × B D × d × 0.01
where M represents the carbon stock per unit area in Mg·ha−1, Ci is the organic carbon content of the soil (g·kg−1). The organic carbon stock for each component is calculated using the formula above, with Ci representing the corresponding component carbon concentration. The soil bulk density (g·cm−3) and the total organic carbon stock bulk density are assumed to be the same value.

2.5. Statistical Analytics

The experimental data were processed using Excel 2007, and the experimental results were analyzed using SPSS 19.0 for correlation and statistical analysis. All data measurement results were expressed as mean ± standard deviation. The data were subjected to an ANOVA and LSD method for evaluating the effects of soil fertility and incubation time. The significance levels of differences were reported at p < 0.05 and p < 0.01 levels. Origin 8.0 and Excel 2007 were used for data visualization and plotting.

3. Results

3.1. Changes of SOC Content and δ13C Value in Black Soil with Different Fertilization Treatments

In Figure 1, the addition of straw could increase the total SOC content under different fertilization treatments. After adding maize straw, the SOC content increased from 0 days to 360 days in CK and M treatments. Meanwhile, in NPK and MNPK treatments, the SOC content increased from 0 days to 150 days, and then generally remained consistent from 150 to 360 days. At 0 d (without adding straw), the total SOC content in the organic fertilizer-treated soil (M, MNPK) was significantly higher than that in the CK treatment (p < 0.05). At 60 days after adding straw, the SOC content in the M and MNPK treatments increased significantly by 10.12% and 9.11%, respectively, compared to the CK treatment (p < 0.05). At 150 days, SOC content in M, NPK, and MNPK treatments was significantly (p < 0.05) higher than CK treatment. At 360 days, the SOC content in the different fertilization treatments showed the following order: M > NPK = MNPK > CK, with the M treatment having the highest SOC content at 19.13 g·kg−1, which was a significant increase of 8.32% compared to CK (p < 0.05). Compared to 0 days, the total organic carbon content in the CK, M, NPK, and MNPK treatments at 360 days increased significantly by 9.69%, 15.94%, 6.84%, and 3.81%, respectively (p < 0.01). SOC content in M treatment at 360 d significantly higher than at 0 d (p < 0.01). This indicated that with the increase in incubation time after adding straw, apart from the NPK and MNPK treatments, which showed little change after 150 days, the total SOC content in all other treatments exhibited an increasing trend. Among them, the M treatment showed the best increase in total organic carbon content after adding straw, followed by the CK fertilization treatment.
The addition of exogenous organic materials could affect the δ13C values of SOC, as shown in Figure 2 for the dynamic change in δ13C values of organic carbon in black soil after adding straw. At 0 days (without straw addition), the δ13C value of SOC for each treatment was −23.33~−22.91‰, and there was no significant difference in the δ13C values of organic carbon among the different fertilization treatments. After adding straw, the δ13C values of organic carbon significantly changed due to differences in soil fertilization levels and incubation time. The δ13C values of soil in different fertilization treatments reached their maximum at 60 days, with values of 4.50‰, 3.61‰, 5.76‰, and 9.21‰ for CK, M, NPK, and MNPK treatments, respectively. The MNPK treatment showed a significantly higher δ13C value compared to other fertilization treatments (p < 0.05). At 150 days, the δ13C values of organic carbon in soil for all fertilization treatments were lower than the CK treatment but significantly increased compared to 0 days (p < 0.01). At 360 days, the δ13C values of organic carbon in soil for different fertilization treatments showed the following pattern: CK > MNPK > NPK > M. The δ13C values of organic carbon in soil for all fertilization treatments were significantly reduced by 261~292% compared to the CK treatment (p < 0.05).

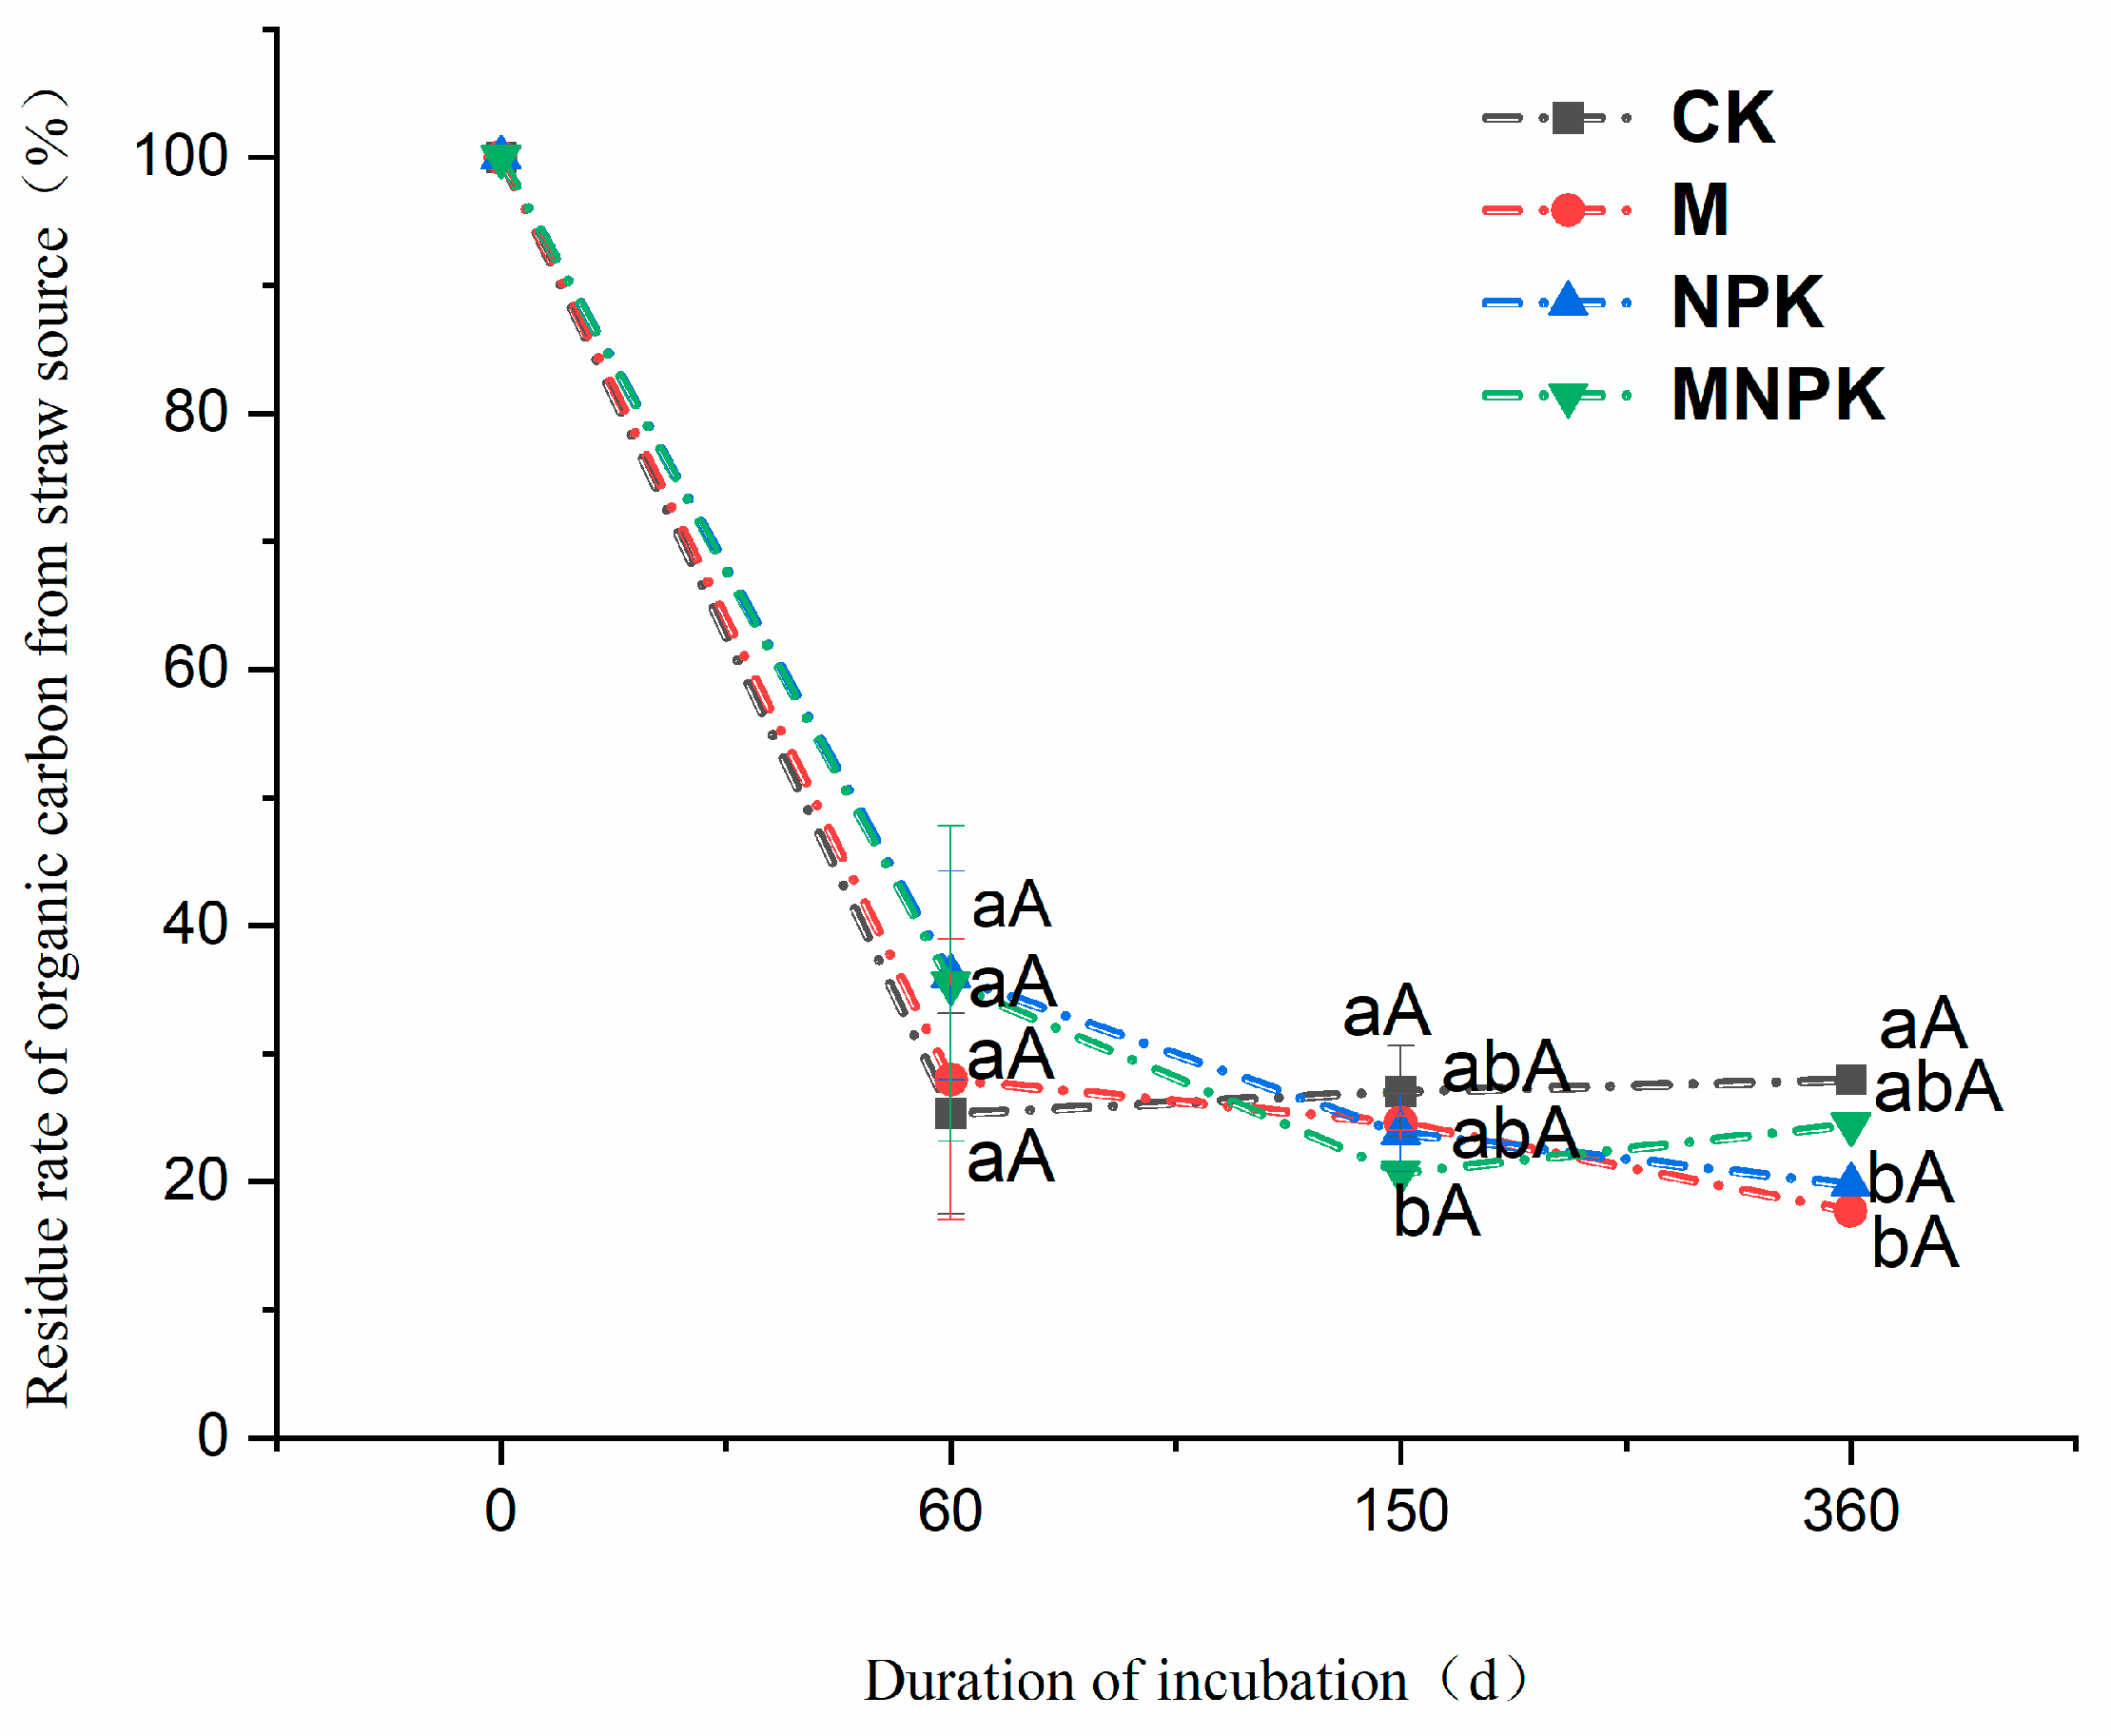
3.2. Dynamics of Straw-Derived Carbon in Black Soils

The residue of straw carbon in the soil is influenced by the incubation time (Figure 3). During the entire incubation period, the straw rapidly decomposes in the first 60 days, and then the decomposition rate gradually slows down. At 60 days, the NPK and MNPK treatments had residues of 36.1% and 35.48% of straw-derived organic carbon (p < 0.05), while the CK treatment had the lowest residue at 25.31%. At 150 days, the residue of straw-derived organic carbon in all treatments showed a slow decrease. After 360 days of incubation, the CK treatment showed a significant reduction in maize straw carbon in the soil to 27.96% of the initial value, and had the highest residue of straw-derived organic carbon. The residual rates of straw-derived organic carbon in the MNPK, NPK, and M treatment soils were 24.43%, 19.76%, and 17.71%, respectively. This indicated that the CK treatment, with increasing incubation time, has higher carbon fixation in the straw than other fertilization levels in the black soil.

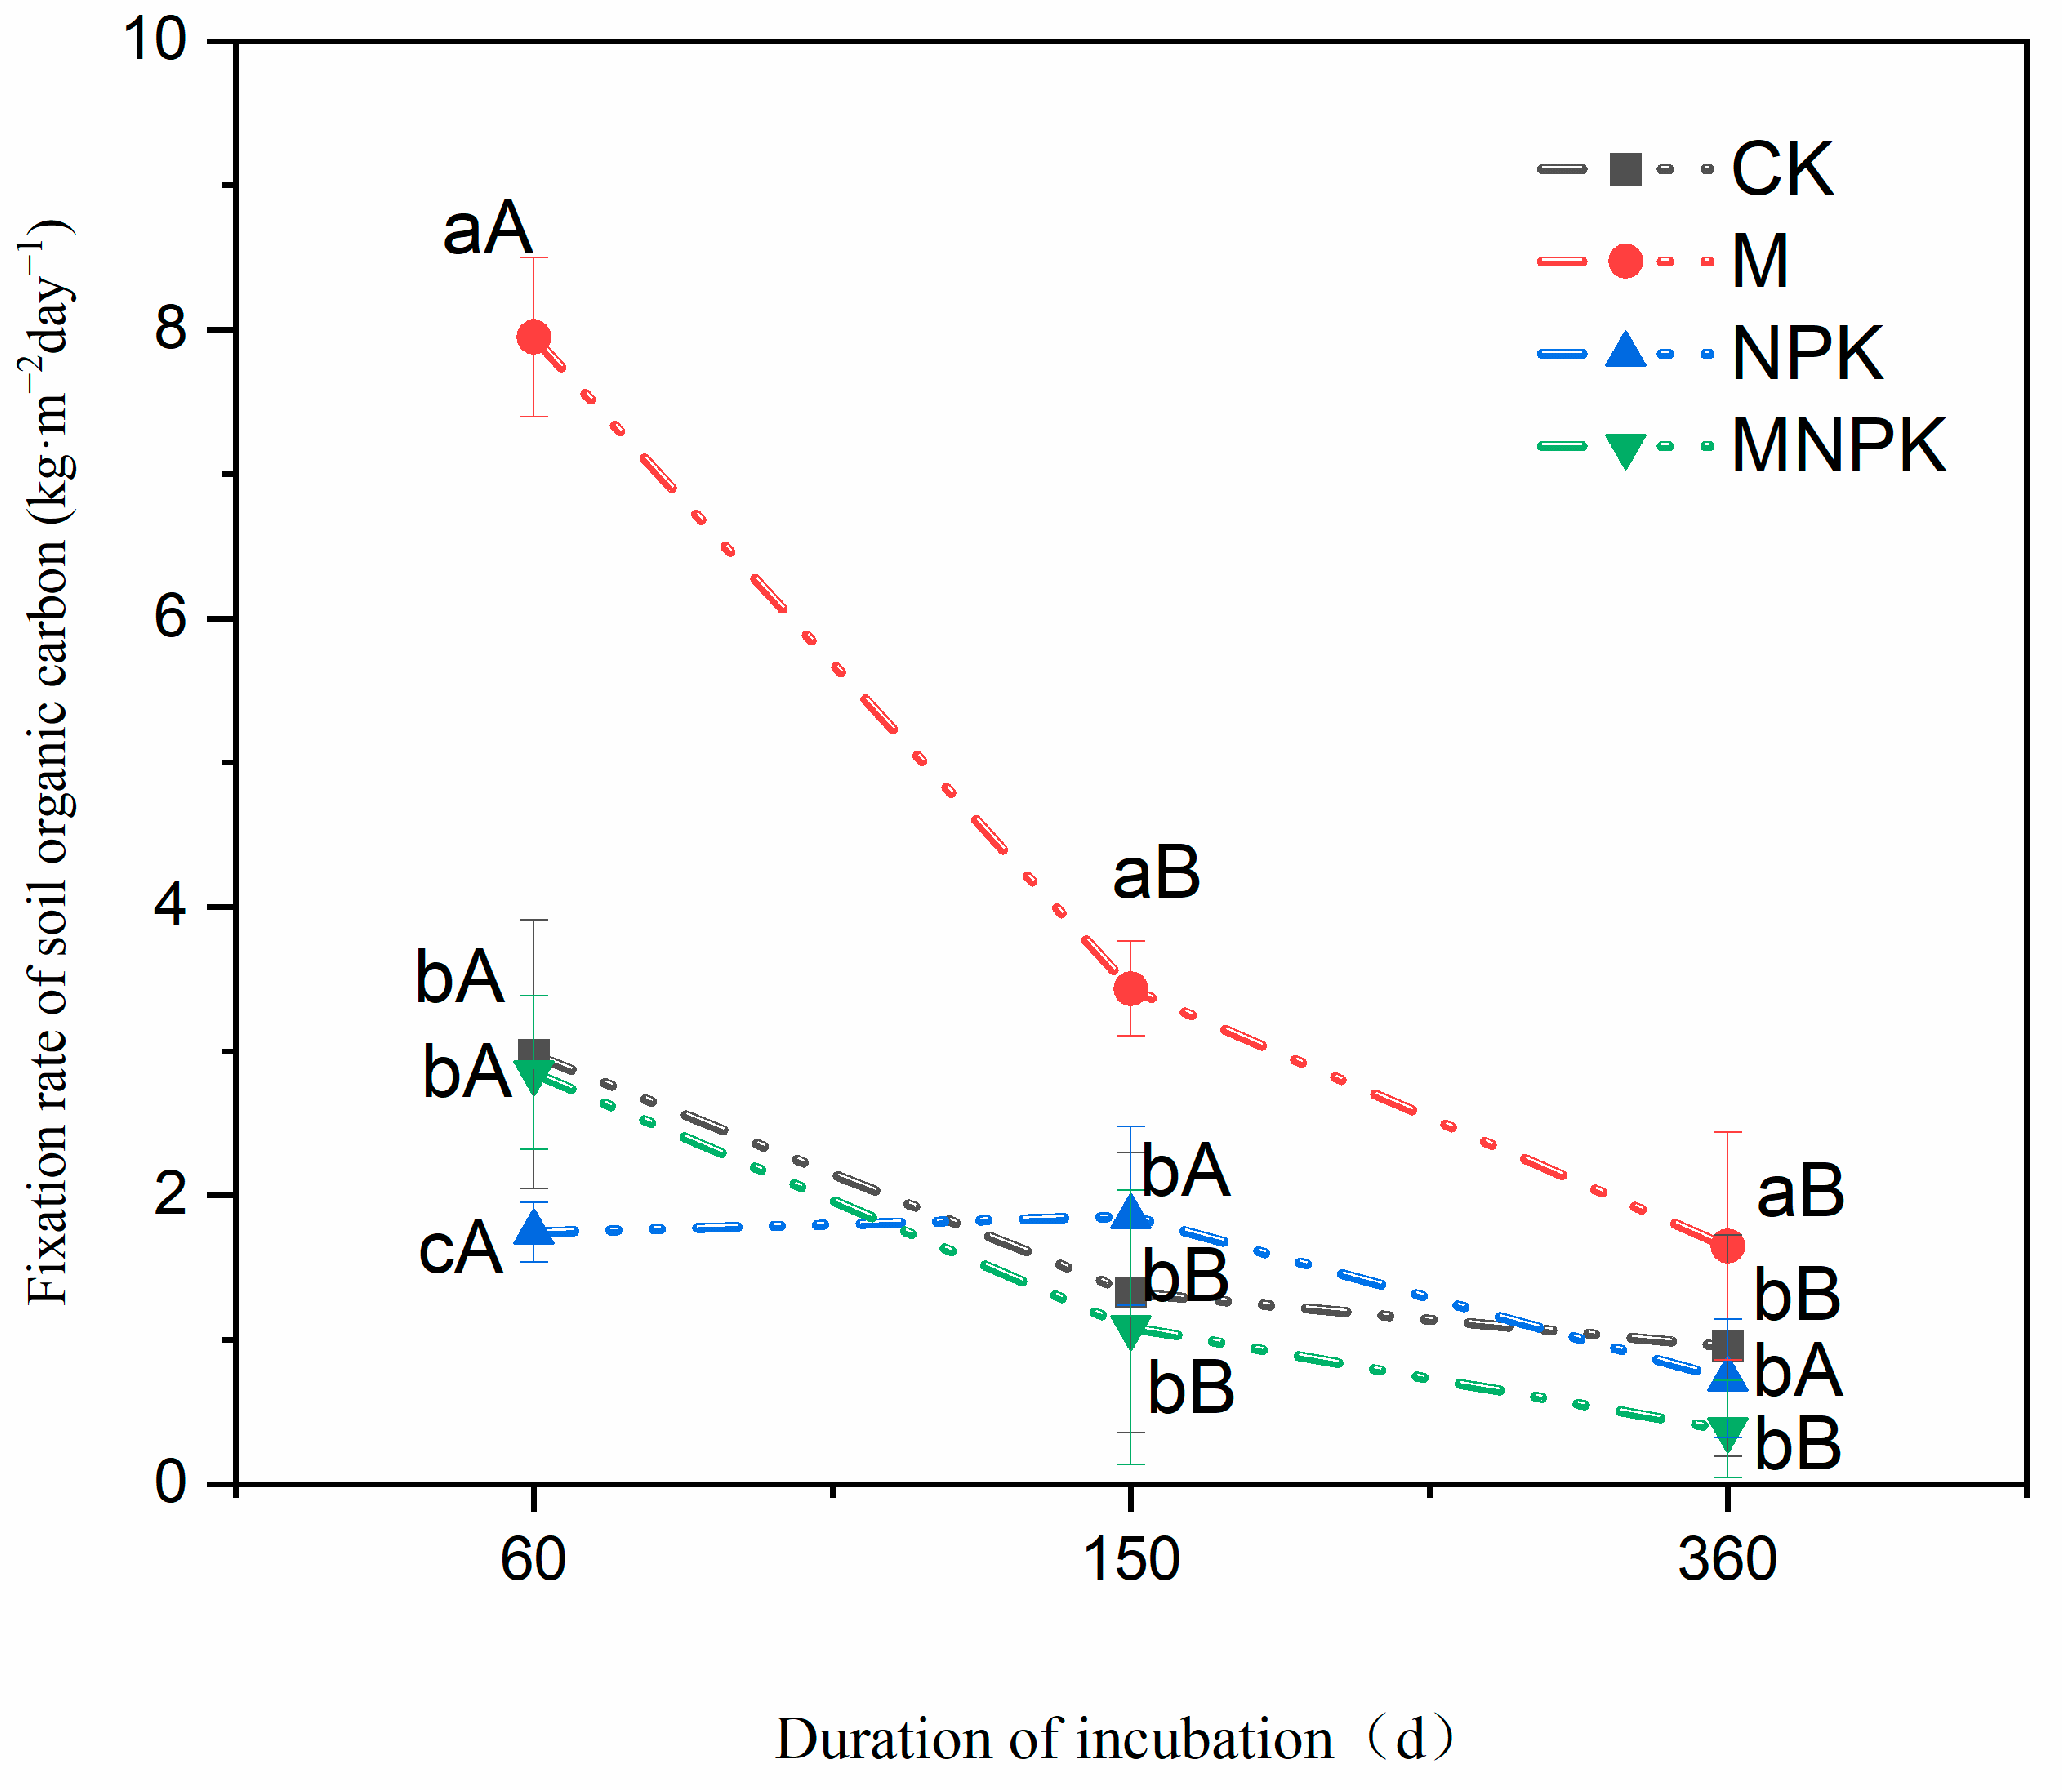
3.3. Organic Carbon Fixation Rate and Capacity of Black Soil with Different Fertilization Treatments

In Figure 4, under the straw addition condition, the rate of organic carbon fixation peaked at 60 days for each fertilization treatment, then declined rapidly and leveled off after 150 days. Among different fertilization treatments, the highest carbon fixation rate of organic carbon in M treatment soil was 7.95 kg·m−2·day−1 at 60 days, followed by CK treatment at 2.97 kg·m−2·day−1. At 150 days, the carbon fixation rates of SOC for M treatment was 3.43 kg·m−2·day−1, whereas in CK and NPK, and MNPK treatments were 1.33 kg·m−2·day−1, 1.85 kg·m−2·day−1, and 1.09 kg·m−2·day−1, respectively, with M treatment significantly higher than the other treatments (p < 0.05). At 360 days, the carbon fixation rates of SOC tended to be similar among all fertilization treatments, M treatment was higher than the other fertilization treatments (p < 0.05). The dynamic changes in carbon storage for each fertilization treatment (Table 3) increased with the incubation period extended. After 360 days, the M treatment soil had the highest carbon storage at 43.23 Mg·ha−1, significantly higher than the other treatments (p < 0.05). Throughout the incubation period, compared to day 0, the carbon storage in the CK treatment increased by 9.71%, the NPK treatment increased by 6.87%, the M treatment increased by 15.93%, and the MNPK treatment increased by 13.98%. These results indicated that the carbon fixation capacity after introducing exogenous carbon is closely related to soil fertility, and the efficiency of soil carbon fixation in the single application of organic fertilizer and organic fertilizer plus inorganic fertilizer treatment was higher than other fertilization treatments.

4. Discussion

4.1. Effects of Straw Addition on SOC and δ13C Values

Researchers both domestically and internationally have conducted extensive and detailed research on the dynamics of carbon and nitrogen transformation after adding organic matter to the soil [18,19,20]. The δ13C value of the soil is an important indicator reflecting the turnover rate of soil organic matter [21]. In this study, the addition of 13C-labeled straw increased the content of total organic carbon in the soil. Throughout the incubation period, the content of total organic carbon in the soil continued to increase, with the M treatment showing the best increase in total organic carbon content after the addition of straw. The addition of straw and different fertilization treatments can affect the fertility difference in soil δ13C values. The δ13C values of the soil significantly increased after the addition of straw (p < 0.01), reaching the highest point at 60 days. However, as the incubation time increased, microorganisms obtained abundant carbon sources, leading to their rapid proliferation. This resulted in the fast decomposition of small molecular substances in the straw by microorganisms, leading to rapid mineralization of easily decomposable substances and their depletion. Microorganisms then started to decompose difficult-to-degrade substances such as cellulose and lignin [22]. As a consequence, the δ13C values of the different fertilization treatments gradually decreased in the later stages. However, comparative analysis throughout the incubation period revealed that, compared to 0 days, the organic carbon δ13C values of the different fertilization treatments showed an increasing trend and reached a significant level (p < 0.01). The order of magnitude was CK > MNPK > NPK > M, indicating that low-fertility soil can significantly enhance the ability of soil to sequester straw carbon.

4.2. Straw Carbon Residue and SOC Fixation

The amount of straw carbon residue in the soil is influenced by incubation time and fertilization methods. Throughout the incubation process, the straw decomposed rapidly in the first 60 days, followed by a slow decline in decomposition rate. The CK treatment had the highest residue rate of straw decomposition, indicating that low fertility levels have a higher capacity to sequester straw carbon compared to high-fertility black soil. The reason may be that, within the same incubation time, low-fertility black soil supplemented with maize straw had a relatively higher content of active organic carbon and microbial carbon accumulated during the early stage of decomposition. During the 150~360 days of incubation, when the test site experienced freeze–thaw cycles, it slowed down the decomposition loss of straw carbon and promoted the transfer of decomposed active organic carbon to stable carbon pools. This, in turn, increased the sequestration of straw carbon. Poirier et al. [23] found that low-fertility level soils have lower organic carbon content but higher microbial activity compared to soils with rich organic matter. Therefore, more straw carbon is sequestered in the fine particle fraction of low-fertility soils. This study found that over 40% of the straw carbon was digested and utilized in the first 60 days of the entire incubation period. This may indicate that the active components of maize straw, such as sugar, cellulose, and hemicellulose, are easily and rapidly decomposed in the early stages [24,25]. Additionally, in this experiment, maize straw with a length less than 5 mm was used, while under most field conditions, maize straw particles are generally larger than 5 mm. Therefore, the organic carbon decomposition of straw was faster during the 360-day incubation period [26]. Due to the soil priming effect induced by the addition of maize straw, the decomposition of the straw is promoted, resulting in an increase in the transformed and fixed organic carbon content in the soil. This indicates that the majority of carbon derived from straw is converted into the soil, leading to an increase in the total organic carbon content in the soil, further confirming the increasing trend of total organic carbon content. Furthermore, the results of this study show that the rate of transformed and fixed organic carbon in the M treatment soil is higher than in the other treatments. Additionally, the carbon storage in the M treatment soil after 360 days is the highest at 43.23 Mg·ha−1, which is significantly different from the other treatments (p < 0.05). This implies that there is a trade-off between maize straw and soil nutrient availability, which can control the ability of organic materials to be fixed in the soil [27]. The CK treatment has a higher carbon fixation ability for straw than the other treatments. Furthermore, the organic fertilizer input treatment (M and MNPK) can increase SOC storage and transformation capacity. The decomposition rate and sequestration of straw carbon in soils with different fertility levels varied. This is due to the differences in nutrient status, microbial biomass, and microbial activity in soils with different fertility levels, which ultimately affect the sequestration of soil organic carbon [20,28].

5. Conclusions

The carbon transformation of straw sources in black soil after the addition of straw is influenced by fertilization treatment and incubation time. The initiate SOC content determines soil nutrient conditions. The application of organic fertilizers affects the number and activity of microorganisms, thereby influencing the biological decomposition process of soil organic matter, which in turn affects the decomposition rate of straw in the soil. Although the single application of chemical fertilizers can increase crop yields and consequently the amount of plant residues returned to the soil as the main carbon source, it inhibits the activity of soil microorganisms and microbial biomass carbon. This weakens soil aggregation and reduces the ability of soil carbon sequestration. After 360 days of incubation, the δ13C values of SOC in different fertilization treatments showed an increasing trend compared to 0 days. Low-fertility soils significantly increase the ability to sequester straw carbon, and the application of organic fertilizers enhances SOC storage and straw carbon conversion capacity.

Author Contributions

Conceptualization, D.W. and J.L.; Formal analysis, Y.Z.; Funding acquisition, J.Z.; Methodology, J.Y., J.H. and Y.S.; Software, E.K.; Supervision, F.C.; Visualization, J.L.; Writing—original draft, J.Z.; Writing—review and editing, J.Y. All authors have read and agreed to the published version of the manuscript.

Funding

This research was funded by National Key Research and Development Program projects (2021YFD1500204, 2023YFD1501301), Heilongjiang Academy of Agricultural Sciences Outstanding Youth Fund Project (2021JCQN004), Heilongjiang Provincial Scientific Research Institute Scientific Research Fund Project (CZKYF2023-1-B006), Heilongjiang Province Agricultural Science and Technology Innovation Span Project (CX23GG08).

Institutional Review Board Statement

Not applicable.

Data Availability Statement

The data generated during and/or analyzed during the current study are available from the corresponding author upon reasonable request.

Conflicts of Interest

The authors declare no conflicts of interests.

References

  1. Schmidt, M.; Torn, M.; Abiven, S.; Dittmar, T.; Guggenberger, G.; Janssens, I.; Kleber, M.; Kogel-Knabner, I.; Lehmann, J.; Manning, D.; et al. Persistence of soil organic matter as an ecosystem property. Nature 2011, 478, 49–56. [Google Scholar] [CrossRef] [PubMed]
  2. Zhai, G.; Han, M.; Li, Y.; Wang, E. Organic carbon change and carbon sequestration potential of sloping farmland in the black soil area. Acta Ecol. Sin. 2020, 40, 5751–5760. [Google Scholar]
  3. Bastida, F.; Torres, I.; Hernández, T.; Bombach, P.; Richnow, H.; García, C. Can the labile carbon contribute to carbon immobilization in semiarid soils? Priming effects and microbial community dynamics. Soil Biol. Biochem. 2013, 57, 892–902. [Google Scholar] [CrossRef]
  4. Blagodatskaya, E.; Kuzyakov, Y. Mechanisms of real and apparent priming effects and their dependence on soil microbial biomass and community structure: Critical review. Biol. Fertil. Soils 2008, 45, 115–131. [Google Scholar] [CrossRef]
  5. Sun, Z.; Liu, S.; Zhang, T.; Zhao, X.; Chen, S.; Wang, Q. Priming of soil organic carbon decomposition induced by exogenous organic carbon input: A meta-analysis. Plant Soil 2019, 443, 463–471. [Google Scholar] [CrossRef]
  6. Wuest, S.; Gollany, H. Soil organic carbon and nitrogen after application of nine organic amendments. Soil Sci. Soc. Am. J. 2013, 77, 237–245. [Google Scholar] [CrossRef]
  7. Liu, X.; Lee, B.; Kravchenko, Y.; Duran, A.; Huffman, T.; Morras, H.; Studdert, G.; Zhang, X.; Cruse, R.; Yuan, X. Overview of Mollisols in the world: Distribution, land use and management. Can. J. Soil Sci. 2012, 92, 383–402. [Google Scholar] [CrossRef]
  8. Tong, Y.; Liu, J.; Li, X.; Sun, J.; Herzberger, A.; Wei, D.; Zhang, W.; Dou, Z.; Zhang, F. Cropping system conversion led to organic carbon change in China’s Mollisols regions. Sci. Rep. 2017, 7, 18064. [Google Scholar] [CrossRef]
  9. Zhu, L.; Li, J.; Tao, B.; Hu, N. Effect of different fertilization modes on soil organic carbon sequestration in paddy fields in South China: A meta-analysis. Ecol. Indic. 2015, 53, 144–153. [Google Scholar] [CrossRef]
  10. Mishra, U.; David, A.; Rattan, L. Tillage effects on soil organic carbon storage and dynamics in Corn Belt of Ohio USA. Soil Tillage Res. 2010, 107, 88–96. [Google Scholar] [CrossRef]
  11. Kuzyakov, Y.; Domanski, G. Carbon input by plants into the soil. Rev. J. Plant Nutr. Soil Sci. 2000, 163, 421–431. [Google Scholar] [CrossRef]
  12. Rubino, M.; Dungait, J.; Evershed, R.; Bertolini, T.; Angelis, P.; D’Onofrio, A.; Lagomarsino, A.; Lubritto, C.; Merola, A.; Terrasi, F.; et al. Carbon input belowground is the major C flux contributing to leaf litter mass loss: Evidences from a 13C labelled-leaf litter experiment. Soil Biol. Biochem. 2010, 42, 1009–1016. [Google Scholar] [CrossRef]
  13. IUSS Working Group WRB. World Reference Base for Soil Resources 2006; First Update 2007; FAO: Rome, Italy, 2007. [Google Scholar]
  14. Zhang, J.; Zhou, B.; Wei, D.; Chi, F.; Hao, X.; Jin, L.; Kuang, E. Spectroscopic characteristics of HA structure in black soil with organic and inorganic fertilizer. Spectrosc. Spectr. Anal. 2019, 39, 845. [Google Scholar]
  15. De, T.; Amery, F.; Van, M.; Smolders, E.; Merckx, R. Tracing the source and fate of dissolved organic matter in soil after incorporation of a 13C labelled residue: A batch incubation study. Soil Biol. Biochem. 2011, 43, 513–519. [Google Scholar]
  16. Werner, R.A.; Brand, W.A. Referencing strategies and techniques in stable isotope ratio analysis. Rapid Commun. Mass Spectrom. 2001, 15, 501–519. [Google Scholar] [CrossRef] [PubMed]
  17. Kong, A.; Six, J.; Bryant, D.; Denison, F.; Van, K. The relationship between carbon input, aggregation, and soil organic carbon stabilization in sustainable cropping systems. Soil Sci. Soc. Am. J. 2005, 69, 1078–1085. [Google Scholar] [CrossRef]
  18. Wetterstedt, J.; Persson, T.; Agren, G. Temperature sensitivity and substrate quality in soil organic matter decomposition: Results of an incubation study with three substrates. Glob. Chang. Biol. 2010, 16, 1806–1819. [Google Scholar] [CrossRef]
  19. Li, L.; Wang, J.; Lan, L.; Sun, Y.; Li, F. Relationship between nutrient change and acidity of soil under long-term fertilization. J. Jilin Agric. Univ. 2017, 39, 55–59. [Google Scholar]
  20. Xu, X.; An, T.; Zhang, J.; Sun, Z.; Schaeffer, S.; Wang, J. Transformation and stabilization of straw residue carbon in soil affected by soil types, maize straw addition and fertilized levels of soil. Geoderma 2019, 337, 622–629. [Google Scholar] [CrossRef]
  21. Liu, L.; Pang, D.; Wang, X.; Chen, L.; Li, X.; Wu, M.; Liu, B.; Zhu, Z.; Li, J.; Wang, J. Application of stable carbon isotope technique in soil organic carbon research: A literature review. Arid. Zone Res. 2021, 38, 123–132. [Google Scholar]
  22. Yu, Y. Effects of the Addition of Root, Stem and Leaf of 13C-Labeled Maize Residues on Brown Earth’s Respiration and Priming Effects. Master’s Thesis, Shenyang Agricultural University, Shenyang, China, 2022. [Google Scholar]
  23. Poirier, V.; Angers, D.; Rochette, P.; Whalen, J. Initial soil organic carbon concentration influences the short-term retention of crop-residue carbon in the fine fraction of a heavy clay soil. Biol. Fertil. Soils 2013, 49, 527–535. [Google Scholar] [CrossRef]
  24. Samul, A.; Sylvie, R.; Victor, R.; Robert, O. Mine realisation of C and N from root, stem and leaf residues in soil and role of their biochemical quality. Biol. Fertil. Soils 2005, 42, 119–128. [Google Scholar]
  25. Joyce, S.; Myrna, J.; Andre, J. Comparison of soil organic matter composition after incubation with maize leaves, roots and stems. Geoderma 2013, 192, 86–96. [Google Scholar]
  26. Meng, F.; Lal, R.; Kuang, X.; Ding, G.; Wu, W. Soil organic carbon dynamics within density and particle-size fractions of Aquic Cambisols under different land use in northern China. Geoderma 2014, 1, 1–9. [Google Scholar] [CrossRef]
  27. Meng, F.; Dungait, J.; Xu, X.; Bol, R.; Zhang, X.; Wu, W. Coupled incorporation of maize (Zea mays L.) straw with nitrogen fertilizer increased soil organic carbon in Fluvic Cambisol. Geoderma 2017, 304, 19–27. [Google Scholar] [CrossRef]
  28. Han, P.F.; Zhang, W.; Wang, G.C.; Sun, W.J.; Huang, Y. Changes in soil organic carbon in croplands subjected to fertilizer management: A global meta-analysis. Sci. Rep. 2016, 6, 27199. [Google Scholar] [CrossRef]
Figure 1. Changes in SOC after adding straw. Note: Capital letters represent the differences between different incubation times for the same fertilization treatment (p < 0.05); Lowercase letters indicate the differences between different fertilization treatments at the same incubation time (p < 0.05). Vertical bars represent the standard error of the mean significant variations (SEM; n = 3).
Agriculture 14 00887 g001
Figure 2. Changes in δ13C values of SOC under different fertilization treatments after straw addition. Note: Capital letters represent the differences between different incubation time of the same fertilization treatment (p < 0.05); Lowercase letters indicate the differences between different fertilization treatments at the same incubation time (p < 0.05). Vertical bars represent the standard error of the mean significant variations (SEM; n = 3).
Agriculture 14 00887 g002
Figure 3. Rate of maize residue C of SOC in different fertilization treatment soils amended with of 13 C-labeled straw. Note: Capital letters represent the differences between different incubation time of the same fertilization treatment (p < 0.05); Lowercase letters indicate the differences between different fertilization treatments at the same incubation time (p < 0.05). Vertical bars represent the standard error of the mean significant variations (SEM; n = 3).
Agriculture 14 00887 g003
Figure 4. Fixation rate of organic carbon in black soil treated with different fertilizers. Note: Capital letters represent the differences between different incubation time of the same fertilization treatment (p < 0.05); Lowercase letters indicate the differences between different fertilization treatments at the same incubation time (p < 0.05). Vertical bars represent the standard error of the mean significant variations (SEM; n = 3).
Agriculture 14 00887 g004
Table 1. The basic properties of tested soils (0–20 cm layer) associated with different fertilizations in 2021.
TreatmentsSOC
(g·kg−1)
δ13C
(‰)
pHBulk Density
(g·cm−3)
CK16.1 ± 1.1−22.91 ± 0.036.79 ± 0.161.11 ± 0.01
NPK17.1 ± 0.1−23.21 ± 0.105.89 ± 0.031.12 ± 0.01
M16.5 ± 0.9−23.23 ± 0.416.82 ± 0.071.13 ± 0.02
MNPK17.6 ± 0.5−23.33 ± 0.115.93 ± 0.141.02 ± 0.05
Note: CK means no fertilizer; N, P, K and M (constant) represent nitrogen fertilizer, phosphate fertilizer, potassium fertilizer and organic fertilizer respectively. CK, NPK, M and MNPK are different fertilization treatments. Vertical bars represent the standard error of the mean significant variations (SEM; n = 3).
Table 2. Fertilization and fertilizer application in long term positioning experiment.
TreatmentsN
(kg·ha−1·y−1)
P2O5
(kg·ha−1·y−1)
K2O
(kg·ha−1·y−1)
Horse Manure
(Mg·ha−1)
WheatSoybeanMaizeWheatSoybeanMaize
CK00000000
NPK150751507515075750
M000000018.6
MNPK1507515075150757518.6
Note: CK means no fertilizer; N, P, K, and M (constant) represent nitrogen fertilizer, phosphate fertilizer, potassium fertilizer and organic fertilizer, respectively. Horse manure is only used during the maize season. CK, NPK, M, and MNPK are different fertilization treatments.
Table 3. Changes of carbon storage (Mg·ha−1) in black soil after adding straw under different fertilization treatments.
TreatmentIncubation Time (d)
060150360
CK35.74 ± 3.00 aA37.53 ± 1.43 cA37.73 ± 0.95 bA39.19 ± 0.55 cA
M37.29 ± 2.62 aB42.06 ± 0.27 aA42.44 ± 0.93 aA43.23 ± 0.37 aA
NPK38.30 ± 1.52 aA39.35 ± 0.27 bA41.09 ± 1.35 aA40.93 ± 0.19 bA
MNPK35.90 ± 2.07 aA37.61 ± 0.57 cA41.22 ± 0.73 aA40.92 ± 0.87 bA
Note: Capital letters represent the differences between different incubation time of the same fertilization treatment (p < 0.05); Lowercase letters indicate the differences between different fertilization treatments at the same incubation time (p < 0.05). Vertical bars represent the standard error of the mean significant variations (SEM; n = 3).
Disclaimer/Publisher’s Note: The statements, opinions and data contained in all publications are solely those of the individual author(s) and contributor(s) and not of MDPI and/or the editor(s). MDPI and/or the editor(s) disclaim responsibility for any injury to people or property resulting from any ideas, methods, instructions or products referred to in the content.

