
Study on the Characteristics of Downwash Field Range and Consistency of Spray Deposition of Agricultural UAVs


Abstract
1. Introduction
2. Related Works
3. Materials and Methods
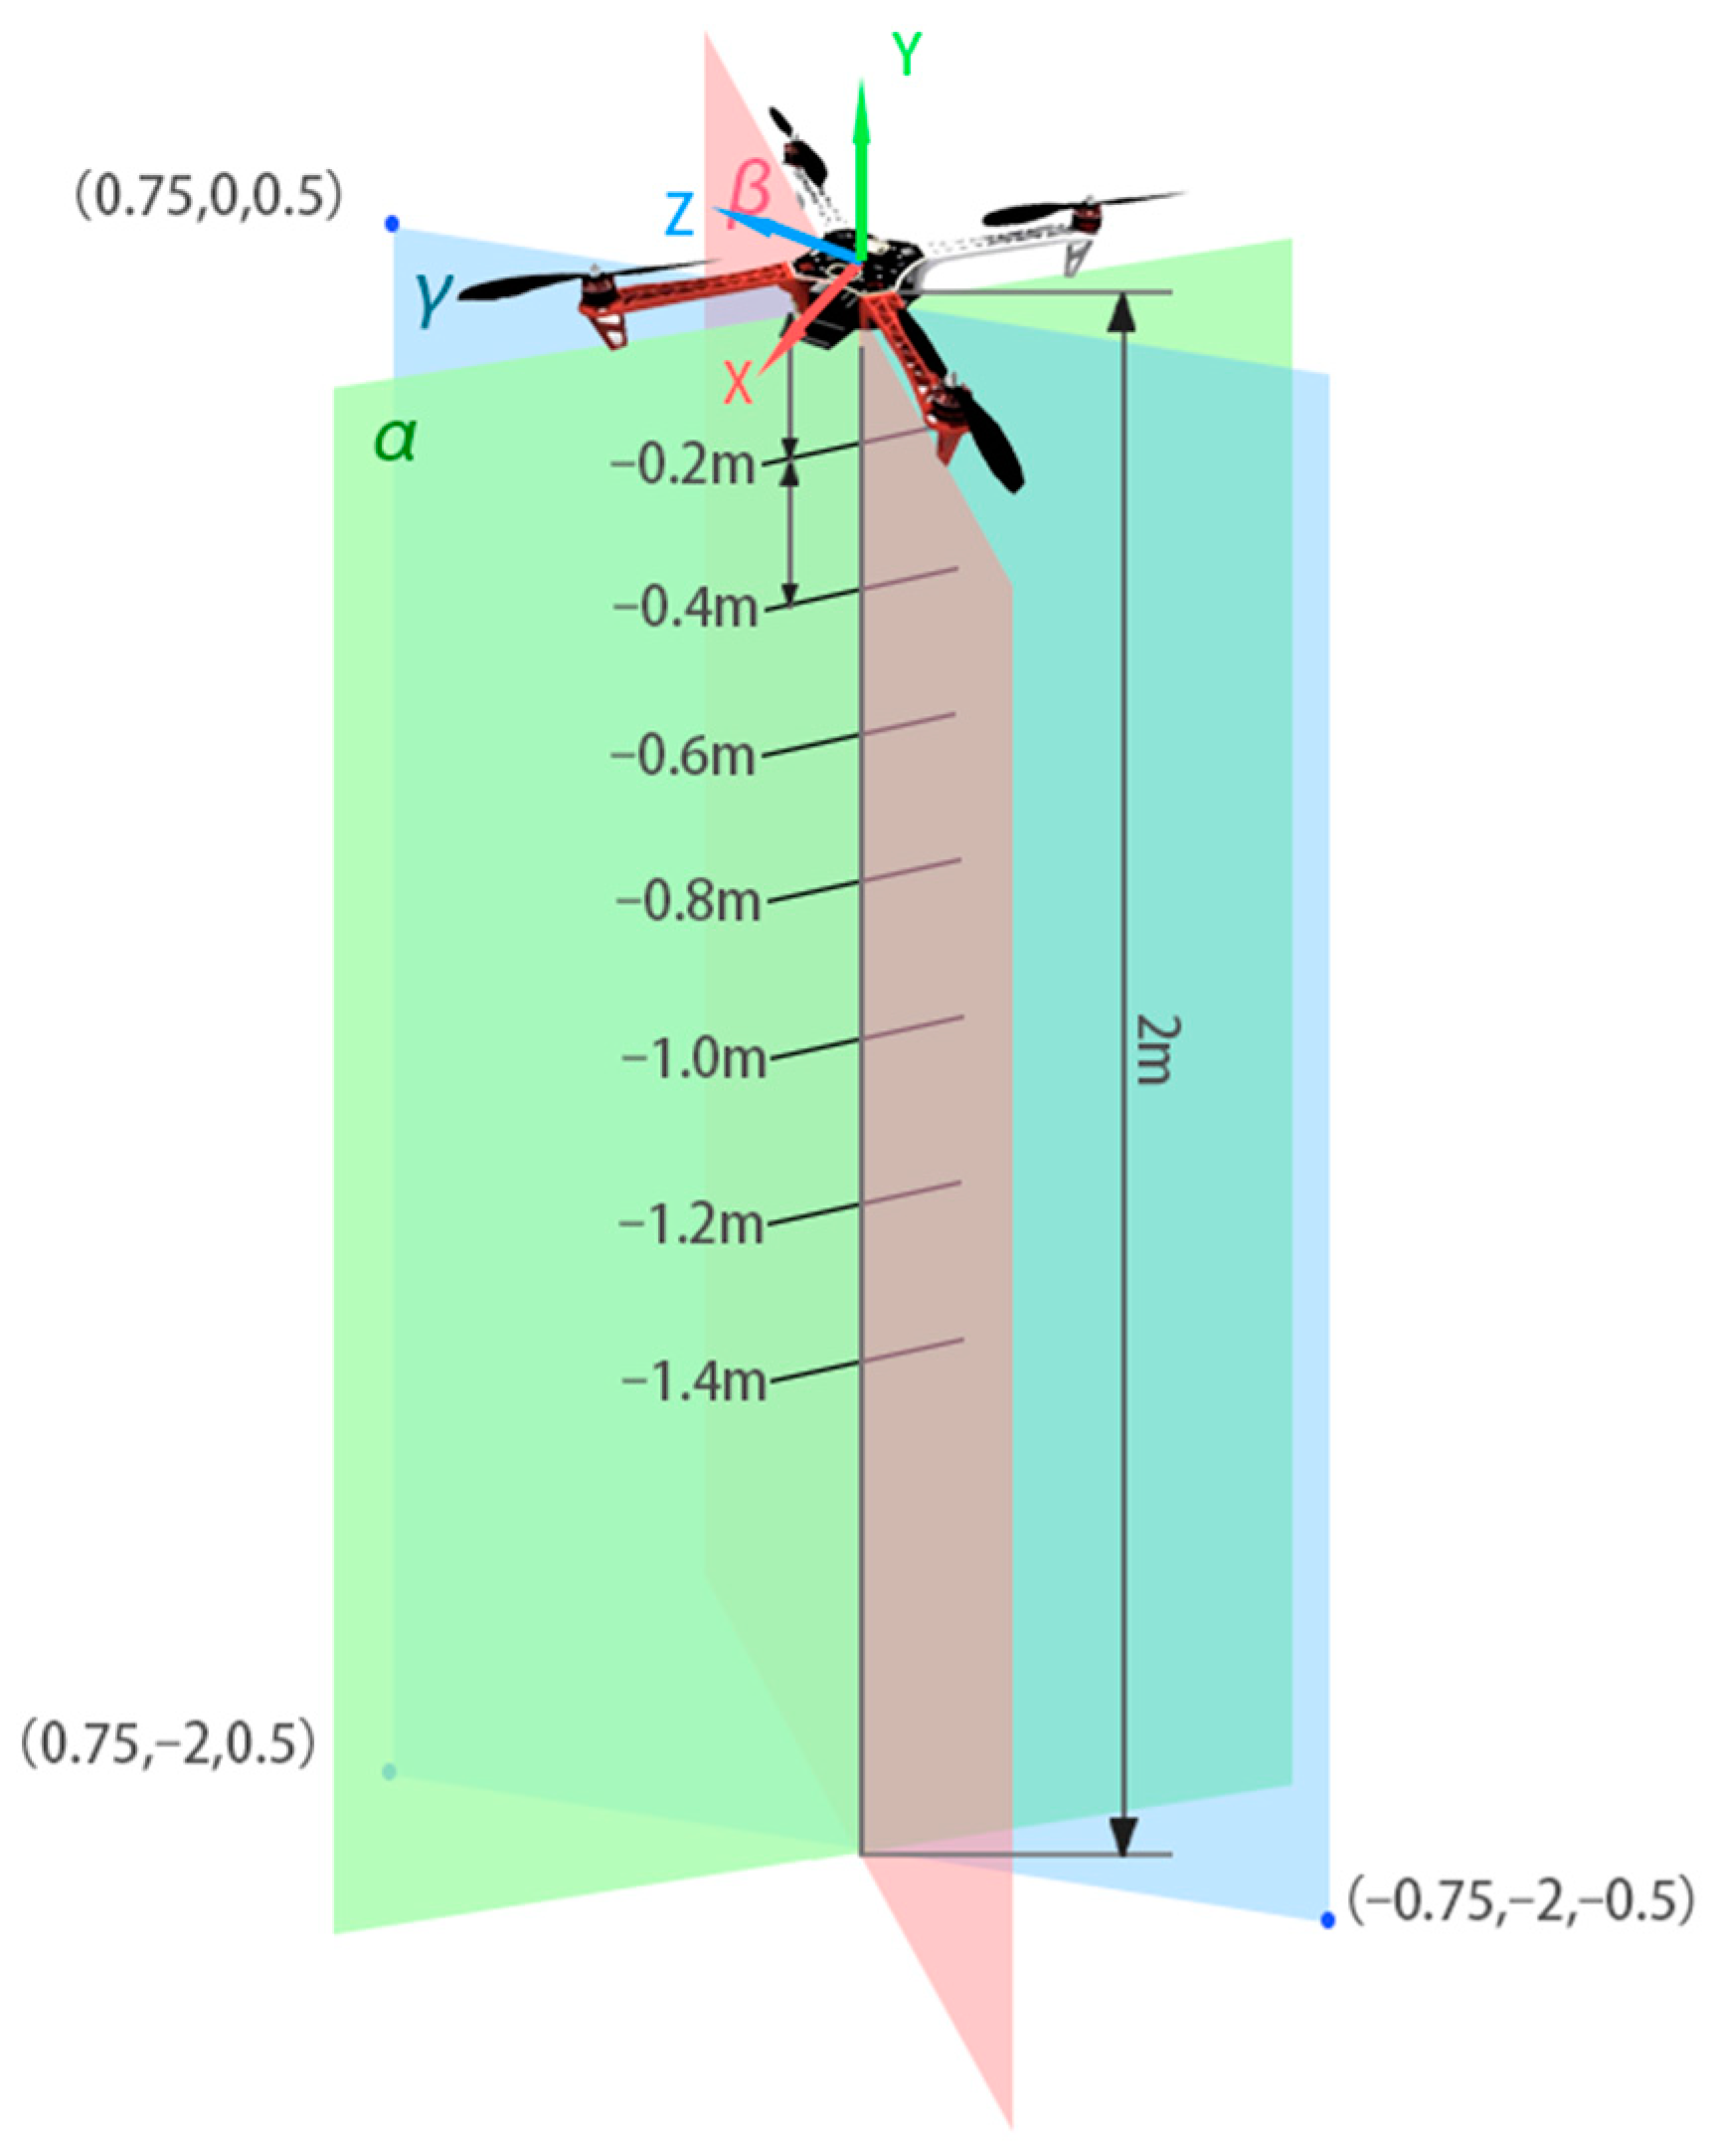
3.1. Simulation Calculation
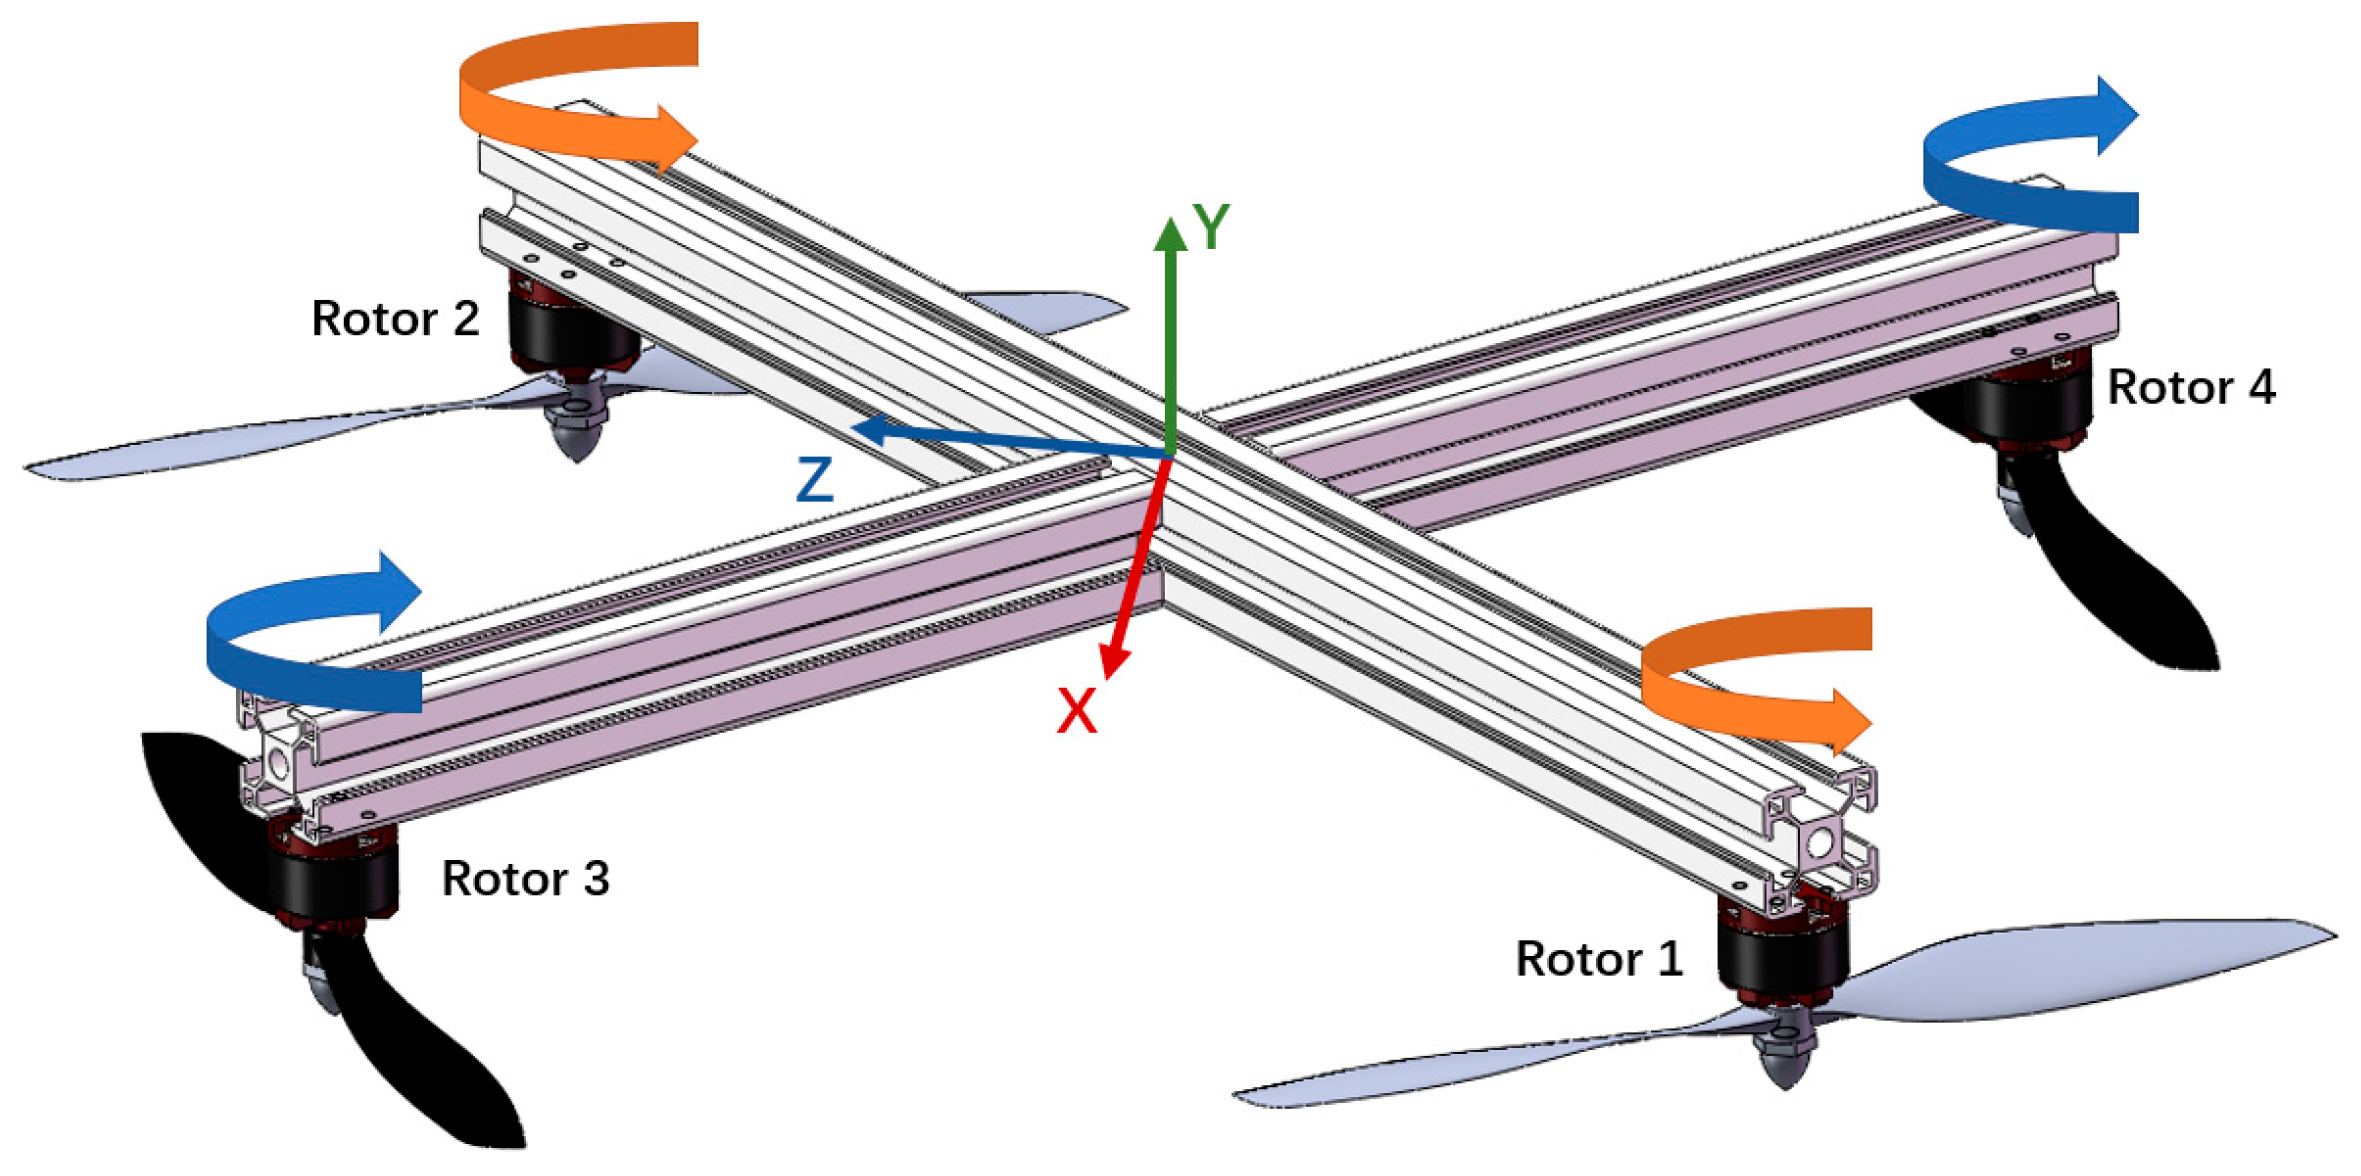
3.1.1. Establishing the 3D Model of the DJIF450

| Name | Model (Size) |
|---|---|
| Mode of distribution | “X” distribution |
| Wheelbase | 450 mm (shown in Figure 4) |
| Rotor | Imitation APC 10 × 4.7 p (HY, China) |
| ESC (electronic speed controller) | HOBBYWING, China (X-Rotor 20 A) |
| Rotor specification | Quansheng 2216 KV950 (Table 3) |
| Parameters | Value |
|---|---|
| Manufacturer | Quansheng (China) |
| Maximum current | 15 A |
| Size | φ22.7 mm × H (height) 24.2 mm |
| Mass Maximum power | 52 g 280 w |
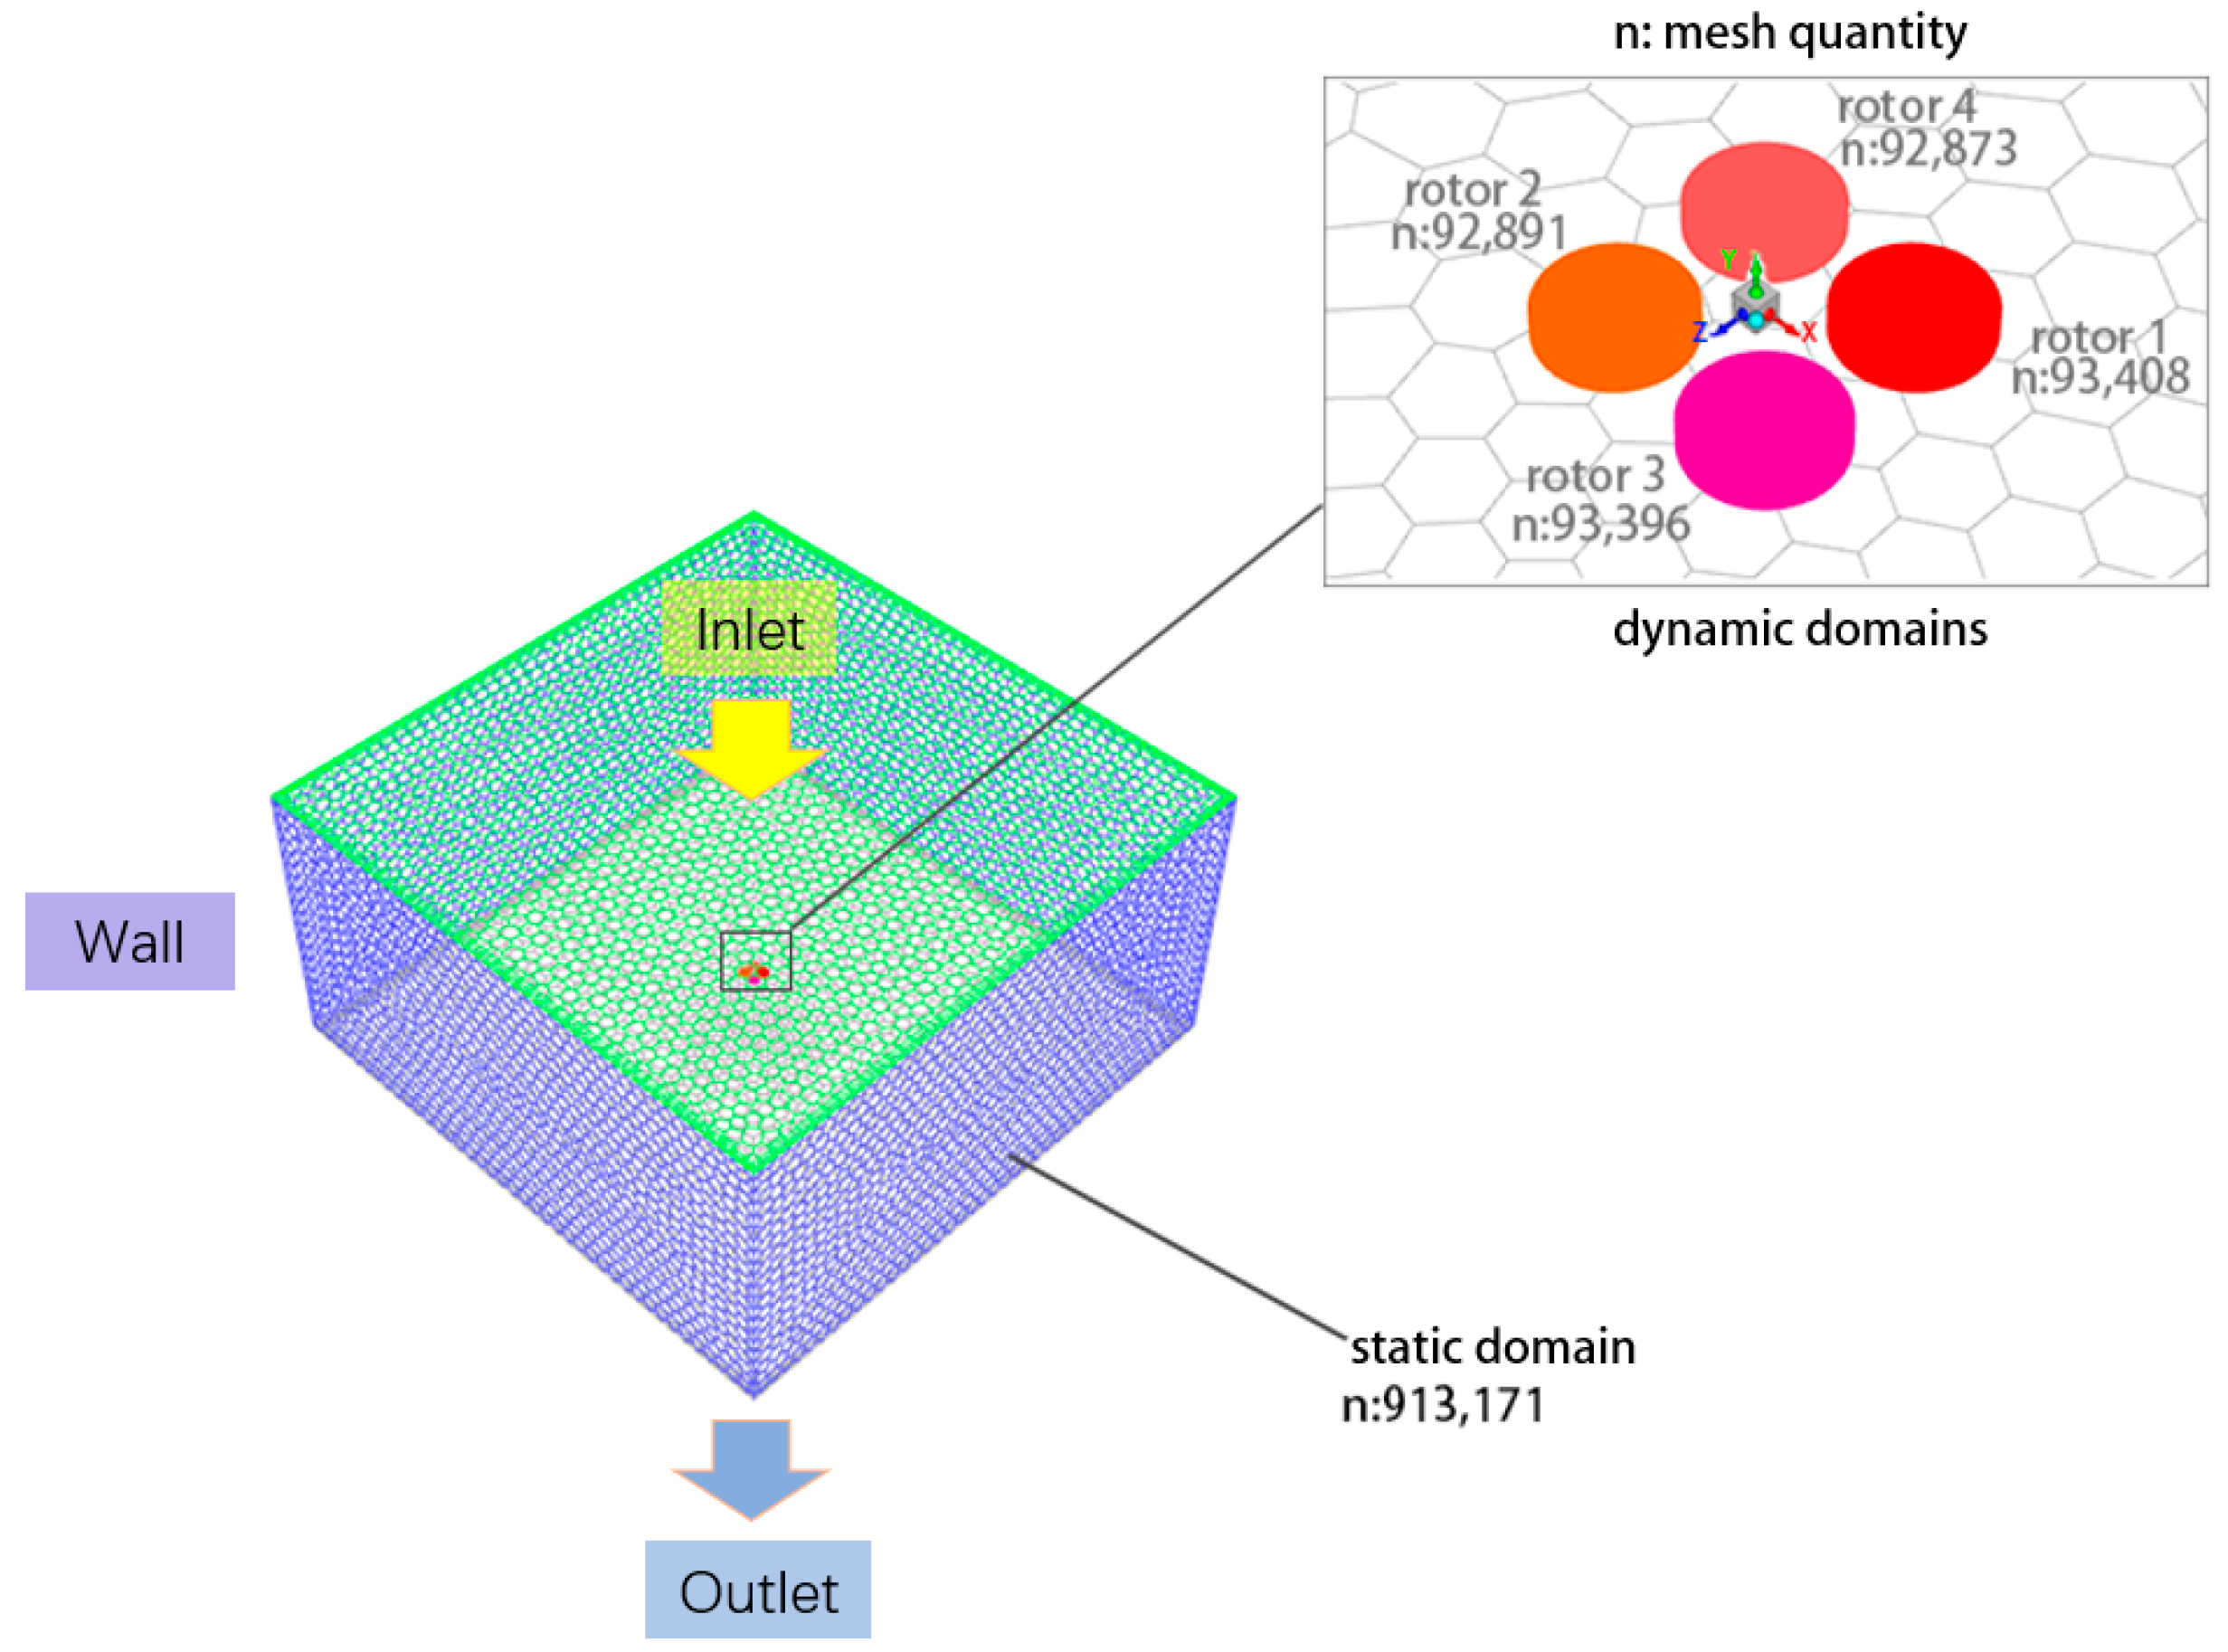
3.1.2. Meshing the 3D Model
3.1.3. Setting the Simulation Parameters
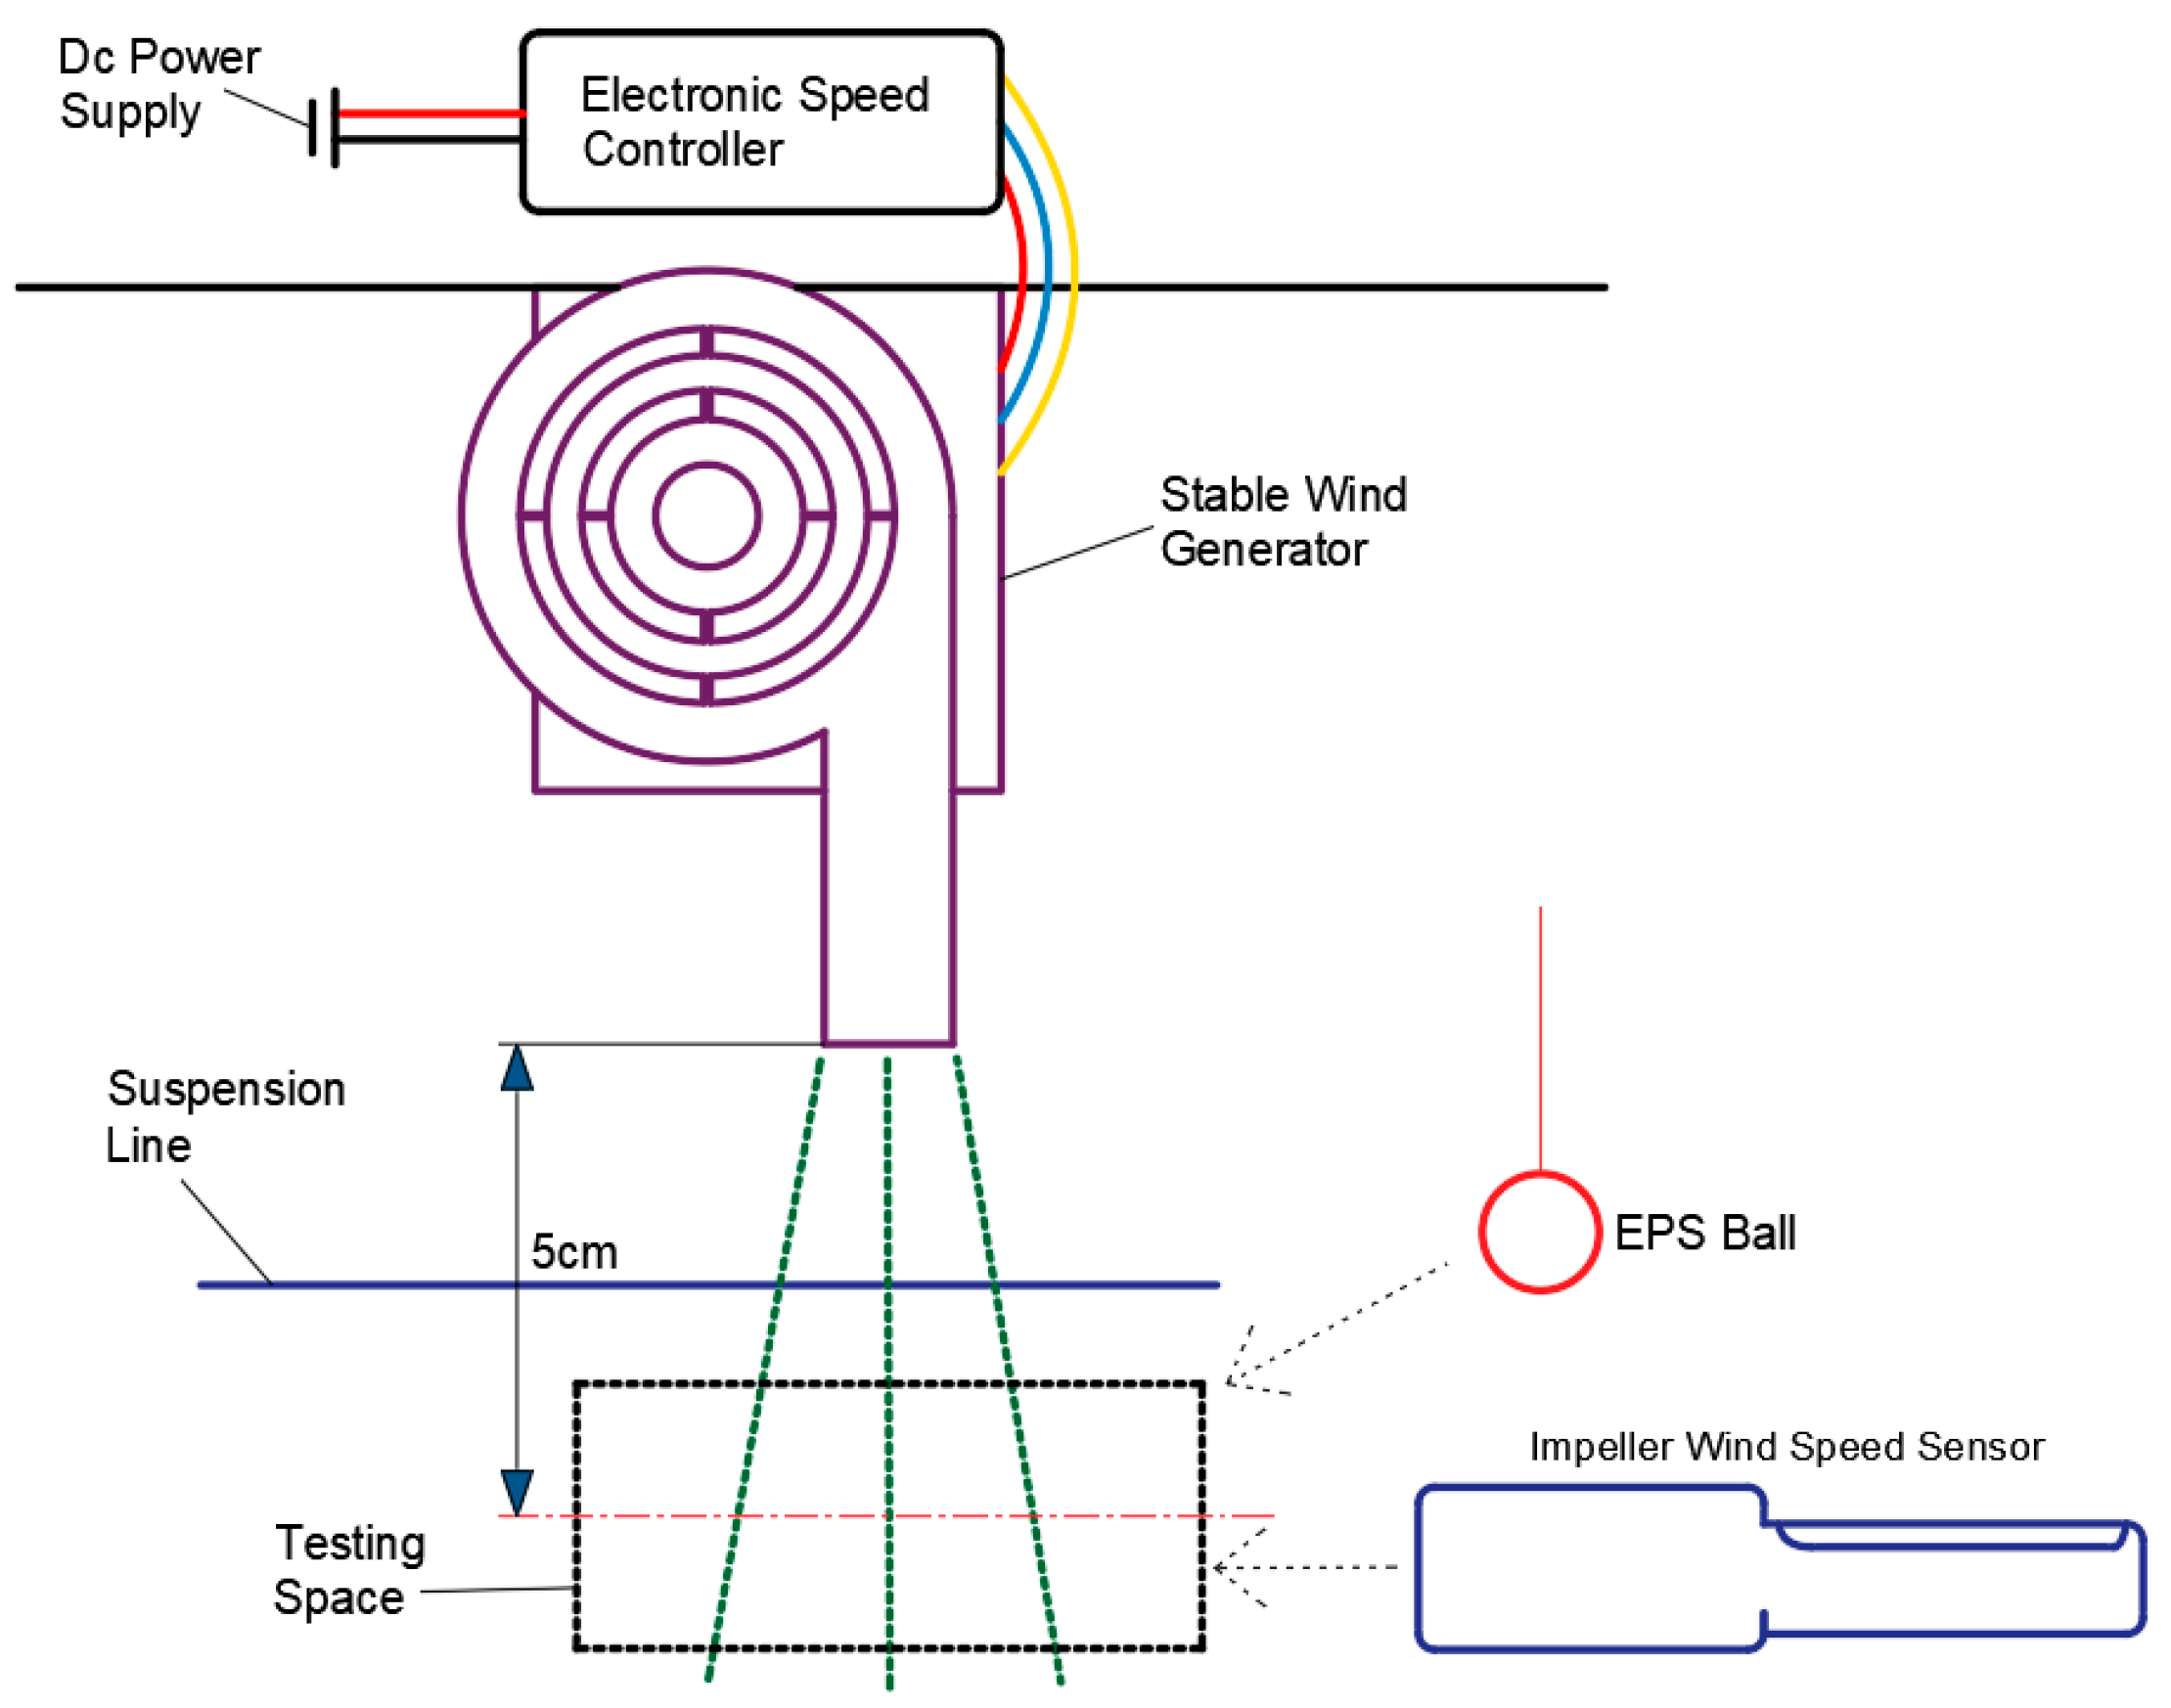
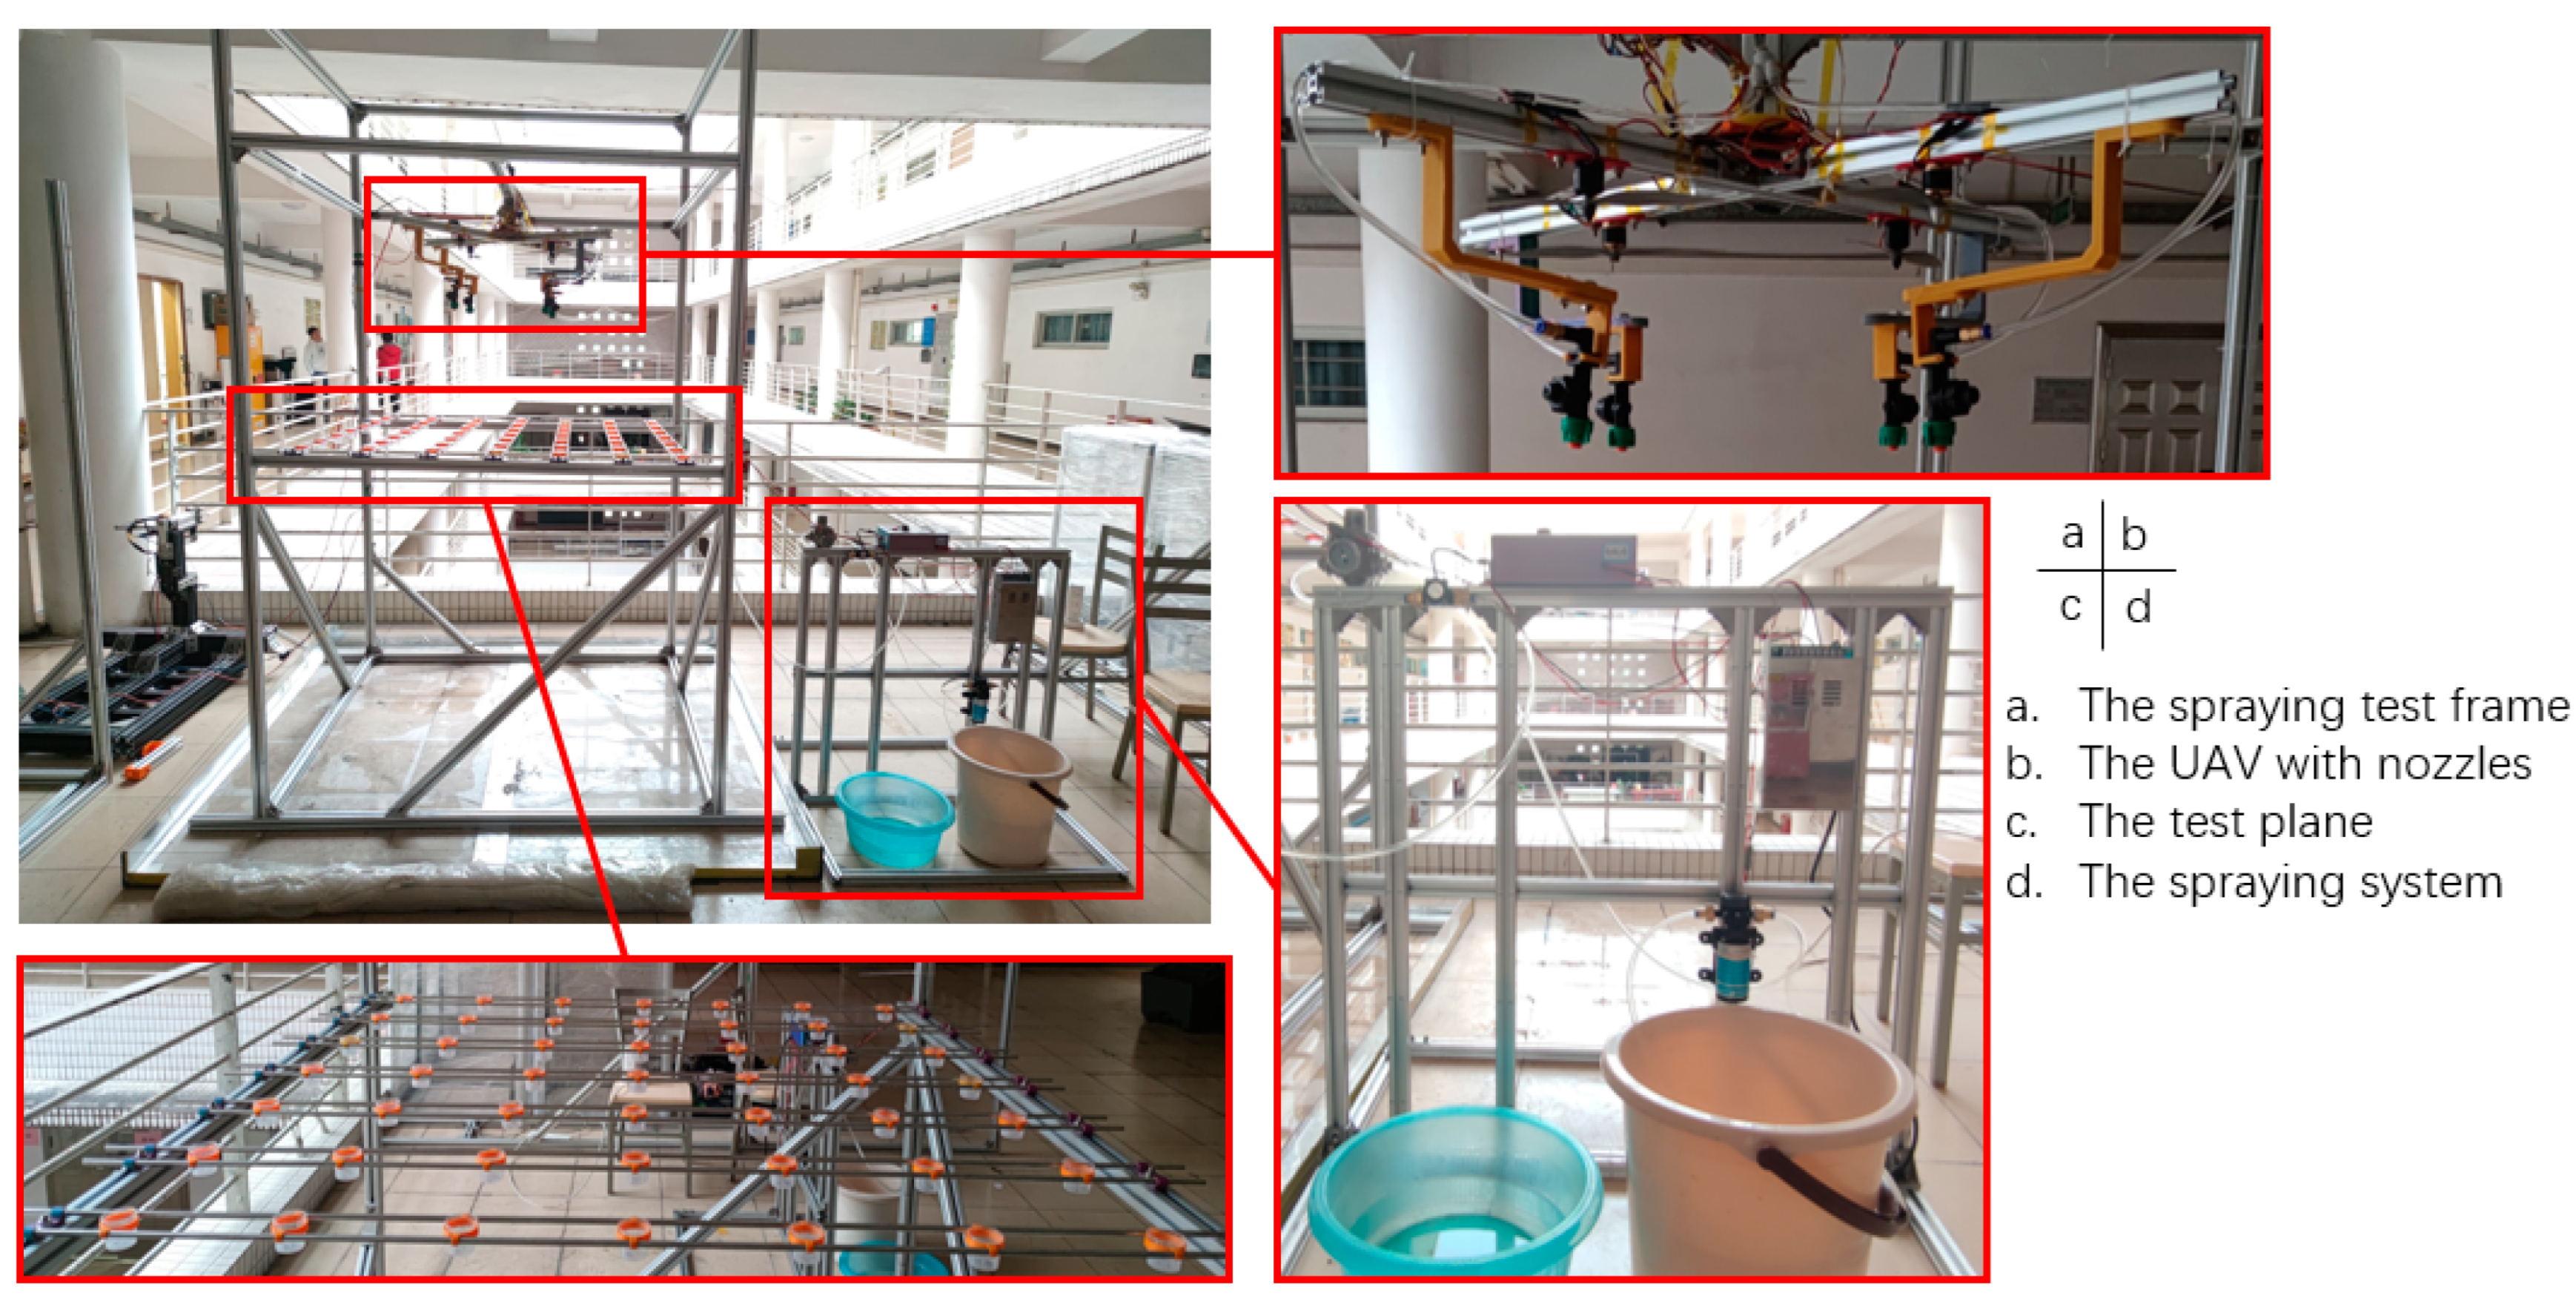
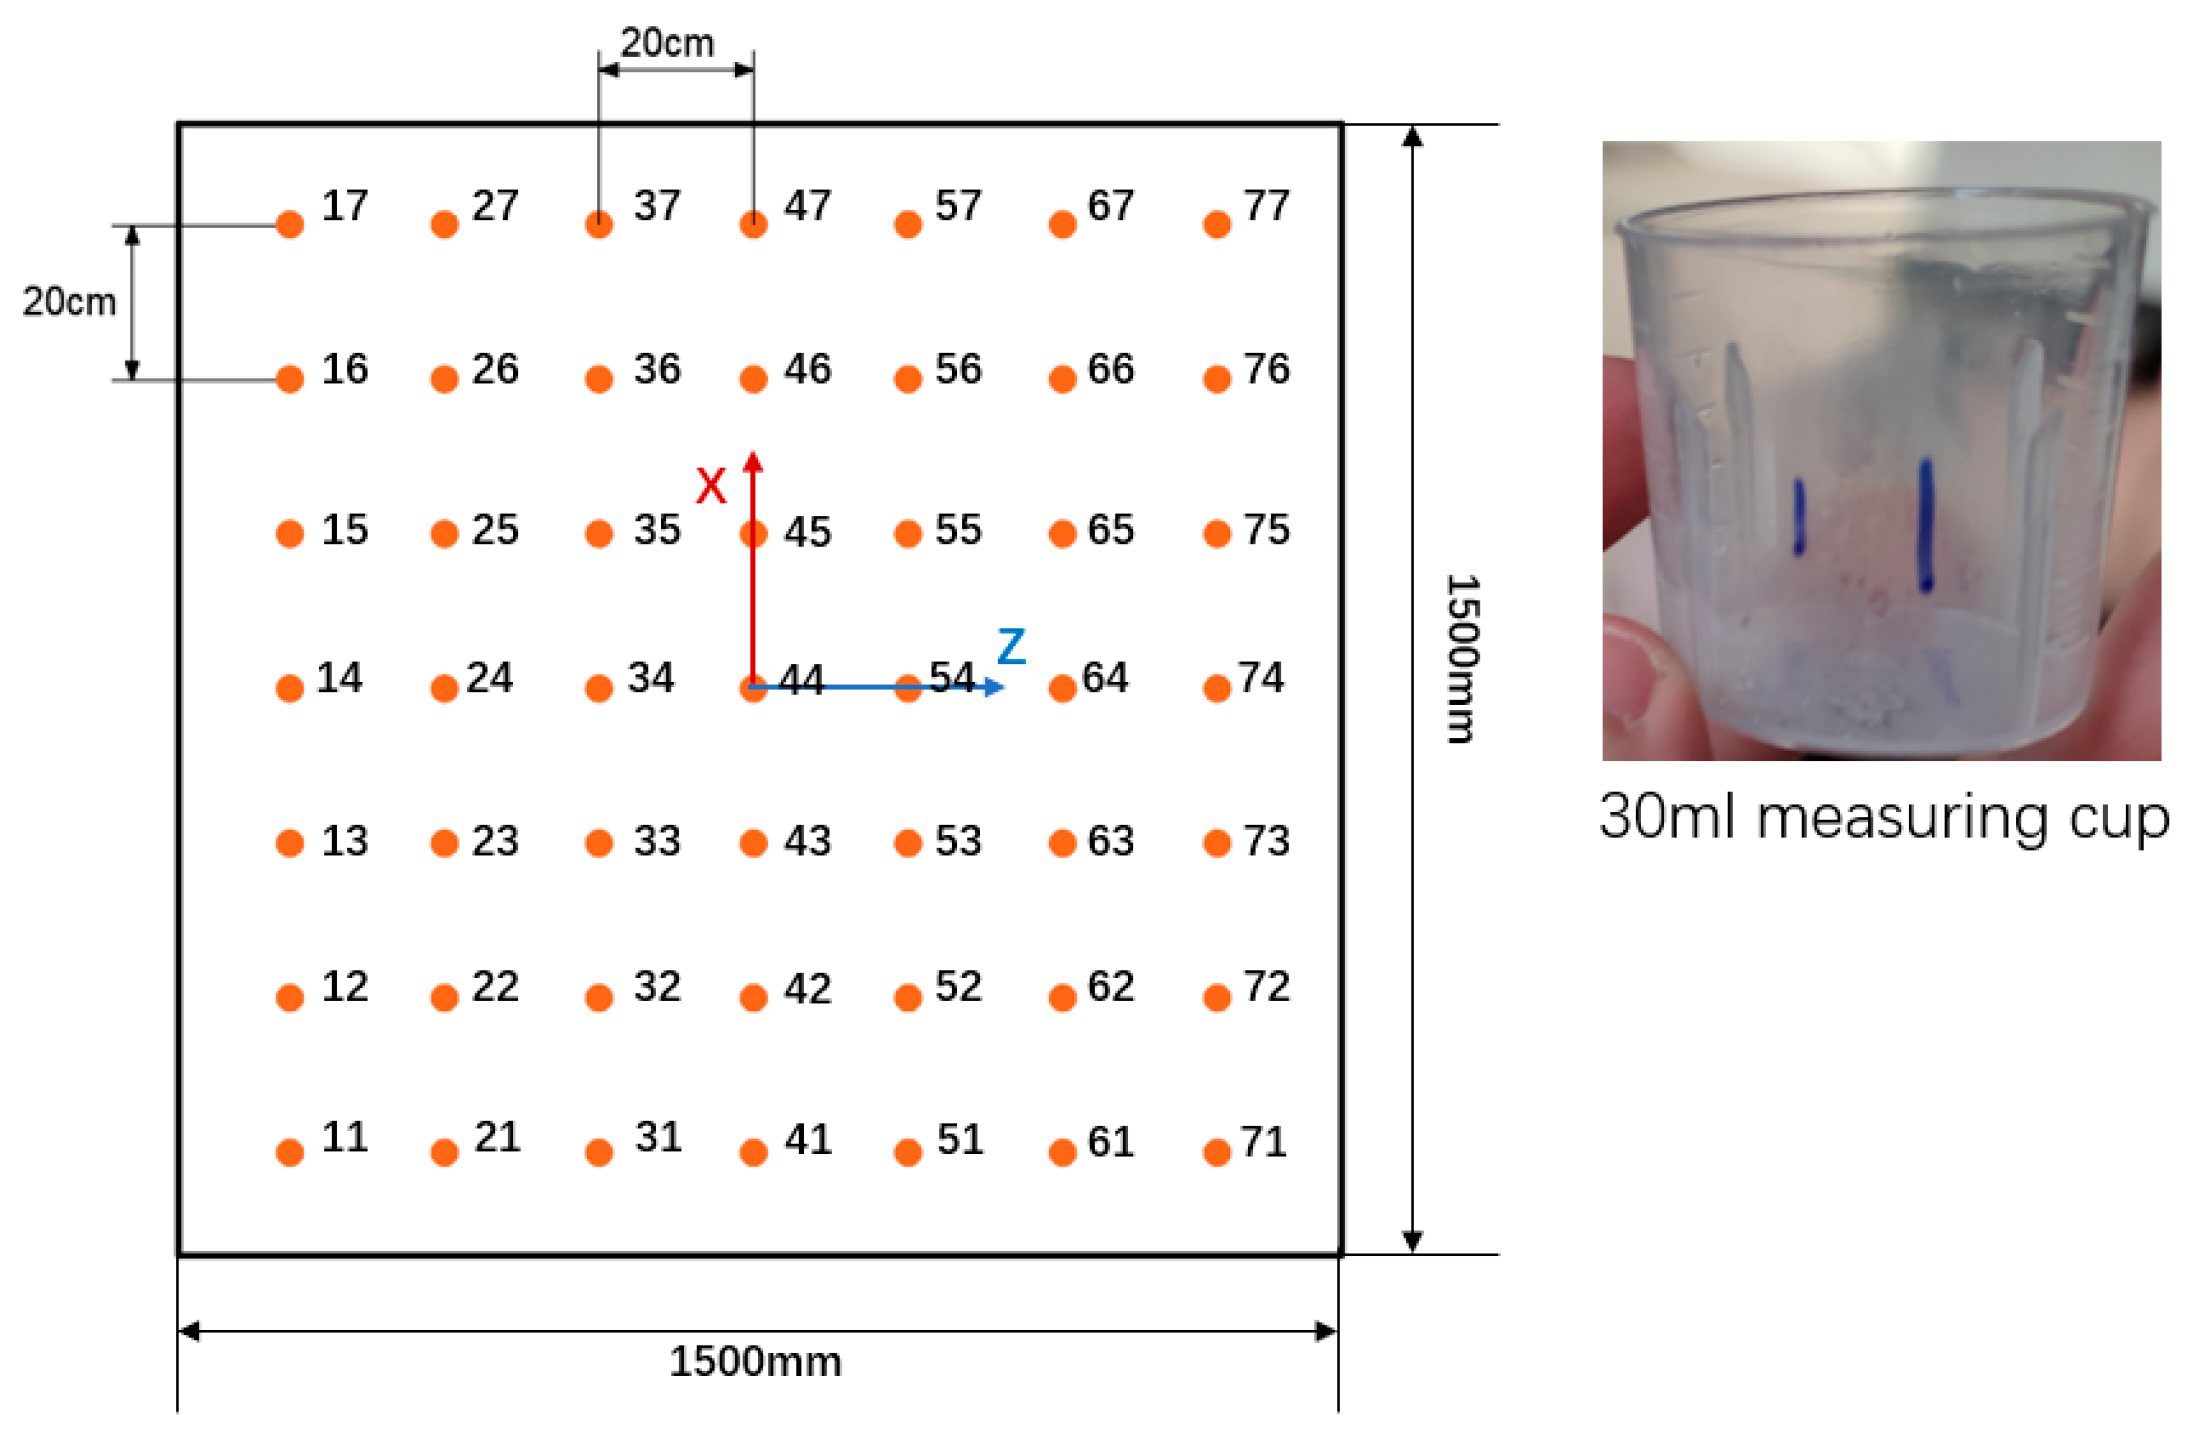
3.2. Validation Experiment Materials and Methods
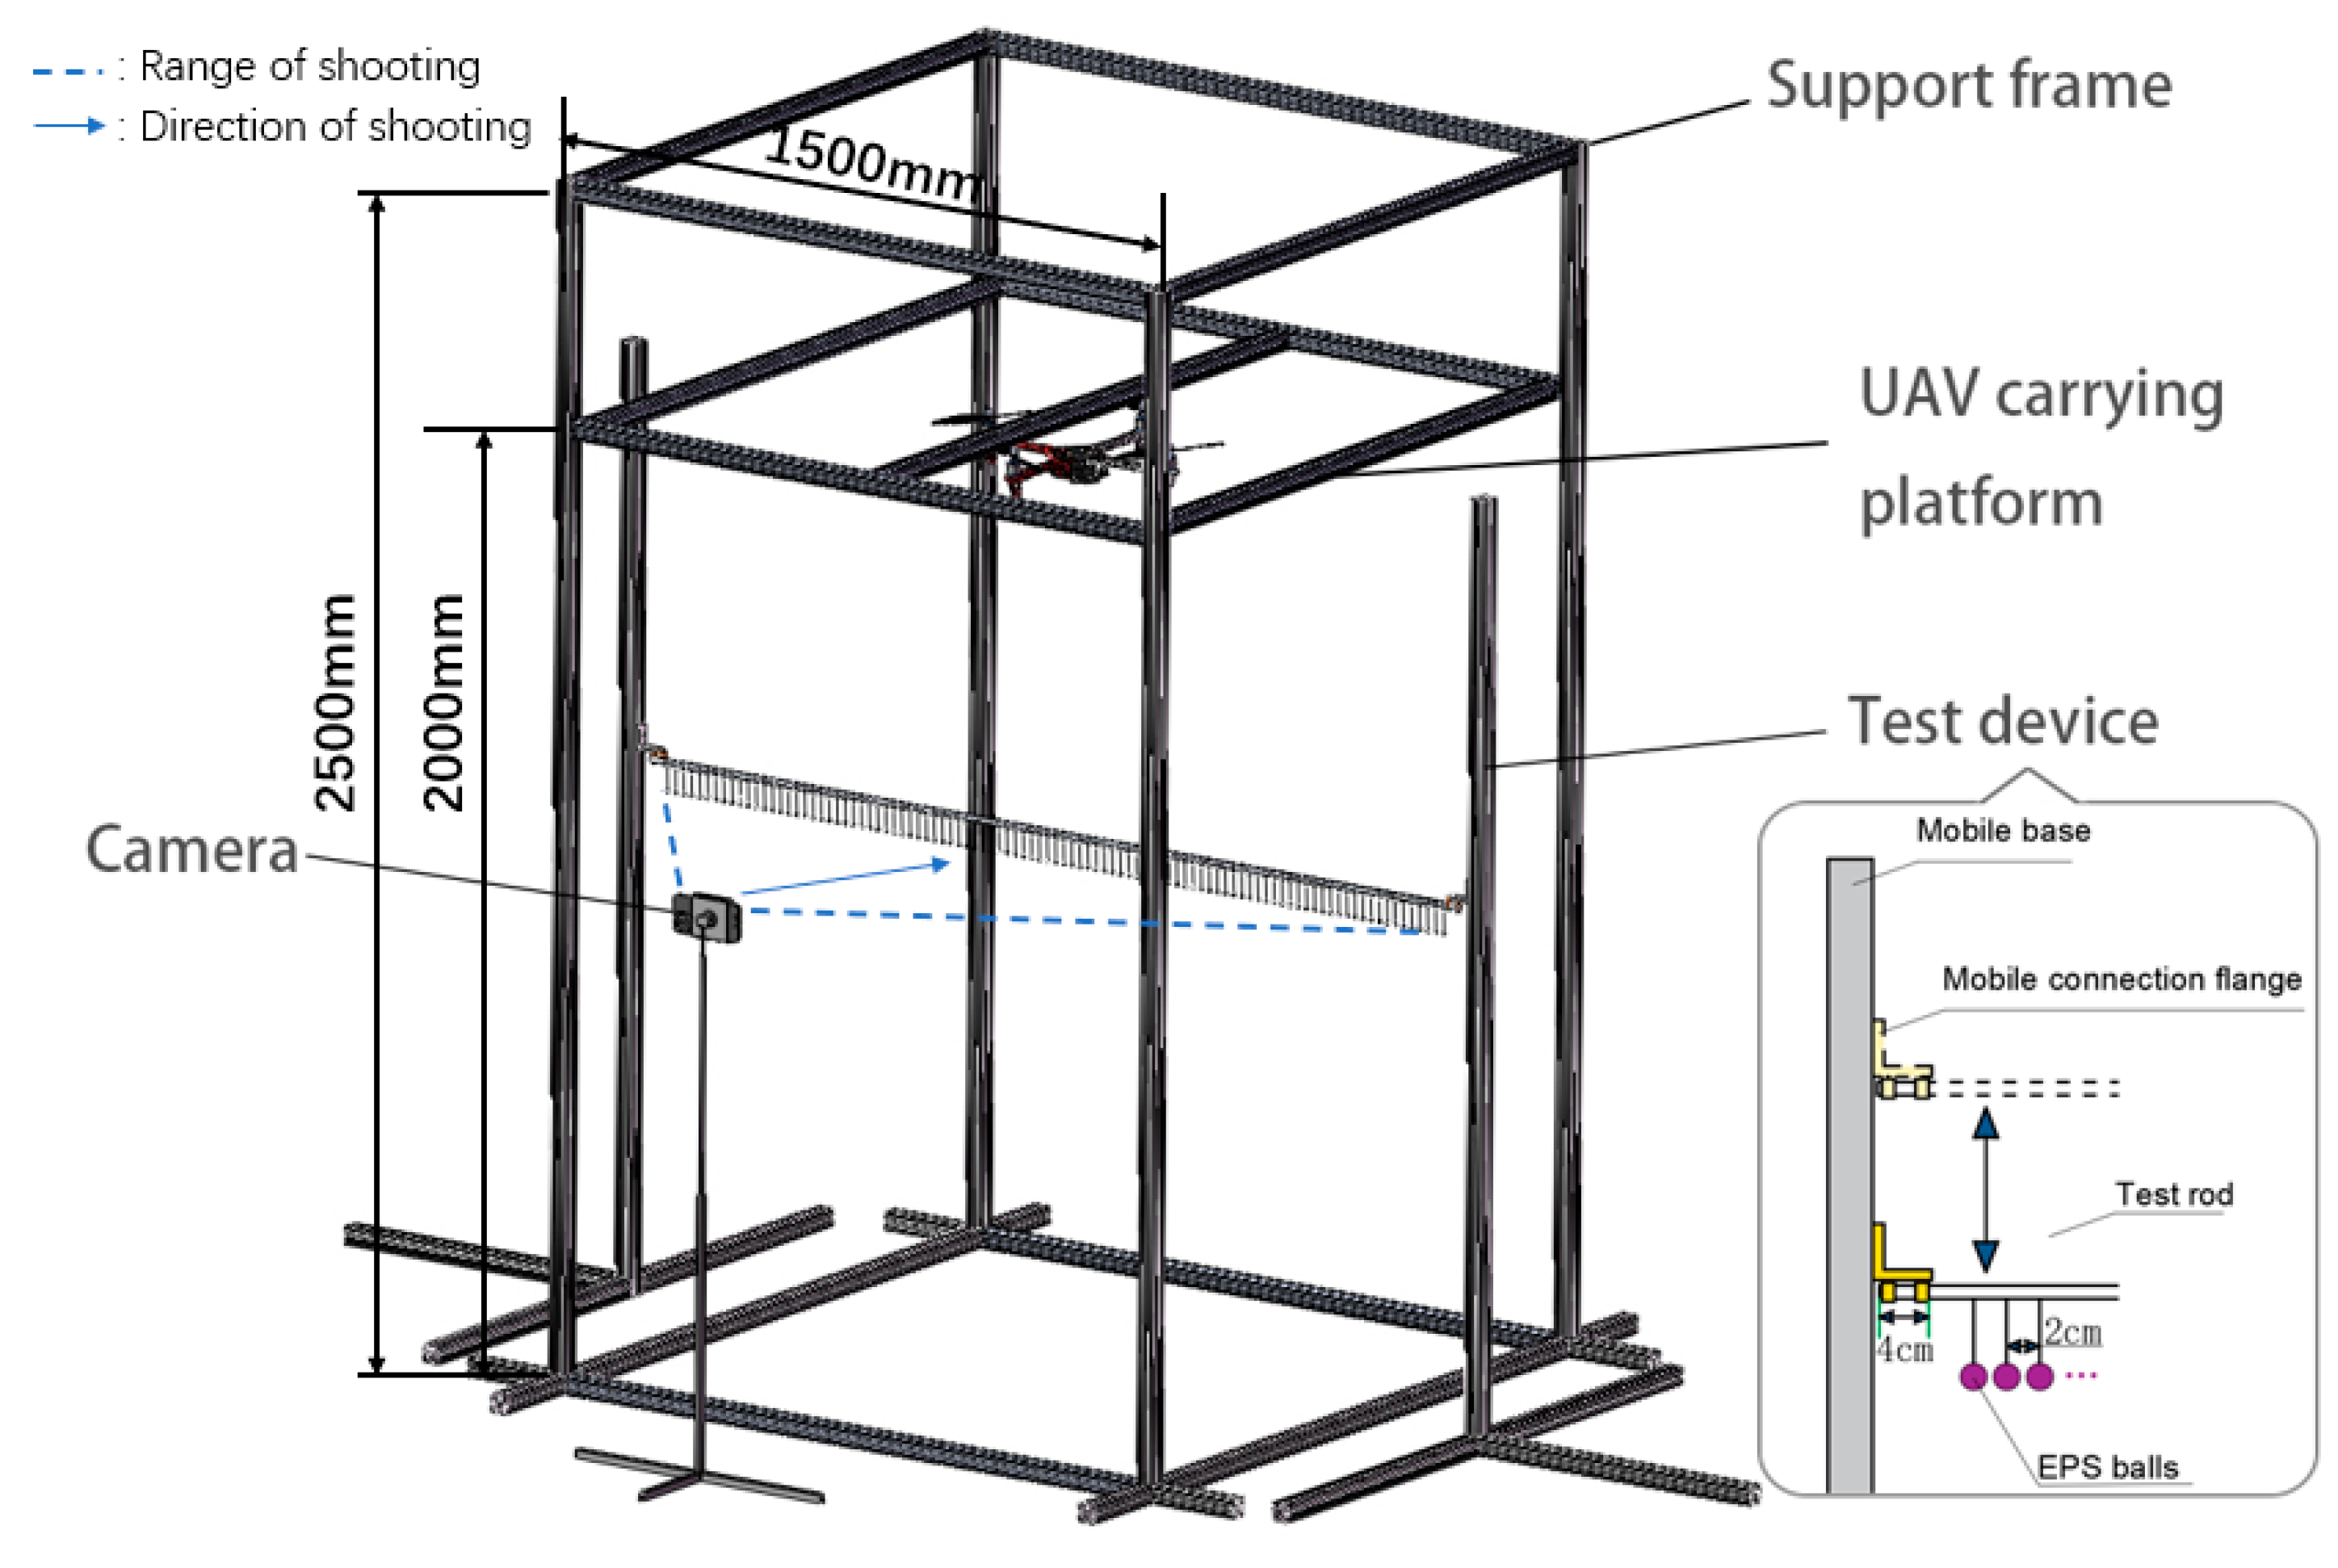
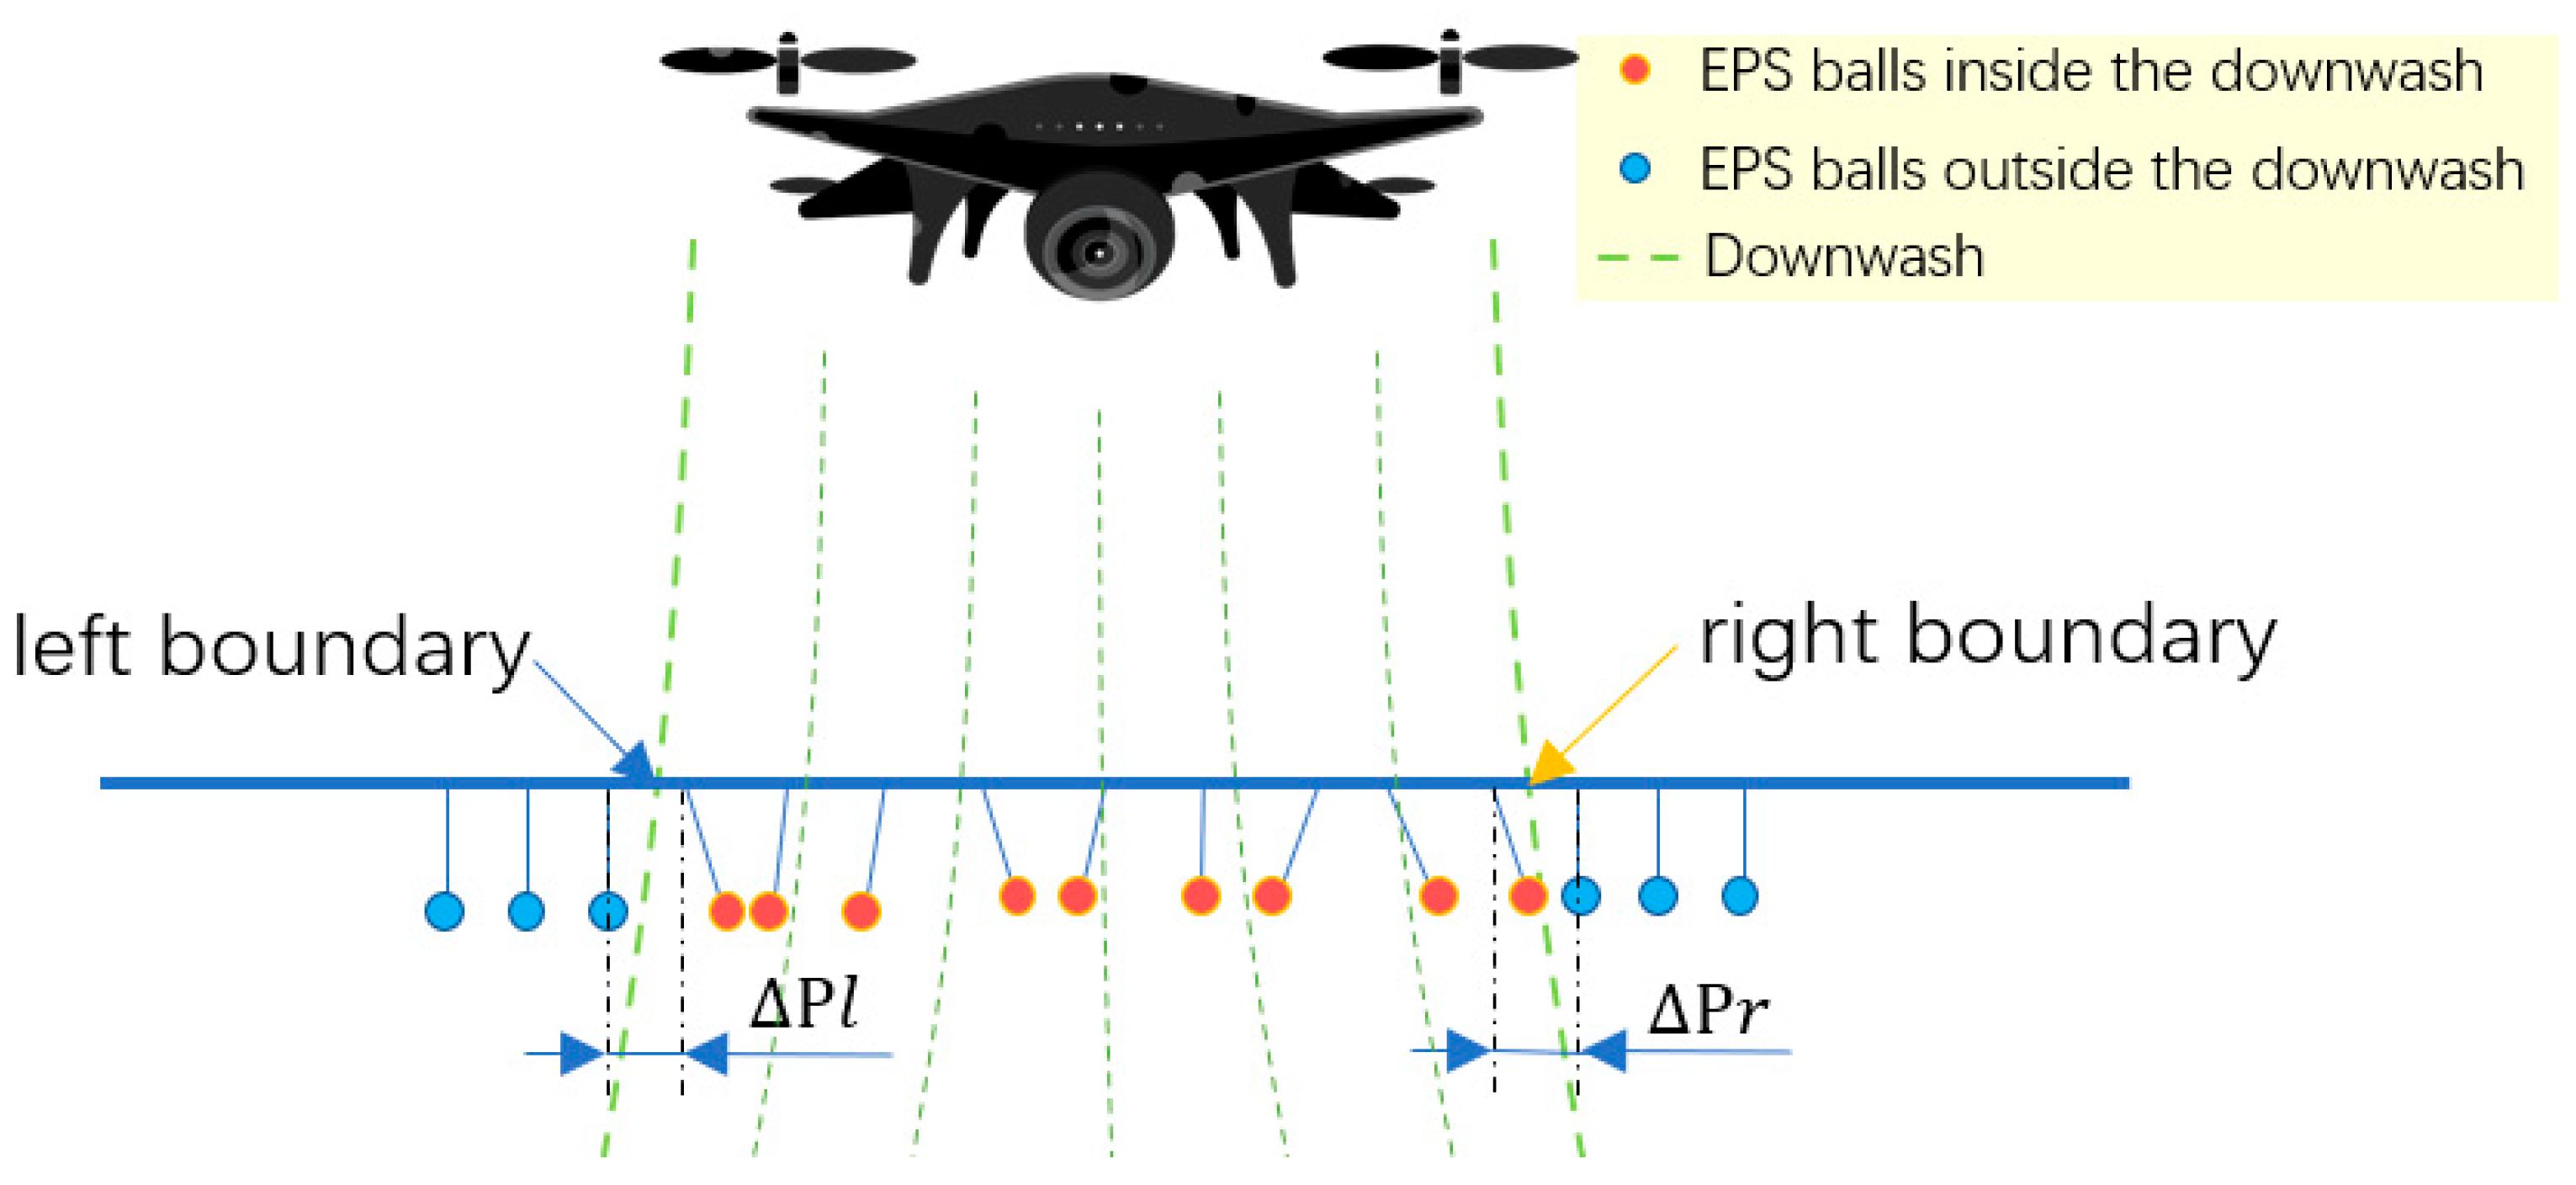
3.3. Experiment on the Relationship between Spray Deposition and Wind Field Range
4. Results and Analysis
4.1. Accuracy Verification of the Simulation Results
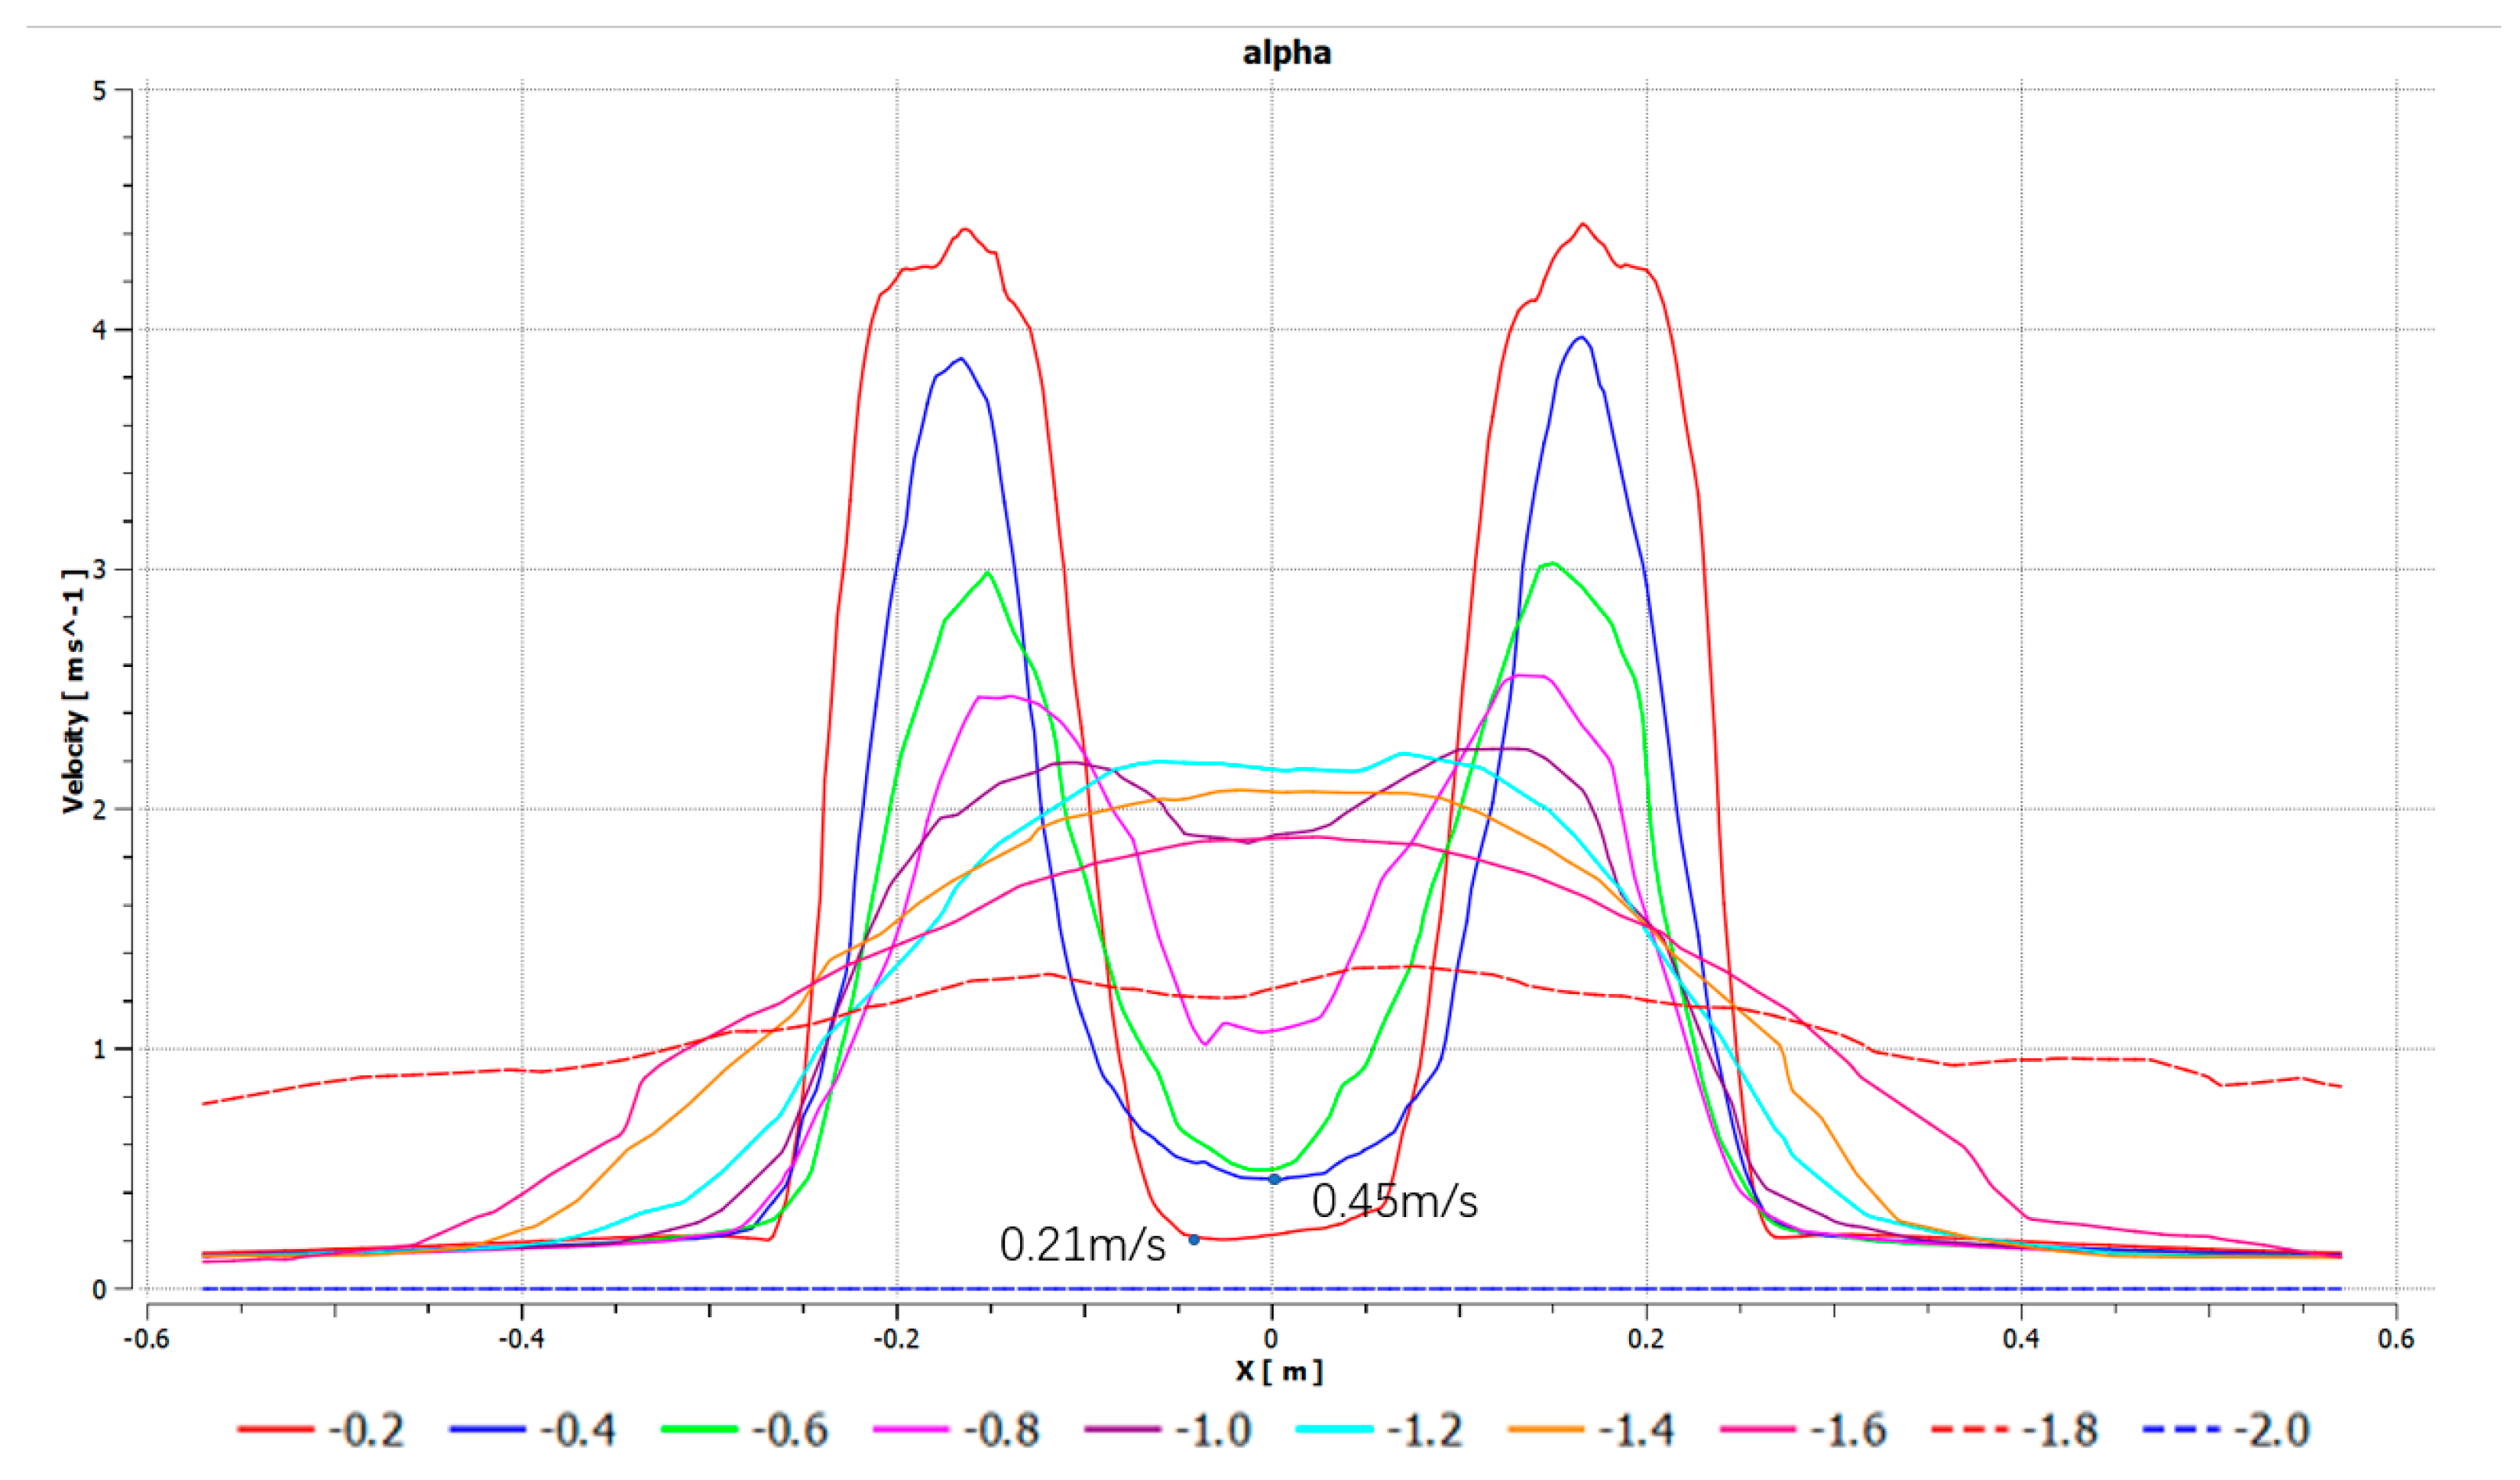
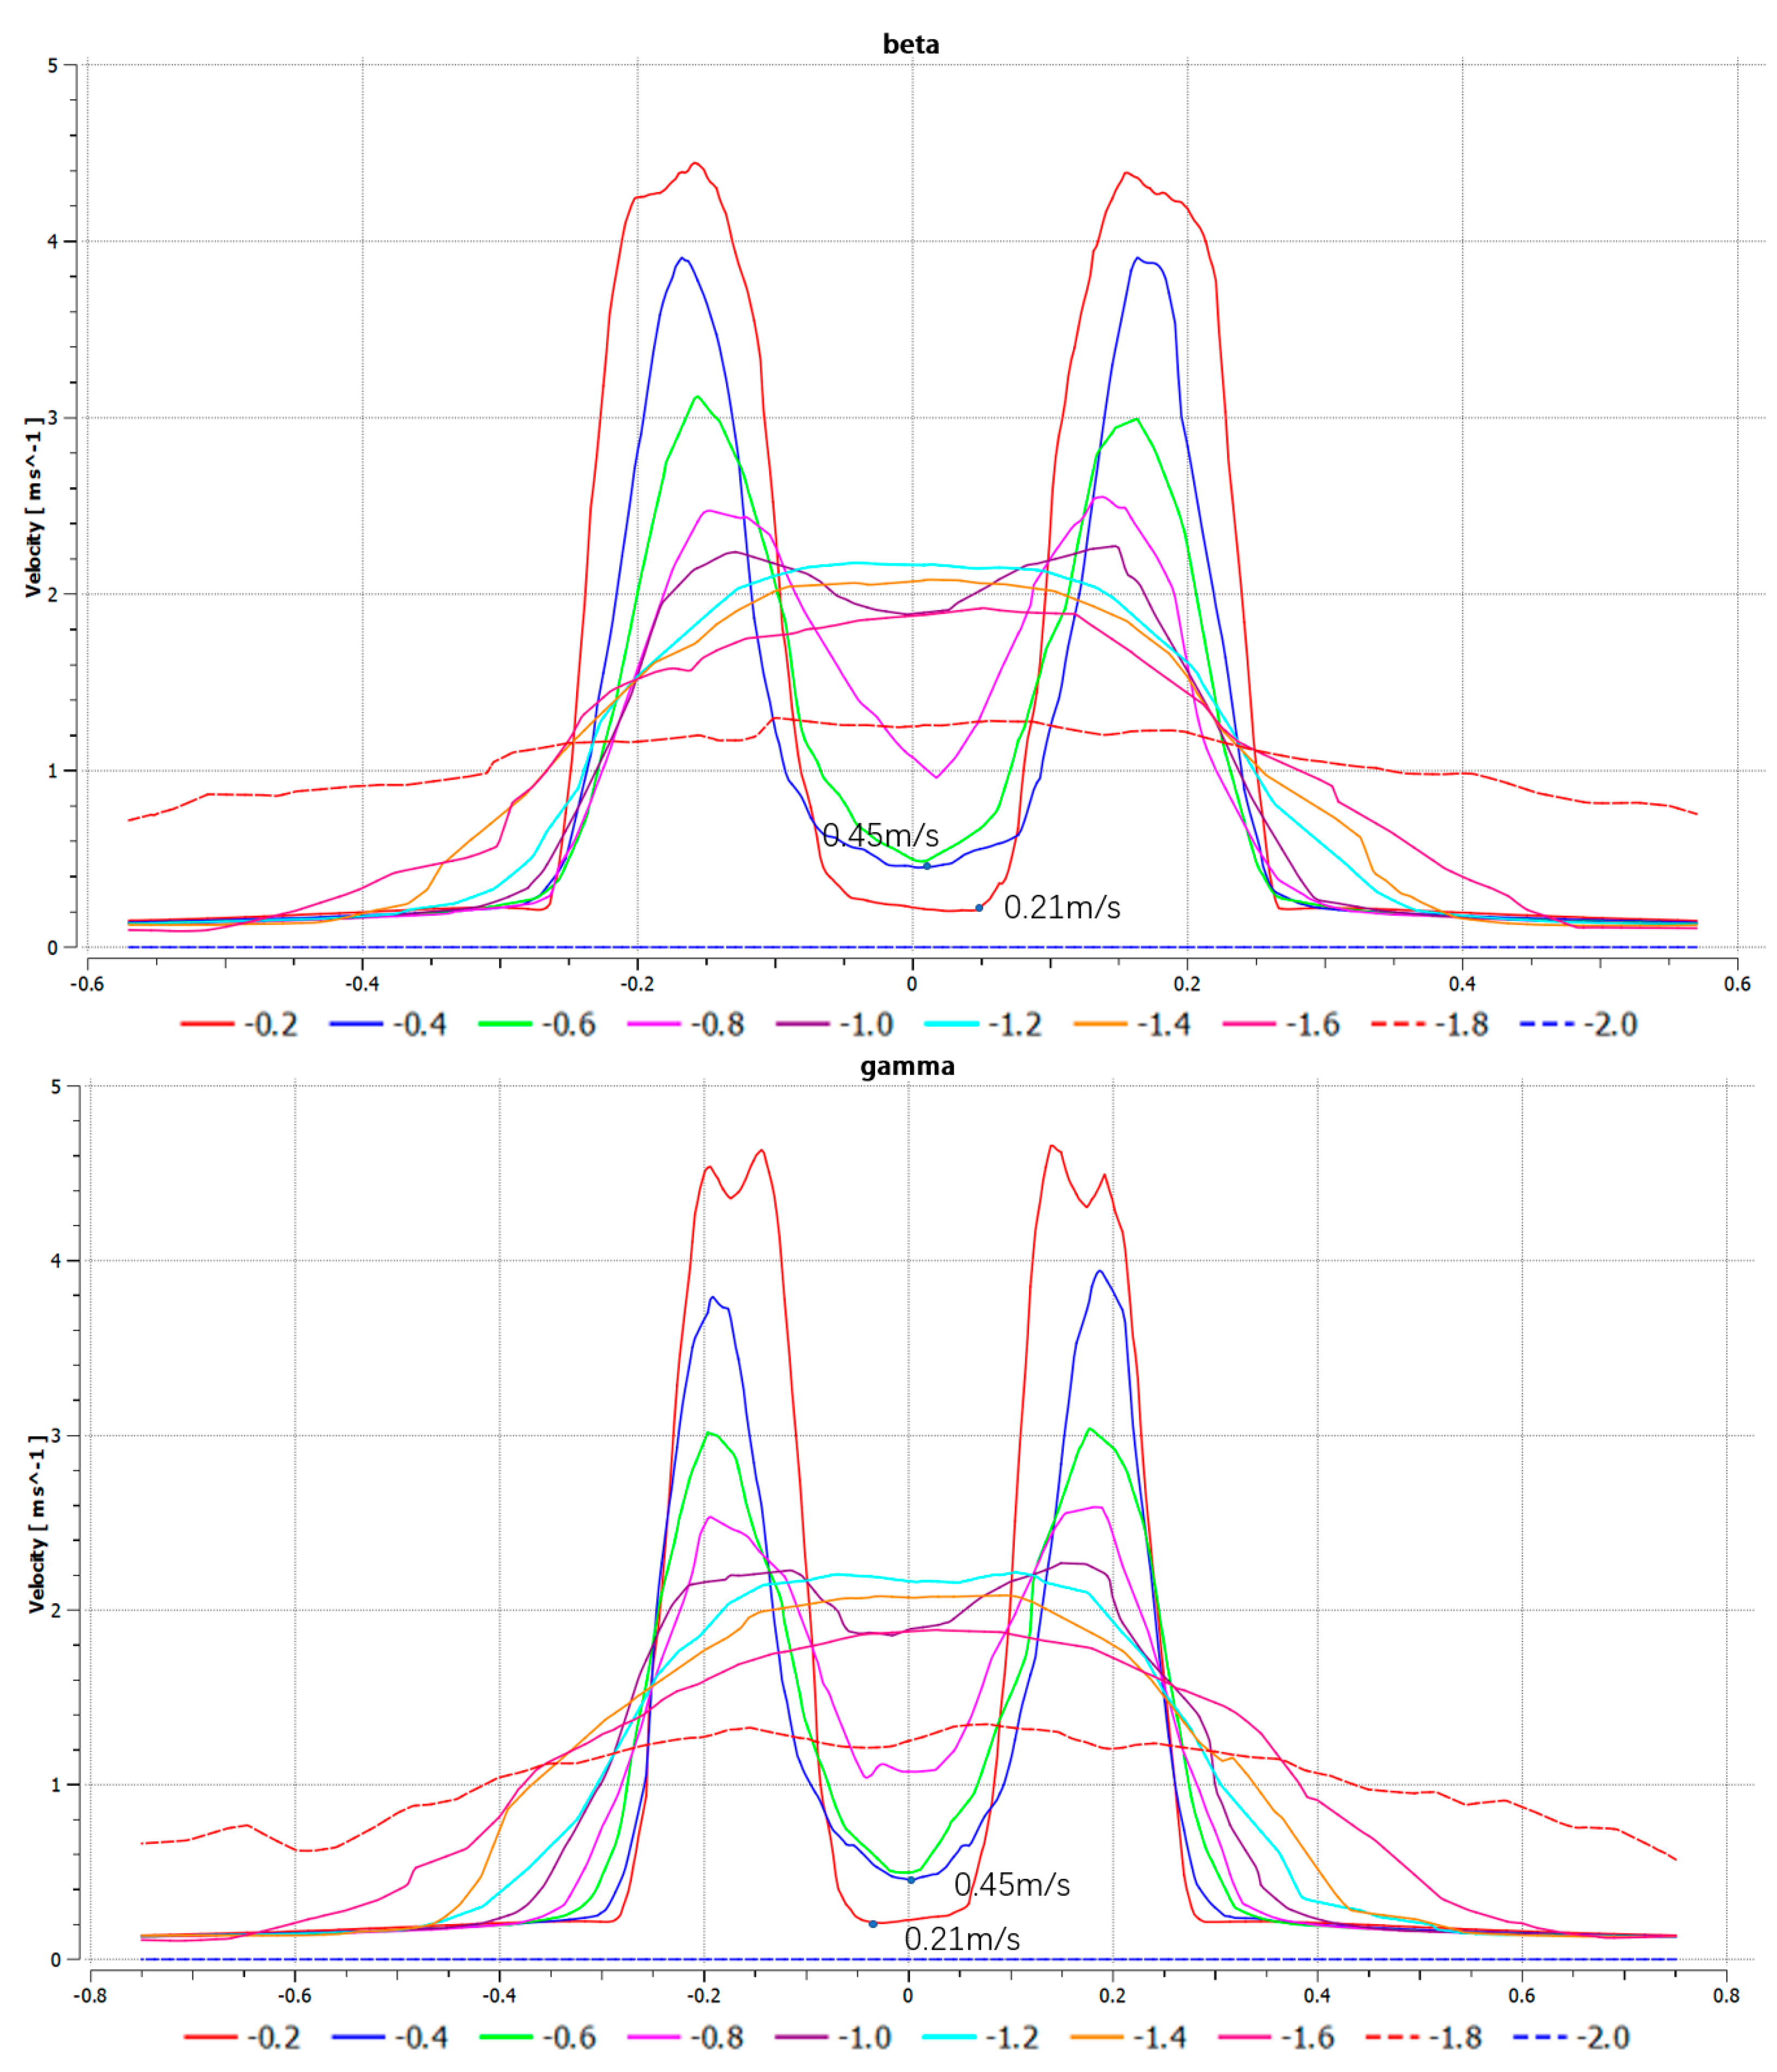
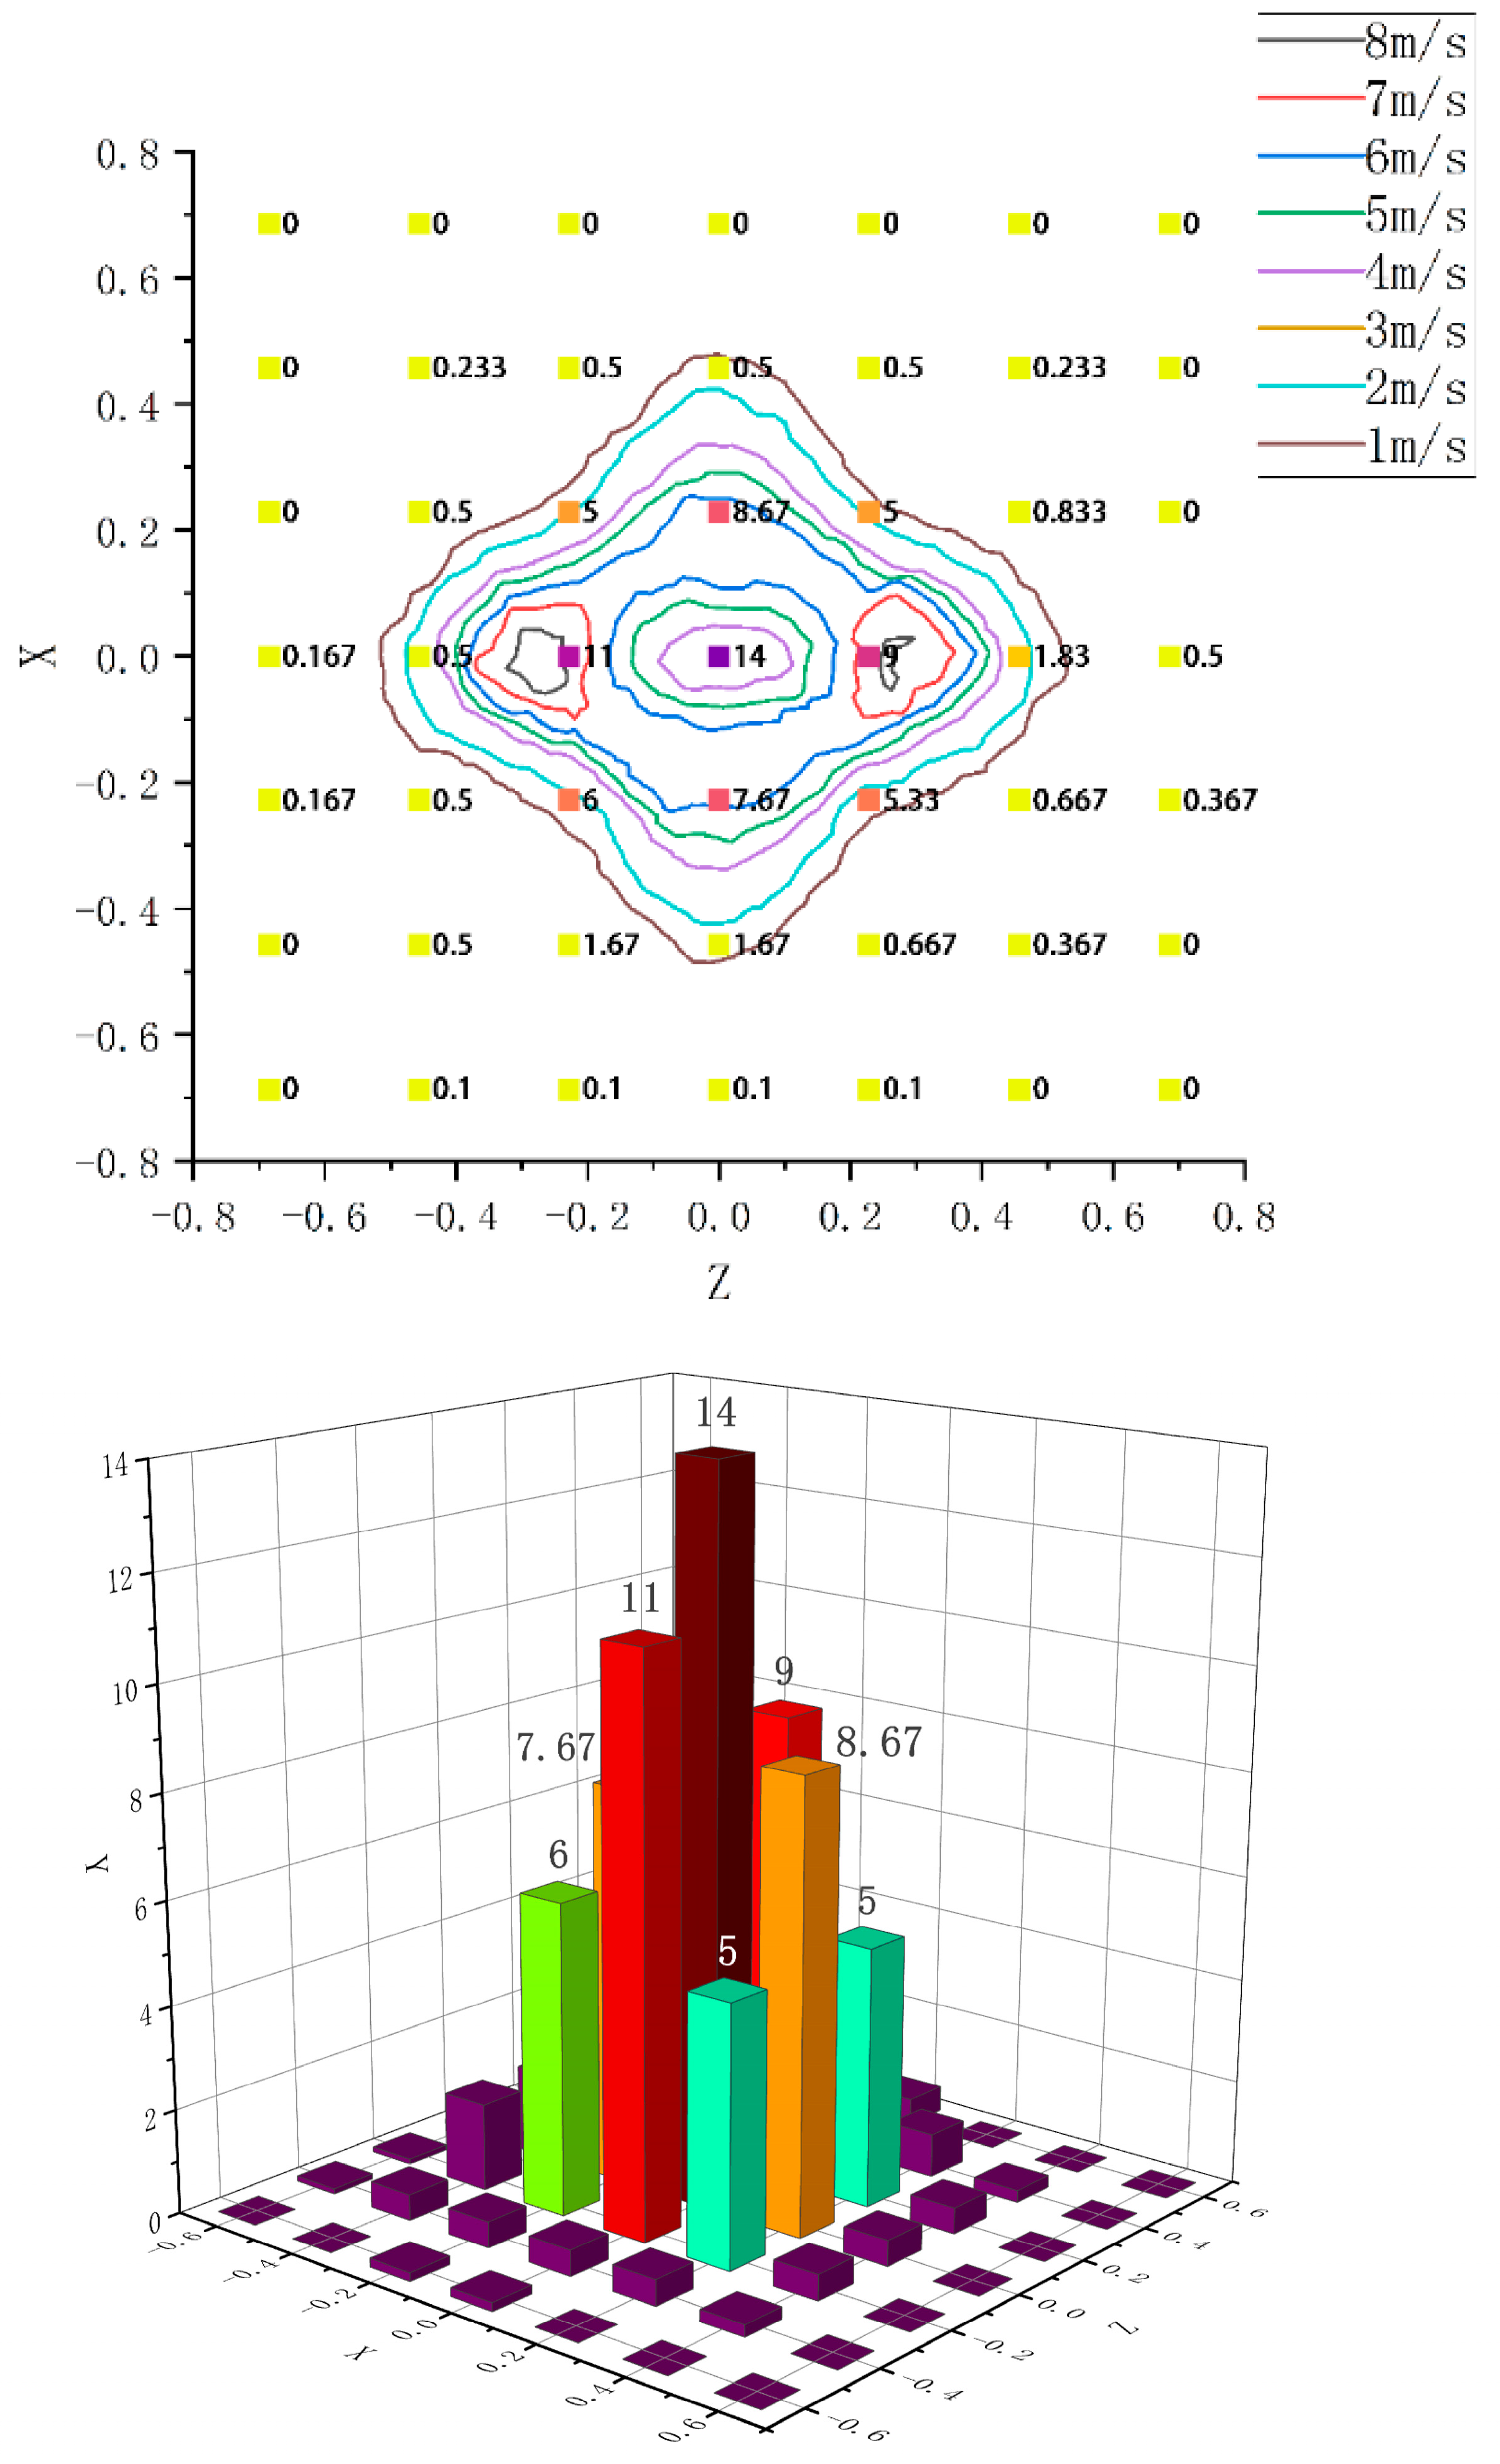
4.2. Analysis of Simulation Results
4.3. Analysis of the Experimental Results of the Relationship between Spray Deposition and Downwash Field
5. Conclusions
Author Contributions
Funding
Institutional Review Board Statement
Data Availability Statement
Conflicts of Interest
Appendix A
References
- Lan, Y. Exploration and development prospect of eco-unmanned farm modes. Trans. Chin. Soc. Agric. Eng. 2021, 37, 312–327. [Google Scholar]
- Chen, P.; Douzals, J.P.; Lan, Y.; Cotteux, E.; Delpuech, X.; Pouxviel, G.; Zhan, Y. Characteristics of unmanned aerial spraying systems and related spray drift: A review. Front. Plant Sci. 2022, 13, 870956. [Google Scholar] [CrossRef] [PubMed]
- Yang, F.; Xue, X.; Zhang, L.; Sun, Z. Numerical simulation and experimental verification on the downwash air flow of six-rotor agricultural unmanned aerial vehicle in hover. Int. J. Agric. Biol. Eng. 2017, 10, 41–53. [Google Scholar]
- Liu, W.; Zou, S.; Xu, X.; Gu, Q.; He, W.; Huang, J.; Huang, J.; Lyu, Z.; Lin, J.; Zhou, Z.; et al. Development of UAV-based shot seeding device for rice planting. Int. J. Agric. Biol. Eng. 2022, 15, 1–7. [Google Scholar] [CrossRef]
- Wang, X.Y.; Yang, G.D.; Pan, X.C.; Xiang, H.S.; Peng, S.B.; Xu, L. Feasibility of Improving Unmanned Aerial Vehicle-Based Seeding Efficiency by Using Rice Varieties with Low Seed Weight. Rice Sci. 2022, 29, 299–303. [Google Scholar] [CrossRef]
- Wei, X.; Zhang, Z.; Li, H.; Wu, H.; Lv, J.; Wu, L.; Zhou, M.; Li, J. Influences of wind vortex intensity of rotor UAV on rice morphology and yield. Precis. Agric. 2023, 24, 1766–1791. [Google Scholar] [CrossRef]
- Brinkman, J.L.; Davis, B.; Johnson, C.E. Post-movement stabilization time for the downwash region of a 6-rotor UAV for remote gas monitoring. Heliyon 2020, 6, E04994. [Google Scholar] [CrossRef] [PubMed]
- Fan, G.; Liu, Z.; Qin, Y.; Long, B.; Li, H.; Li, J. Airflow characteristics of rotorcraft plant protection UAV operating in rice fields. Biosyst. Eng. 2023, 226, 209–222. [Google Scholar] [CrossRef]
- Liu, Z.; Fan, G.; Ye, S.; Zhang, Z.; Wu, H.; Long, B.; Li, H.; Cheng, H.; Wu, L.; Li, J. Flight Parameter—Wind Vortex Characteristic Control Model of a Four-Multirotor Unmanned Aerial Vehicle Operating in Pesticide Spraying of Rice. Agriculture 2023, 13, 892. [Google Scholar] [CrossRef]
- Li, J.; Zhou, Z.; Hu, L.; Zang, Y.; Xu, S.; Liu, A.; Luo, X.; Zhang, T. Optimization of operation parameters for supplementary pollination in hybrid rice breeding using uniaxial single-rotor electric unmanned helicopter. Trans. Chin. Soc. Agric. Eng. 2014, 30, 1–9. [Google Scholar]
- Li, J.; Zhou, Z.; Lan, Y.; Hu, L.; Zang, Y.; Liu, A.; Luo, X.; Zhang, T. Distribution of canopy wind field produced by rotor unmanned aerial vehicle pollination operation. Trans. Chin. Soc. Agric. Eng. 2015, 31, 77–86. [Google Scholar]
- Lan, Y.; Qian, S.; Chen, S.; Zhao, Y.; Deng, X.; Wang, G.; Zang, Y.; Wang, J.; Qiu, X. Influence of the downwash wind field of plant protection UAV on droplet deposition distribution characteristics at different flight heights. Agronomy 2021, 11, 2399. [Google Scholar] [CrossRef]
- Zhan, Y.; Chen, P.; Xu, W.; Chen, S.; Han, Y.; Lan, Y.; Wang, G. Influence of the downwash airflow distribution characteristics of a plant protection UAV on spray deposit distribution. Biosyst. Eng. 2022, 216, 32–45. [Google Scholar] [CrossRef]
- Yang, S.; Xu, P.; Jiang, S.; Zheng, Y. Downwash characteristics and analysis from a six-rotor unmanned aerial vehicle conFigured for plant protection. Pest Manag. Sci. 2022, 78, 1707–1720. [Google Scholar] [CrossRef] [PubMed]
- Anderson, J.D.; Wendt, J. Computational Fluid Dynamics; McGraw-Hill: New York, NY, USA, 1995; Volume 206, p. 332. [Google Scholar]
- Roberts, T.; Murman, E. Solution method for a hovering helicopter rotor using the Euler equations. In Proceedings of the 23rd Aerospace Sciences Meeting, Reno, NV, USA, 14–17 January 1985; American Institute of Aeronautics and Astronautics: Reston, VA, USA, 1985; p. 436. [Google Scholar]
- Wen, S.; Han, J.; Ning, Z.; Lan, Y.; Yin, X.; Zhang, J.; Ge, Y. Numerical analysis and validation of spray distributions disturbed by quadrotor drone wake at different flight speeds. Comput. Electron. Agric. 2019, 166, 105036. [Google Scholar] [CrossRef]
- Hwang, J.Y.; Jung, M.K.; Kwon, O.J. Numerical study of aerodynamic performance of a multirotor unmanned-aerial-vehicle conFigureuration. J. Aircr. 2015, 52, 839–846. [Google Scholar] [CrossRef]
- Coombes, M.; Newton, S.; Knowles, J.; Garmory, A. The influence of rotor downwash on spray distribution under a quadrotor unmanned aerial system. Comput. Electron. Agric. 2022, 196, 106807. [Google Scholar] [CrossRef]
- Zheng, Y.; Yang, S.; Liu, X.; Wang, J.; Norton, T.; Chen, J.; Tan, Y. The computational fluid dynamic modeling of downwash flow field for a six-rotor UAV. Front. Agric. Sci. Eng. 2018, 5, 159–167. [Google Scholar] [CrossRef]
- Guo, Q.; Zhu, Y.; Tang, Y.; Hou, C.; He, Y.; Zhuang, J.; Zheng, Y.; Luo, S. CFD simulation and experimental verification of the spatial and temporal distributions of the downwash airflow of a quad-rotor agricultural UAV in hover. Comput. Electron. Agric. 2020, 172, 105343. [Google Scholar] [CrossRef]
- Hao, Z.; Wu, Q.; Liu, Y.; Wan, W.; Cheng, Z.; Zhen, M.E. Spatio-temporal Distribution of Down-wash Airflow for Multi-rotor Plant Protection UAV Based on Porous Model. Trans. Chin. Soc. Agric. Mach. 2019, 50, 112–122. [Google Scholar] [CrossRef]
- Zhang, H.; Qi, L.; Wan, J.; Musiu, E.M.; Zhou, J.; Lu, Z.; Wang, P. Numerical simulation of downwash airflow distribution inside tree canopies of an apple orchard from a multirotor unmanned aerial vehicle (UAV) sprayer. Comput. Electron. Agric. 2022, 195, 106817. [Google Scholar] [CrossRef]
- Yang, F.; Xue, X.; Chen, C.; Zhou, Q. Effect of downwash airflow in hover on droplet motion law for multi-rotor unmanned plant protection machine. Trans. Chin. Soc. Agric. Eng. 2018, 34, 64–73. [Google Scholar]
- Wang, L.; Hou, Q.; Wang, J.; Wang, Z.; Wang, S. Influence of the inner tilt angle on downwash wind field of multi-rotor UAV based on wireless wind speed acquisition system. Int. J. Agric. Biol. Eng. 2021, 14, 19–26. [Google Scholar] [CrossRef]
- Jiang, F.; Huang, P. Advanced Application and Case Analysis of Fluent; Publishing House of Tsinghua University: Beijing, China, 2008. [Google Scholar]
- Fan, J.; Wang, Z.; Feng, Y.; Li, Y. Effects of Rotor Wheelbase on Downwash Flow Aggregation and Wind-resistance. Mech. Sci. Technol. Aerosp. Eng. 2019, 38, 1966–1974. [Google Scholar] [CrossRef]
- Yang, F.; Zhou, H.; Ru, Y.; Chen, Q.; Zhou, L. A method to study the influence of the pesticide load on the detailed distribution law of downwash for multi-rotor UAVs. Agriculture 2022, 12, 2061. [Google Scholar] [CrossRef]
- Guo, S.; Li, J.; Yao, W.; Zhan, Y.; Li, Y.; Shi, Y. Distribution characteristics on droplet deposition of wind field vortex formed by multi-rotor UAV. PLoS ONE 2019, 14, e0220024. [Google Scholar] [CrossRef] [PubMed]
- Guo, S.; Li, J.; Yao, W.; Hu, X.; Wei, X.; Long, B.; Wu, H.; Li, H. Optimization of the factors affecting droplet deposition in rice fields by rotary unmanned aerial vehicles (UAVs). Precis. Agric. 2021, 22, 1918–1935. [Google Scholar] [CrossRef]
- Li, X. Application of UAV in agricultural plant protection. Mod. Agric. 2020, 12, 11–12. [Google Scholar]
- Wu, X. Research on the Application of Small UAV Aerial Survey in Farmland Information Monitoring. Autom. Appl. 2023, 64, 1–3. [Google Scholar]
- Zhang, J.; Zhang, C.; Chen, Q.; Zhou, H.; Yang, F.; Ru, Y. Effect of Ambient Wind Speed on Downwash Airflow and Droplet Deposition for Six-rotor UAV. Trans. Chin. Soc. Agric. Eng. 2022, 53, 74–81. [Google Scholar]
- Committee of the Great Dictionary of Environmental Sciences. Dictionary of Environmental Science; China Environmental Science Press: Beijing, China, 2008; ISBN 9787802097810. [Google Scholar]
- Martin, S. Model Aircraft Aerodynamics; Aviation Industry Press: Beijing, China, 2007; ISBN 1-85486-190-5. [Google Scholar]


| Other Research | This Paper | |
|---|---|---|
| Research object | Downwash airflow velocity ([1,10,11]) focused on the characteristics of downwash airflow velocity. Ref. [3] analyzed the wind distribution characteristics of the downwash field based on its velocity. Ref. [21] studied the distribution characteristics of the downwash field in the space-time dimension.) | Downwash airflow velocity and downwash range |
| Research method | Experimental measurement or simulation ([1,10,11,13], etc., used anemometers in the field to study the downwash of UAVs [20,21,22] etc., utilized simulation calculations to study the downwash of UAVs.) | Experimental measurement and simulation |
| Average Downwash Airflow Velocity within 10 s | Swing Period (Frame) | Average Downwash Airflow Velocity within 10 s | Swing Period (Frame) | Average Downwash Airflow Velocity within 10 s | Swing Period (Frame) | Average Downwash Airflow Velocity within 10 s | Swing Period (Frame) | Average Downwash Airflow Velocity within 10 s | Swing Period (Frame) | |
|---|---|---|---|---|---|---|---|---|---|---|
| 1 | 0.30 m/s | 23 | 0.67 m/s | 20 | 0.89 m/s | 12 | 1.77 m/s | 12 | 1.99 m/s | 7 |
| 2 | 22 | 20 | 11 | 20 | 7 | |||||
| 3 | 21 | 18 | 16 | 12 | 7 | |||||
| 4 | 22 | 16 | 17 | 6 | 7 | |||||
| 5 | 18 | 16 | 14 | 17 | 8 | |||||
| 6 | 21 | 15 | 17 | 18 | 12 | |||||
| 7 | 20 | 15 | 17 | 8 | 11 | |||||
| 8 | 17 | 21 | 16 | 14 | 10 | |||||
| 9 | 22 | 23 | 17 | 12 | 11 | |||||
| 10 | 16 | 20 | 18 | 14 | 8 | |||||
| 11 | 23 | 18 | 14 | 11 | 7 | |||||
| 12 | 20 | 21 | 20 | 10 | 7 | |||||
| 13 | 21 | 21 | 17 | 12 | 9 | |||||
| 14 | 20 | 15 | 15 | 10 | 9 | |||||
| 15 | 18 | 16 | 17 | 14 | 9 | |||||
| 16 | 22 | 20 | 17 | 12 | 9 | |||||
| Average swing period | 20.375 | 18.4375 | 15.9375 | 12.625 | 8.625 | |||||
| Model | JP60300D |
|---|---|
| Working mode | Work continuously for long hours |
| Accuracy of the voltage regulation | Source effect ≤ 0.5% rating; load effect 0.5% |
| Accuracy of steady flow | Source effect ≤ 0.5% rating; load effect 0.5% |
| Time drift | Continuous work for more than 8 h ≤ 0.5% rating |
| Temperature drift | ≤0.05% rating/°C |
| Name | Parameter Values |
|---|---|
| Spray angle | 80° |
| Spray angle | 0.5 Mpa (5 bar) |
| Flow rate | 0.52 L/min |
| Atmospheric temperatures | 22 °C |
| Atmospheric pressure | 1001 hpa |
| Distance(m) | Test Plane | (cm) | (cm) | Test Plane | (cm) | (cm) | Test Plane | (cm) | (cm) | |||
|---|---|---|---|---|---|---|---|---|---|---|---|---|
| 0.2 | α | 70 | 74.31 | 6.16% | β | 72 | 74.63 | 3.65% | γ | 70 | 67.12 | 4.11% |
| 0.4 | α | 74 | 76.24 | 3.03% | β | 72 | 76.25 | 5.90% | γ | 70 | 71.63 | 2.33% |
| 0.6 | α | 72 | 74.96 | 4.11% | β | 80 | 75.6 | 5.50% | γ | 76 | 77.05 | 1.38% |
| 0.8 | α | 80 | 77.22 | 3.48% | β | 82 | 77.54 | 5.44% | γ | 82 | 81.26 | 0.90% |
| 1 | α | 90 | 84.32 | 6.31% | β | 86 | 82.39 | 4.20% | γ | 92 | 89.69 | 2.51% |
| 1.2 | α | 92 | 93.7 | 1.85% | β | 98 | 93.05 | 5.05% | γ | 98 | 101.42 | 3.49% |
| 1.4 | α | 102 | 101.45 | 0.54% | β | 102 | 101.12 | 0.86% | γ | 102 | 104.74 | 2.69% |
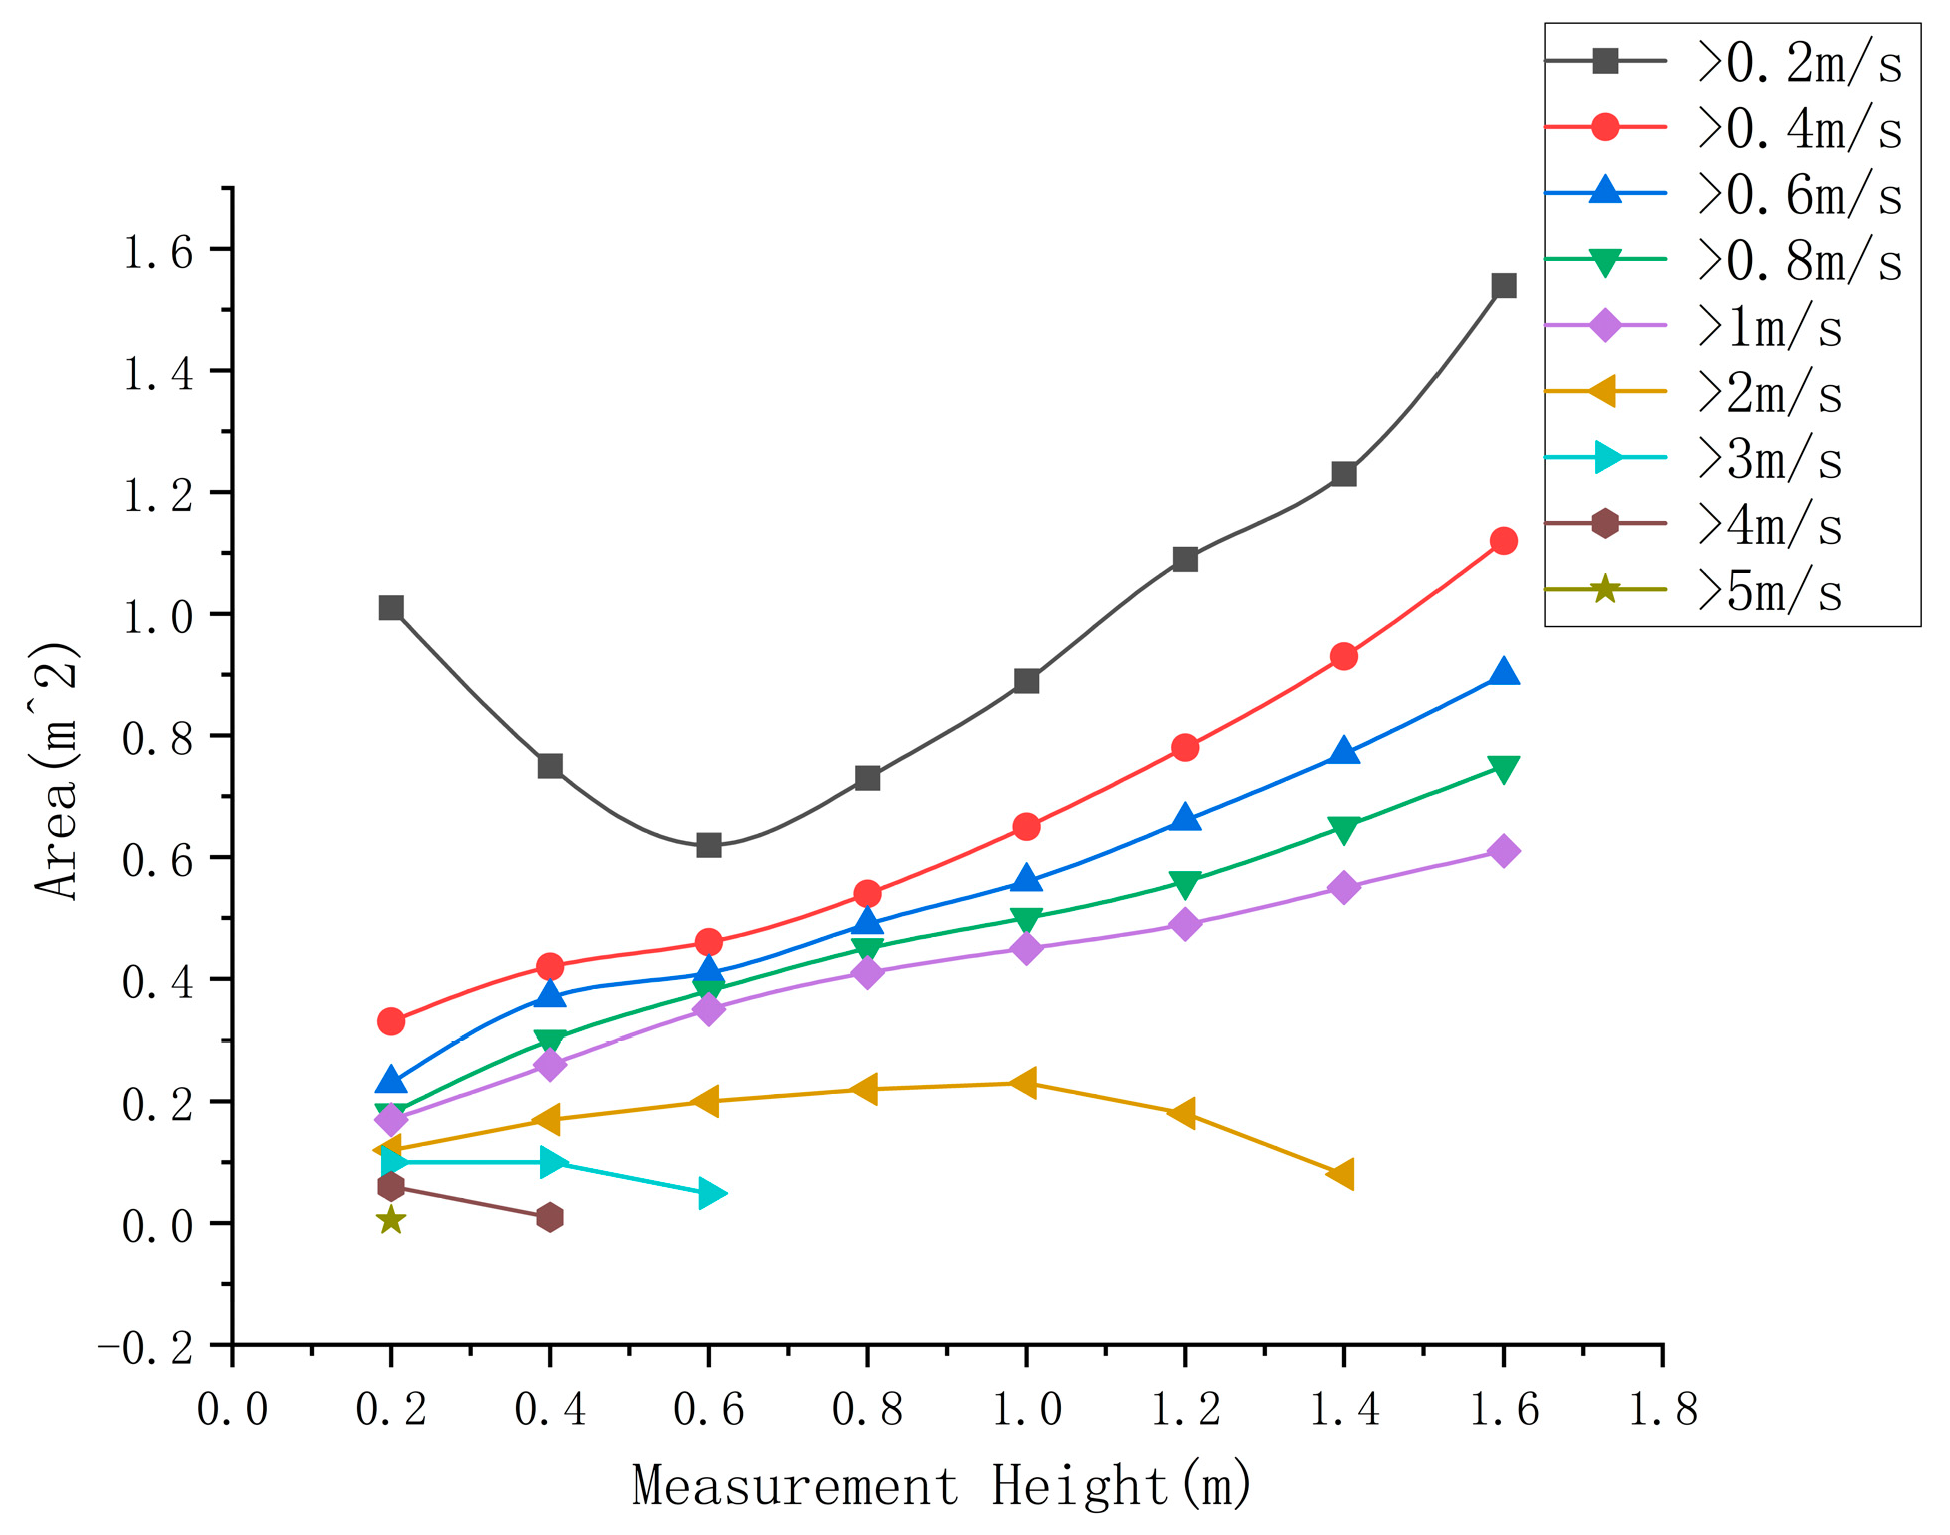
| >0.2 m/s | >0.4 m/s | >0.6 m/s | >0.8 m/s | >1 m/s | >2 m/s | >3 m/s | >4 m/s | >5 m/s | |
|---|---|---|---|---|---|---|---|---|---|
| 0.2 m | 1.01 | 0.33 | 0.23 | 0.18 | 0.17 | 0.12 | 0.10 | 0.06 | 0.0046 |
| 0.4 m | 0.75 | 0.42 | 0.37 | 0.30 | 0.26 | 0.17 | 0.10 | 0.0095 | |
| 0.6 m | 0.62 | 0.46 | 0.41 | 0.38 | 0.35 | 0.2 | 0.049 | ||
| 0.8 m | 0.73 | 0.54 | 0.49 | 0.45 | 0.41 | 0.22 | |||
| 1 m | 0.89 | 0.65 | 0.56 | 0.50 | 0.45 | 0.23 | |||
| 1.2 m | 1.09 | 0.78 | 0.66 | 0.56 | 0.49 | 0.18 | |||
| 1.4 m | 1.23 | 0.93 | 0.77 | 0.65 | 0.55 | 0.08 | |||
| 1.6 m | 1.54 | 1.12 | 0.90 | 0.75 | 0.61 | ||||
| 1.8 m | 174.84 | 36.87 | 5.81 | 1.72 | 0.72 |
Disclaimer/Publisher’s Note: The statements, opinions and data contained in all publications are solely those of the individual author(s) and contributor(s) and not of MDPI and/or the editor(s). MDPI and/or the editor(s) disclaim responsibility for any injury to people or property resulting from any ideas, methods, instructions or products referred to in the content. |
© 2024 by the authors. Licensee MDPI, Basel, Switzerland. This article is an open access article distributed under the terms and conditions of the Creative Commons Attribution (CC BY) license (https://creativecommons.org/licenses/by/4.0/).
Share and Cite
Liu, Z.; Gao, R.; Zhao, Y.; Wu, H.; Liang, Y.; Liang, K.; Liu, D.; Huang, T.; Xie, S.; Lv, J.; et al. Study on the Characteristics of Downwash Field Range and Consistency of Spray Deposition of Agricultural UAVs. Agriculture 2024, 14, 931. https://doi.org/10.3390/agriculture14060931
Liu Z, Gao R, Zhao Y, Wu H, Liang Y, Liang K, Liu D, Huang T, Xie S, Lv J, et al. Study on the Characteristics of Downwash Field Range and Consistency of Spray Deposition of Agricultural UAVs. Agriculture. 2024; 14(6):931. https://doi.org/10.3390/agriculture14060931
Chicago/Turabian StyleLiu, Zongru, Rong Gao, Yinwei Zhao, Han Wu, Yunting Liang, Ke Liang, Dong Liu, Taoran Huang, Shaoqiang Xie, Jia Lv, and et al. 2024. "Study on the Characteristics of Downwash Field Range and Consistency of Spray Deposition of Agricultural UAVs" Agriculture 14, no. 6: 931. https://doi.org/10.3390/agriculture14060931
APA StyleLiu, Z., Gao, R., Zhao, Y., Wu, H., Liang, Y., Liang, K., Liu, D., Huang, T., Xie, S., Lv, J., & Li, J. (2024). Study on the Characteristics of Downwash Field Range and Consistency of Spray Deposition of Agricultural UAVs. Agriculture, 14(6), 931. https://doi.org/10.3390/agriculture14060931