Article

Analysis and Testing of Pre-Cut Sugarcane Seed Stalk Sawing Performance Parameters

1
Agricultural Machinery Research Institute, Chinese Academy of Tropical Agricultural Sciences, Zhanjiang 524013, China
2
Key Laboratory of Tropical Agricultural Machinery, Ministry of Agriculture and Rural Affairs, Zhanjiang 524013, China
3
College of Engineering, Huazhong Agricultural University, Wuhan 430070, China
4
Institute of Facility Agriculture, Guangdong Academy of Agricultural Sciences, Guangzhou 510640, China
*
Author to whom correspondence should be addressed.
Agriculture 2024, 14(6), 953; https://doi.org/10.3390/agriculture14060953
Submission received: 14 April 2024 / Revised: 7 June 2024 / Accepted: 13 June 2024 / Published: 18 June 2024

Abstract

:
Sugarcane is an important economic crop in tropical and subtropical regions. Presawing planting is an important method for achieving automated and precise planting with sugarcane planting machines. The sawing process is a key stage in planting management, affecting not only the germination and survival rates of sugarcane, but also reflecting the mechanical performance of sawing. To reduce the peak sawing force and enhance the sawing surface quality of sugarcane seedlings, this study utilized a central composite experimental design method. Single-factor and multi-factor experiments were conducted with a specially designed sugarcane stalk sawing experimental rig to investigate the impact of factors such as the stalk diameter feeding speed, and sawing speed on the peak sawing force and sawing surface quality. Upon being developed and validated, multivariate mathematical regression models elucidated the relationships among these factors. The experimental results showed that the order of influence of each factor on the peak sawing force was the stalk diameter, feed speed, and sawing speed, while for the sawing surface quality, the sequence was the sawing speed, stalk diameter, and feed speed. Correspondingly, the determination coefficients for the peak sawing force and sawing surface quality prediction models were 0.9708 and 0.9675. With a maximum error of 7.6% for the peak sawing force and an average relative error of 7.1%, and a maximum error of 3.5% for the sawing surface quality and an average relative error of 2.83%, the calculated results from the regression models were in good agreement with the experimental findings. This indicates that the models are capable of quickly and accurately predicting the peak sawing force and sawing surface quality of sugarcane stalks under different conditions. The research findings provide valuable insights for the development and optimization of sugarcane stalk presawing equipment and related experimental studies.

1. Introduction

Sugarcane serves as a major raw material for sugar production, with approximately 80% of global sugar being derived from sugarcane [1]. It is also a significant source of biofuels and contributes significantly to the food industry, aiding in the reduction in greenhouse gas emissions [2]. Currently, sugarcane is cultivated in 130 countries, spanning an area of approximately 26 million hectares [3]. However, sugarcane production represents a labor-intensive industry characterized by low mechanization [4], high labor costs, and labor shortages, factors that limit its sustainable development [5].
Enhancing the level of mechanization in sugarcane production significantly impacts the scale of sugarcane production and related industries globally [6,7]. Presawing planting of sugarcane, a modern agricultural technique [8], facilitates automated and precision planting, in contrast to traditional whole-stalk or manual planting, thereby resulting in higher germination and survival rates [9]. Presawing planting of sugarcane is an effective strategy to enhance planting efficiency and yield, contributing significantly to the advancement and sustainability of the sugarcane industry [10,11].
The sawing operation is a pivotal phase in the presawing planting mode of sugarcane, significantly influencing the germination rate, planting density, yield, and sugar content [12,13]. Therefore, investigating the mechanics of sugarcane sawing and refining the operational parameters of circular saws are of paramount importance for enhancing sugarcane sawing equipment.
To date, many scholars have conducted extensive research on the sawing mechanism of agricultural and forestry crop stalks and improving the quality of sawing surfaces [14,15]. Zhao et al. designed a poplar branch stalk sawing test bench and used the response surface method (RSM) to study the effects of cutting speed, tool edge angle, and tool back angle on the ultimate shear stress, cutting power consumption per unit area, and branch damage rate [16]. Gao et al. undertook a study using the response surface method on the effects of sawing speed, feed speed, and circular saw blade tilt angle on the sawing power consumption and cross-sectional integrity rate of Caragana korshinskii Kom [17]. Based on the characteristics of jute, Song et al. devised a jute leaf rotating sawing device and employed a multi-factor variance analysis method to examine the effects of leaf angle, leaf tilt angle, sawing speed, and their interactions on the ultimate shear stress and specific sawing energy [18]. Brajesh et al. incorporated machine vision algorithms and electromechanical integration control technology in the design of a sugarcane stalk sawing device and investigated the effects of feed speed, sawing arm translation speed, stalk diameter, and sawing blade rotation speed on sawing efficiency [19]. In summary, research on the sawing theory of agricultural and forestry crops has predominantly focused on poplar [16], Caragana korshinskii Kom [20], and fruit trees such as apple [21], pear [22], and longan [23], whereas research on the sawing quality of sugarcane stalks remains scarce.
However, for sugarcane stalk sawing, ensuring cross-sectional integrity is an important indicator that directly affects germination and survival rates. Based on the above research, in order to address the issues of high peak sawing force and poor sawing surface quality caused by unreasonable working parameters during sugarcane stalk sawing, a sugarcane stalk sawing experiment rig was designed based on the biological characteristics and physical structure of the sugarcane segments. The feed speed, sawing speed, and stalk diameter were selected as the experimental factors, and the peak sawing force and sawing surface quality were set as the target values in the sawing experiments on the sugarcane stalks. The influence of each experimental factor on the target values was investigated through single-factor and multi-factor experiments. Prediction models for the target values under different parameters were established, and combinations of factors with significant effects on the target values were identified. This study serves as a reference for the development and optimization of sugarcane stalk presawing equipment and related experimental research.

2. Materials and Methods

2.1. Test Materials

In December 2023, samples were collected from the demonstration base of mechanized sugarcane production at the South Asian Tropical Crops Research Institute of the Chinese Academy of Tropical Agricultural Sciences (SACATRI). The sugarcane varieties selected were Gui Sugar 49, known for its suitability for mechanization and widespread cultivation. These samples had been growing for approximately 9 months since sowing in March 2023. During sample collection, sugarcane specimens exhibiting favorable growth conditions, uniform diameter, minimal curvature, absence of pests and diseases, and no evident bending or breakage were chosen. A total of 60 sugarcane samples were collected, as depicted in Figure 1. Following measurement, the average diameter of the sugarcane ranged from 25 to 35 mm, with an average length of 1.5 m.

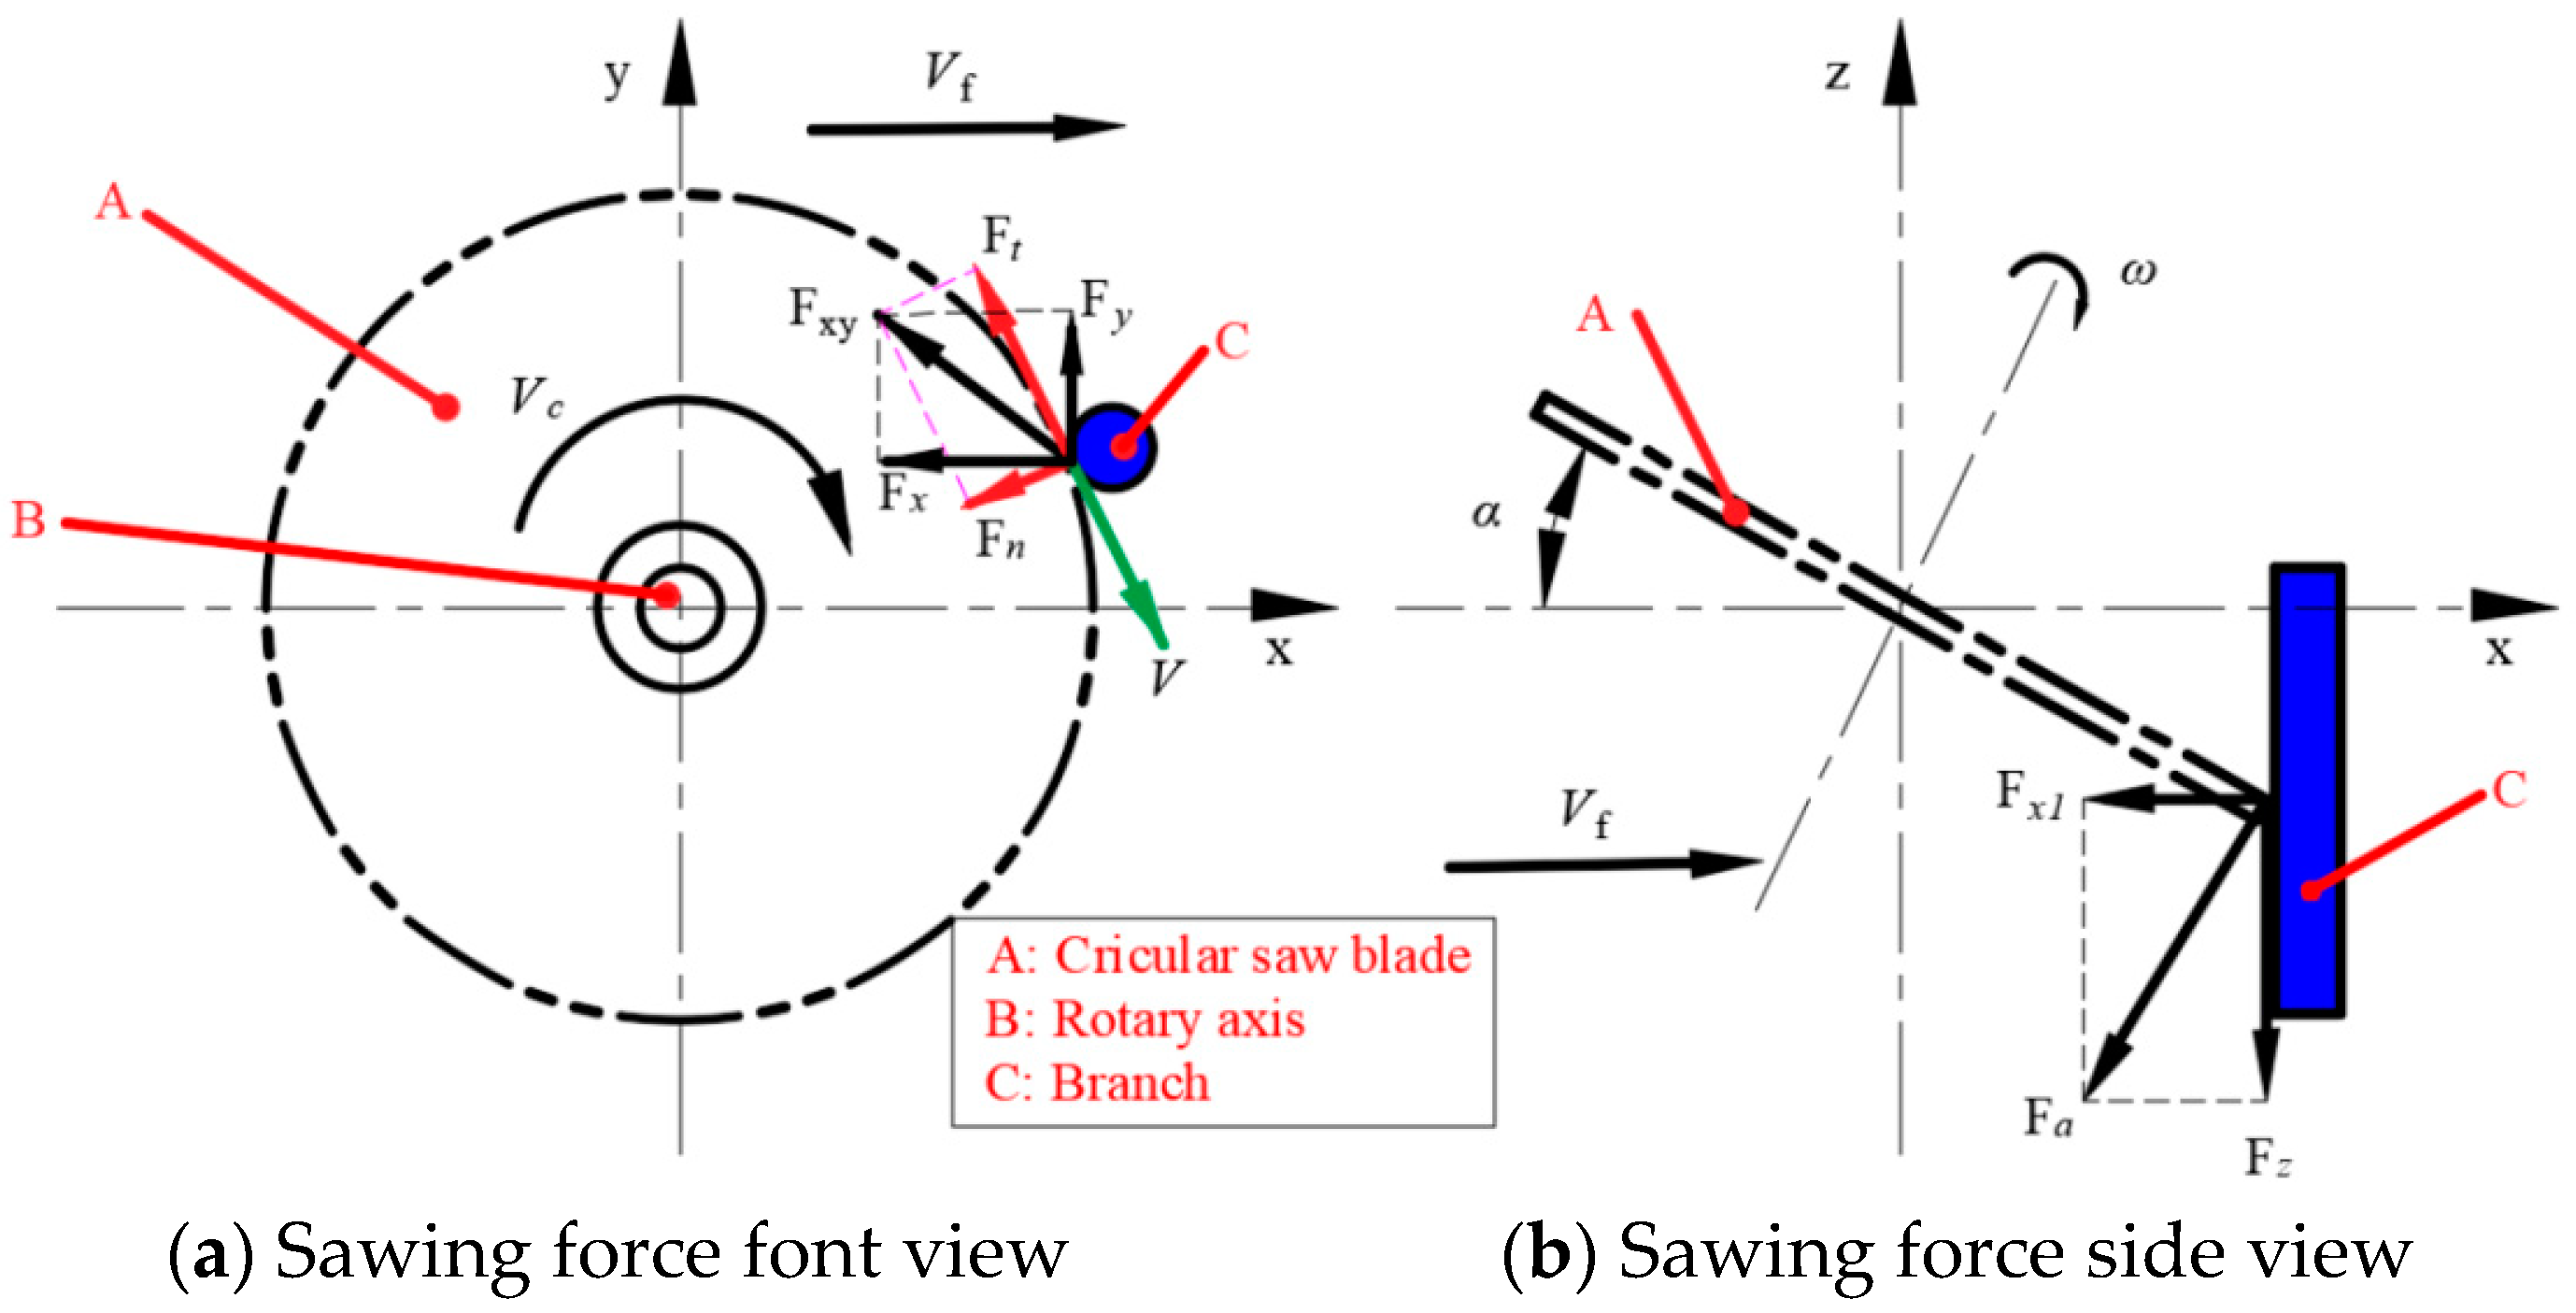
2.2. Definition of Test Parameters

The sawing process is highly intricate, and the physical properties of the material, sawing conditions, and working parameters each have an impact on the sawing force [24]. As shown in Figure 2 [25], the operation of the circular saw blade during sawing is simplified for the purpose of this study. The sawing force F can be equivalently represented as the result of the radial force Fn, tangential force Ft, and axial force Fa, with α being the inclination angle of the circular blade during sawing [26,27]. Different partial forces arise from varying origins and exert distinct impacts on the sawing process. The radial force Fn is mainly generated by the impact of the sugarcane stalk on the circular saw blade during the sawing process, and its direction points to the center of rotation of the disc saw from the tooth sawing location. The tangential force Ft is primarily generated by the frictional interaction between the surface of the circular saw and the surface being sawn of the sugarcane, and its direction is opposite to the instantaneous linear velocity direction of the tooth tip at the sawing location. The axial force Fa is mainly caused by machining errors of the circular saw blade and the compression of the sugarcane against the circular saw blade, and its direction is parallel to the power axis and perpendicular to the circular saw’s side. The axial force Fa of the circular saw is decomposed into a vertical downward force Fz and a horizontal force Fx1.
In the diagram, Fz and Fx1 respectively are:
F z = F a cos α
F x 1 = F a sin α
When sawing the sugarcane stalk, due to the origin of the partial forces, the tangential force Ft and radial force Fn are perpendicular to each other in a plane, while the axial force Fa is perpendicular to this plane, and the aforementioned three forces are perpendicular to each other pairwise. Therefore, the combined force F on the circular saw blade is as follows [17,25]:
F = F a 2 + F n 2 + F t 2
The feed rate is proportional to the feed speed and inversely proportional to the sawing speed and number of serrations. The feed per tooth is written as follows:
S v = S n Z = V f Z · 2 π · R V c = 2 π · V f · R Z · V c
where Sv is the feed per tooth of the circular saw, m; Sn is the feed per revolution of the circular saw, m; Z is the number of teeth; R is the radius of the circular saw blade, m; Vf is the feeding speed, m/s; Vc is the sawing speed, m/s.
According to Equations (1)–(4), under specific geometric parameters of the circular saw blade, the feed rate, sawing speed, and cutting inclination significantly influence the peak cutting force. During the process of sawing sugarcane stalks, improper working parameters often result in tearing, bulging, or burring when the sawing area between two adjacent teeth of the circular saw blade is inadequately covered. This significantly diminishes the germination rate of sugarcane seeds. Oblique cutting poses challenges to the germination and survival rates of sugarcane stalks, thereby increasing planting difficulty. Hence, a transverse cutting method with a cutting inclination of 0° is adopted. To this end, the diameter of the sugarcane stalk, feed rate, and sawing speed were chosen as test factors, with peak cutting force and saw cut surface quality serving as the target values. Subsequently, utilizing the designed sugarcane stalk sawing test bench, sawing tests were conducted. The YG6 material carbide disc saw boasts high hardness, excellent abrasion resistance, robust resistance to acid and alkali corrosion, and cost-effectiveness. Consequently, a 150 mm × 20 mm × 2 mm × 60 T YG6 material alternating-teeth disc saw was chosen as the cutting tool, taking into account both durability and economy.

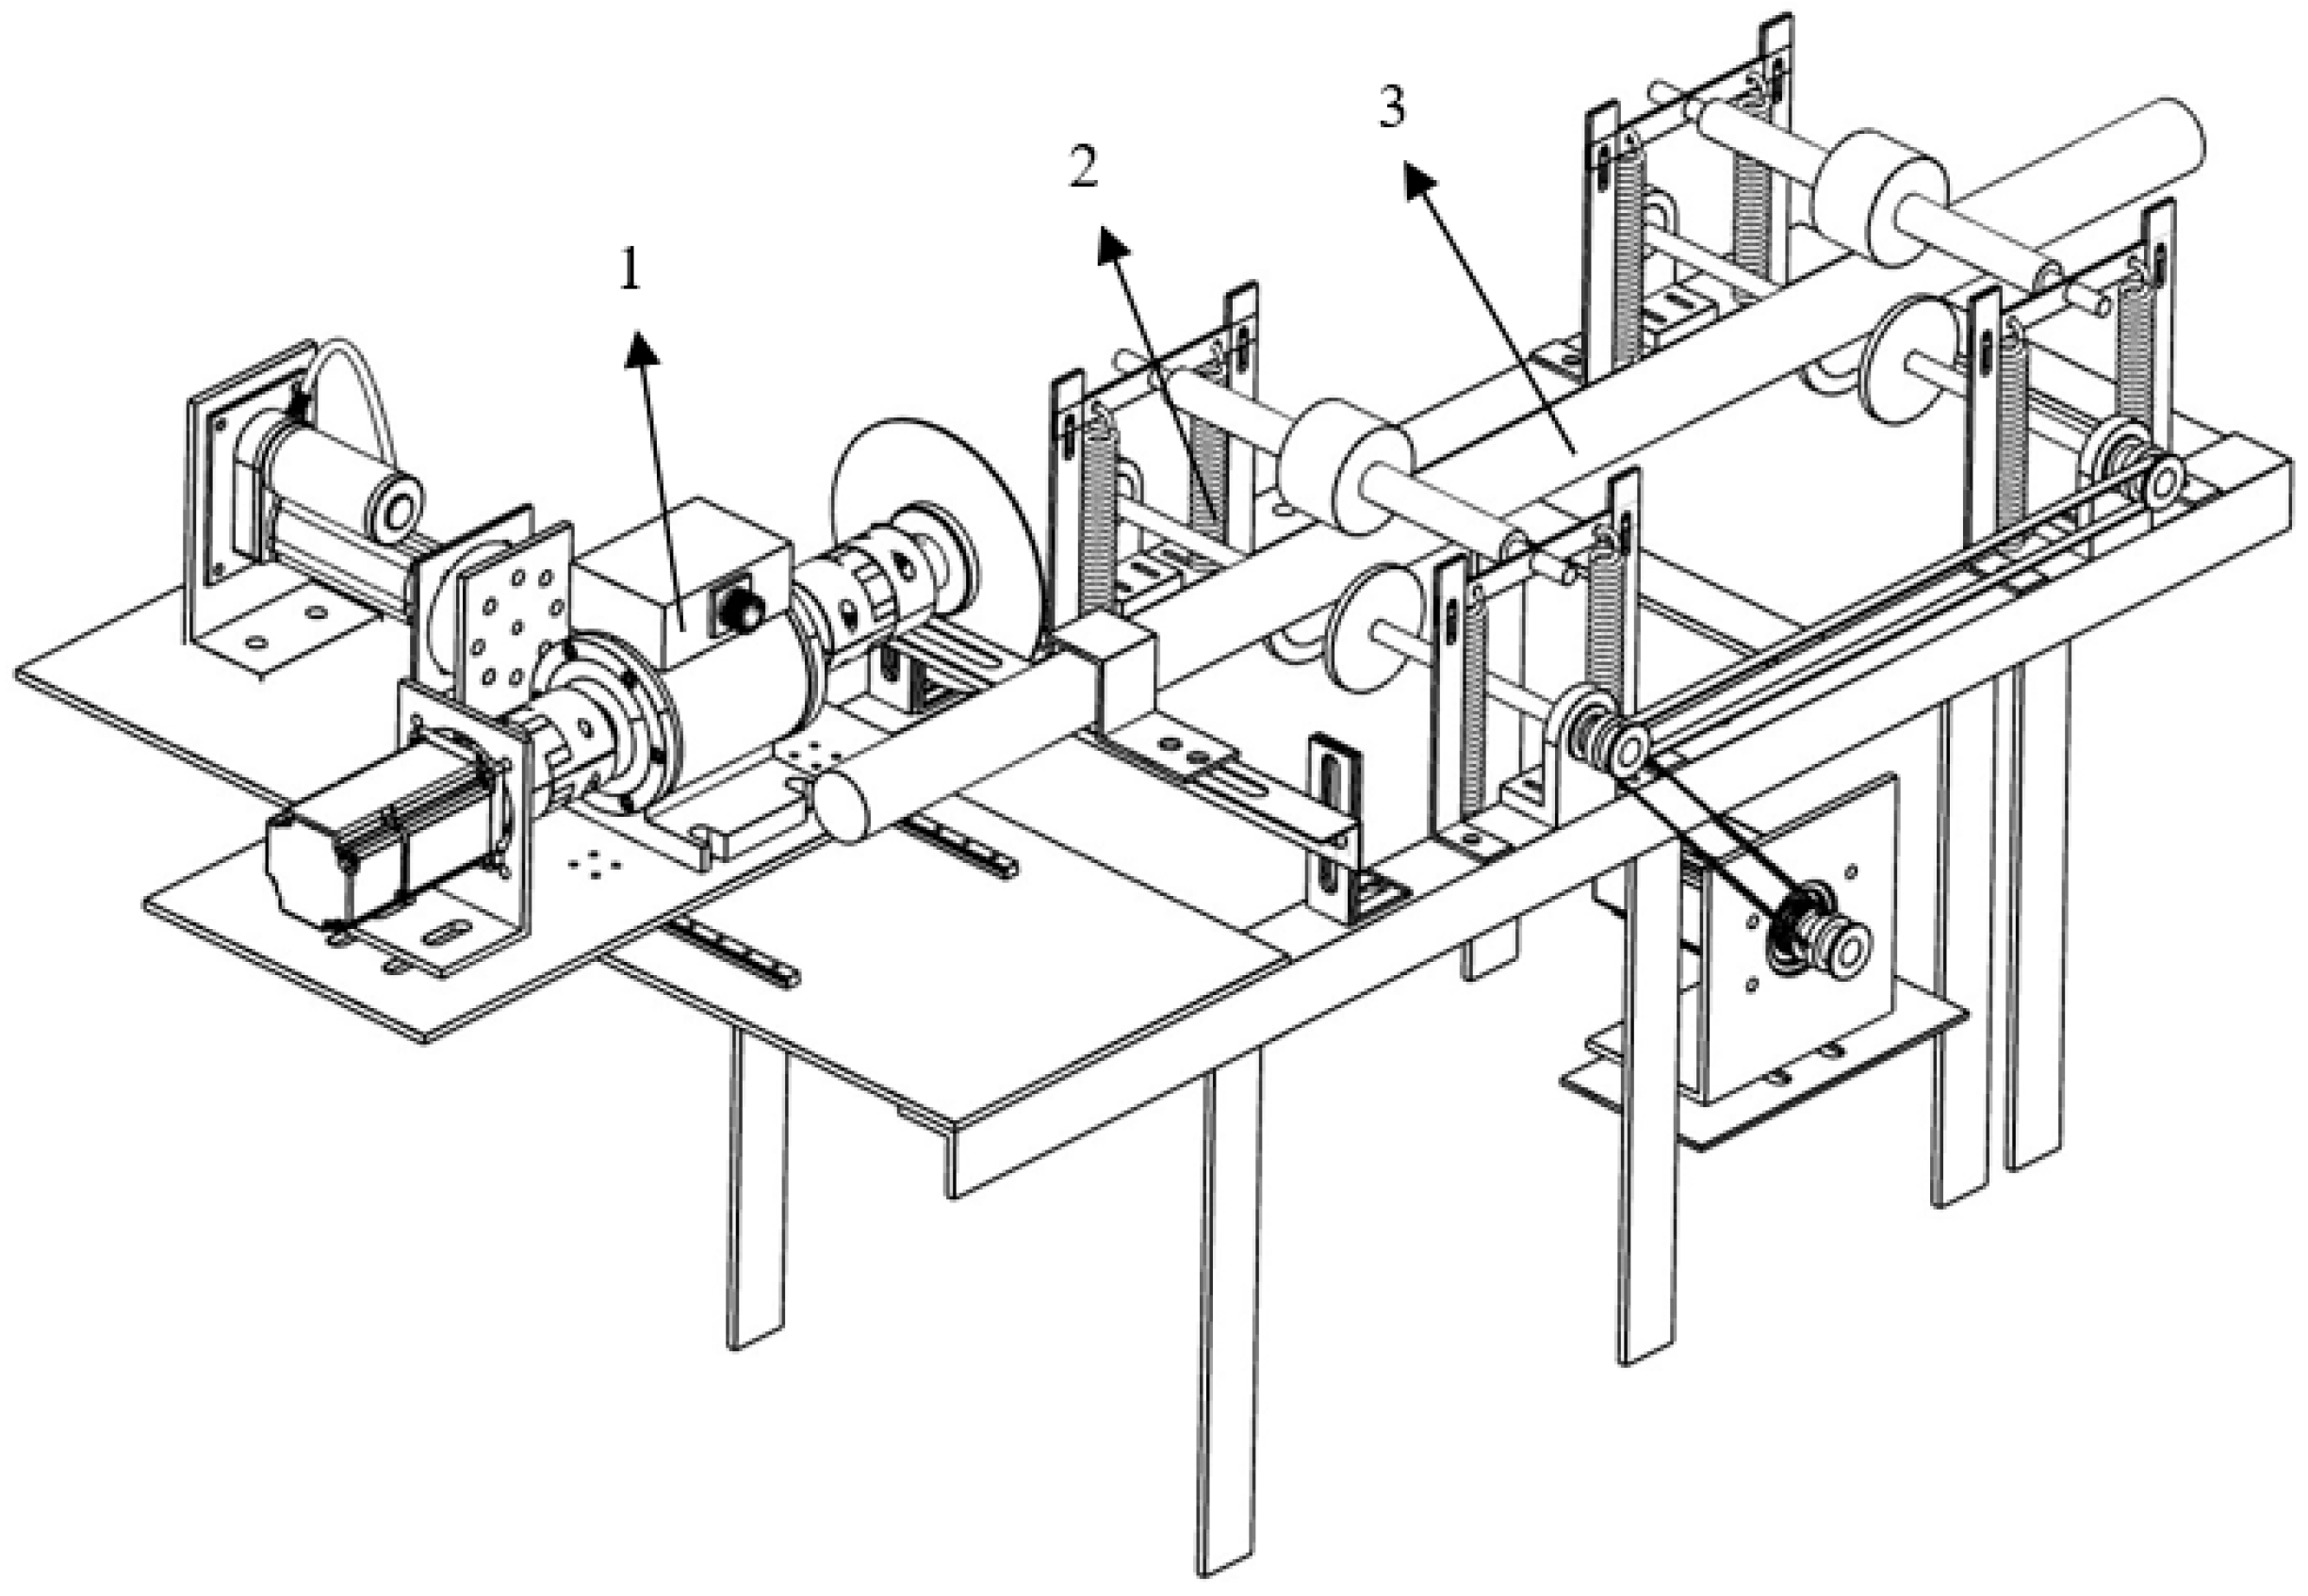
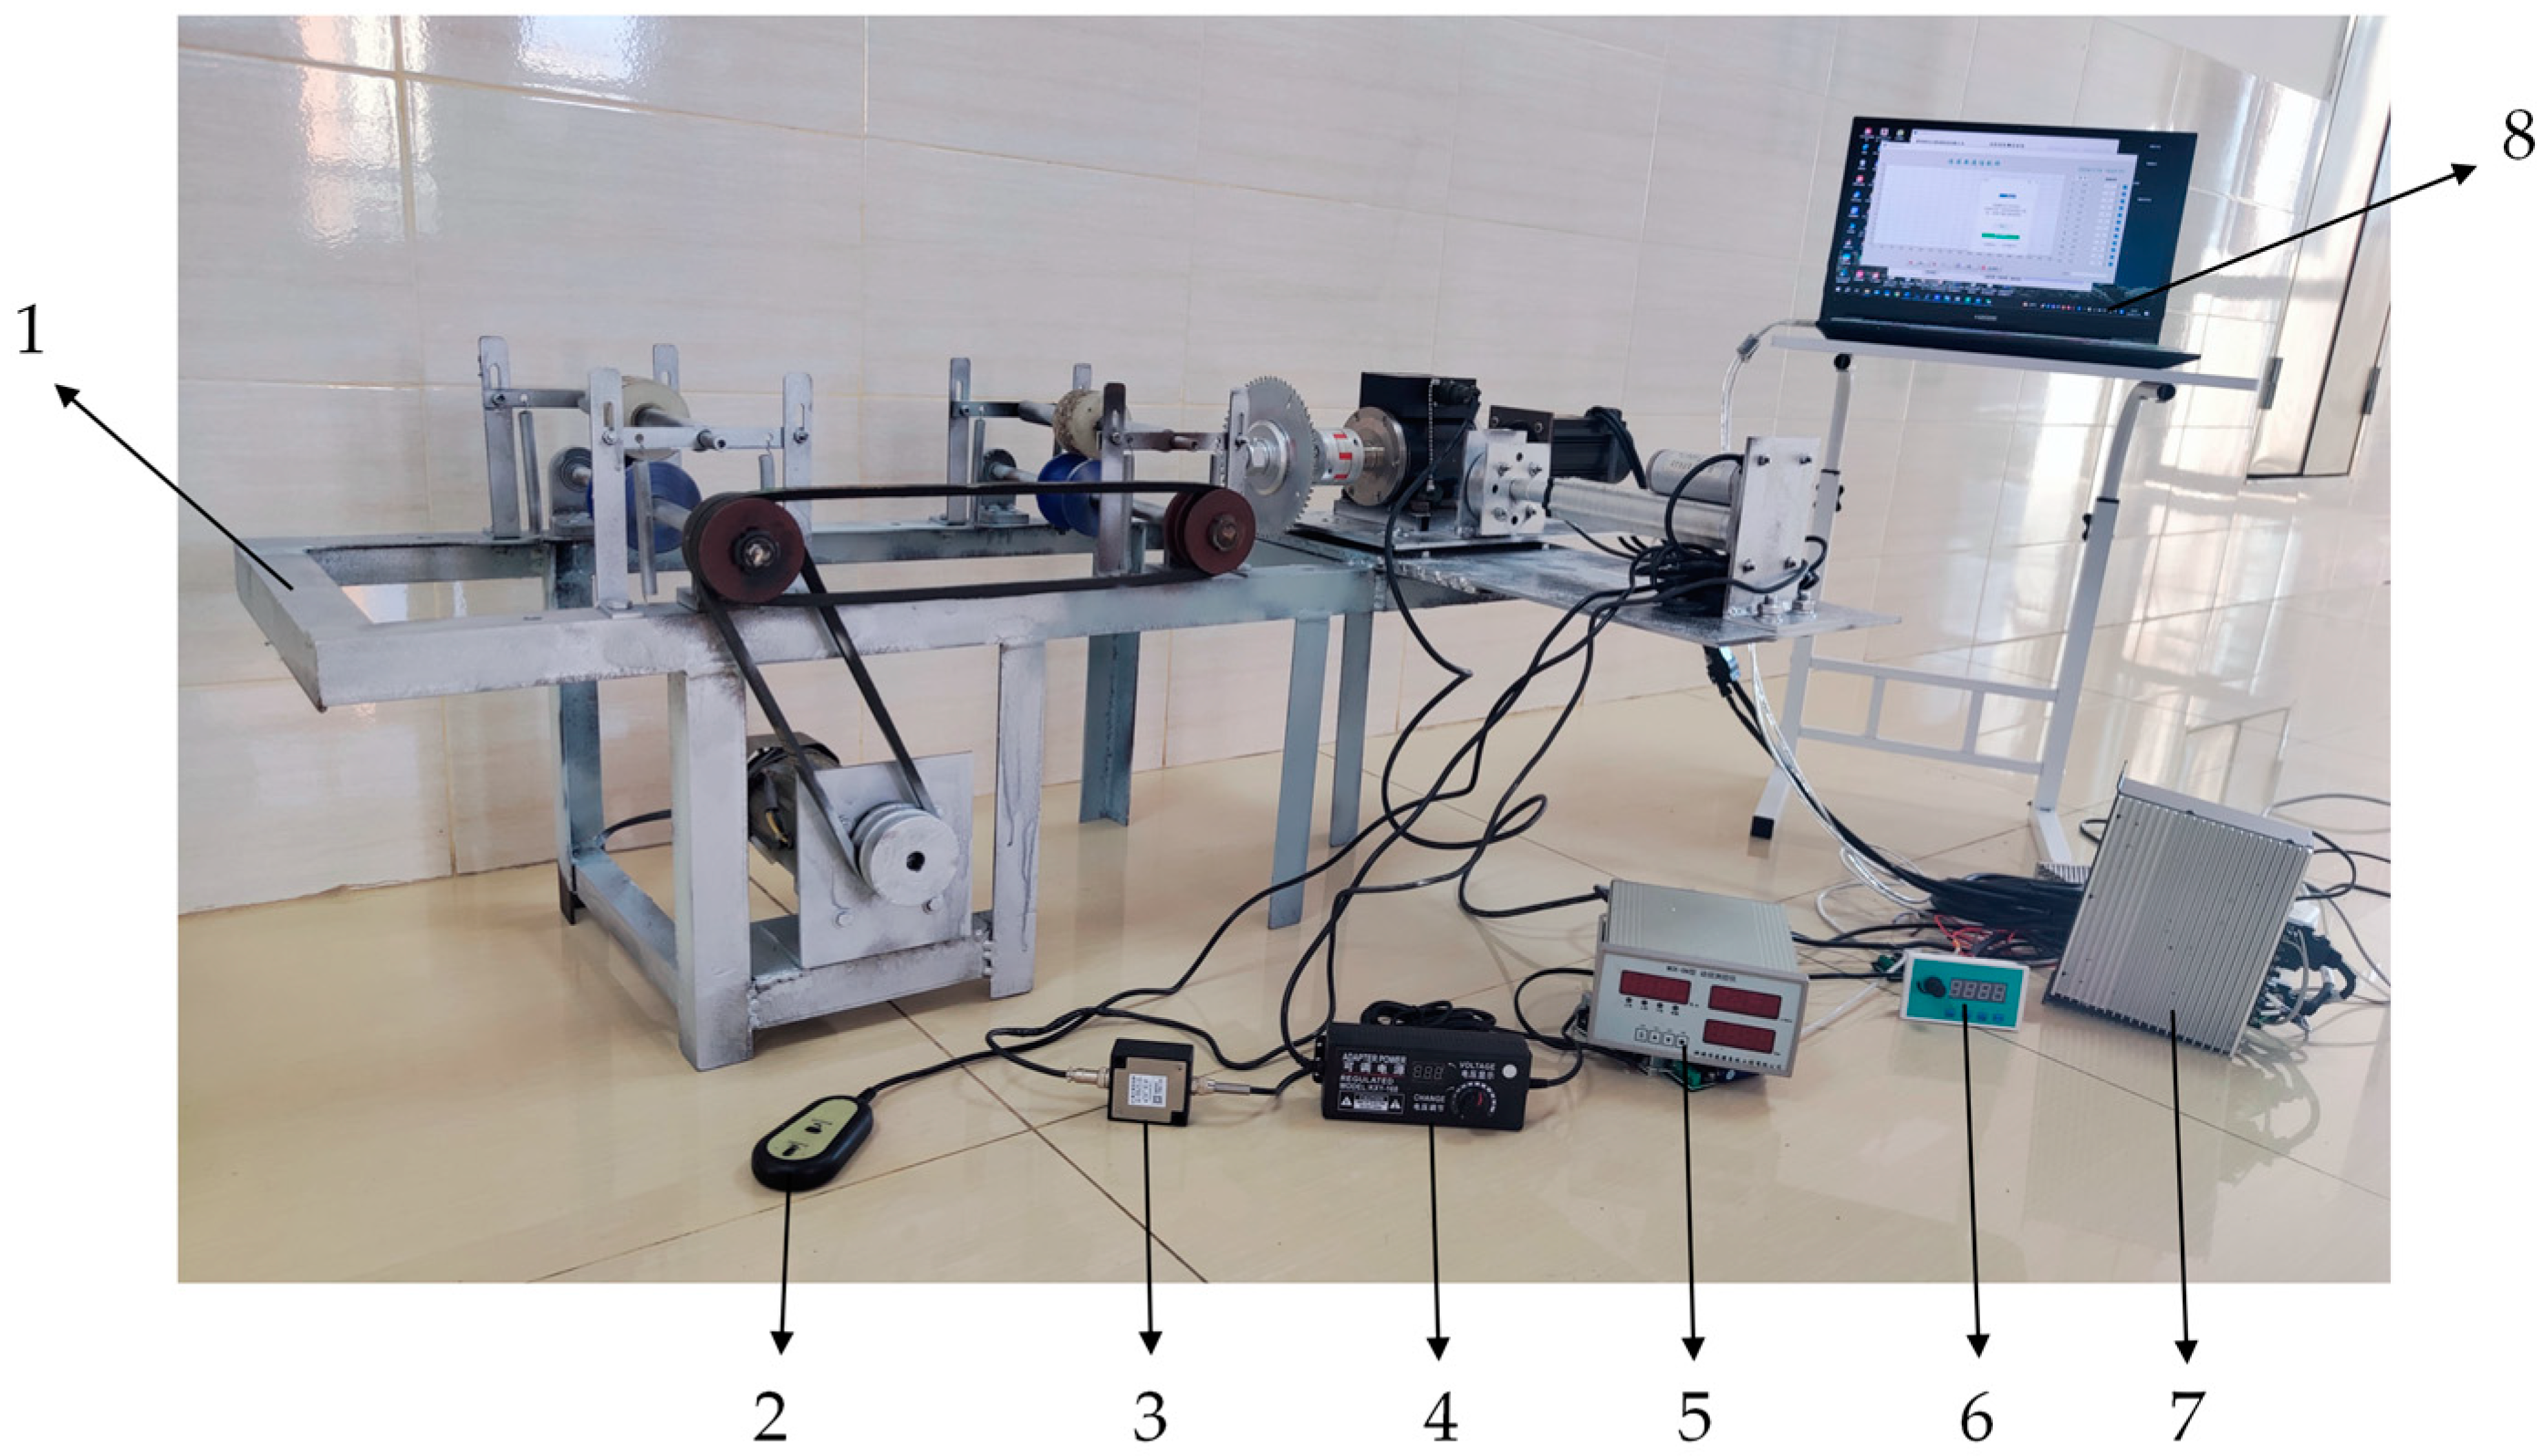
2.3. Sugarcane Stalk Sawing Experiment Rig

In this study, a linear cutting test rig for sugarcane stalks was developed based on the growth characteristics of sugarcane stalks and the requirements for seed-break sawing, as depicted in Figure 3. The test rig primarily comprises the sawing system and the transmission system. A schematic representation of the device is depicted in Figure 4. The entire test device features a simple structure and facilitates parameter adjustments, enabling testing under various conditions such as different feeding speeds, sawing speeds, stalk diameters, and other factors. During seed cutting operations, the transportation clamping device conveys sugarcane seed stems to the cutting position, following which the cutting feed device slices the seed stems into standard cane seeds that meet the seed cutting specifications. Throughout the seed cutting process, a tensile pressure sensor and a dynamic torque sensor are employed to precisely detect and record the peak cutting force of seed cutting in real time.

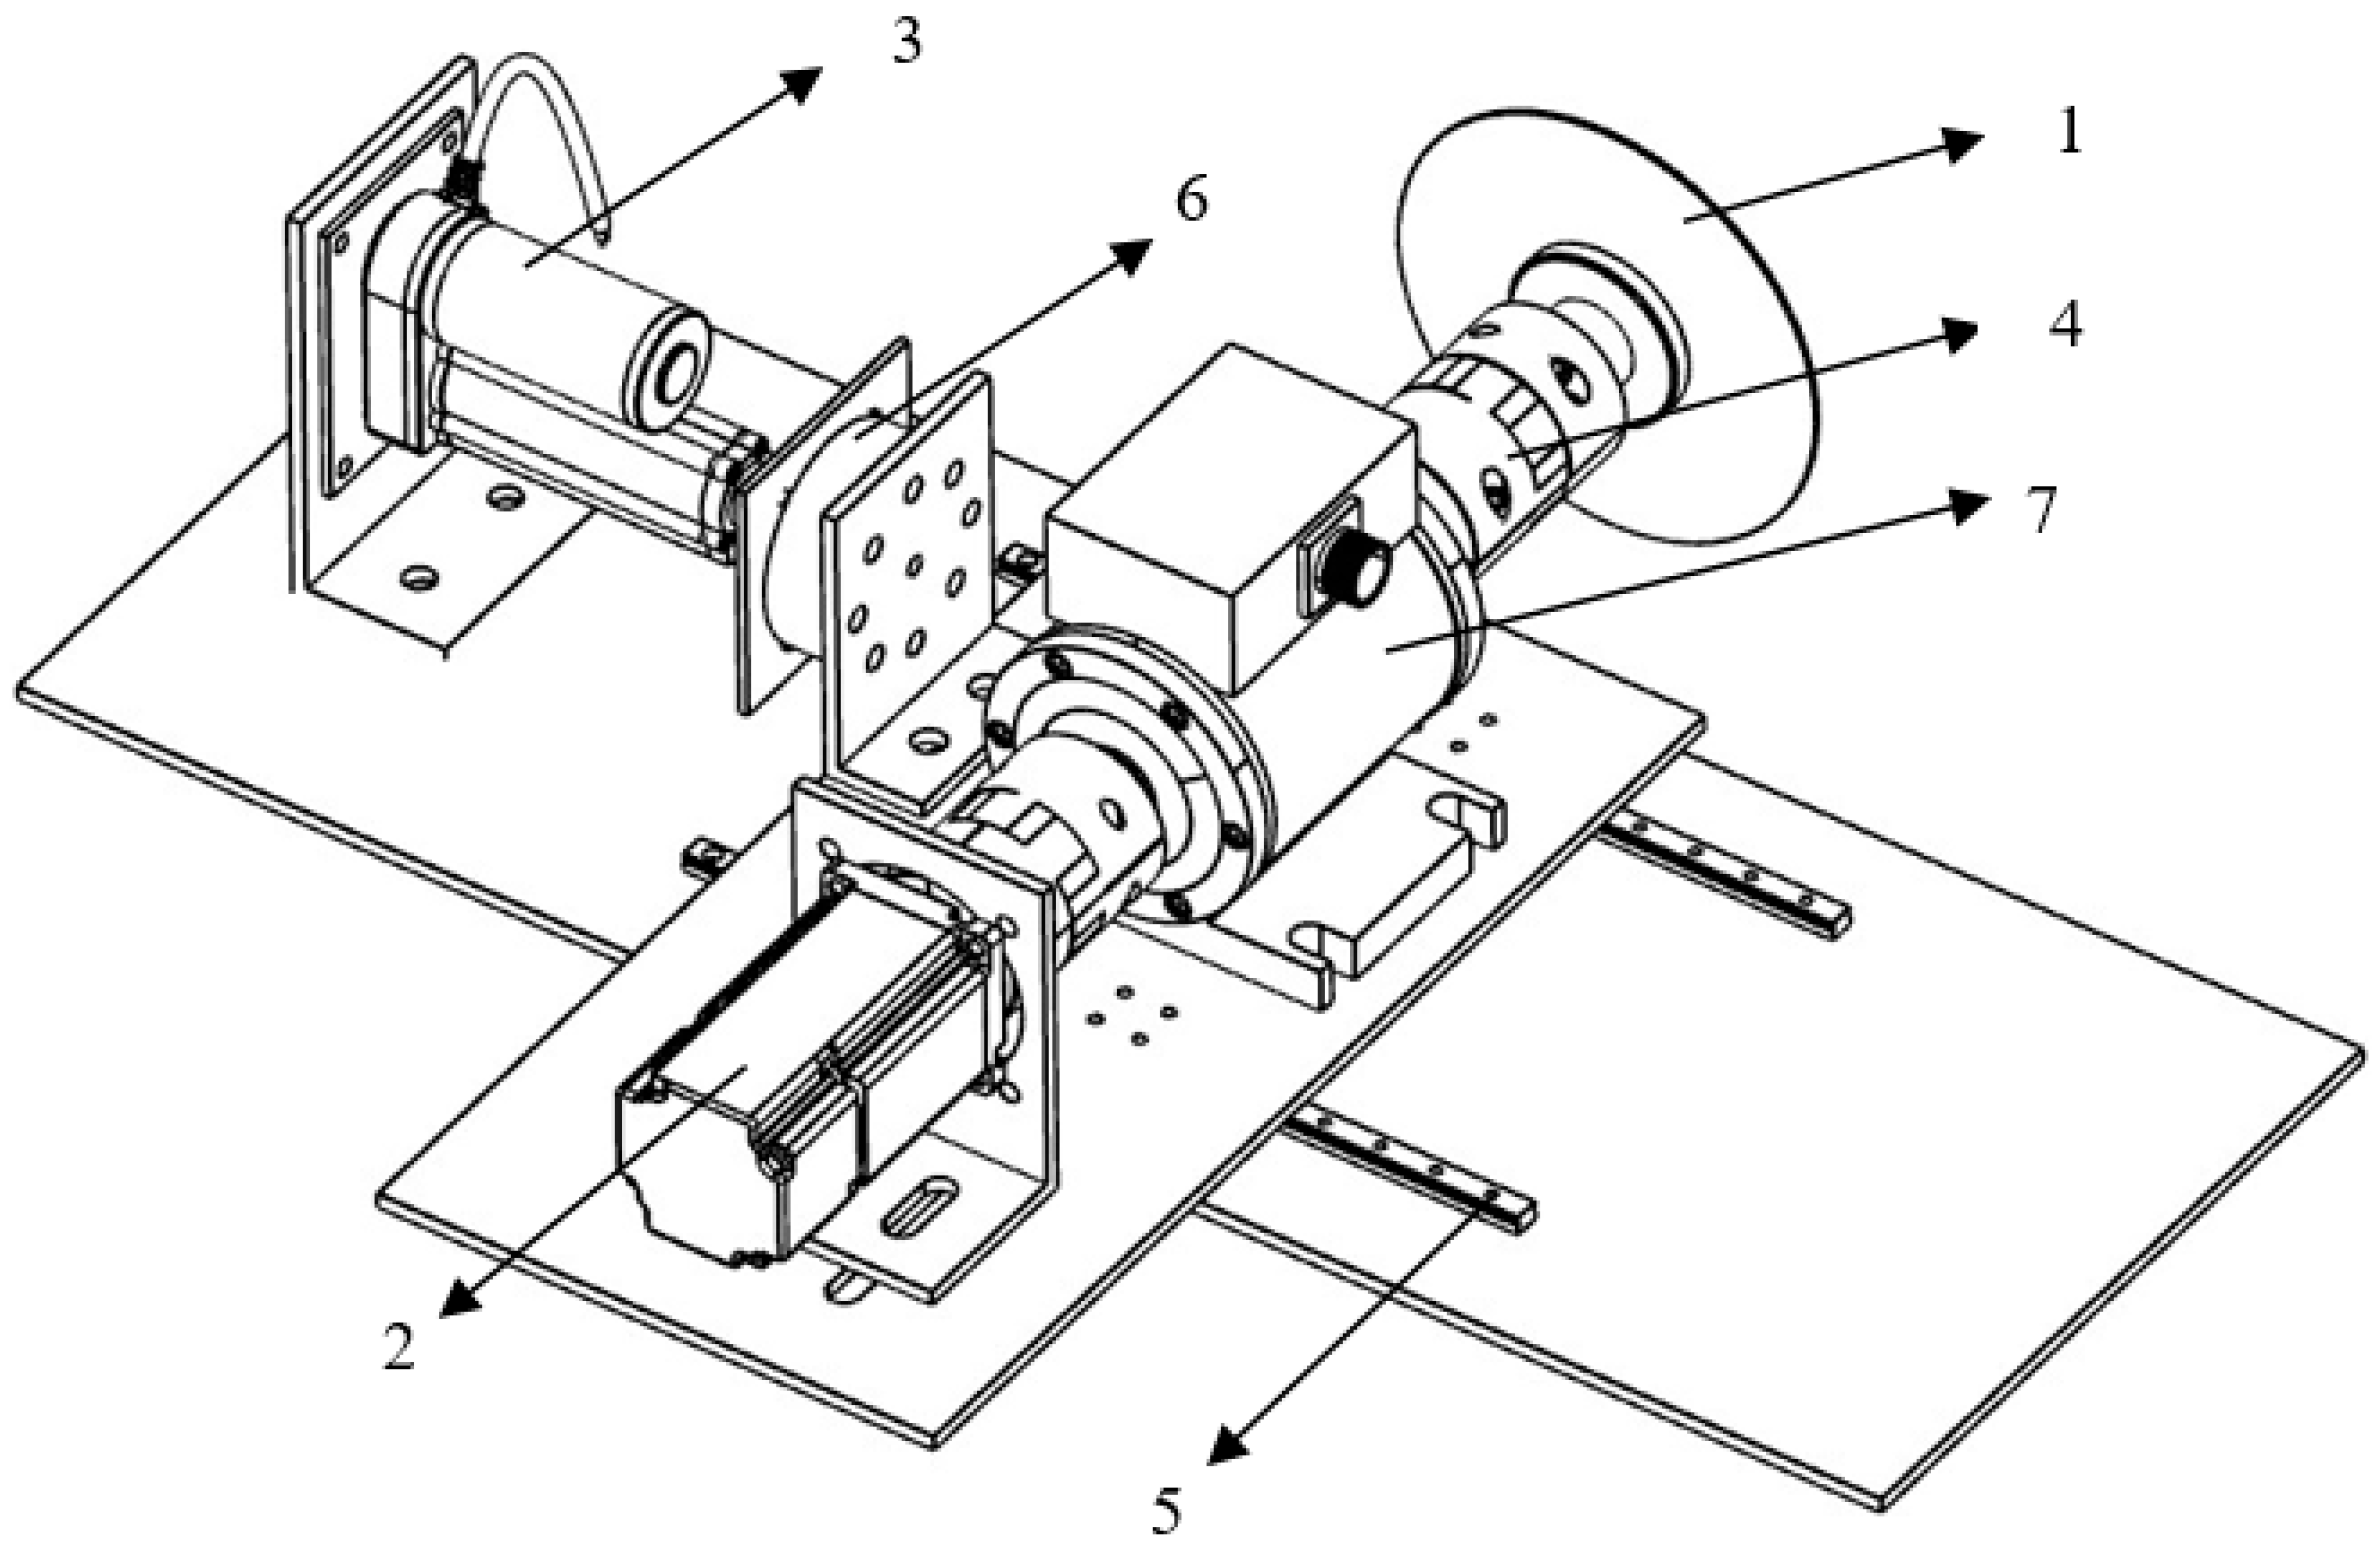
2.3.1. Sawing System

The sawing system constitutes the central component of the sugarcane seed cutting test stand, as illustrated in Figure 5. This system can be subdivided into the cutting and feeding sections. The cutting part comprises the servo motor (Beijing Times Chaoqun Electric Technology Co., Beijing, China) with a coupling and power shaft, which supplies rotational power to the circular saw. Conversely, the feeding part consists of the pusher motor(Changzhou Luilec Electric Actuator Co., Changzhou, China) with a miniature guide rail, connecting components, and cutting base plate, and is responsible for advancing and cutting the material. The actuator motor and servo motor are controlled by the stroke controller and voltage governor, enabling the execution of cutting operations at varying feeding and sawing speeds.

2.3.2. Transmission System

As shown in Figure 6, the transfer system encompasses a frame, a gantry-type pressing mechanism, a belt drive mechanism, and a support plate, enabling the transportation and clamping of various sugarcane seed stems. The frame, fabricated from Q235 material, offers structural support for the entire platform. Meanwhile, the gantry type pressing mechanism comprises rubber rollers, nylon press wheels, drive shafts, springs, brackets, and bearing seats. The nylon press wheels are adjustable vertically via a movable cross-plate and springs on the bracket, facilitating the clamping of seed stems with varying cane diameters in conjunction with the rollers. The belt transmission mechanism comprises speed-regulating motors, belts, and belt pulleys. These motors supply power to drive the rotation of the rubber rollers and clamp various cane seed stems by means of the belts and belt pulleys. The belt drive mechanism consists of a speed motor, belt, and pulley. The speed motor provides power, driving the rotation of the rubber roller through the belt and pulley, thereby transporting the sugarcane seed stalk to the cutting position. The support plate comprises a movable bracket and stopper, collaborating with the gantry pressing mechanism to clamp the sugarcane seed stalk. Moreover, it facilitates dual-support cutting during the seed cutting process.

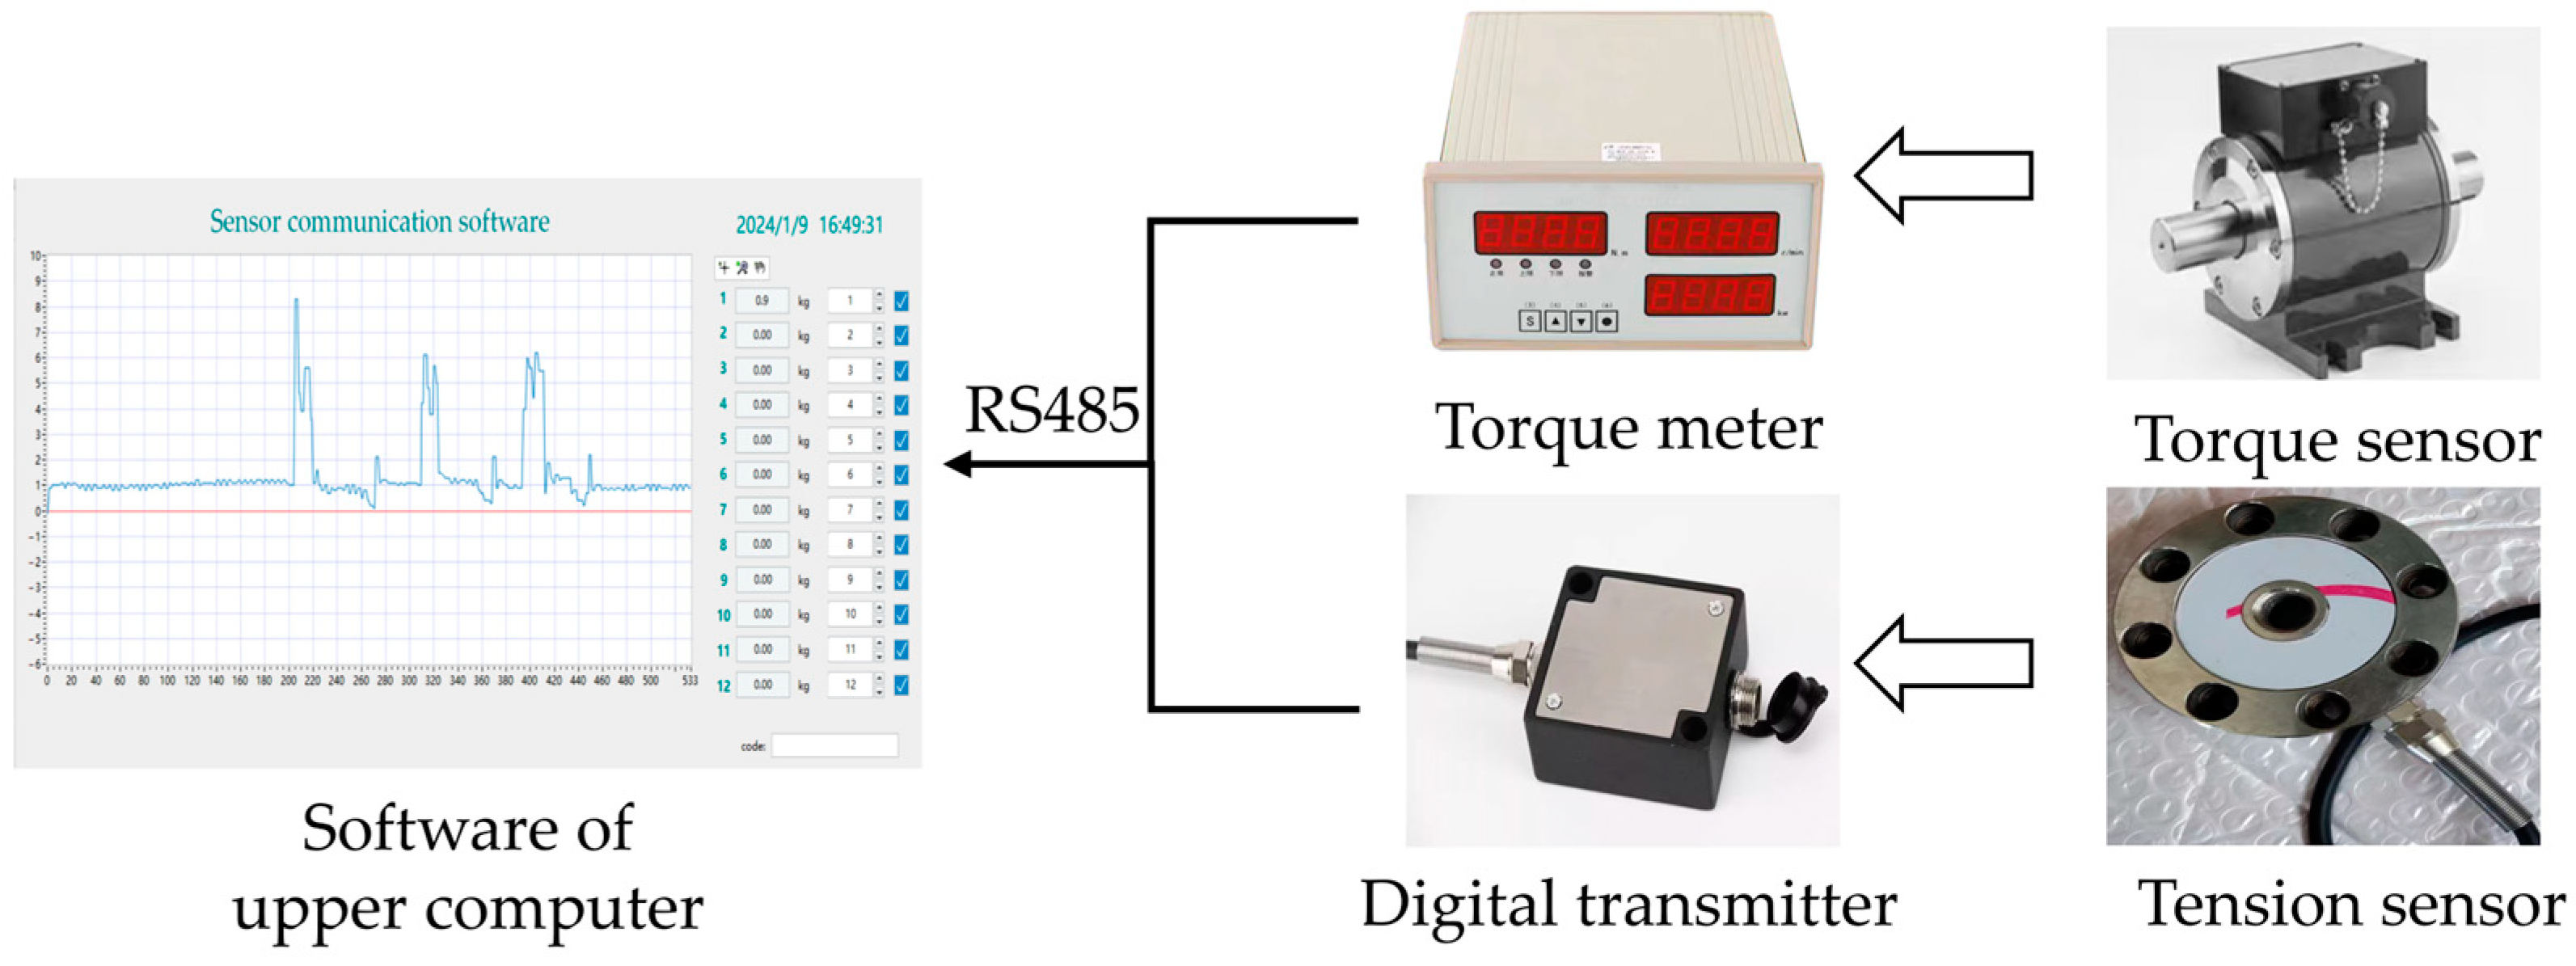
2.3.3. Data acquisition system

As shown in Figure 7, in the data acquisition system, the dynamic torque sensor (BENGBU CHINO SENSOR CO., Bengbu, China) is connected in series between the rotary axis of the circular saw and the rotary axis of the servomotor to detect the torque value of sugarcane cutting. The tension sensor (BENGBU CHINO SENSOR CO., Bengbu, China) is connected in series between the pusher motor and the sawing platform to measure the radial cutting force. Accurate detection and recording of test data, including radial force and torque, can be achieved through proper sensor positioning. The 24 V DC regulated power supply is connected in series with the digital transmitter, and its output is linked to the laptop computer. The technical specifications of the sugarcane stem cutting test rig are presented in Table 1.

2.4. Evaluation Indexes

1. During sugarcane stalk sawing operations, the peak sawing force is a crucial parameter impacting sawing performance [28,29]. The peak cutting force can be calculated from the radial force Fn and tangential force Ft according to Equation (5):
F m = F n 2 + F t 2
where Fm is the peak cutting force, N; Fn is the radial force, N; and Ft is the tangential force, N.
The radial force Fn can be measured directly by the tensile transducer, while the tangential force Ft is calculated from the peak torque measured by the torque transducer according to Equation (6):
F t = T R
where Ft is the tangential force, N; T is the torque value, N·m; R is the radius of the circular saw, m.
2. Considering the biological characteristics and agronomic requirements of sugarcane, the sawing surface of the cut stalk must be smooth and devoid of tearing or burning. Tear-induced surface damage facilitates moisture dissipation, resulting in diminished plant germination rates [13,30,31], and possibly plant mortality in the second year. For ease of analysis and measurement purposes, the fracture area ratio τ is employed to assess the quality of the cross-section, representing the proportion of the fracture area to the total cross-sectional area of the sugarcane [25,32]. Because of the inherent biological characteristics of sugarcane, its cutting surface tends to be irregular and oval, making it challenging to measure its area accurately. As shown in Figure 8, following the sawing test, the area of the transverse cut surface of sugarcane was determined using image processing techniques applied to grid paper. The damaged area, comprising tears, bumps, or burrs, was quantified by manually counting these irregularities on the grid paper. The quality of the sawing surface, denoted A, can be calculated using the following equation:
τ = A 1 A 2
A = 1 τ × 100 %
where A is the sawing surface quality score, %; A1 is the area of the damaged section, mm2; A2 is the cross-sectional area of the branch, mm2.

3. Design of the Experiment

3.1. Single-Factor Test

Considering the chosen parameters, single-factor tests were conducted to determine the influence of feed speed, sawing speed, and stalk diameter on both the peak sawing force and sawing surface quality score. Throughout the growth cycle of sugarcane, most sugarcane stalks have a diameter of approximately 30 mm. Hence, to comprehensively investigate the influence of the stalk diameter on the target variables, the stalk diameter D was set to 25–35 mm. At higher sawing speeds, there is a certain operational risk [33]. Thus, the sawing speed was set between 6 and 18 m/s. At higher feed speeds, violent collisions may occur between the circular saw and the sugarcane, potentially leading to tearing or surface damage [34]. Hence, the feed speed was set between 0.04 and 0.16 m/s. Table 2 displays the factors and corresponding levels of the single-factor test, with each test group replicated three times to derive the mean value.

3.2. Multi-Factor Test

To optimize the interaction among parameters and test factors, a multi-factor test with three factors and three levels was designed following the Box–Behnken principle, expanding upon single-factor experiments. Table 3 displays the factors and corresponding levels of the multi-factor test, with each test group replicated three times to derive the mean value.

4. Results

Following the planned combination of single-factor and multi-factor tests, the experiments were conducted sequentially using the sugarcane stalk cutting test rig. The field diagram depicting sugarcane stalk cutting is presented in Figure 9. Throughout the experiment, it was observed that mismatched parameters resulted in a notable decrease in cutting quality, characterized by evident burrs and tears on the cutting surface.

4.1. Single-Factor Test Results

As shown in Figure 10, Figure 11 and Figure 12, as the feed speed increases, the peak sawing force initially increases and then decreases. Similarly, as the sawing speed increases, the peak sawing force initially decreases and then increases. Additionally, the peak sawing force increased with increasing stalk diameter.
As the feed speed increases, the quality of the sawing section initially decreases, then stabilizes, and finally decreases again. The quality of the sawing section improves with increasing sawing speed. Similarly, as the stalk diameter increases, the quality of the sawing section initially increases, followed by a decrease.

4.2. Multi-Factor Test Results

The multi-factor experiment was conducted following the Box–Behnken design principle in a randomized order. A total of twelve experimental points and five center points were utilized to minimize external interference in the experiment. Each experimental condition was replicated three times to determine the average value. The experimental findings are presented in Table 4.

5. Discussion

5.1. Single-Factor Test Analysis

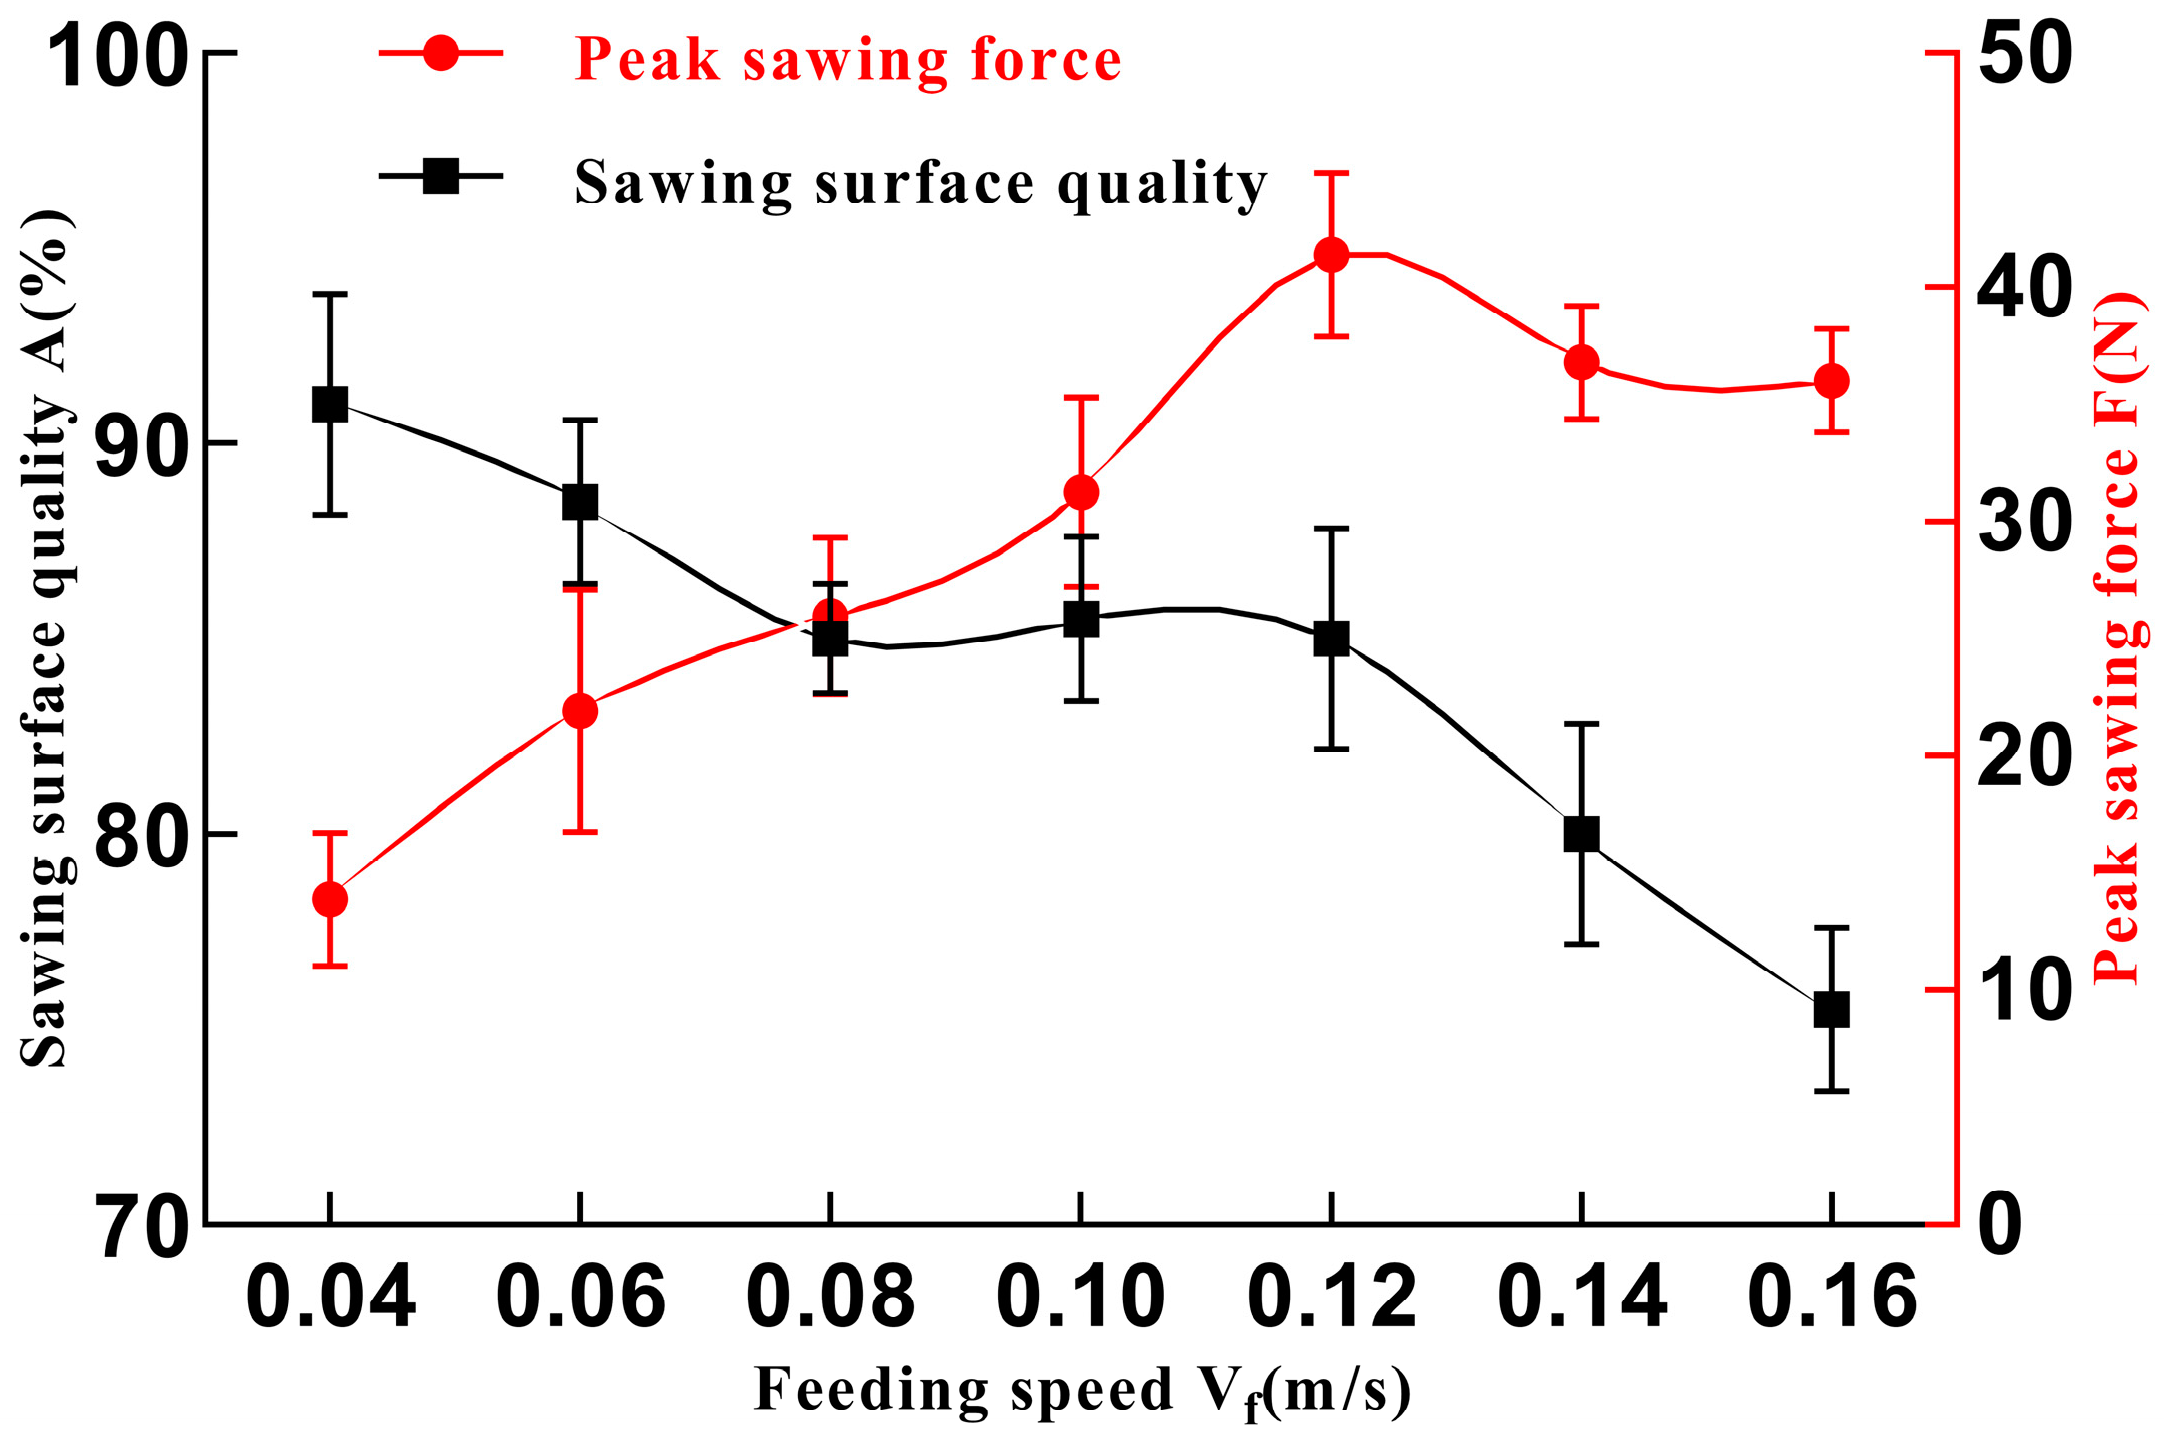
5.1.1. Feeding Speed
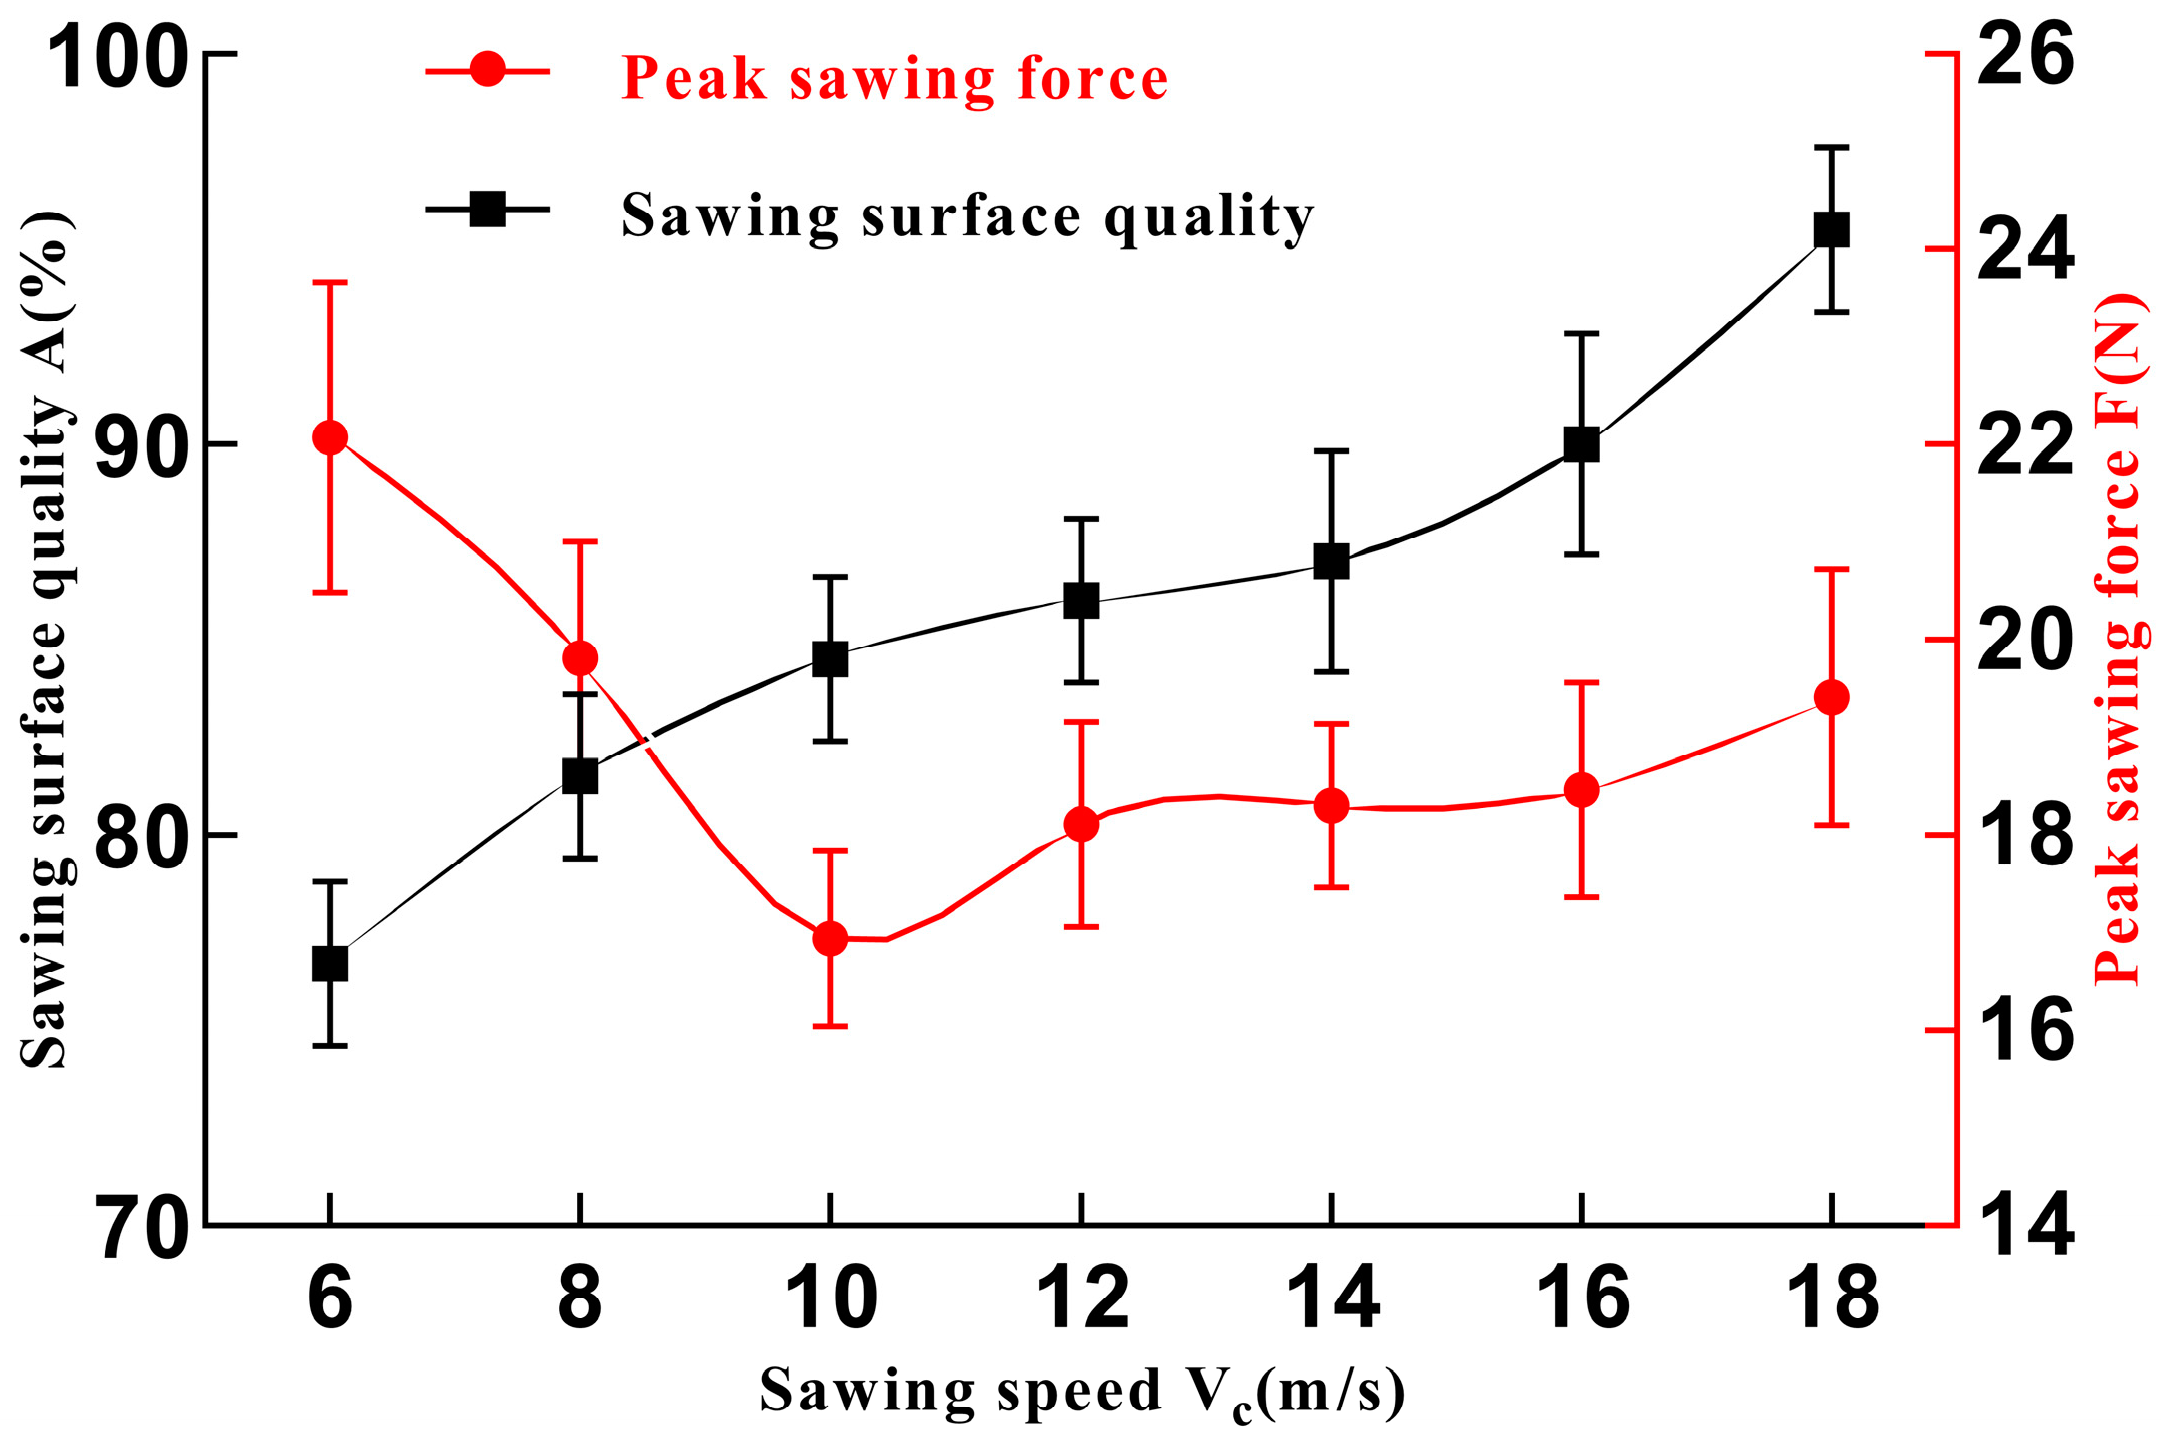
As shown in Figure 10, under identical operating conditions, as the feed speed increases, the radial impact steadily increases, while both the radial and axial forces increase correspondingly, leading to axial vibration and deformation of the saw blade, thereby compromising its stability during operation. Consequently, this leads to a gradual increase in the peak sawing force and a deterioration in the quality of the saw cut surface.

5.1.2. Sawing Speed

Sugarcane stalks, characterized by their unevenness and orthotropic fibrous nature, present unique challenges during sawing operations. As shown in Figure 11, when the sawing speed remains below 10 m/s, a notable increase in the peak sawing force occurs, accompanied by a deterioration in the surface quality of the saw cut. This phenomenon arises due to the inverse relationship between the sawing speed and the number of sawings per tooth under constant operating conditions. Specifically, lower sawing speeds result in greater sawing amounts per tooth, consequently elevating the frictional resistance between the saw blade and the sugarcane stalk. This elevated resistance leads to an increase in the peak sawing force and a decrease in the surface quality of the saw cut. Conversely, when the sawing speed exceeds 10 m/s, a continuous increase in the impact between the saw teeth and the sugarcane stalk is observed. This heightened impact elevates the tangential force during the sawing process, resulting in a gradual increase in the peak sawing force, albeit at a slower rate. Intriguingly, this trend is accompanied by an improvement in the surface quality of the saw cut.

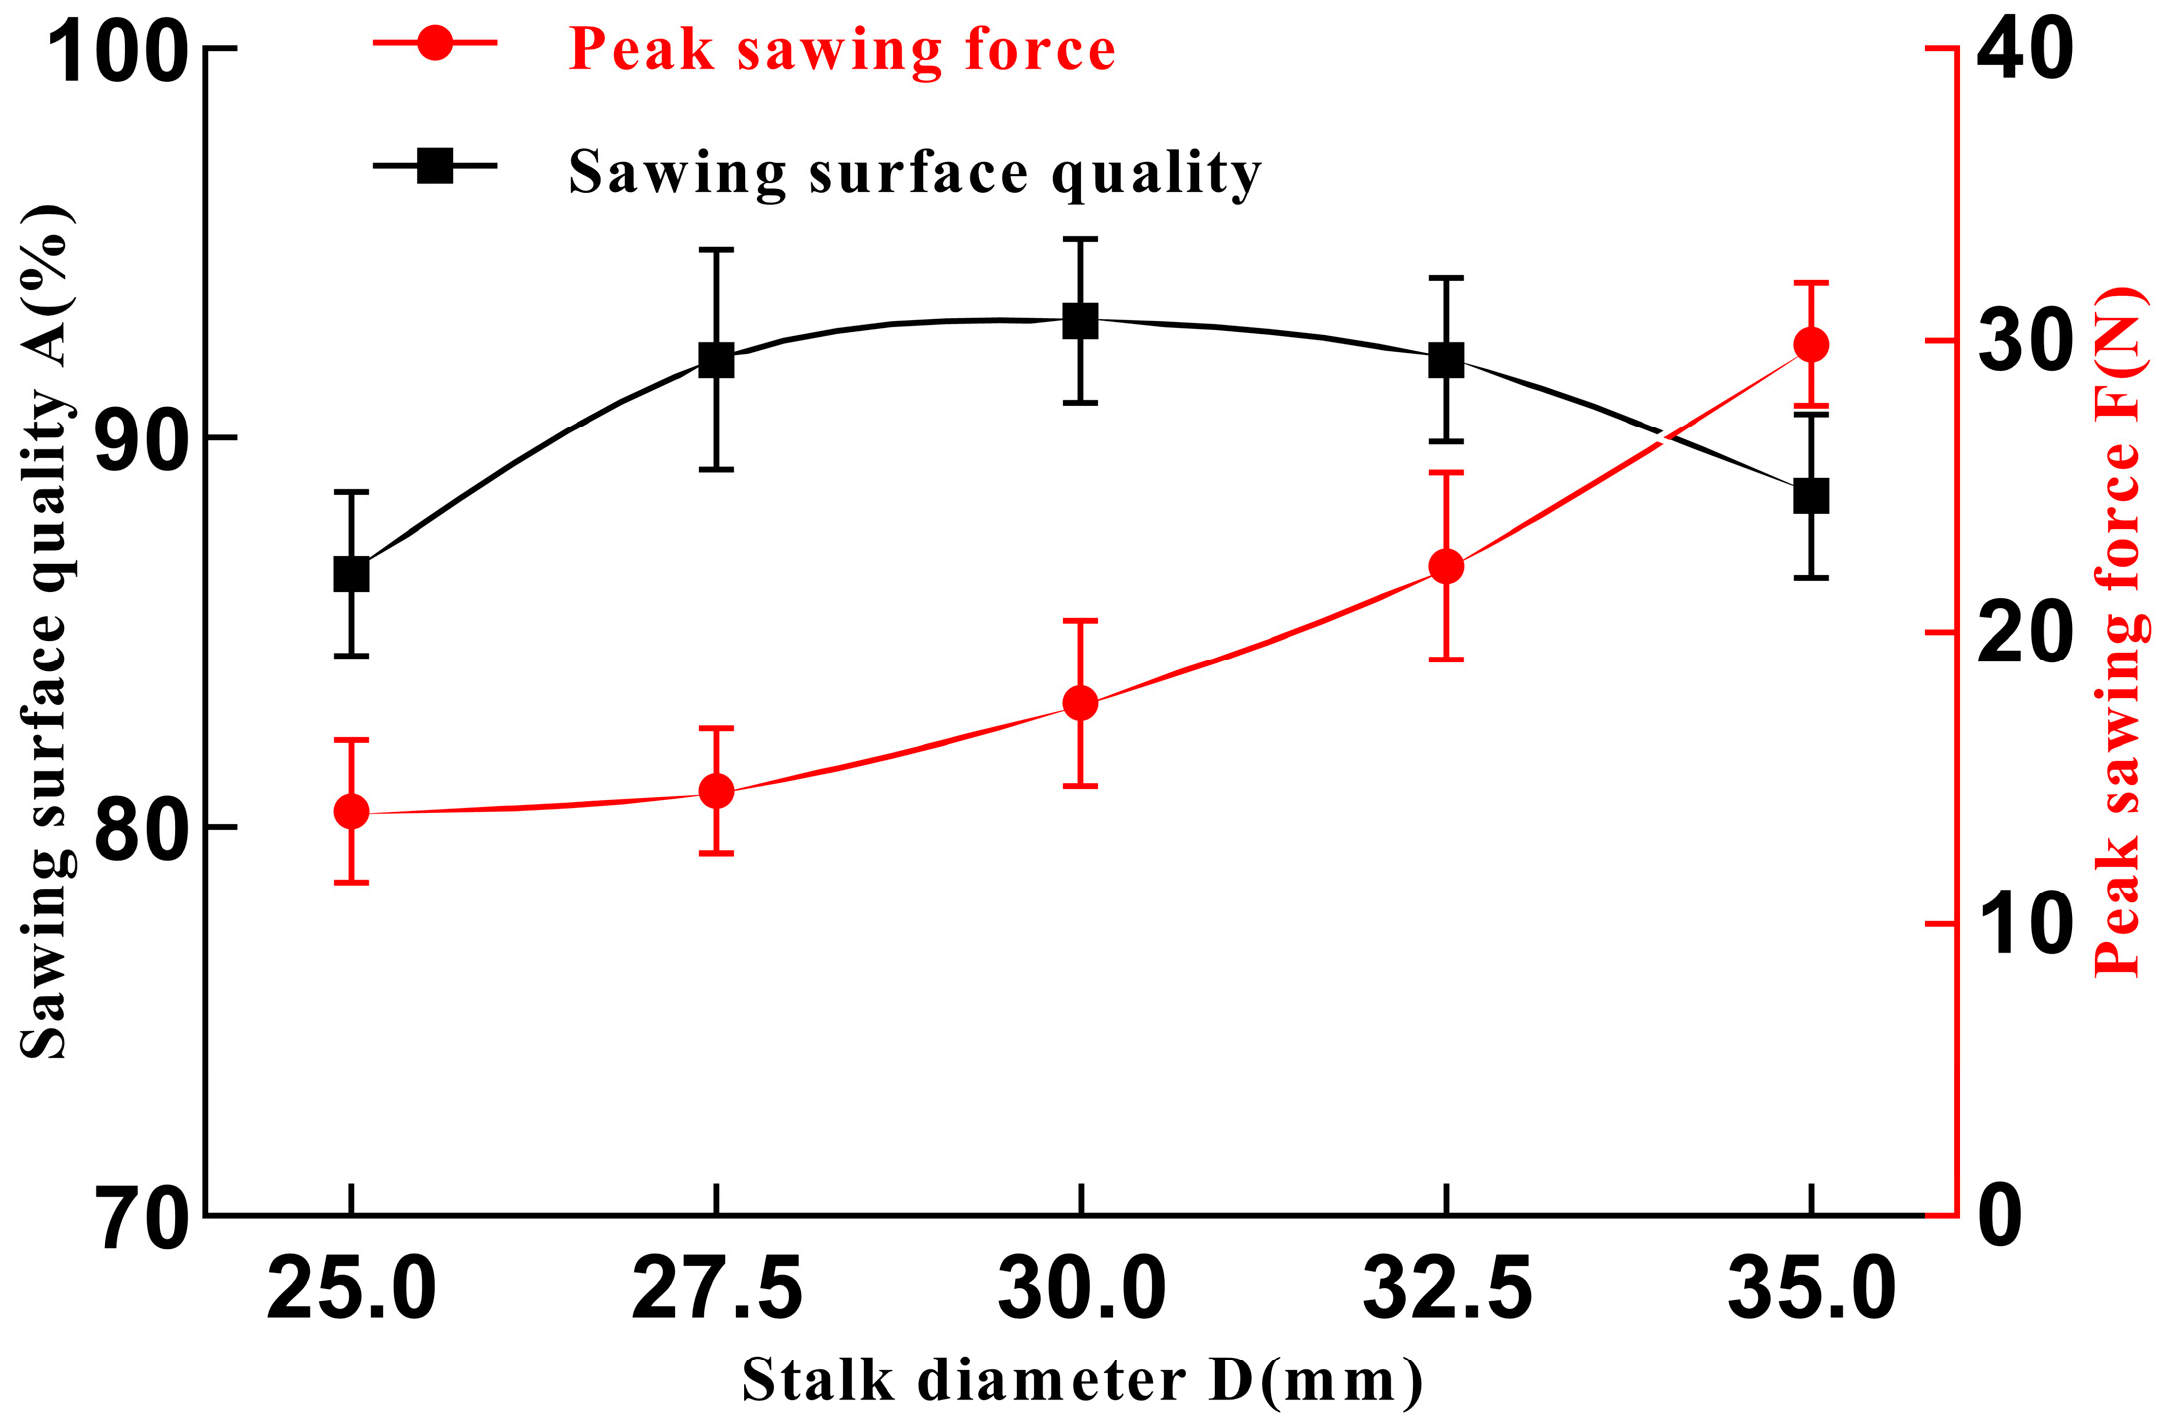
5.1.3. Stalk Diameter

As shown in Figure 12, as the stalk diameter increases, a larger amount of cellulose is sawn, leading to a significant increase in the sawing force. Under identical operating conditions, the enlarged cross-sectional area exacerbates frictional force and sawing resistance between the circular saw blade and the stalk. Consequently, feeding sugarcane becomes more challenging. During the actual sawing process, double-supported sawing is employed. Smaller stalk diameters are prone to deformation under external forces, causing uneven force distribution and tearing phenomena. Conversely, with increasing stalk diameter, the sawing force can be more effectively balanced, resulting in improved sawing quality.

5.2. Multi-Factor Test Analysis

5.2.1. Analysis of Variance (ANOVA)

From the analysis of variance of the peak sawing force in Table 5, the results indicate that the p-value of the response surface model of the regression model is 0.0001 (p < 0.01), indicating that the regression model is highly significant. The p-value of the lack of fit term is 0.2436 (>0.05), indicating a good model fit and no other major factors affecting the test indicators. The coefficient of determination R2 for the model is 0.9708, indicating a high level of confidence in the model. Therefore, the model can predict the variation in the peak sawing force of sawn sugarcane stalks. The significance analysis in Table 5 shows that D, Vf, and Vc have extremely significant effects on the model (p < 0.01), Vc·D and V c 2 have significant effects on the model (0.01 ≤ p < 0.05), and the remaining terms have no significant effects on the model (p > 0.05).
Removing the insignificant terms from the above model that do not have significant effects on the regression model results in a simplified model as follows:
F = 32.98 + 2.66 V f 2.05 V c + 3.28 D + 1.24 V c D 1.22 V C 2
According to the analysis of variance of the sawing surface quality data in Table 6, the results indicate that the p-value of the response surface model of the regression model is 0.0002 (p < 0.01), indicating that the regression model is highly significant. The p-value of the lack of fit term is 0.3046 (>0.05), indicating a good model fit and no other major factors affecting the test indicators. The coefficient of determination R2 for the model is 0.9675, indicating a high level of confidence in the model. Therefore, the model can predict the variation in the peak sawing force of sawed sugarcane stalks. The significance analysis in Table 6 shows that Vc, D, Vf, Vc·D, V f 2 , and V c 2 have extremely significant effects on the model (p < 0.01), Vf·Vc has a significant effect on the model (0.01 ≤ p < 0.05), and the remaining terms have no significant effects on the model (p > 0.05).
Removing the insignificant terms from the above model that do not have significant effects on the regression model results in a simplified model as follows:
A = 87.26 1.97 V f + 4.56 V c + 2.41 D + 1.79 V f V c + 2.62 V c D 2.62 V f 2 3.42 V c 2

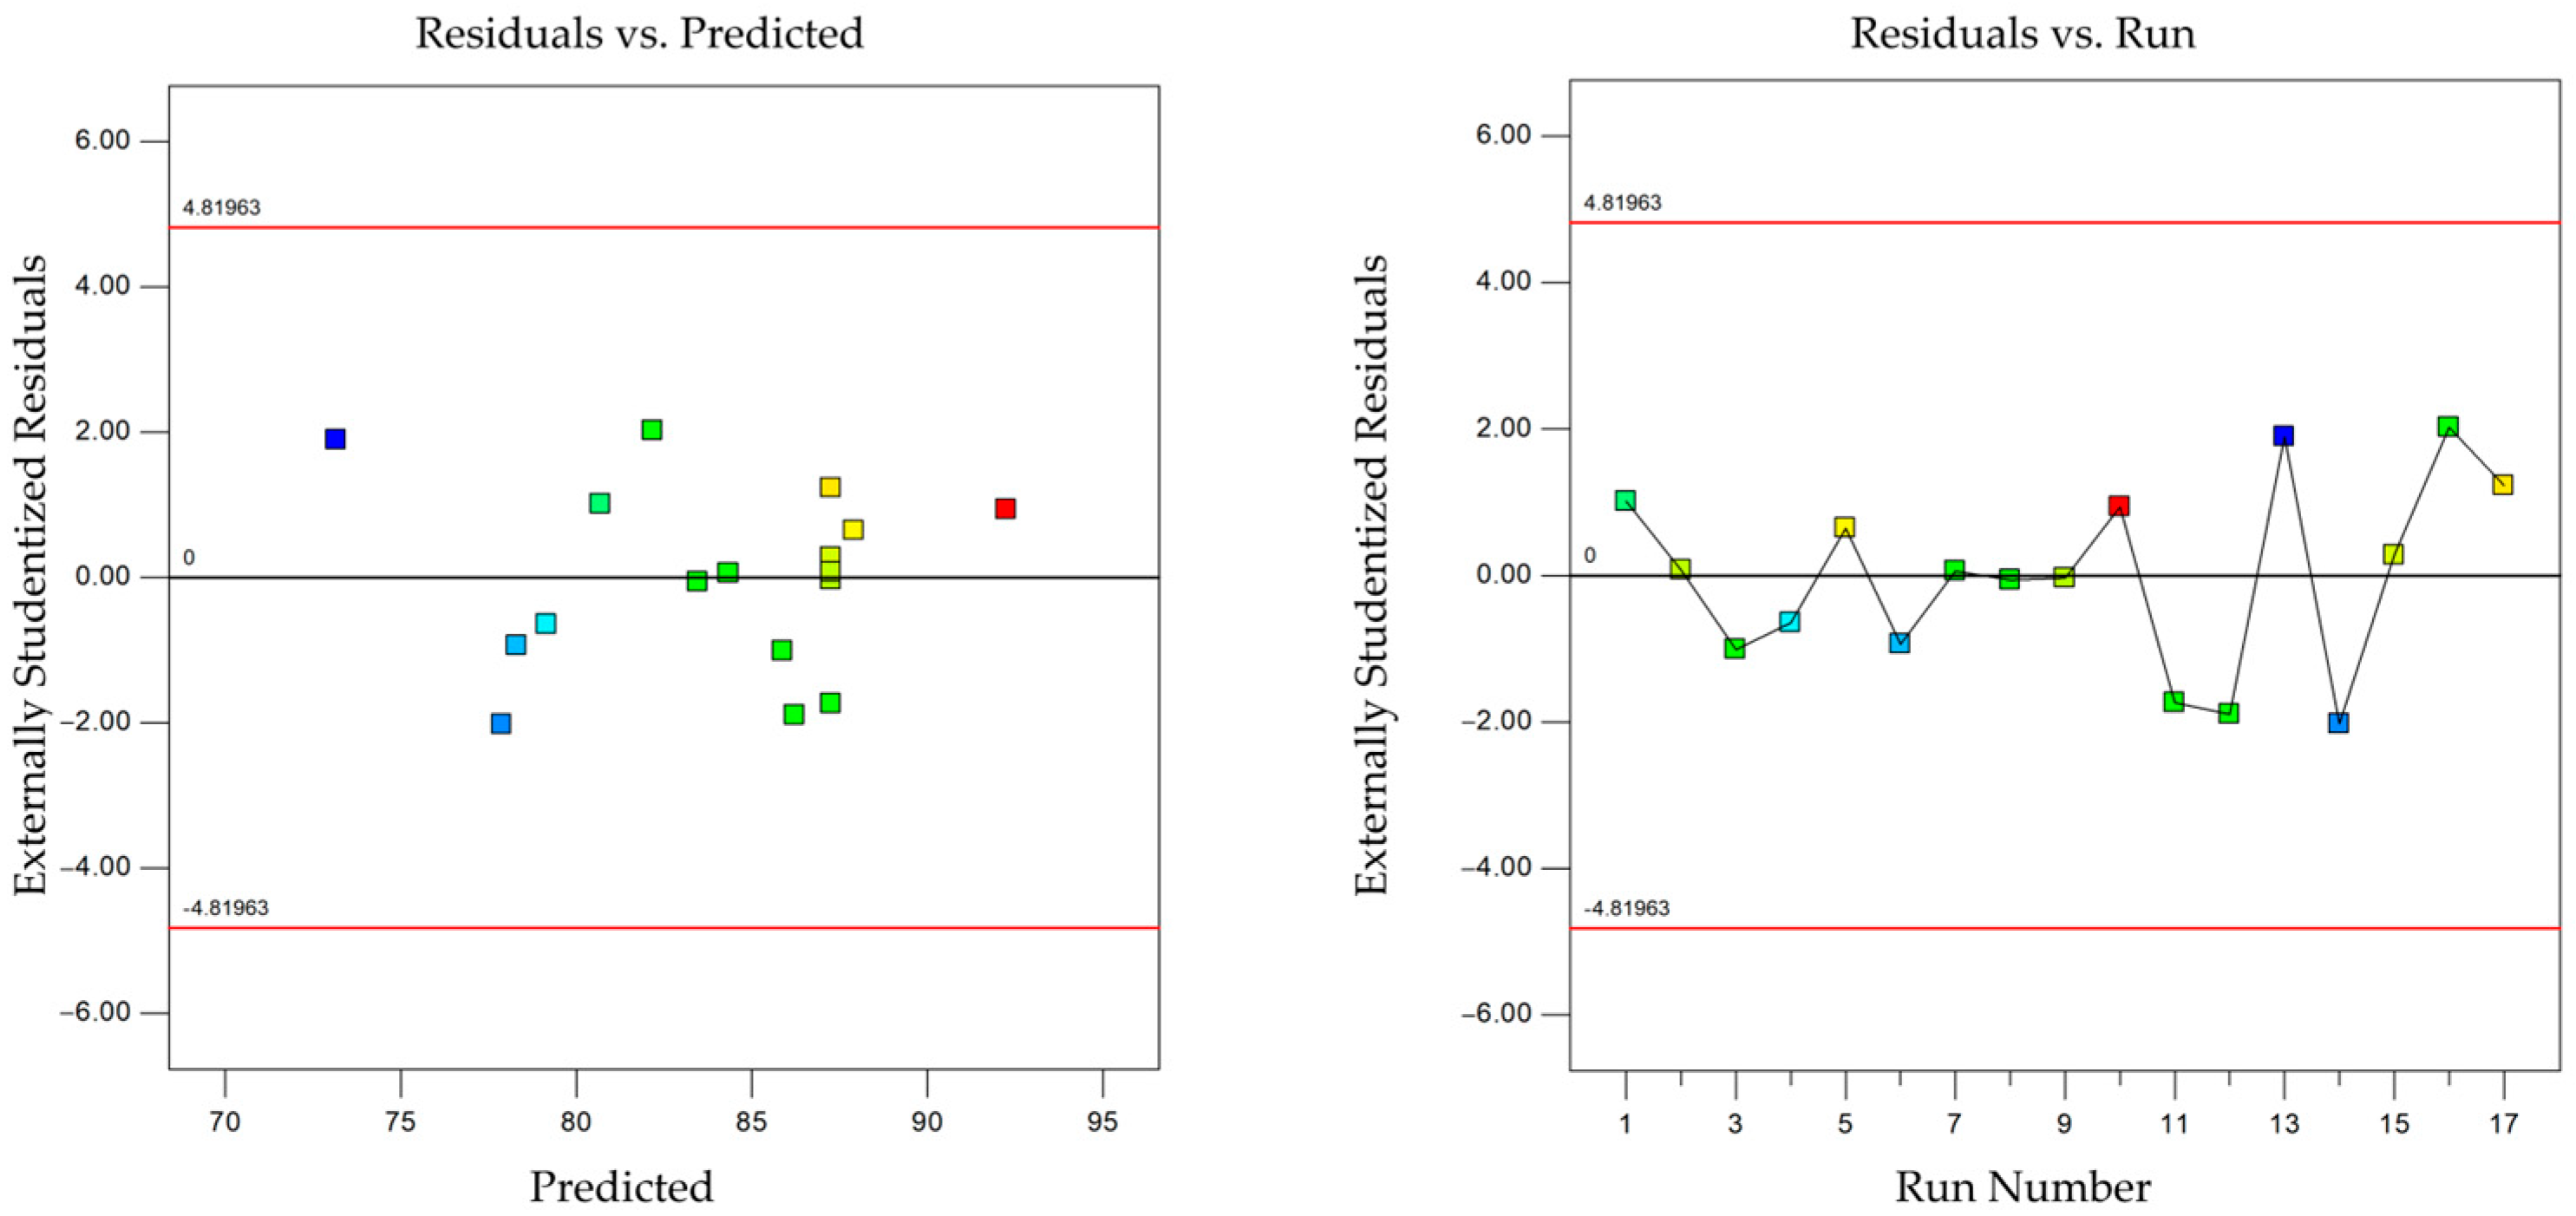
5.2.2. Test Residual Analysis

Residual analysis comprises two components: residual prediction and residual run. In the residual prediction graph, if all test points fall within the 95% confidence interval, it indicates a more precise fit of the model. In the residual run chart, if any test points lie outside the (−4.82, 4.82) interval, it signifies an anomaly, requiring analysis of the underlying reasons and repetition of the test combination. As depicted in Figure 13 and Figure 14, all test points in the orthogonal tests of peak cutting force and section quality fall within the confidence interval, demonstrating the accuracy and reliability of the test design and data.

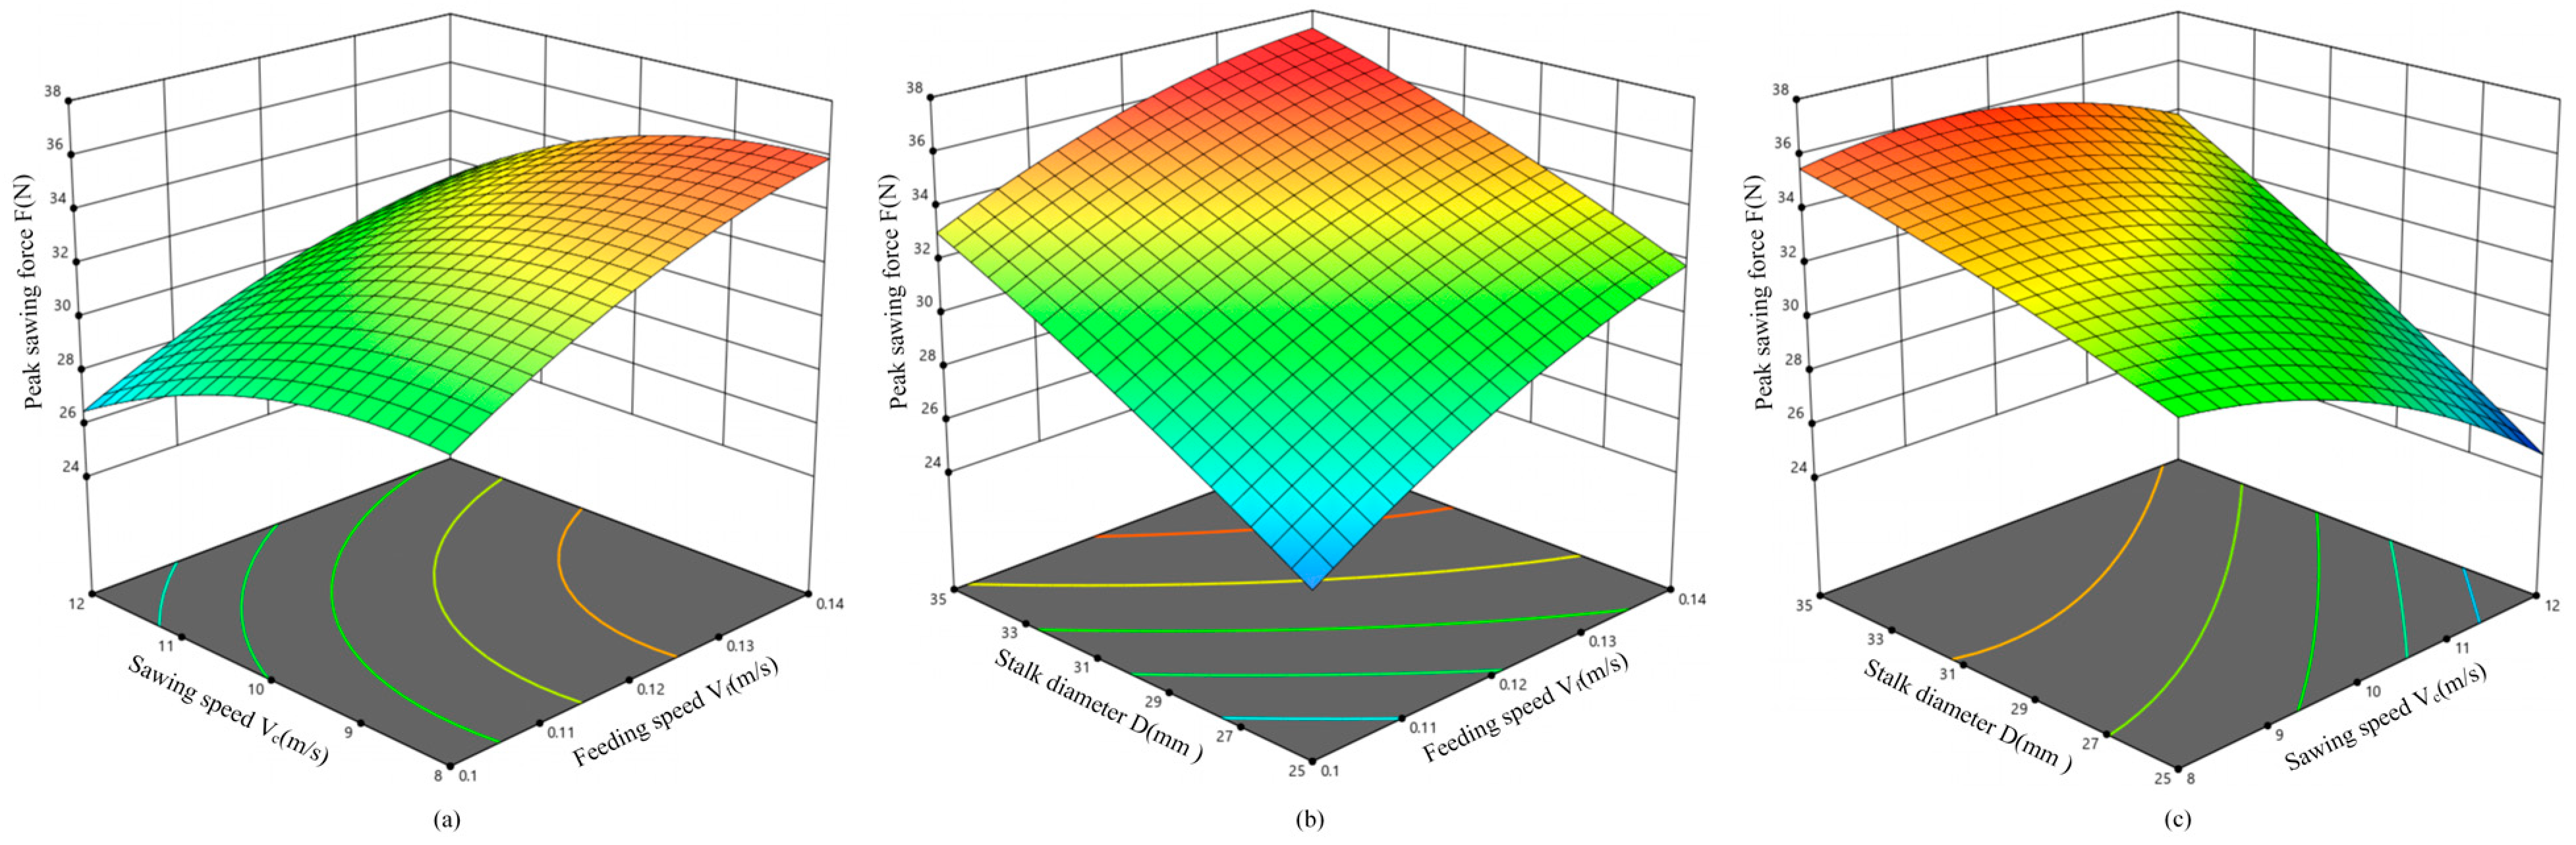
5.2.3. Response Surface Analysis

With respect to the RSM, a second-order multivariate regression analysis was conducted on both the peak sawing force and sawing surface quality, yielding three-dimensional response surface plots depicting their variations across different levels of factors. Utilizing three-dimensional response surface plots enables a more intuitive observation of the interaction among independent variables and their influence on the dependent variables. A steeper slope of the response surface indicates a more pronounced impact of the factors on the dependent variable.
  • Interactive effects of different factors on peak sawing force.
Figure 15 shows three-dimensional response surface plots illustrating the variation in the peak sawing force across different levels of the factors. Figure 15a shows the interaction effect between the feed speed and sawing speed on the peak sawing force. With an increase in feed speed, the peak sawing force also increases; conversely, it decreases with an increase in sawing speed. A comparison of the slopes of the response surface reveals that the feed speed has a more significant impact on the peak sawing force than does the sawing speed.
Figure 15b shows the interaction effect between feed speed and stalk diameter on the peak sawing force. The peak sawing force increases with both increasing feed speed and increasing stalk diameter. A comparison of the slopes of the response surface reveals that the stalk diameter exerts a more significant influence on the peak sawing force than the feed speed.
Figure 15c shows the interaction effect between the sawing speed and stalk diameter on the peak sawing force. With increasing sawing speed, the peak sawing force decreases. Furthermore, an increase in the stalk diameter corresponds to an increase in the peak sawing force. A comparison of the slopes of the response surface reveals that the stalk diameter exerts a more significant impact on the peak sawing force than the sawing speed.
In conclusion, the factors influencing the peak sawing force, ranked in order of significance, are the stalk diameter, feed speed, and sawing speed. This finding, with the findings of the variance analysis, is presented in Table 5.
2.
Interactive effects of different factors on sawing surface quality.
Figure 16 shows three-dimensional response surface plots illustrating the variation in the sawing surface quality across the different levels of the factors. Figure 16a shows the interaction effect between the feed speed and sawing speed on the sawing surface quality. The surface quality initially improves with increasing feed speed and sawing speed but later decreases. A comparison of the slopes of the response surface reveals that the sawing speed exerts a more significant influence on the sawing surface quality than does the feed speed.
Figure 16b shows the interaction effect between feed speed and stalk diameter on the sawing surface quality. Sawing surface quality initially improves with increasing feed speed and stalk diameter but later decreases. A comparison of the slopes of the response surface reveals that the stalk diameter exerts a more significant influence on the sawing surface quality than the feed speed.
Figure 16c shows the interaction effect between the sawing speed and stalk diameter on the sawing surface quality. Sawing surface quality initially improves with increasing sawing speed and stalk diameter but later decreases. A comparison of the slopes of the response surface reveals that the sawing speed exerts a more significant influence on the sawing surface quality than the stalk diameter.
In conclusion, the factors influencing the sawing surface quality, ranked in order of significance, are the sawing speed, stalk diameter, and feed speed. This finding, with the results of the variance analysis, is presented in Table 6.

5.3. Optimization and Model Verification

In sugarcane stalk sawing production, the stalk diameter conforms to a central distribution, with more than 80% of cane diameters falling within the 25 mm to 30 mm range. To validate the uncertainty and repeatability of the experiments, and to assess the predictive performance of the regression model for various sawing parameters, field operation conditions were considered. Validation experiments were conducted utilizing stalk diameters of 25 mm, 30 mm, and 35 mm, with each set of experiments replicated three times to derive the mean values. The optimization objectives were defined as achieving the minimum peak sawing force and maximizing the sawing surface quality score. The optimal parameter combinations were determined utilizing Design expert software 13.0 (Stat-Ease, Minneapolis, MN, USA), as shown in Table 7. The peak sawing force and sawing surface quality were computed using the regression model and subsequently compared with the experimental values.
As shown in Table 7, the predicted values of the peak sawing force model exhibited errors of 7.6%, 7.3%, and 6.4% relative to the experimental values, yielding an average relative error of 7.1%. The predicted values of the sawing surface quality model showed errors of 3.5%, 1.9%, and 3.1% relative to the experimental values, resulting in an average relative error of 2.83%. The experimental results exhibited excellent concordance with the predicted values, thus confirming the accuracy and reliability of the regression model. This further substantiates the feasibility of employing response surface methodology for the multi-objective collaborative optimization of presawing sugarcane seedlings.

6. Conclusions

This study investigated the primary factors affecting sawing quality through a mechanical analysis of sugarcane stalk sawing. A sawing experiment rig for sugarcane stalks was designed and constructed, and both single-factor and multi-factor experiments were conducted to explore the effects of various factors on parameters such as the peak sawing force and sawing surface quality. The findings of the research are summarized as follows:
(1)
By employing the central composite design experimental method, this study analyzed the influence trends of variables such as the sugarcane stalk diameter, feed speed, and sawing speed on the peak sawing force and sawing surface quality. Predictive models were then established, featuring model determination coefficients (R2) of 0.9708 and 0.9675, respectively, which underscore the reliability of the experimental approach. The models were validated via three separate experimental sets, revealing a maximum error in peak sawing force of 7.6% and an average relative error of 7.1%. For the sawing surface quality, the maximum error was recorded at 3.5%, with an average relative error of 2.83%. These results highlight the high precision of the models and their effectiveness in forecasting the peak sawing force and sawing surface quality of sugarcane stalks.
(2)
Based on the analysis of variance and model parameters, the factors affecting the peak sawing force, in order of significance, were determined to include the sugarcane stalk diameter, feed speed, and sawing speed. The factors impacting sawing surface quality in order of significance include the sawing speed, sugarcane stalk diameter, and feed speed. In terms of interactions, the feed rate and the sawing speed, the feed rate and the sugarcane stalk diameter have a significant effect on the peak sawing force, the sawing speed and the sugarcane stalk diameter had a highly significant effect on the sawing surface quality, and the feed speed and the sawing speed had a significant effect on the sawing surface quality.
The sugarcane stalk cutting test rig designed and developed in this study underwent verification through single-factor and multi-factor tests, demonstrating a positive cutting effect. During its practical application, no malfunctions or operational errors were observed, thus affirming the stability and reliability of the test device. The resulting research findings can serve as valuable references for the development and optimization of future sugarcane stalk pre-cutting equipment. Moreover, the blade material, tooth shape, and various sugarcane stalk varieties are known to influence both the peak cutting force and the quality of the sawing surface. Our research group will conduct thorough investigations into these factors.

Author Contributions

Conceptualization, B.Y., H.L., F.H., G.D., S.Z. (Shuang Zheng), Z.C., S.Z. (Sili Zhou), Y.D., X.W., S.Q., G.L., L.L. and B.L.; methodology, B.Y., F.H. and G.D.; software, B.Y. and H.L.; validation, H.L., S.Z. (Sili Zhou), Y.D. and X.W.; investigation, B.Y. and F.H. writing—original draft preparation, B.Y., H.L., F.H., S.Q. and L.L.; writing—review and editing, G.D., S.Z. (Shuang Zheng), Z.C., G.L. and B.L.; formal analysis, B.Y., H.L. and X.W.; investigation, S.Z. (Sili Zhou) and Y.D.; supervision, F.H., G.D. and B.L.; project administration, S.Q. and G.L.; funding acquisition, F.H. All authors have read and agreed to the published version of the manuscript.

Funding

Hainan Provincial Natural Science Foundation of China (Grant No. 521QN308, Grant No. 323MS089), Science and Technology special fund of Hainan Province (Grant No. ZDYF2024XDNY150).

Institutional Review Board Statement

Not applicable.

Data Availability Statement

The data reported in this study are contained within the article.

Acknowledgments

We would like to express our gratitude to our supervisor for their project funding support and guidance on this paper, as well as to our fellow researchers for their help and support.

Conflicts of Interest

The authors declare no conflicts of interest.

References

  1. Healey, A.L.; Garsmeur, O.; Lovell, J.T.; Shengquiang, S.; Sreedasyam, A.; Jenkins, J.; Plott, C.B.; Piperidis, N.; Pompidor, N.; Llaca, V.; et al. The complex polyploid genome architecture of sugarcane. Nature 2024, 628, 804–810. [Google Scholar] [CrossRef] [PubMed]
  2. Lu, G.; Liu, P.; Wu, Q.; Zhang, S.; Zhao, P.; Zhang, Y.; Que, Y. Sugarcane breeding: A fantastic past and promising future driven by technology and methods. Front. Plant Sci. 2024, 15, 1375934. [Google Scholar] [CrossRef] [PubMed]
  3. de Abreu, L.G.F.; Grassi, M.C.B.; de Carvalho, L.M.; da Silva, J.J.; Oliveira, J.V.; Bressiani, J.A.; Pereira, G.A. Energy cane vs sugarcane: Watching the race in plant development. Ind. Crops Prod. 2020, 156, 112868. [Google Scholar] [CrossRef]
  4. Gupta, R.; Singh, P.R.; Singh, A.K. Development of sugarcane-cum-potato planter for mechanisation of simultaneous planting of sugarcane and potato. Sugar Tech 2017, 19, 517–525. [Google Scholar] [CrossRef]
  5. Mahasuweerachai, P.; Suksawat, J. Incentives for mechanized cane harvesting in thailand: A choice experiment. J. Asian Econ. 2022, 78, 101434. [Google Scholar] [CrossRef]
  6. Que, Y.; Wu, Q.; Zhang, H.; Luo, J.; Zhang, Y. Developing new sugarcane varieties suitable for mechanized production in china: Principles, strategies and prospects. Front. Plant Sci. 2024, 14, 1337144. [Google Scholar] [CrossRef] [PubMed]
  7. Paulo Testa, J.V.; Battistuzzi Martins, M.; Carpes Marques Filho, A.; Pereira Lanças, K.; Lustosa Sobrinho, R.; Finatto, T.; Okla, M.K.; AbdElgawad, H. Continuous and impact cutting in mechanized sugarcane harvest: Quality, losses and impurities. Agriculture 2023, 13, 1329. [Google Scholar] [CrossRef]
  8. Nagapavithra, S.; Umamaheswari, S. Detection and classification of sugarcane billet damage using aquila sailfish optimizer based deep learning. Artif. Intell. Rev. 2023, 56, 2183–2206. [Google Scholar] [CrossRef]
  9. Wu, F.; Li, S.; He, Y.; Song, M.; Ma, F.; Teng, X.; Liang, Y. Optimized design and performance of pre-cutting vibrating sugarcane sett metering device. Sugar Tech Int. J. Sugar Crops Relat. Ind. 2023, 25, 210–222. [Google Scholar] [CrossRef]
  10. Wang, M.; Liu, Q.; Ou, Y.; Zou, X. Experimental study of the seed-filling uniformity of sugarcane single-bud billet planter. Sugar Tech Int. J. Sugar Crops Relat. Ind. 2021, 23, 827–837. [Google Scholar] [CrossRef]
  11. Ma, F.; Li, K.; Luo, X.; Li, S.; Teng, X. Design and experimental study of a transverse metering device for precut sugarcane setts. Sugar Tech Int. J. Sugar Crops Relat. Ind. 2022, 24, 1597–1611. [Google Scholar] [CrossRef]
  12. Yang, W.; Zhao, W.; Liu, Y.; Chen, Y.; Yang, J. Simulation of forces acting on the cutter blade surfaces and root system of sugarcane using fem and sph coupled method. Comput. Electron. Agric. 2021, 180, 105893. [Google Scholar] [CrossRef]
  13. Qiu, M.; Meng, Y.; Li, Y.; Shen, X. Sugarcane stem cut quality investigated by finite element simulation and experiment. Biosyst. Eng. 2021, 206, 135–149. [Google Scholar] [CrossRef]
  14. Meng, Y.; Wei, J.; Wei, J.; Chen, H.; Cui, Y. An ansys/ls-dyna simulation and experimental study of circular saw blade cutting system of mulberry cutting machine. Comput. Electron. Agric. 2019, 157, 38–48. [Google Scholar] [CrossRef]
  15. Liu, Y.; Zhou, J.; Fu, W.; Zhang, B.; Chang, F.; Jiang, P. Study on the effect of cutting parameters on bamboo surface quality using response surface methodology. Meas. J. Int. Meas. Confed. 2021, 174, 109002. [Google Scholar] [CrossRef]
  16. Zhao, L.; Yuan, W.; Xu, L.; Jin, S.; Cui, W.; Xue, J.; Zhou, H. Linear cutting performance tests and parameter optimization of poplar branches based on rsm and nsga-ii. Forests 2024, 15, 146. [Google Scholar] [CrossRef]
  17. Gao, Y.; Wang, Y.; Kang, F.; Kan, J. Multi-objective optimization of cross-section integrity rate and sawing power consumption in sawing caragana korshinskii kom. Branches. Ind. Crops Prod. 2023, 193, 116244. [Google Scholar] [CrossRef]
  18. Song, S.; Zhou, H.; Xu, L.; Jia, Z.; Hu, G. Cutting mechanical properties of sisal leaves under rotary impact cutting. Ind. Crops Prod. 2022, 182, 114856. [Google Scholar] [CrossRef]
  19. Nare, B.; Tewari, V.K.; Kumar Chandel, A.; Prakash Kumar, S.; Chethan, C.R. A mechatronically integrated autonomous seed material generation system for sugarcane: A crop of industrial significance. Ind. Crops Prod. 2019, 128, 1–12. [Google Scholar] [CrossRef]
  20. Luo, H.; Guo, S.; Zhi, Z.; Kan, J. Sliding cutting and cutting parameters of concentric curvilineal edge sliding cutter for caragana korshinskii (c.k.) Branches. Forests 2023, 14, 2379. [Google Scholar] [CrossRef]
  21. Kang, F.; Tong, S.; Zhang, H.; Li, W.; Chen, Z.; Zheng, Y. Analysis and experiments of reciprocating cutting parameters for apple tree branches. Trans. Chin. Soc. Agric. Eng. 2020, 36, 9–16. [Google Scholar]
  22. Ding, S.; Xue, X.; Cai, C.; Cui, L.; Chen, C. Optimization and experiment of blade parameter for pear branches cutting device. Trans. Chin. Soc. Agric. Eng. 2015, 31, 75–82. [Google Scholar]
  23. Wu, L.; Yang, Z.; Duan, J.; Wang, L.; Wang, W.; Liu, J.; Wang, L. Experiment on influencing factors of cutting force of blades of trim tool for longan branch. Trans. Chin. Soc. Agric. Eng. 2012, 28, 8–14. [Google Scholar]
  24. Li, C.; Zhang, H.; Wang, Q.; Chen, Z. Influencing factors of cutting force for apple tree branch pruning. Agriculture 2022, 12, 312. [Google Scholar] [CrossRef]
  25. Gao, Y.; Wang, Y.; Qu, A.; Kan, J.; Kang, F.; Wang, Y. Study of sawing parameters for caragana korshinskii (c.k.) Branches. Forests 2022, 13, 327. [Google Scholar] [CrossRef]
  26. Hou, J.; Bai, J.; Yao, E.; Zhu, H. Design and parameter optimization of disc type cutting device for castor stem. IEEE Access 2020, 8, 191152–191162. [Google Scholar] [CrossRef]
  27. Karakurt, I. Application of taguchi method for cutting force optimization in rock sawing by circular diamond sawblades. Sadhana 2014, 39, 1055–1070. [Google Scholar] [CrossRef]
  28. Wang, Y.; Yang, Y.; Zhao, H.; Liu, B.; Ma, J.; He, Y.; Zhang, Y.; Xu, H. Effects of cutting parameters on cutting of citrus fruit stems. Biosyst. Eng. 2020, 193, 1–11. [Google Scholar] [CrossRef]
  29. Nasir, V.; Cool, J. Cutting power and surface quality in sawing kiln-dried, green, and frozen hem-fir wood. Wood Sci. Technol. 2021, 55, 505–519. [Google Scholar] [CrossRef]
  30. Huang, J.; Shen, C.; Ji, A.; Tian, K.; Zhang, B.; Li, X.; Chen, Q. Design and test of two-wheeled walking hemp harvester. Int. J. Agric. Biol. Eng. 2020, 13, 127–137. [Google Scholar] [CrossRef]
  31. Zhong, J.; Tao, L.; Li, S.; Ma, F.; Chen, Y. Design and evaluation of a novel transversal double-bud sugarcane planter with seed pre-cutting. Sugar Tech Int. J. Sugar Crops Relat. Ind. 2021, 23, 1147–1156. [Google Scholar] [CrossRef]
  32. Ma, Y.; Xu, C.; Cui, Y.; Fu, L.; Liu, H.; Yang, C. Design and test of harvester for whole hydroponic lettuce with low damage. Trans. Chin. Soc. Agric. Mach. 2019, 50, 162–169. [Google Scholar]
  33. Nasir, V.; Mohammadpanah, A.; Cool, J. The effect of rotation speed on the power consumption and cutting accuracy of guided circular saw: Experimental measurement and analysis of saw critical and flutter speeds. Wood Mater. Sci. Eng. 2020, 15, 140–146. [Google Scholar] [CrossRef]
  34. Han, Y.; Xiao, H.; Song, Z.; Chen, Q.; Ding, W.; Mei, S. Design and experiments of 4cj-1200 self-propelled tea plucking machine. Int. J. Agric. Biol. Eng. 2021, 14, 75–84. [Google Scholar] [CrossRef]
Figure 1. Test material sampling locations and samples.
Agriculture 14 00953 g001
Figure 2. Sawing force diagram of the circular blade.
Agriculture 14 00953 g002
Figure 3. Schematic diagram of the sugarcane stalk sawing experiment rig (1. the sawing system; 2. the transmission system; 3. sugarcane stalk).
Agriculture 14 00953 g003
Figure 4. Physical picture of the test platform (1. experiment rig body; 2. travel controller; 3. digital transmitter; 4. voltage governor; 5. dynamic torque sensor; 6. servo motor governor; 7. frequency converter; 8. upper computer).
Agriculture 14 00953 g004
Figure 5. Sugarcane stalk cutting systems (1. circular saw; 2. servo motor; 3. actuator motor; 4. Coupling; 5. miniature guide rail; 6. pull pressure sensor; 7. dynamic torque sensor).
Agriculture 14 00953 g005
Figure 6. Sugarcane stalk transmission systems (1. gantry type pressing mechanism; 2. support plate; 3. speed-regulating motor; 4. belt drive mechanism; 5. pulley; 6. frame).
Agriculture 14 00953 g006
Figure 7. Sugarcane stalk data acquisition systems.
Agriculture 14 00953 g007
Figure 8. Methods and tools for scoring the quality of seed stem sections. (a) Schematic diagram of quality scoring method for sugarcane stalk saw sections; (b) 1 mm × 1 mm film grid paper.
Agriculture 14 00953 g008
Figure 9. Sugarcane stalk cutting site plan.
Agriculture 14 00953 g009
Figure 10. Sawing effect with different feeding speeds (Note: Sawing speed 8 m/s; stalk diameter 30 mm).
Agriculture 14 00953 g010
Figure 11. Sawing effect with different sawing speeds (Note: Feeding speed 0.10 m/s; stalk diameter 30 mm).
Agriculture 14 00953 g011
Figure 12. Sawing effect with different stalk diameters (Note: Feeding speed 0.10 m/s; sawing speed 12 m/s).
Agriculture 14 00953 g012
Figure 13. Peak cutting force residual analysis.
Agriculture 14 00953 g013
Figure 14. Sawing surface quality residual analysis.
Agriculture 14 00953 g014
Figure 15. The 3D response surface diagram of peak sawing force under the interaction of (a) feeding speed and sawing speed, (b) feeding speed and stalk diameter, and (c) sawing speed and stalk diameter.
Agriculture 14 00953 g015
Figure 16. The 3D response surface diagram of sawing surface quality under the interaction of (a) feeding speed and sawing speed, (b) feeding speed and stalk diameter, and (c) sawing speed and stalk diameter.
Agriculture 14 00953 g016
Table 1. Technical parameters of the sugarcane stalk sawing experiment rig.
Technical SpecificationsPerformance Indicators
Sawing speed0–23.56 m/s
Feeding speed0–0.18 m/s
Torque sensor range0–50 N·m
Tension sensor range0–50 kg
Table 2. Single-factor test factors and levels.
LevelVf (m/s)Vc (m/s)D (mm)
10.04625.0
20.06827.5
30.081030.0
40.101232.5
50.121435.0
60.1416
70.1618
Table 3. Multi-factor test factors and levels.
LevelVf (m/s)Vc (m/s)D (mm)
−10.10825
00.121030
10.141235
Table 4. Experimental program and results.
LevelVf (m/s)Vc (m/s)D (mm)F (N)A (%)
10.1083029.4981.37
20.12103032.2987.36
30.14123032.1185.21
40.14102531.7678.71
50.10103533.2188.36
60.1282531.2577.68
70.14103536.4084.39
80.10102526.3283.42
90.12103032.8087.22
100.12123534.1192.88
110.12103034.1585.44
120.10123026.2185.15
130.1483036.2474.25
140.1283536.1176.76
150.12103032.4287.62
160.12122524.3082.31
170.12103033.2488.68
Table 5. Analysis of variance for peak sawing force.
Variance SourceSum of SquaresDegree of FreedomMean SquareF Valuesp-Values
Model193.26921.4725.880.0001
Vf56.60156.6068.23<0.0001
Vc33.46133.4640.330.0004
D85.81185.81103.42<0.0001
Vf·Vc0.1810.180.220.6550
Vf·D1.2711.271.530.2566
Vc·D6.1316.137.380.0299
V f 2 2.3312.332.810.1377
V c 2 6.3116.317.600.0282
D20.4110.410.500.5025
Residual5.8170.83
Lack of Fit3.5531.182.100.2436
Pure Error2.2640.56
Cor Total199.0716
Table 6. Analysis of variance for sawing surface quality.
Variance SourceSum of SquaresDegree of FreedomMean SquareF Valuesp-Values
Model370.25941.1423.180.0002
Vf30.97130.9717.450.0042
Vc166.441166.4493.76<0.0001
D46.42146.4226.150.0014
Vf·Vc12.89112.897.260.0309
Vf·D0.1410.140.0770.7893
Vc·D27.51127.5115.500.0056
V f 2 23.32123.3213.140.0085
V c 2 49.13149.1327.680.0012
D25.9715.973.360.1093
Residual12.4371.78
Lack of Fit6.9632.321.700.3046
Pure Error5.4741.37
Cor Total382.6716
Table 7. Model validation results.
D
(mm)
Vf
(m/s)
Vc
(m/s)
F Predicted Value (N)F Test Value (N)F Error (%)A Predicted Value (%)A Test Value (%)A Error (%)
250.1042410.9421.0322.767.6%82.9585.9253.5%
300.1032611.5524.6322.957.3%87.6489.3601.9%
350.1002012.0028.2930.216.4%90.0892.9153.1%
Disclaimer/Publisher’s Note: The statements, opinions and data contained in all publications are solely those of the individual author(s) and contributor(s) and not of MDPI and/or the editor(s). MDPI and/or the editor(s) disclaim responsibility for any injury to people or property resulting from any ideas, methods, instructions or products referred to in the content.

