
Integrated Transcriptome and GWAS Analysis to Identify Candidate Genes for Ustilago maydis Resistance in Maize


 ,
, 
Abstract
1. Introduction
2. Materials and Methods
2.1. Maize Materials and Test Strains
2.2. Corn Planting and Inoculation with Ustilago maydis SG200
2.3. RNA Extraction and Real-Time Fluorescence Quantitative qPCR Assay
2.4. Transcriptome Sequencing
2.5. Identification and Functional Annotation of Differentially Expressed Genes
2.6. Phenotypic Characterization and Phenotypic Data Processing of Maize Self-Inoculation with Ustilago maydis
2.6.1. Seedling Disease Grading Criteria
2.6.2. Seedling-Resistance Evaluation Criteria
2.7. Genotyping and Analysis
2.7.1. Genotype Analysis
2.7.2. Population-Structure Analysis
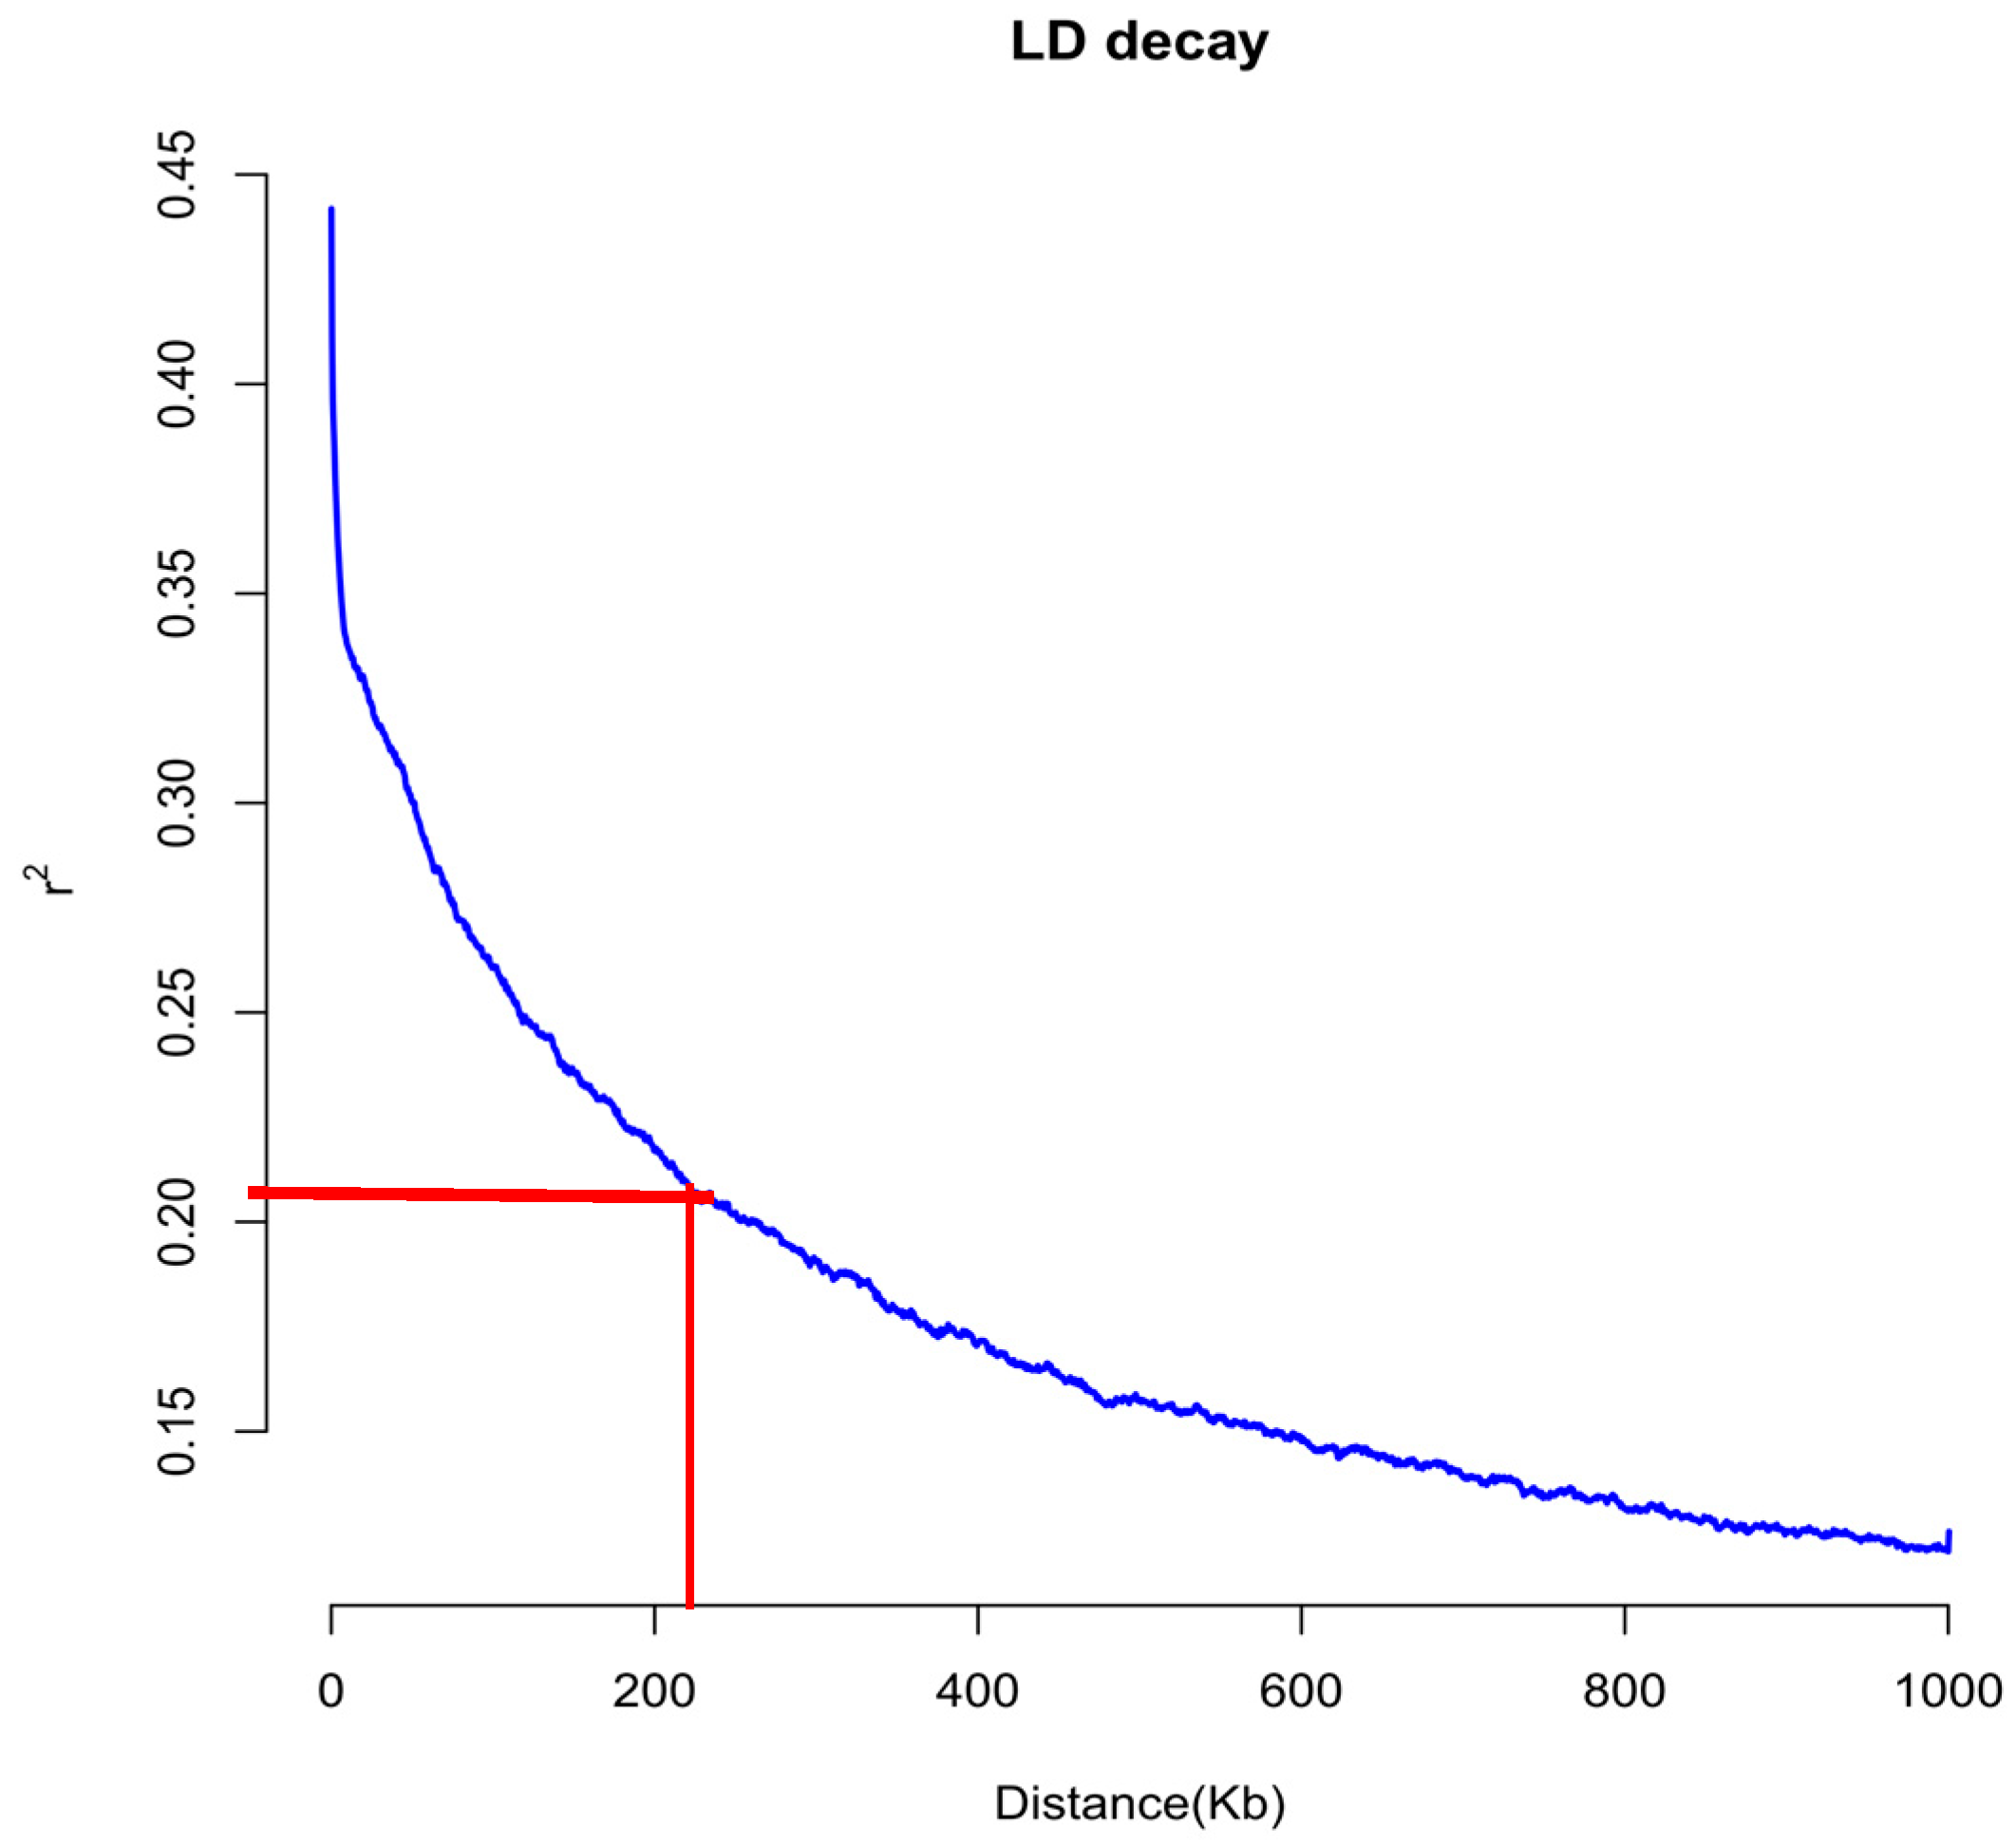
2.8. Linkage-Disequilibrium Analysis
2.9. Genome-Wide Association Analysis
2.10. Candidate Gene Identification and Functional Annotation
3. Results
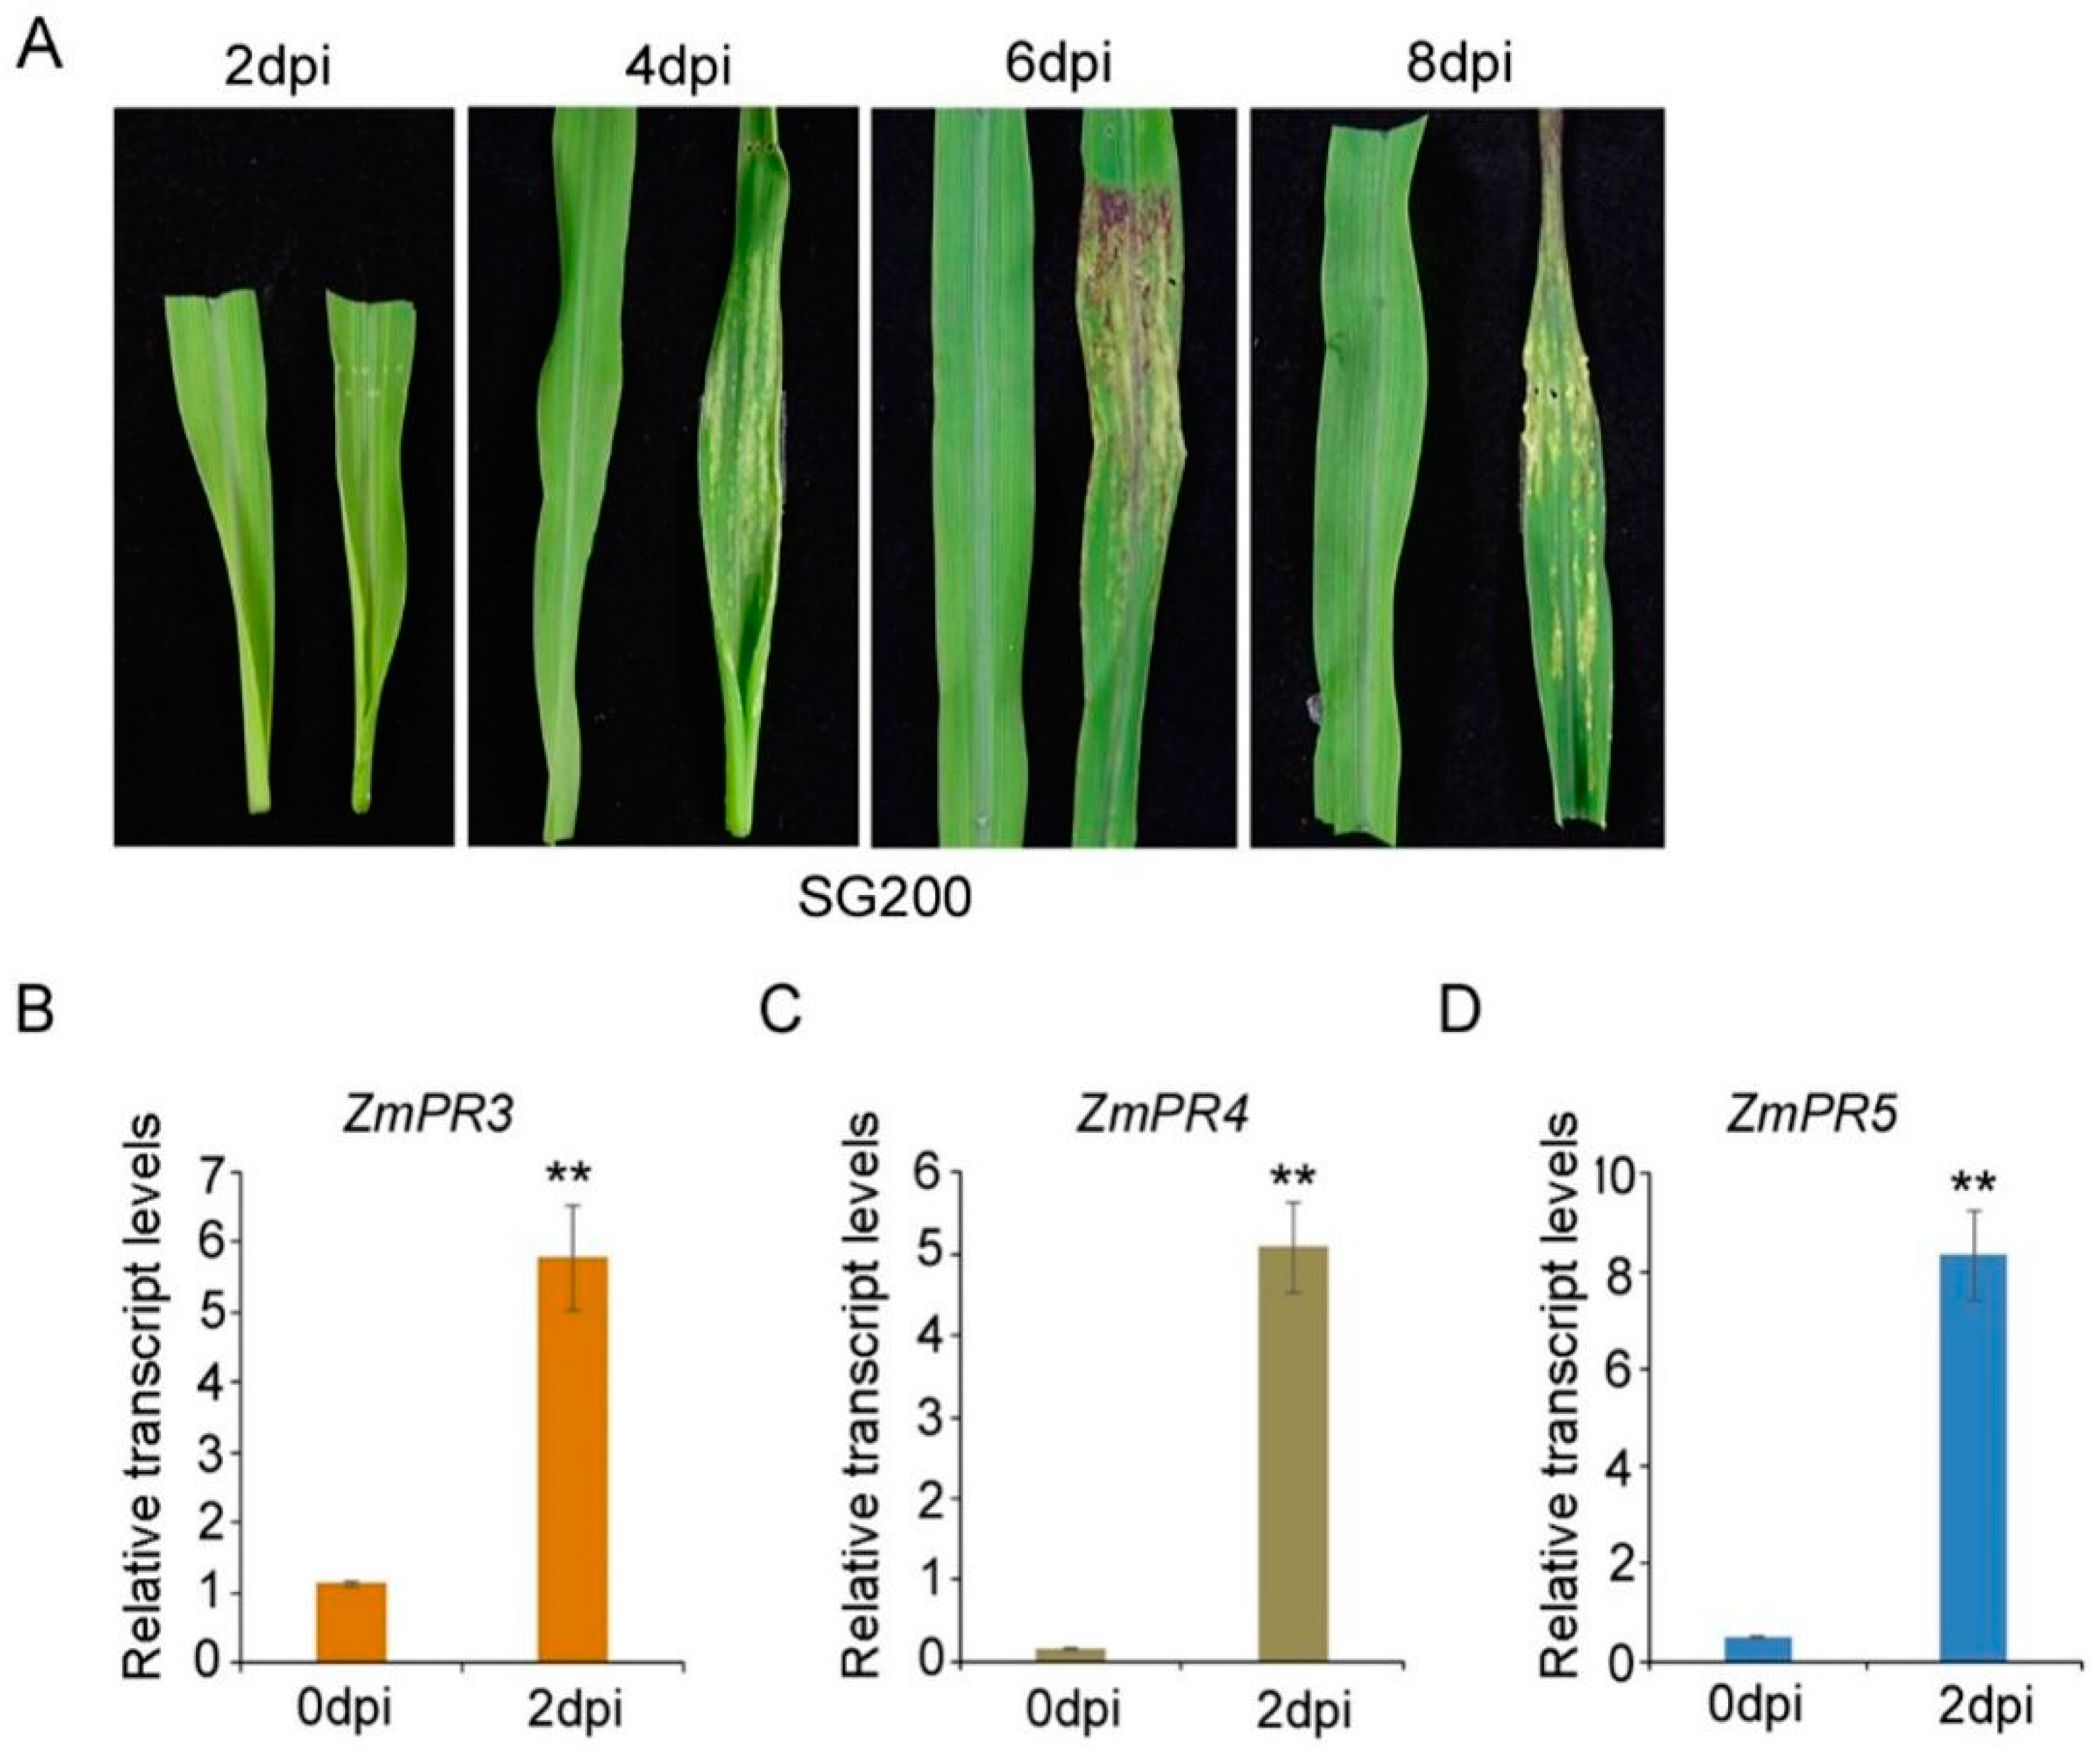
3.1. Pathogenesis of Maize B73 Inbred Line Inoculated with Ustilago maydis SG200 and Detection of Induced ZmPRs
3.2. Expression Analysis of SG200-Induced Early Differential Genes in RNA-seq Screening Maize B73 Inbred Line
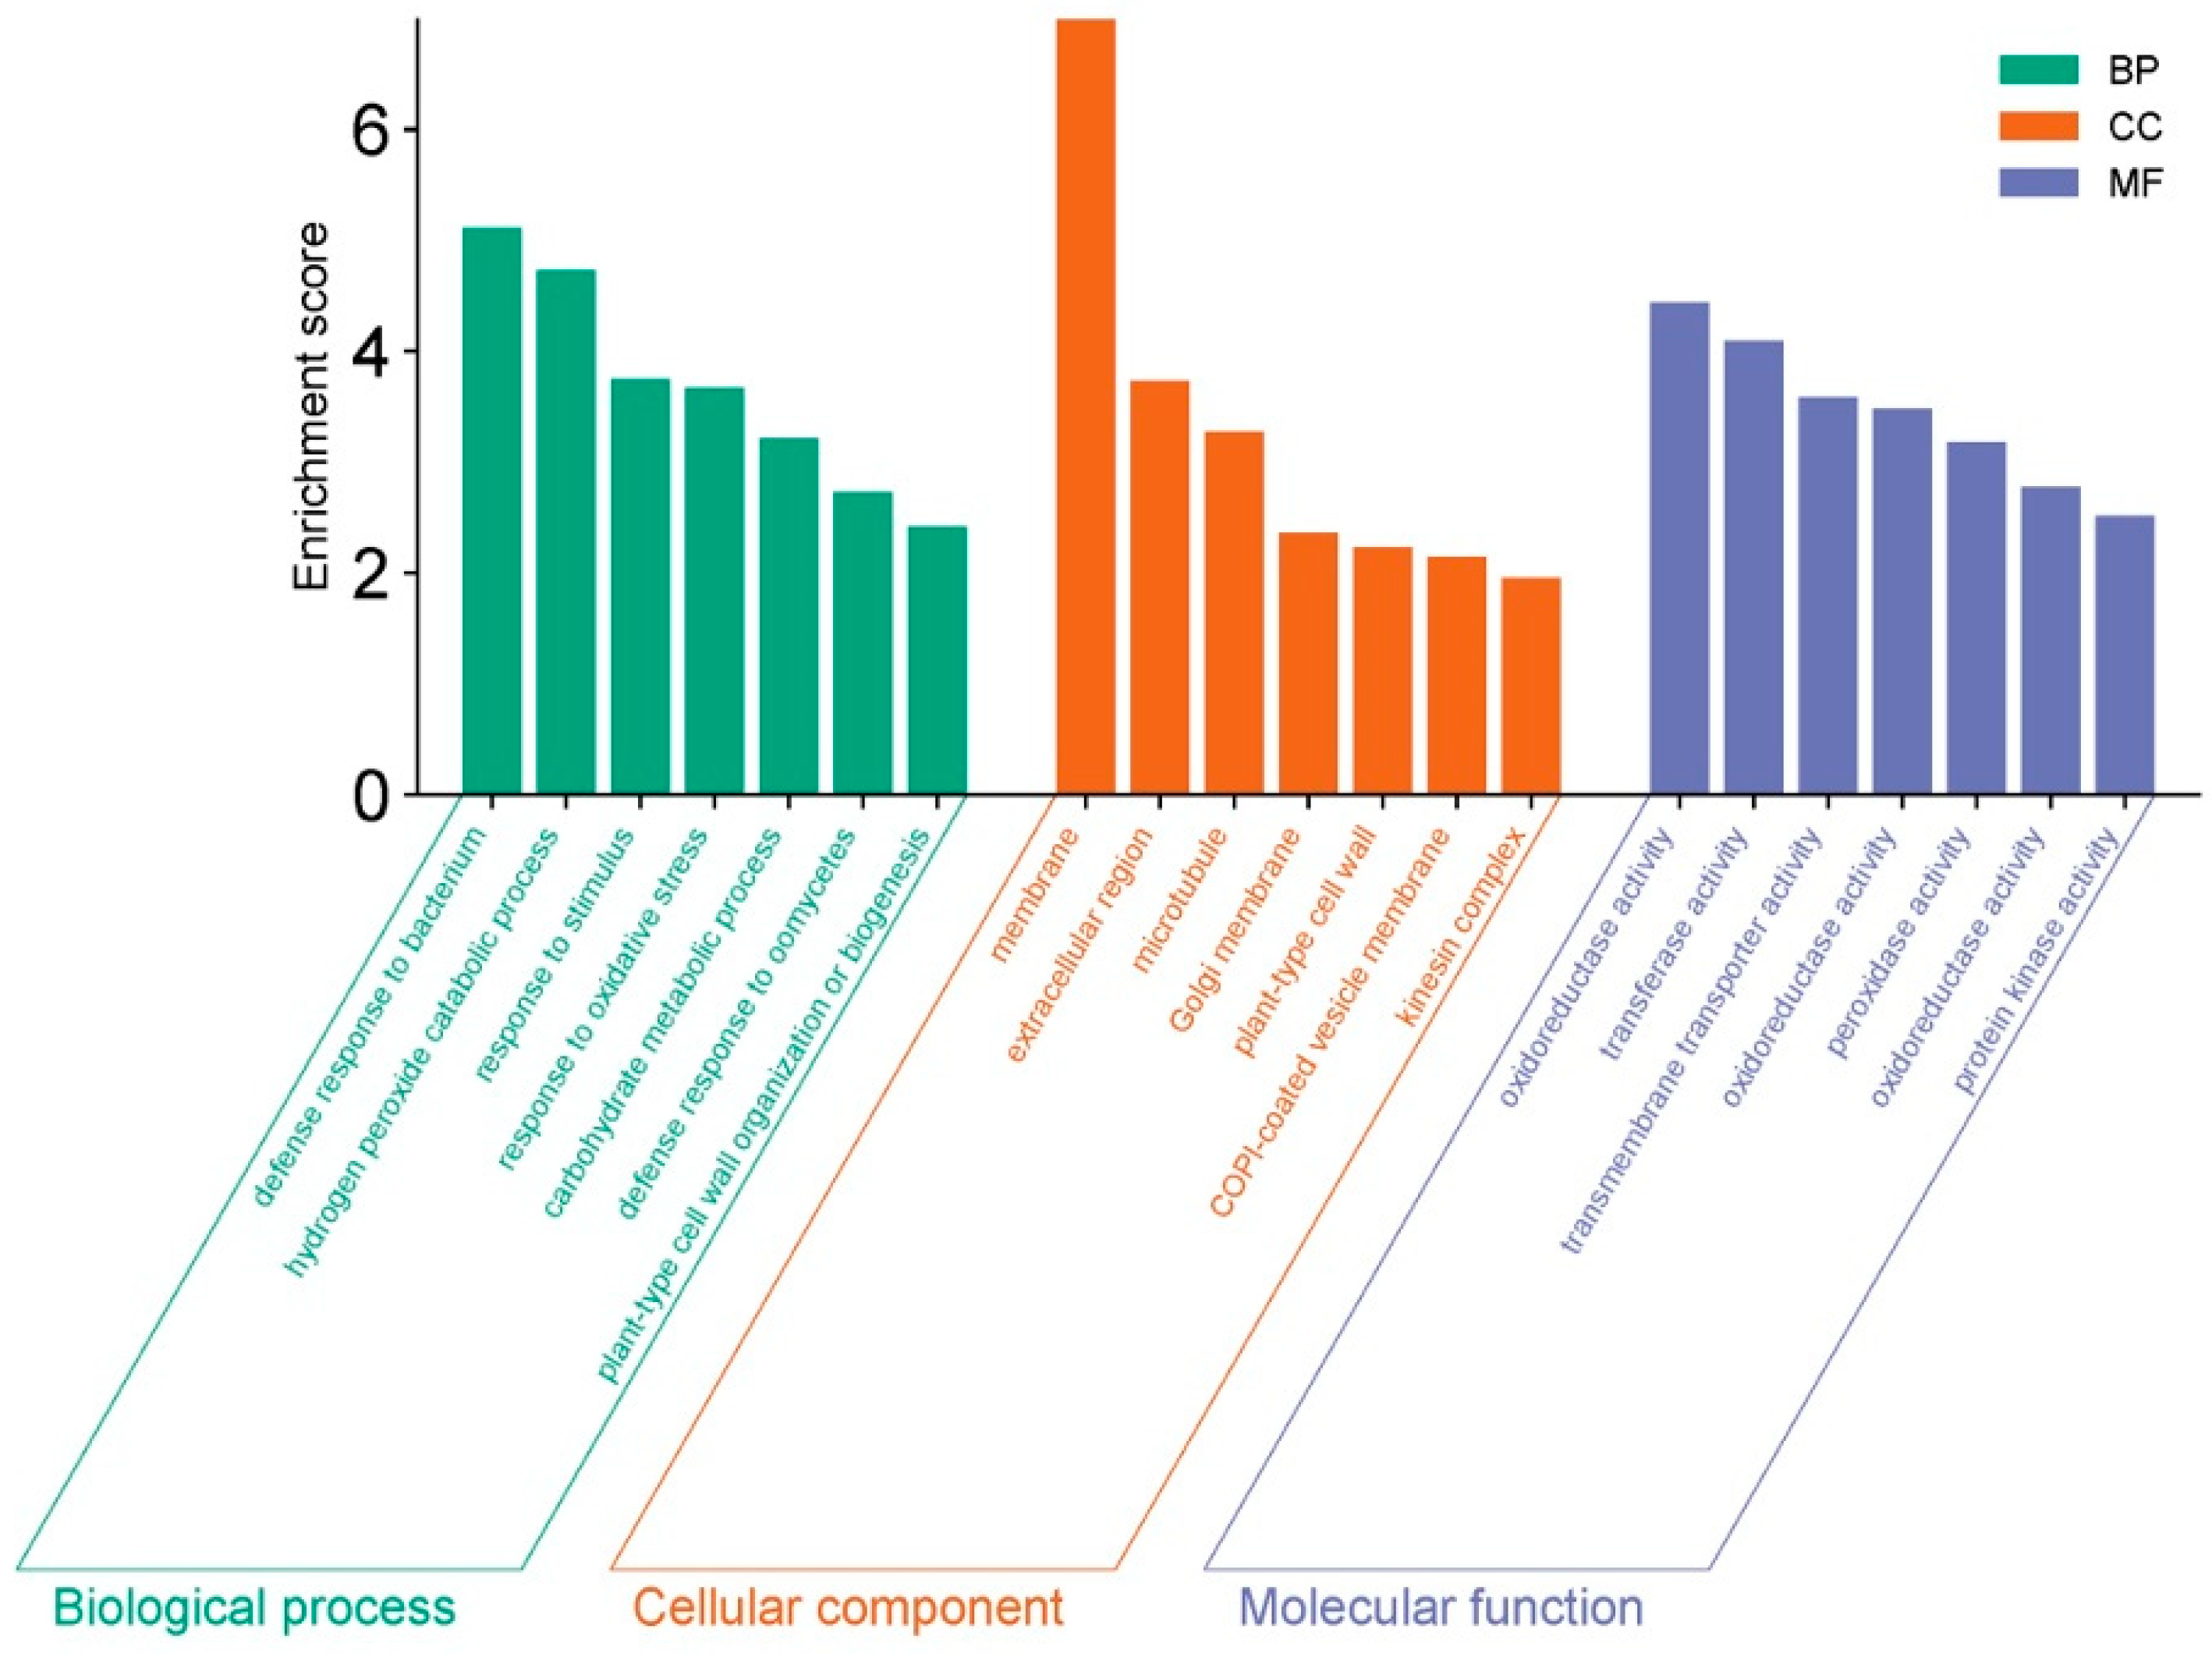
3.3. GO and KEGG Functional Enrichment Analysis of DEGs
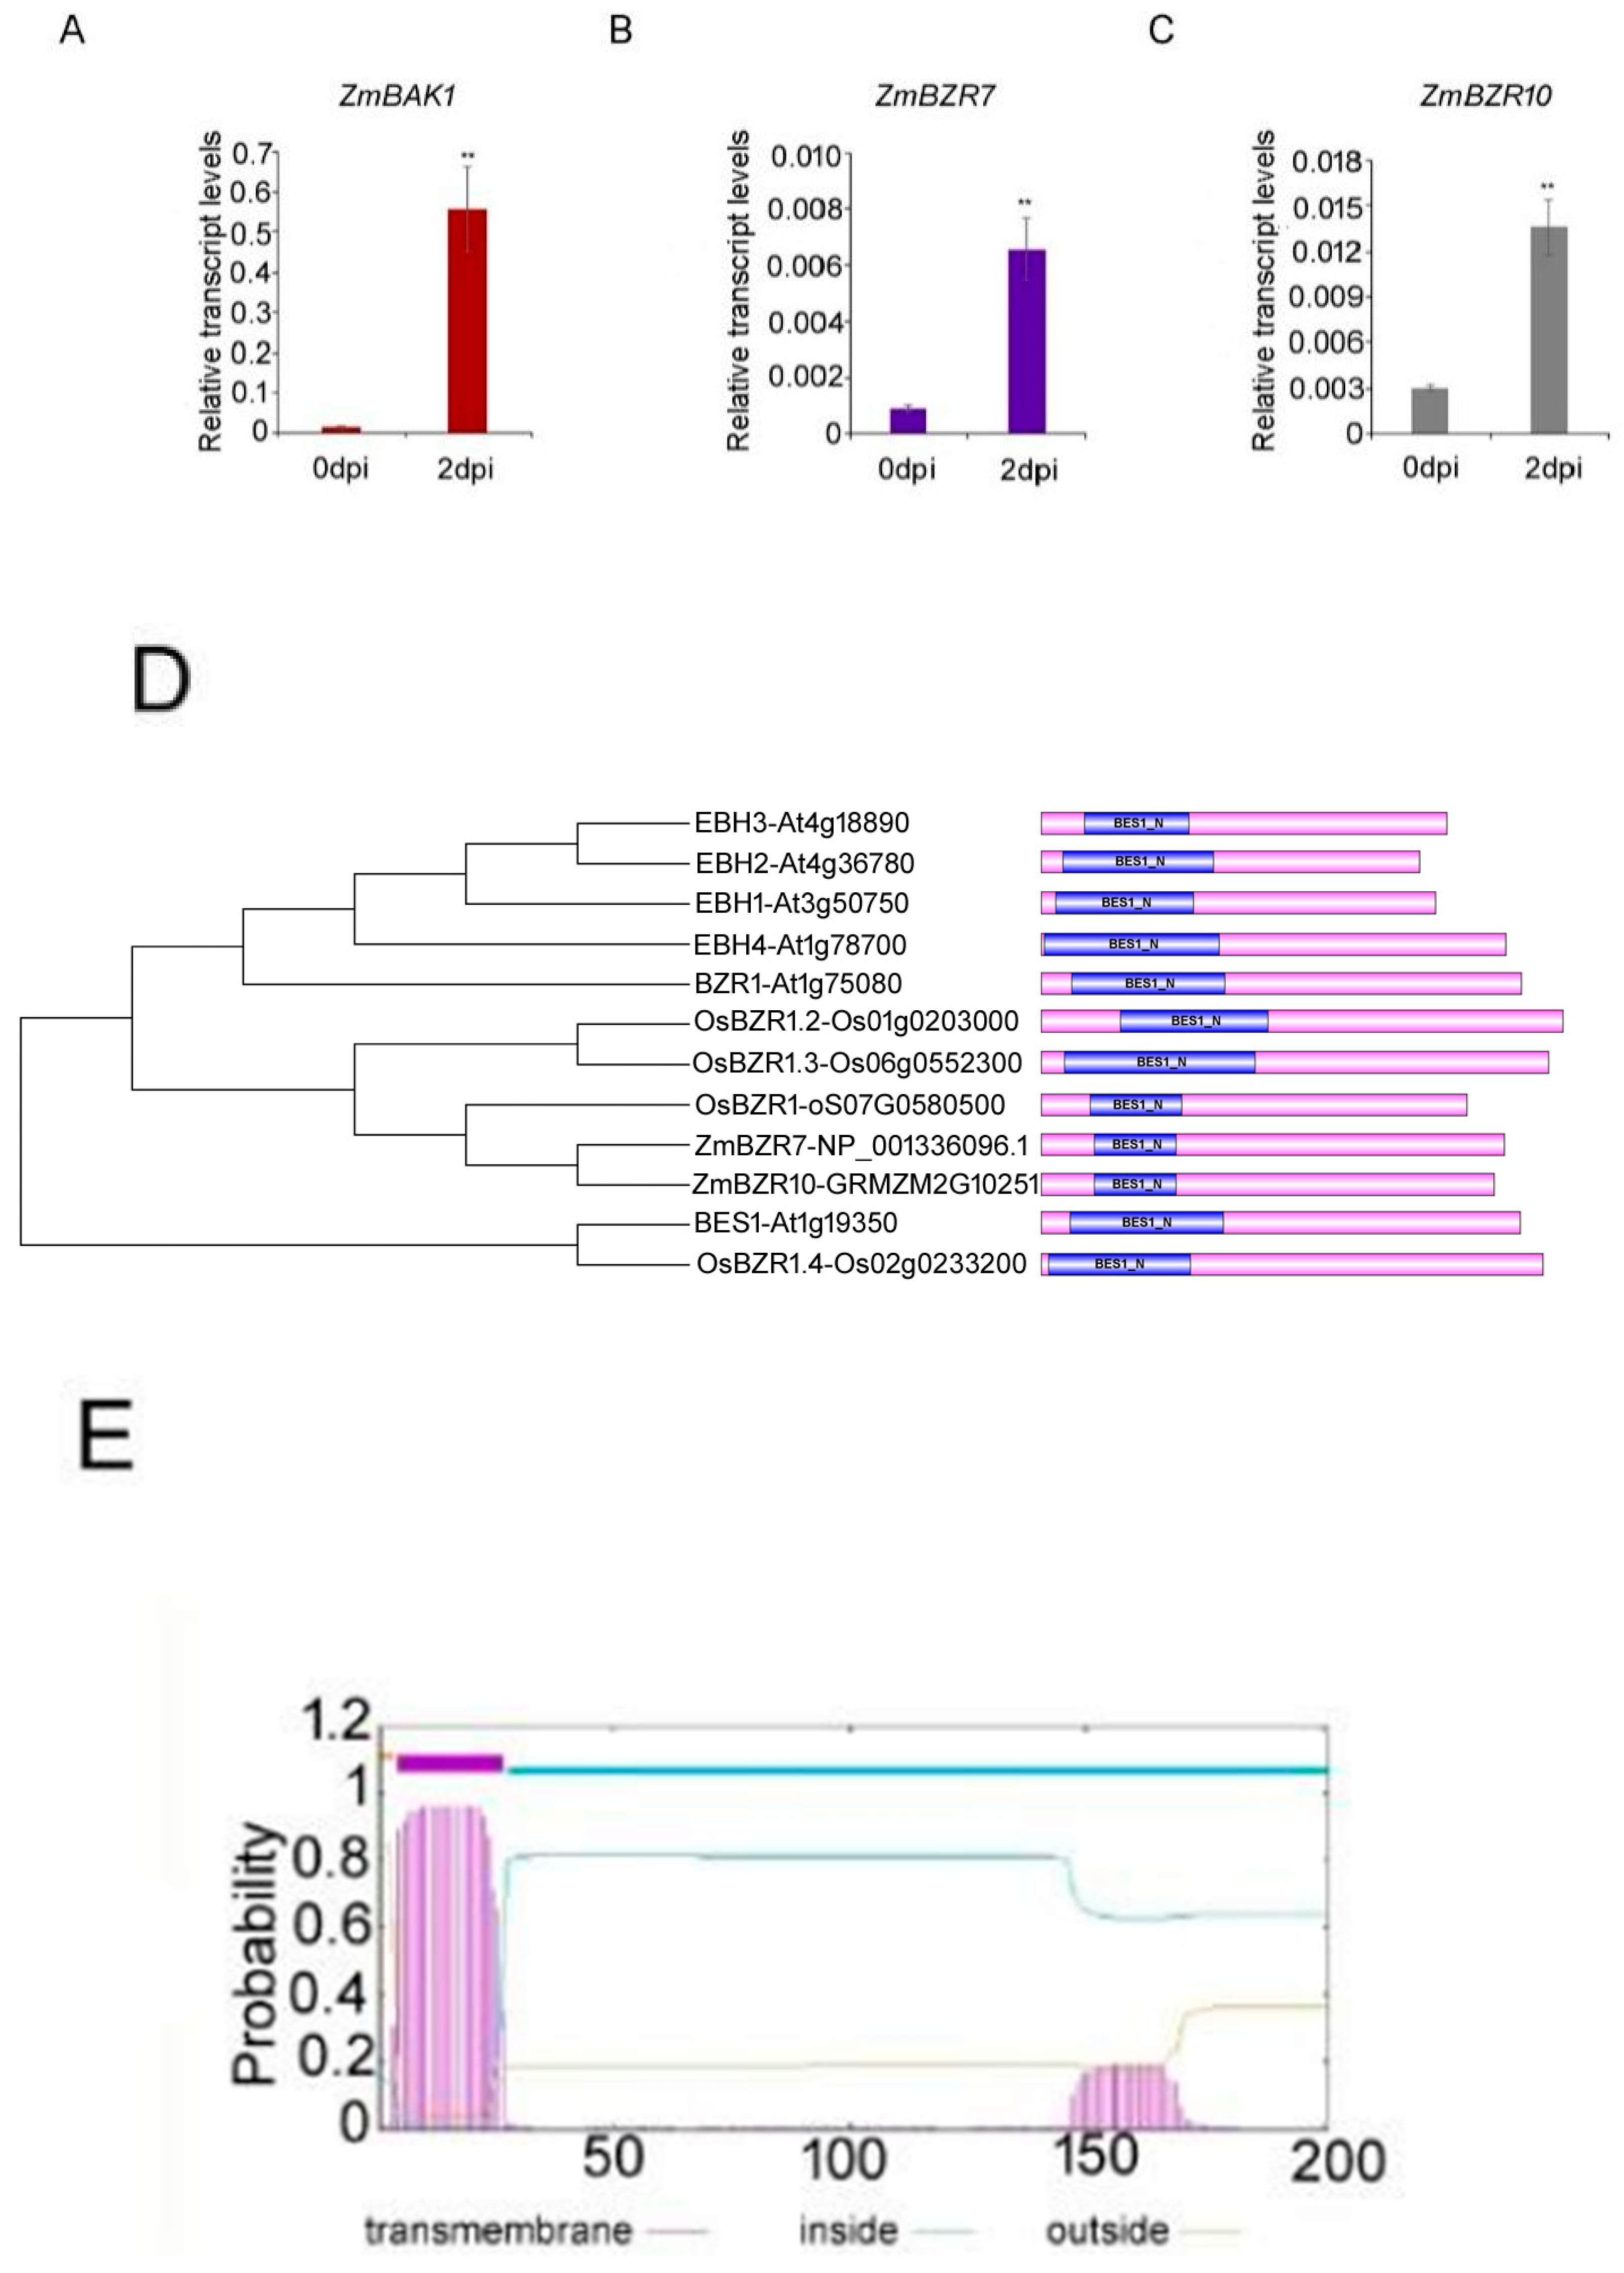
3.4. A Large Number of Receptor Kinases and Signal-Transduction Proteins Are Markedly Induced
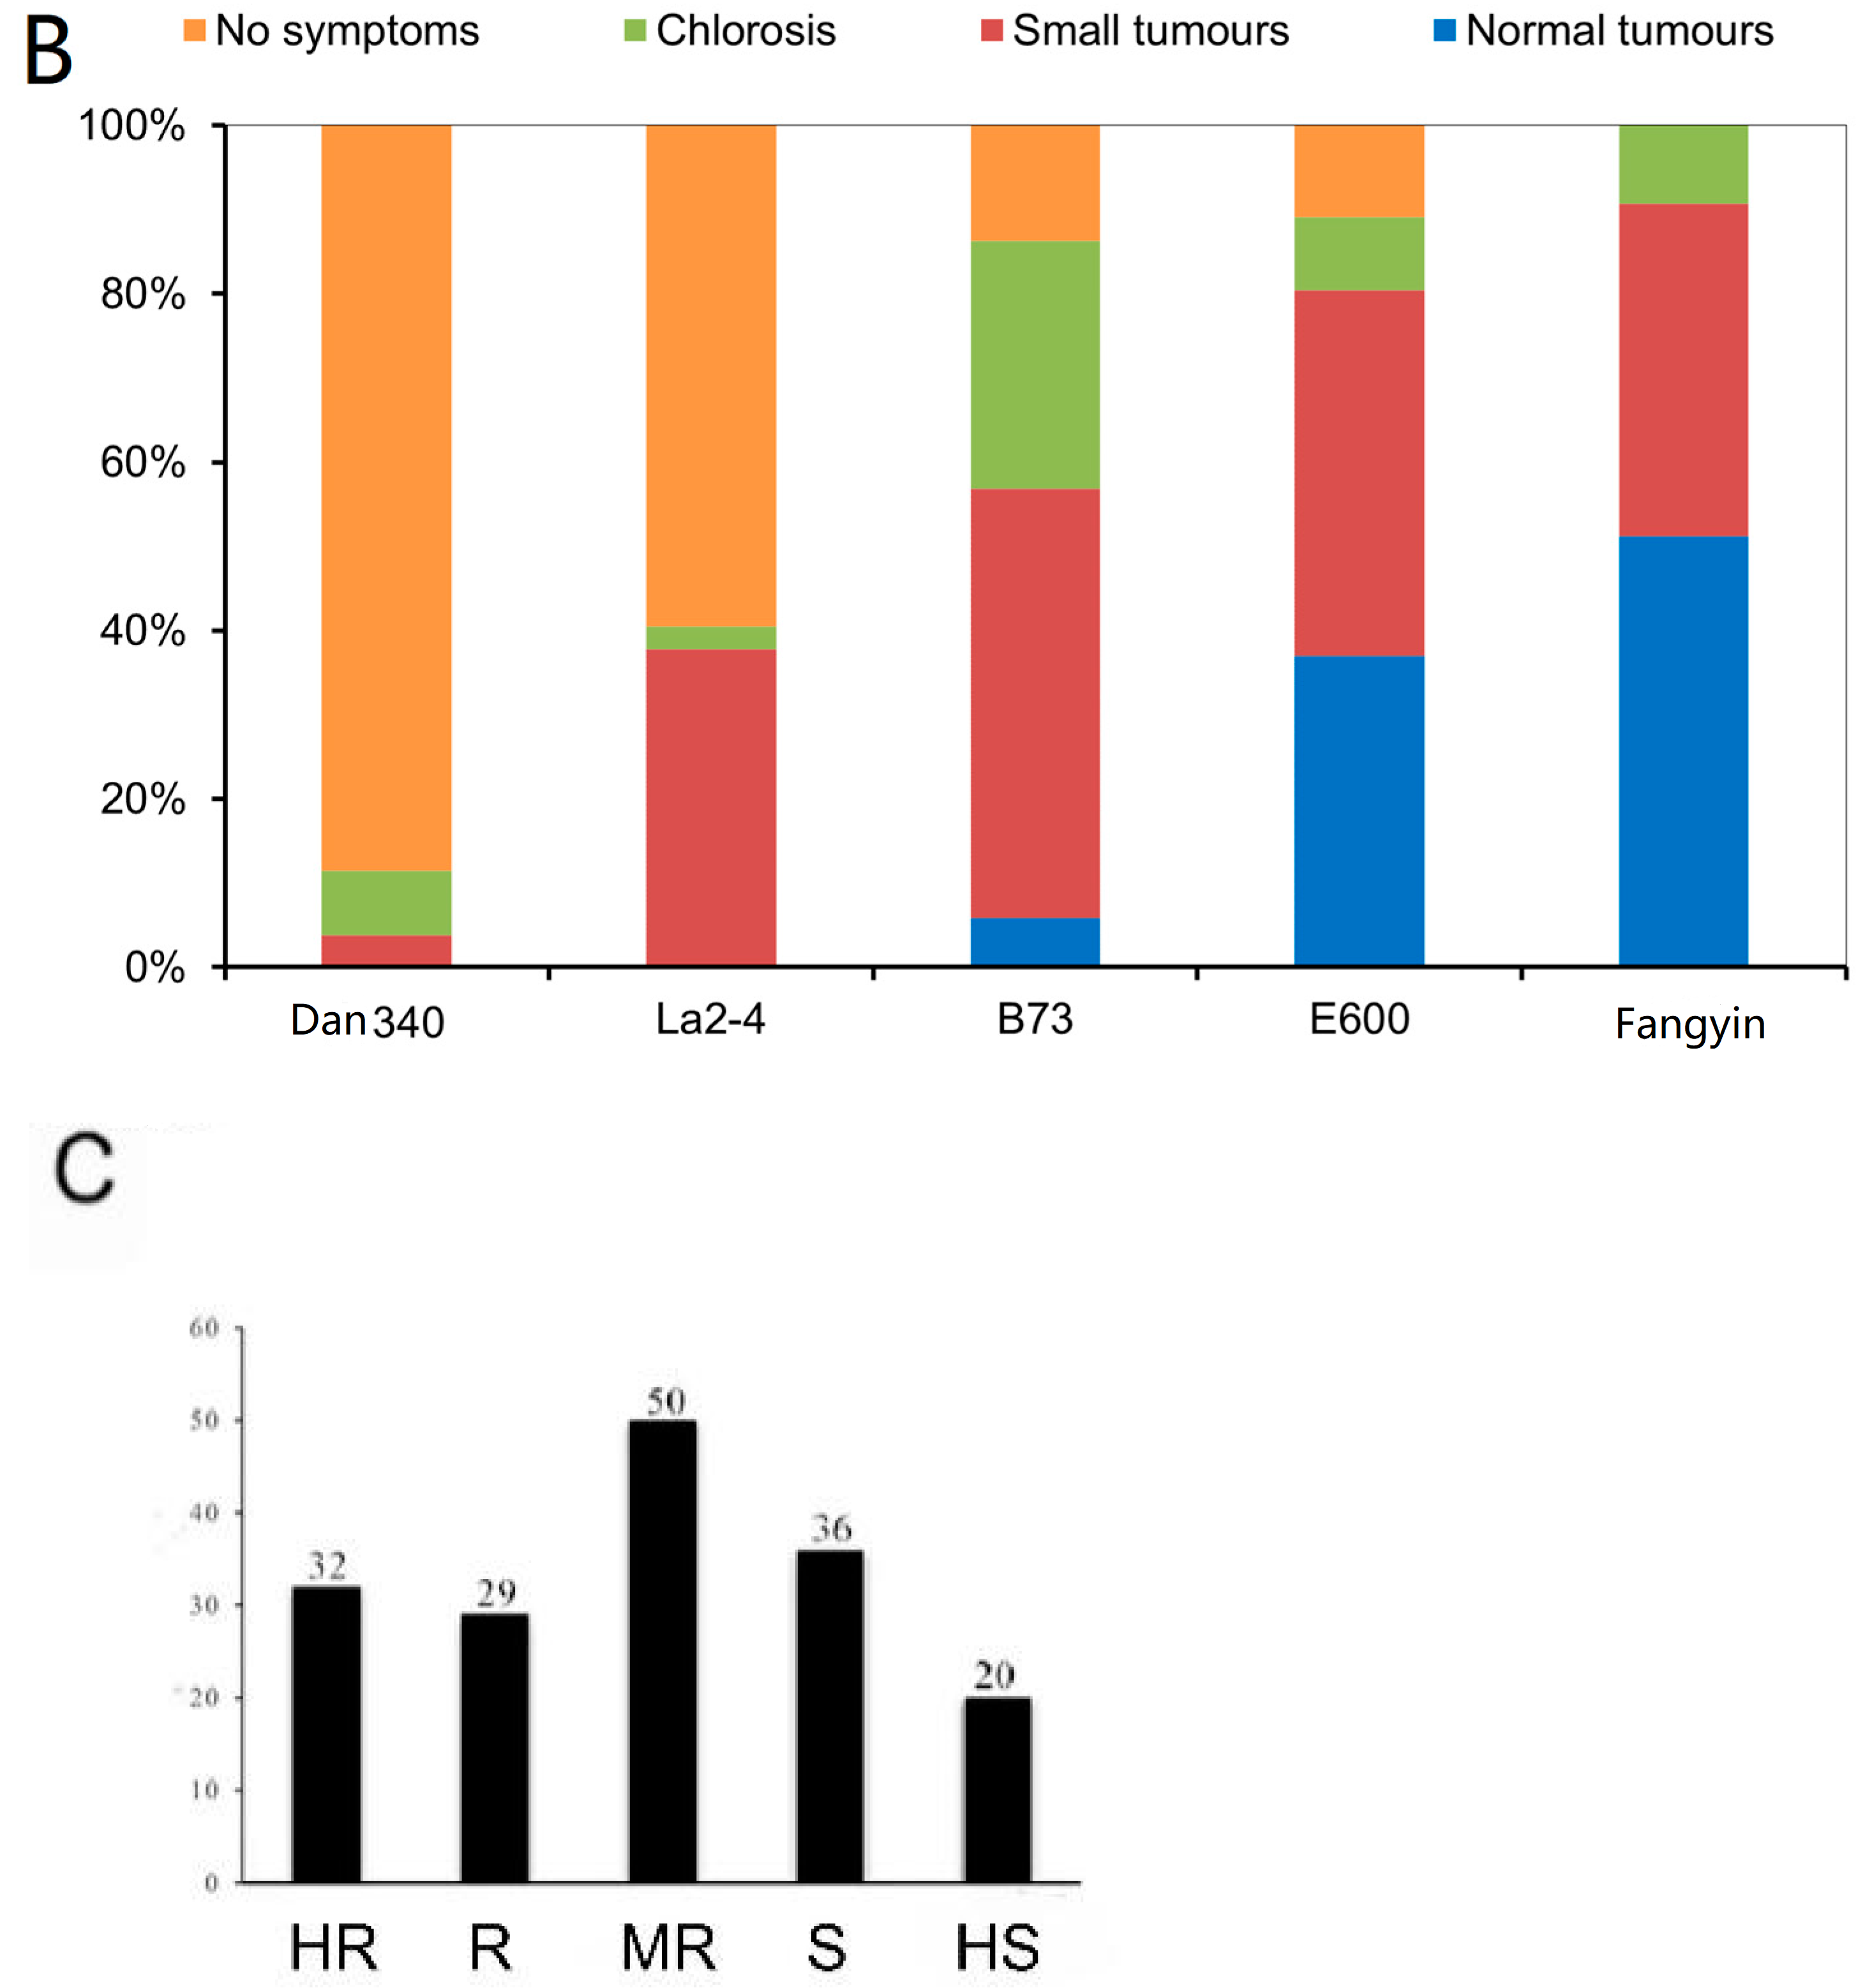
3.5. Selecting of Maize Seedling Disease-Resistance-Related Genes by GWAS Analysis
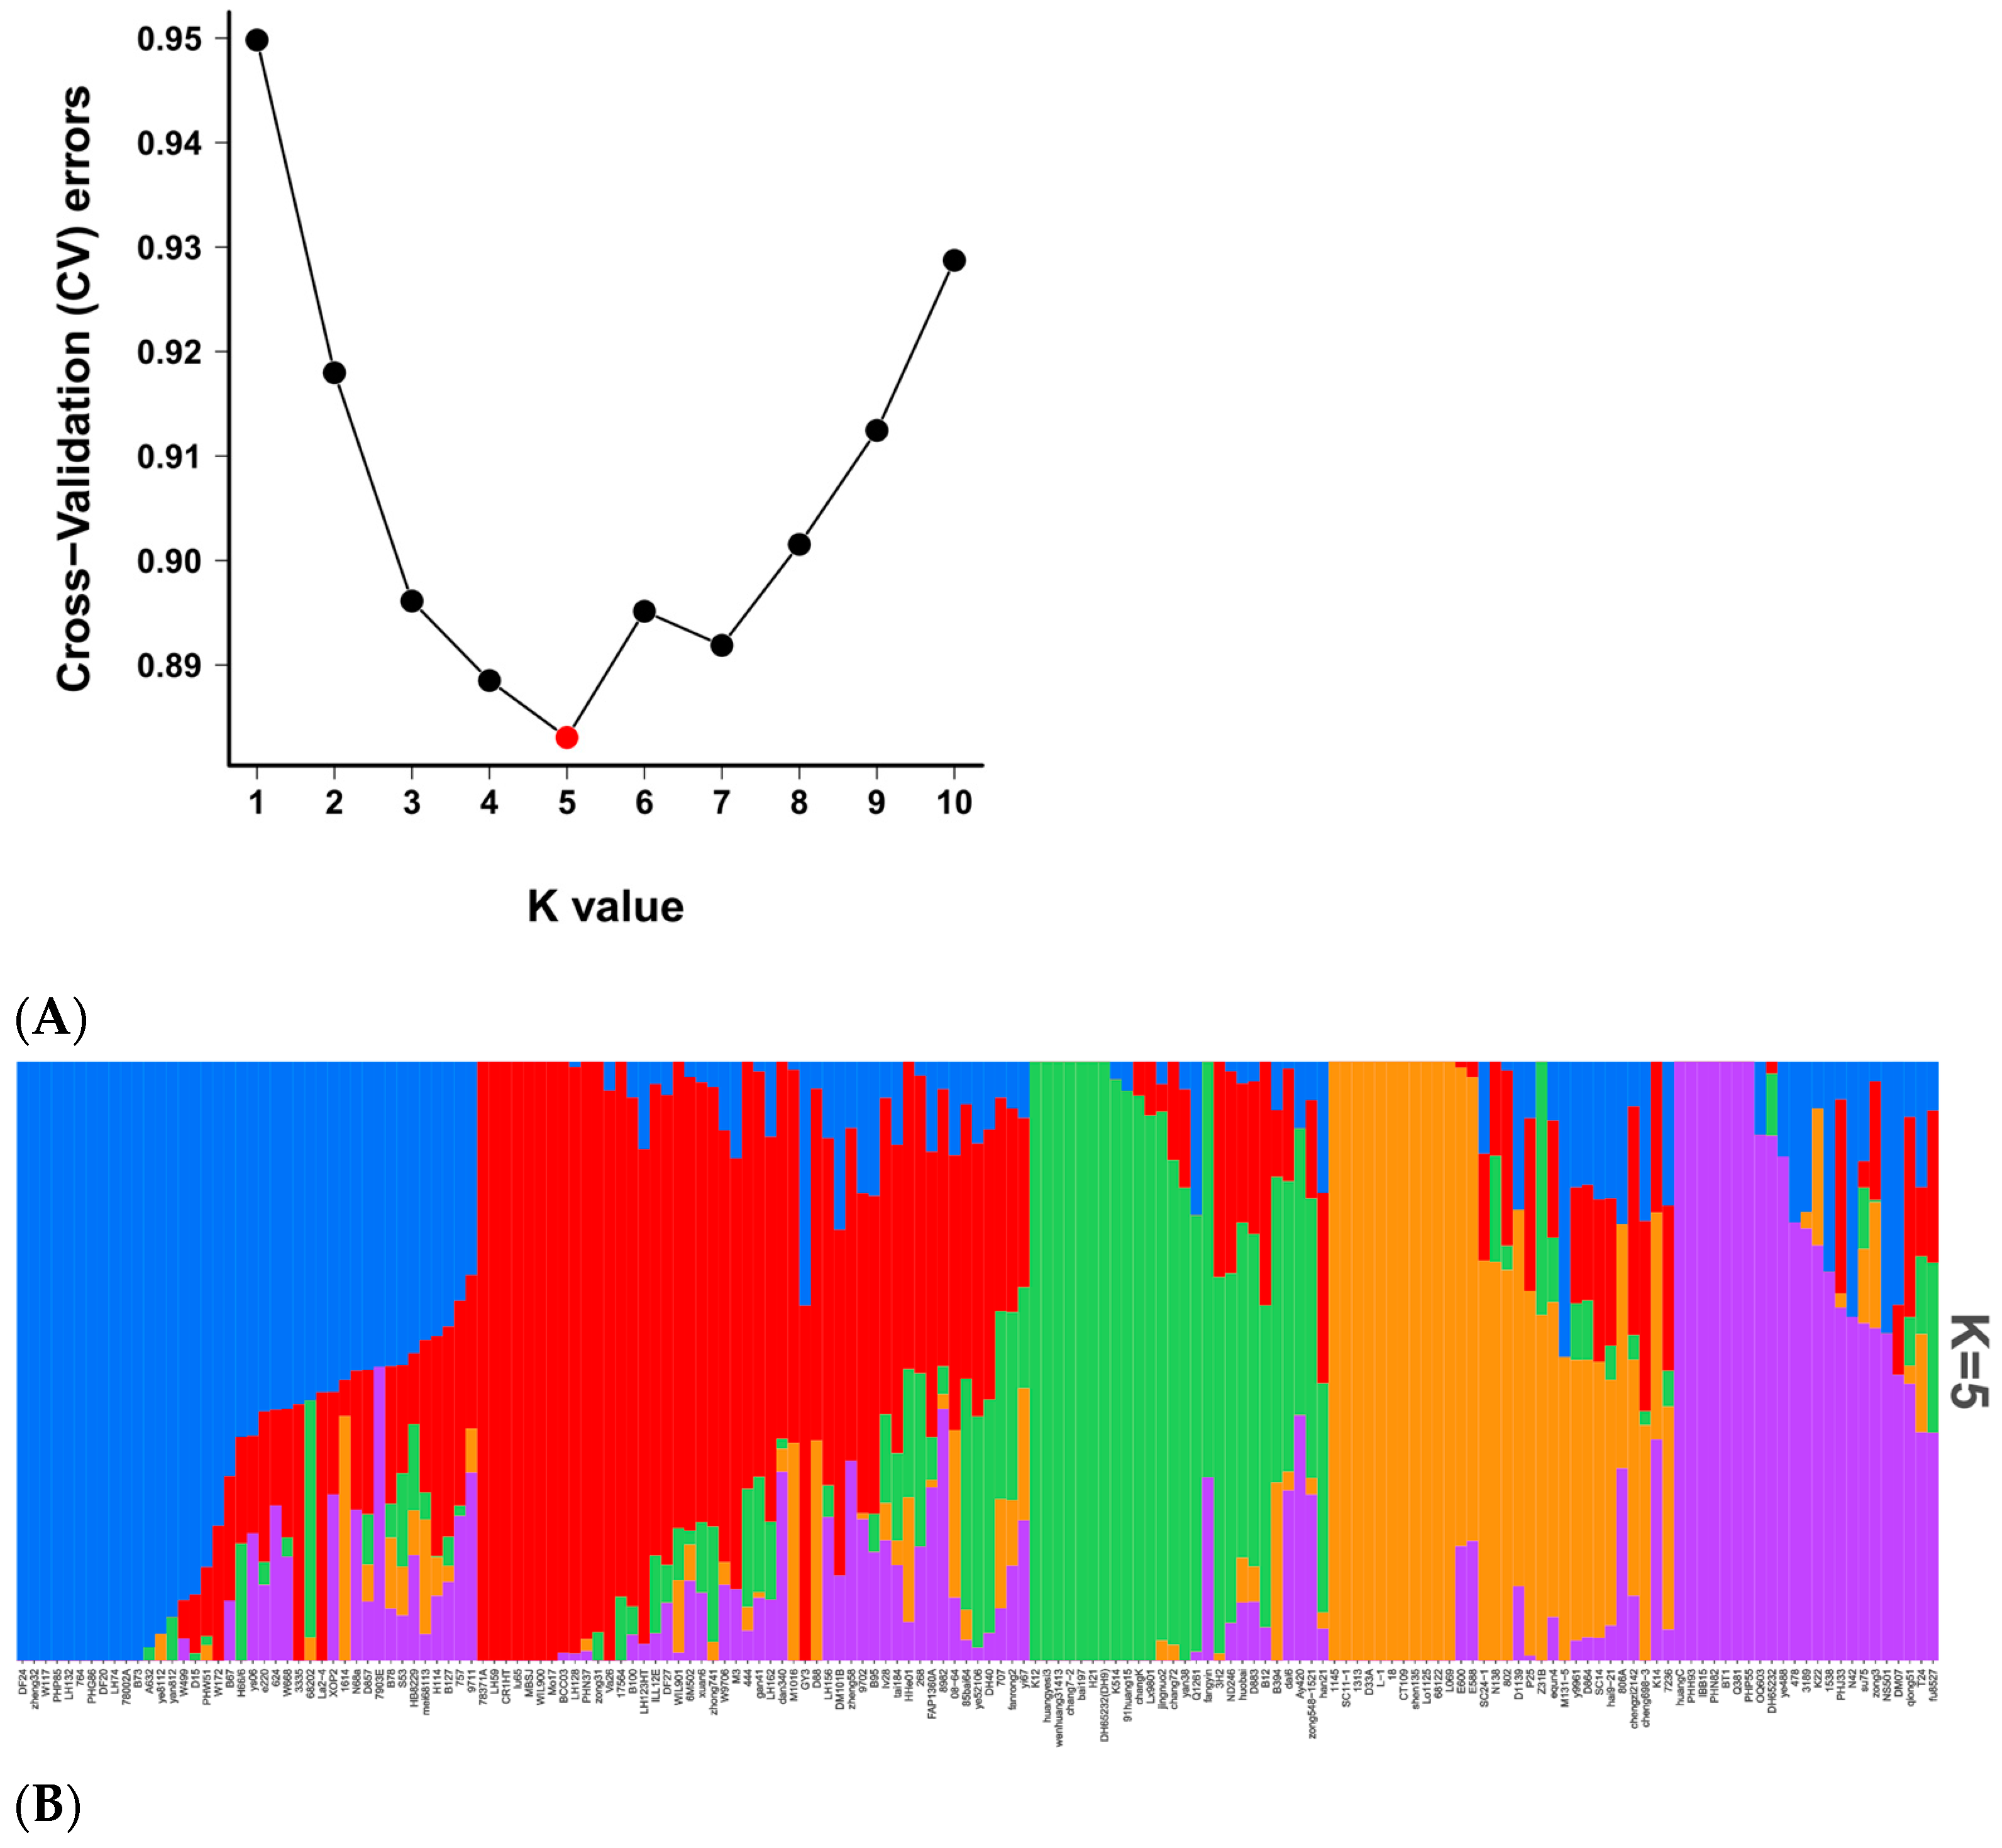
3.6. Population Structure and LD Analysis of 167 Natural Population Maize Materials
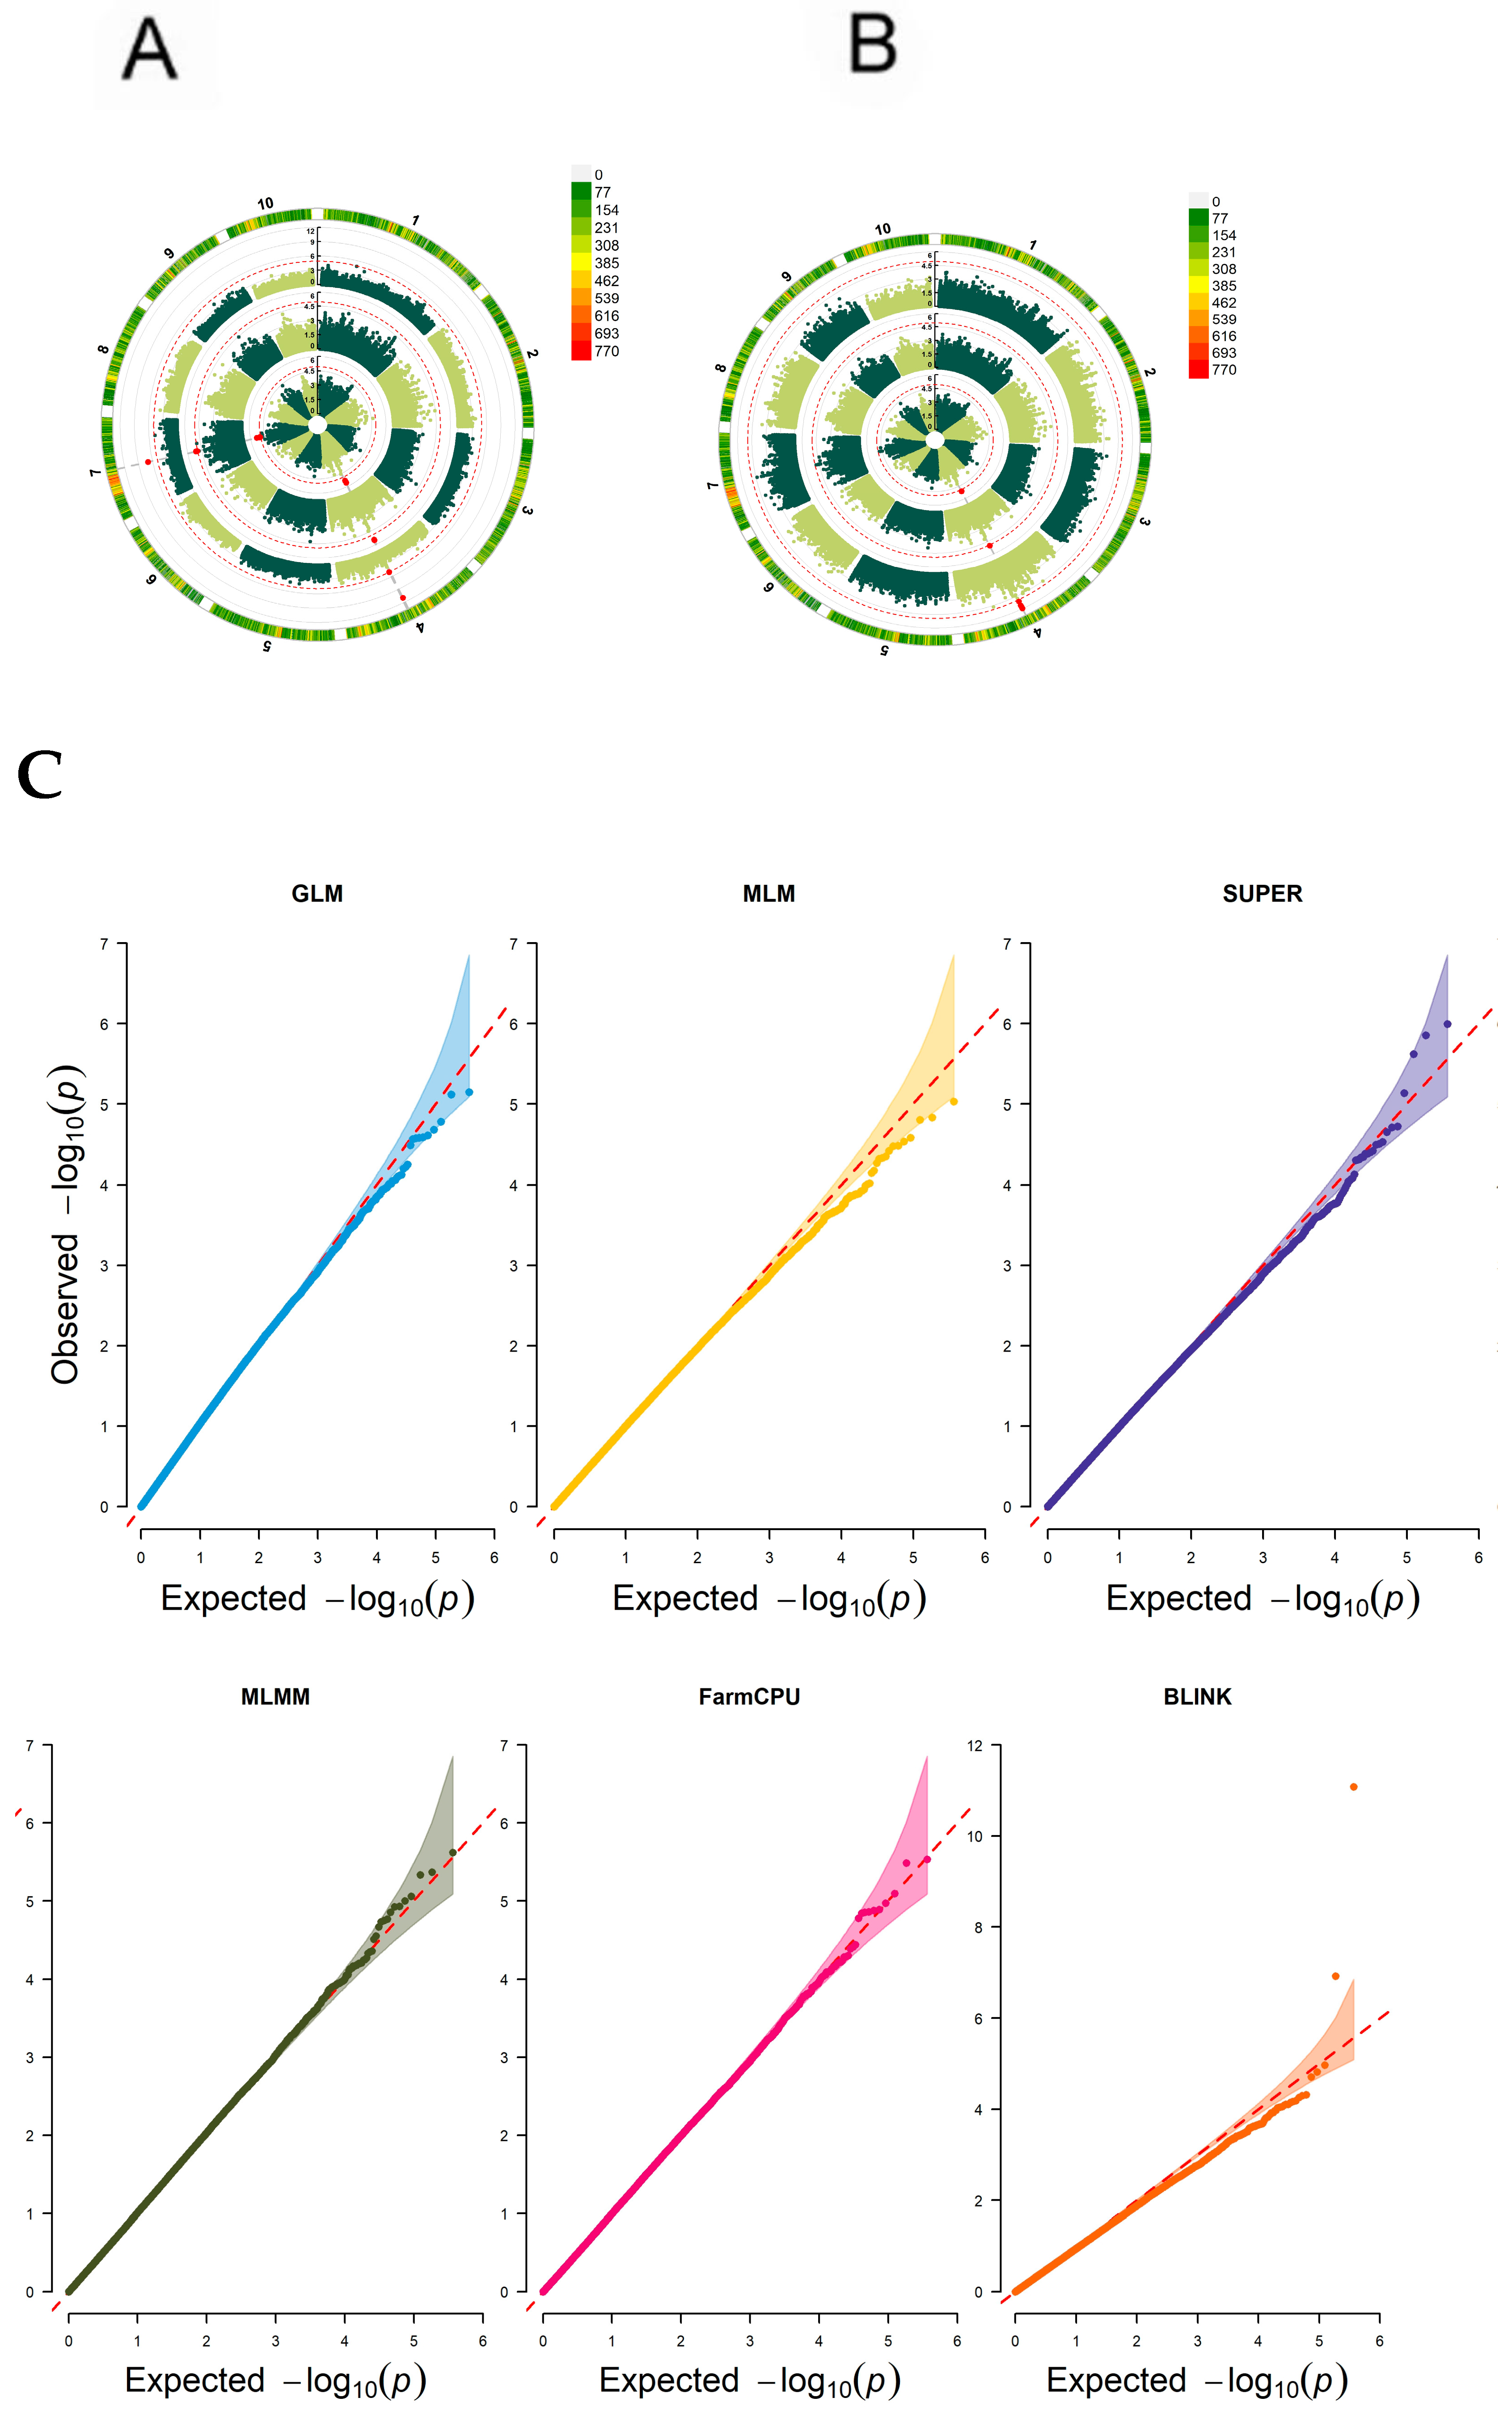
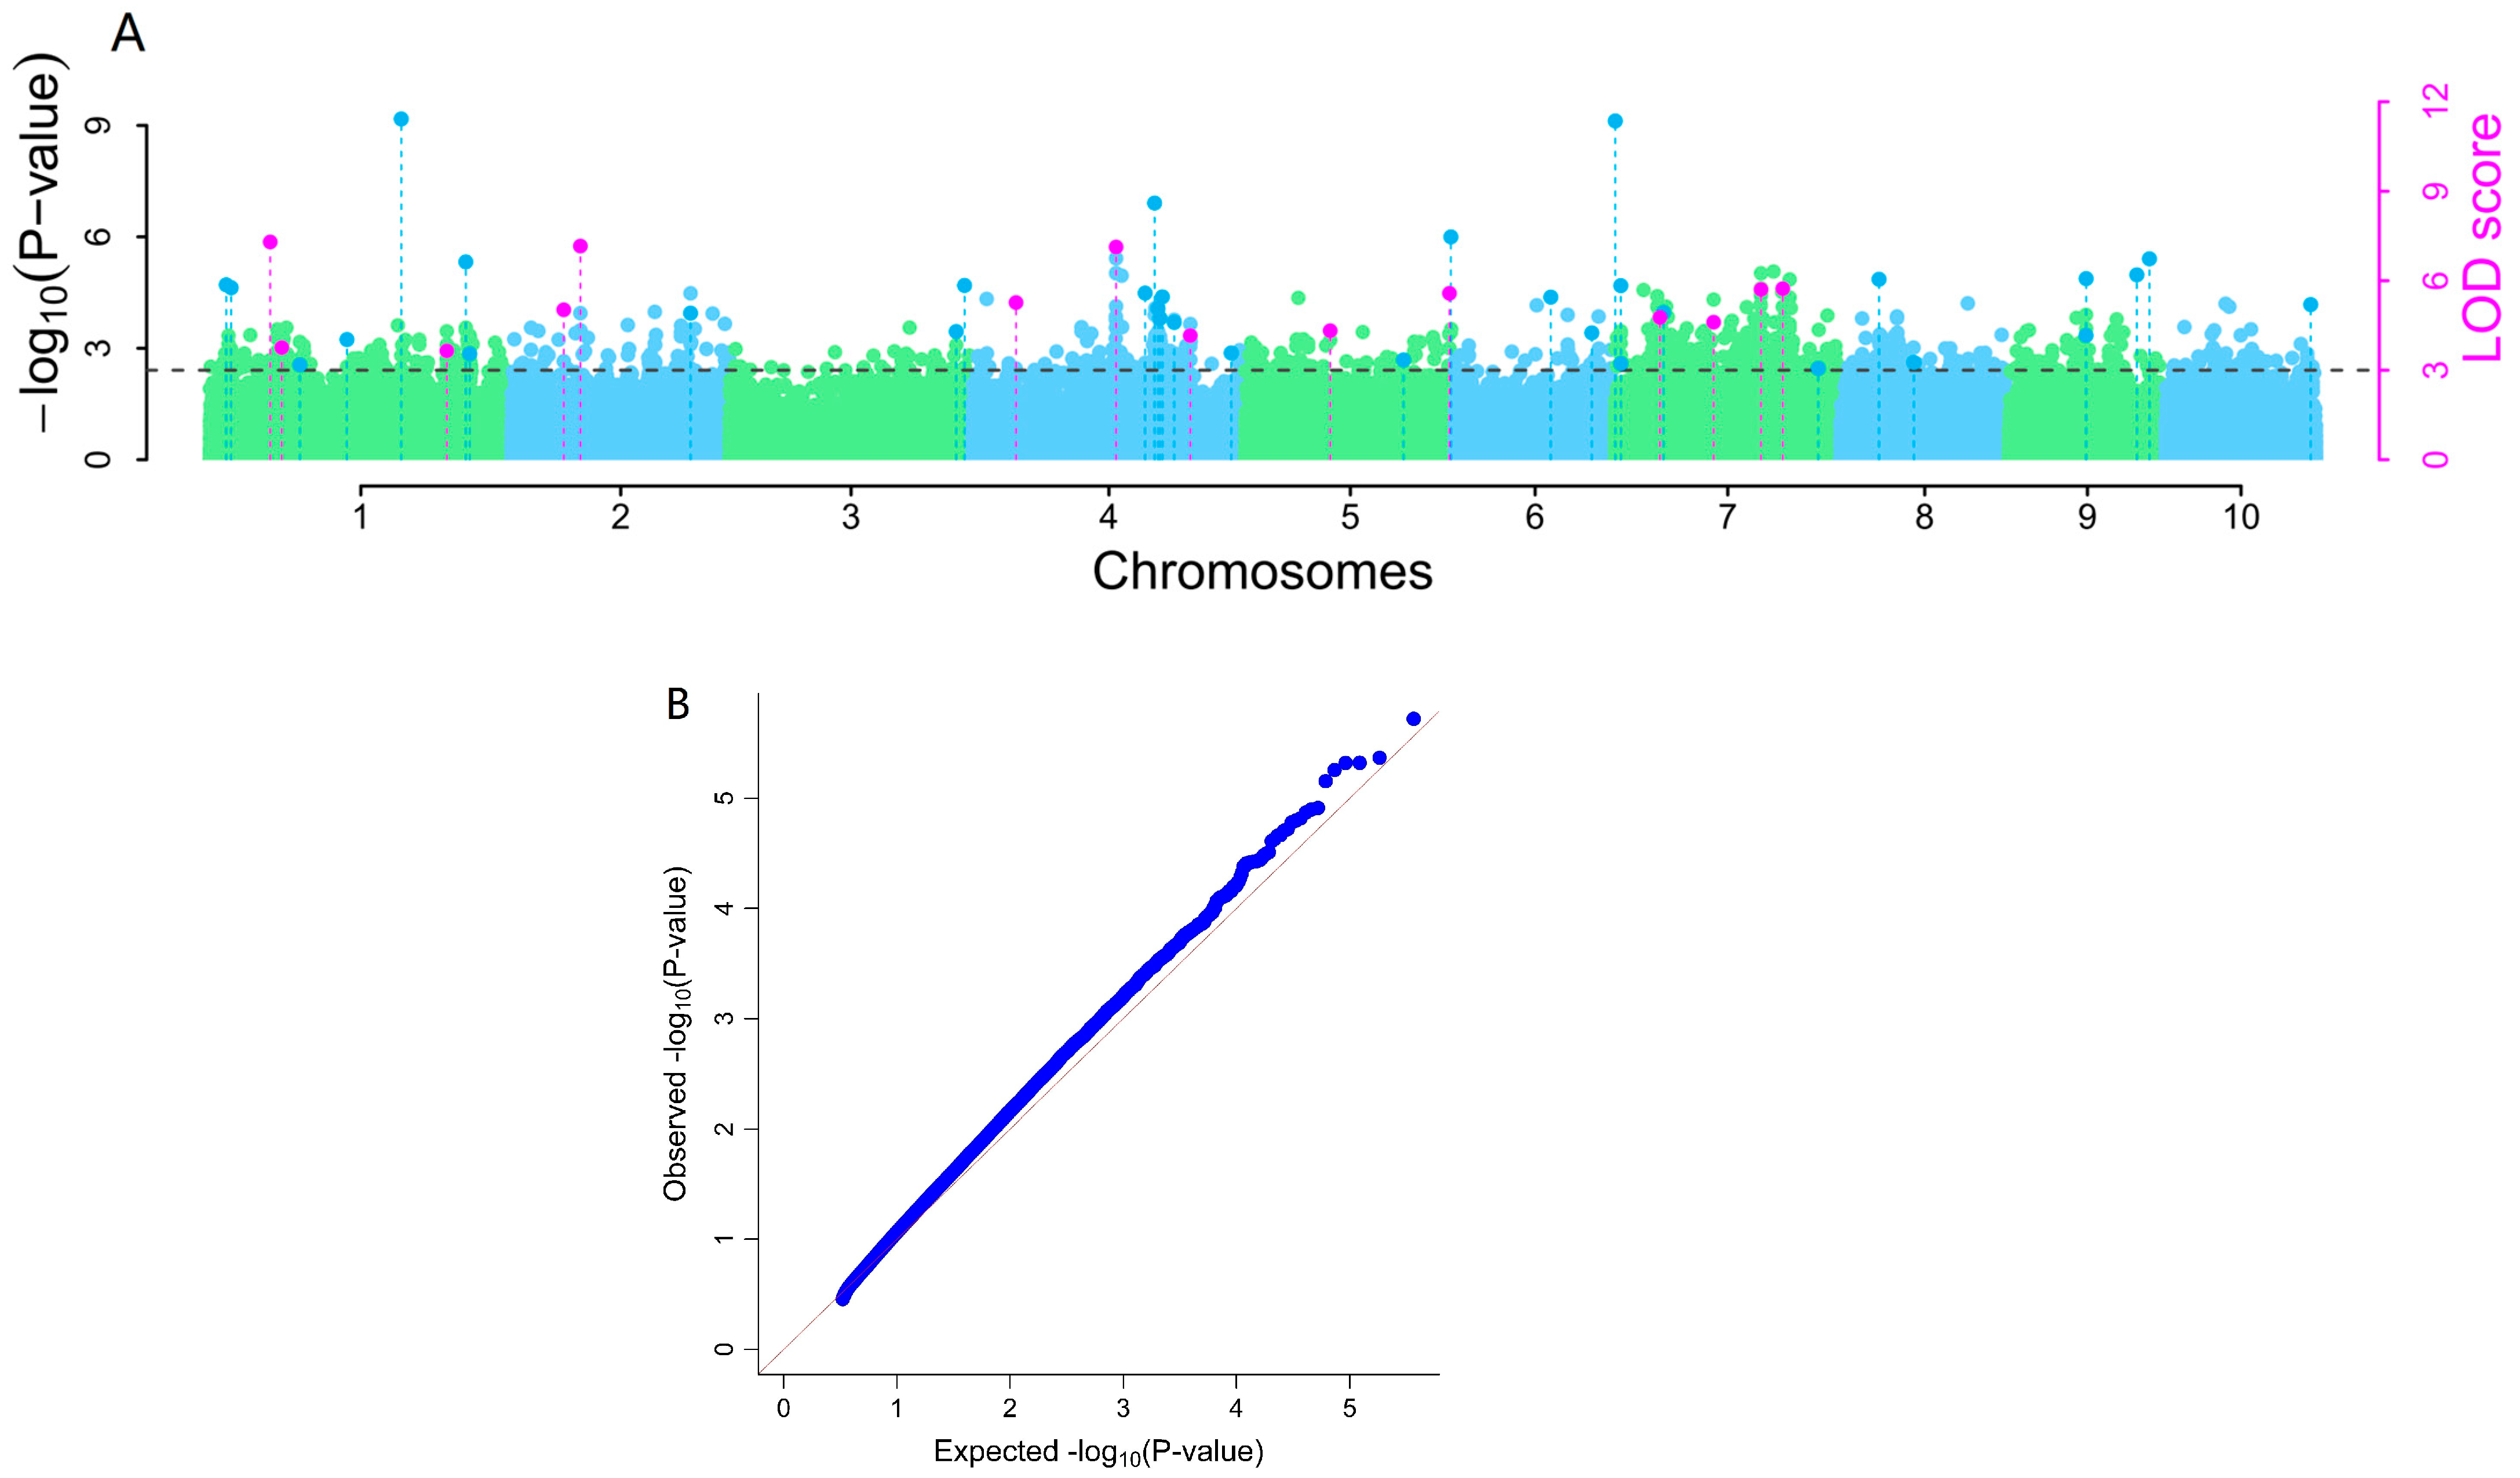
3.7. Genome-Wide Association Analysis of Maize Resistance to Ustilago maydis SG200
3.8. Candidate Gene Mining and Functional Annotation of Candidate Genes for Tumor-Resistant Black Powder Disease
4. Discussion
4.1. Seedling Identification and Resource Evaluation of Ustilago maydis Maize
4.2. Comparison between the Disease-Resistance Genes Identified by Transcriptome Analysis and the Results of Previous Studies
4.3. Comparison of GWAS Analysis Localization Results with Previous Work
4.4. Integration Analysis of GWAS Candidate Genes with RNA-seq DEGs Results
5. Conclusions
Supplementary Materials
Author Contributions
Funding
Institutional Review Board Statement
Data Availability Statement
Conflicts of Interest
References
- Lanver, D.; Müller, A.N.; Happel, P.; Schweizer, G.; Haas, F.B.; Franitza, M.; Pellegrin, C.; Reissmann, S.; Altmüller, J.; Rensing, S.A.; et al. The Biotrophic Development of Ustilago maydis Studied by RNA-Seq Analysis. Plant Cell 2018, 30, 300–323. [Google Scholar] [CrossRef] [PubMed]
- Pérez-Rodríguez, F.; González-Prieto, J.M.; Vera-Núñez, J.A.; Ruiz-Medrano, R.; Peña-Cabriales, J.J.; Ruiz-Herrera, J. Wide distribution of the Ustilago maydis-bacterium endosymbiosis in naturally infected maize plants. Plant Signal. Behav. 2021, 16, 1855016. [Google Scholar] [CrossRef] [PubMed]
- Lister, R.; O’Malley, R.C.; Tonti-Filippini, J.; Gregory, B.D.; Berry, C.C.; Millar, A.H.; Ecker, J.R. Highly integrated single-base resolution maps of the epigenome in Arabidopsis. Cell 2008, 133, 523–536. [Google Scholar] [CrossRef]
- Yao, L.; Li, Y.; Ma, C.; Tong, L.; Du, F.; Xu, M. Combined genome-wide association study and transcriptome analysis reveal candidate genes for resistance to Fusarium ear rot in maize. J. Integr. Plant Biol. 2020, 62, 1535–1551. [Google Scholar] [CrossRef]
- Han, G.; Li, C.; Xiang, F.; Zhao, Q.; Zhao, Y.; Cai, R.; Cheng, B.; Wang, X.; Tao, F. Genome-wide association study leads to novel genetic insights into resistance to Aspergillus flavus in maize kernels. BMC Plant Biol. 2020, 20, 206. [Google Scholar] [CrossRef]
- Rizzardi, D.A.; Peterlini, E.; Scapim, C.A.; Pinto, R.J.B.; Faria, M.V.; Contreras-Soto, R.I. Genome wide association study identifies SNPs associated with northern corn leaf blight caused by Exserohilum turcicum in tropical maize germplasm (Zea mays L.). Euphytica 2022, 218, 40–49. [Google Scholar] [CrossRef]
- Gowda, M.; Das, B.; Makumbi, D.; Babu, R.; Semagn, K.; Mahuku, G.; Olsen, M.S.; Bright, J.M.; Beyene, Y.; Prasanna, B.M. Genome-wide association and genomic prediction of resistance to maize lethal necrosis disease in tropical maize germplasm. Theor. Appl. Genet. 2015, 128, 1957–1968. [Google Scholar] [CrossRef] [PubMed]
- Brefort, T.; Doehlemann, G.; Mendoza-Mendoza, A.; Reissmann, S.; Djamei, A.; Kahmann, R. Ustilago maydis as a Pathogen. Annu. Rev. Phytopathol. 2009, 47, 423–445. [Google Scholar] [CrossRef] [PubMed]
- Steinberg, G.; Perez-Martin, J. Ustilago maydis, a new fungal model system for cell biology. Trends Cell Biol. 2008, 18, 61–67. [Google Scholar]
- Lanver, D.; Tollot, M.; Schweizer, G.; Lo Presti, L.; Reissmann, S.; Ma, L.S.; Schuster, M.; Tanaka, S.; Liang, L.; Ludwig, N.; et al. Ustilago maydis effectors and their impact on virulence. Nat. Rev. Microbiol. 2017, 15, 409–421. [Google Scholar] [CrossRef]
- Kamber, T.; Buchmann, J.P.; Pothier, J.F.; Smits, T.H.M.; Wicker, T.; Duffy, B. Fire blight disease reactome: RNA-seq transcriptional profile of apple host plant defense responses to Erwinia amylovora pathogen infection. Sci. Rep. 2016, 6, 21600–21617. [Google Scholar] [CrossRef] [PubMed]
- Pathi, K.M.; Rink, P.; Budhagatapalli, N.; Betz, R.; Saado, I.; Hiekel, S.; Becker, M.; Djamei, A.; Kumlehn, J. Engineering Smut Resistance in Maize by Site-Directed Mutagenesis of LIPOXYGENASE 3. Front. Plant Sci. 2020, 11, 543895. [Google Scholar] [CrossRef] [PubMed]
- Kämper, J.; Kahmann, R.; Bölker, M.; Ma, L.-J.; Brefort, T.; Saville, B.J.; Banuett, F.; Kronstad, J.W.; Gold, S.E.; Müller, O.; et al. Insights from the genome of the biotrophic fungal plant pathogen Ustilago maydis. Nature 2006, 444, 97–101. [Google Scholar] [CrossRef]
- Ruan, X.; Ma, L.; Zhang, Y.; Wang, Q.; Gao, X. Dissection of the Complex Transcription and Metabolism Regulation Networks Associated with Maize Resistance to Ustilago maydis. Genes 2021, 12, 1789. [Google Scholar] [CrossRef]
- Shi, J. Biology of Powdery Mildew and Identification of Resistance in Maize. Master’s Thesis, Gansu Agricultural University, Lanzhou, China, 2010. [Google Scholar]
- Murray, M.G.; Thompson, W.F. Rapid isolation of high molecular weight plant DNA. Nucleic Acids Res. 1980, 8, 4321–4325. [Google Scholar] [CrossRef]
- Sahito, J.H.; Zhang, H.; Gishkori ZG, N.; Ma, C.; Wang, Z.; Ding, D.; Zhang, X.; Tang, J. Advancements and Prospects of Genome-Wide Association Studies (GWAS) in Maize. Int. J. Mol. Sci. 2024, 25, 1918. [Google Scholar] [CrossRef]
- Shah, S.M.S. Mining Candidate Genes for Low Nitrogen Stress Tolerance in Maize by GWAS and QTL Localization and Transcriptome Analysis; Chinese Academy of Agricultural Sciences: Beijing, China, 2022. [Google Scholar]
- Cui, Y.; Zhang, F. The Application of Multi-Locus GWAS for the Detection of Salt-Tolerance Loci in Rice. Front. Plant Sci. 2018, 9, 1464. [Google Scholar] [CrossRef]
- Boutrot, F.; Zipfel, C. Function, Discovery, and Exploitation of Plant Pattern Recognition Receptors for Broad-Spectrum Disease Resistance. Annu. Rev. Phytopathol. 2017, 55, 257–286. [Google Scholar] [CrossRef] [PubMed]
- Lolle, S.; Stevens, D.; Coaker, G. Plant NLR-triggered immunity: From receptor activation to downstream signaling. Curr. Opin. Immunol. 2020, 62, 99–105. [Google Scholar] [CrossRef]
- Yasuda, S.; Okada, K.; Saijo, Y. A look at plant immunity through the window of the multitasking coreceptor BAK1. Curr. Opin. Plant Biol. 2017, 38, 10–18. [Google Scholar] [CrossRef]
- Wang, Y.; Zhang, Y.; Zhou, R.; Dossa, K.; Yu, J.; Li, D.; Liu, A.; Mmadi, M.A.; Zhang, X.; You, J. Identification and characterization of the bZIP trans ription factor family and its expression in response to abiotic stresses in sesame. PLoS ONE 2018, 13, e0200850. [Google Scholar] [CrossRef] [PubMed]
- Roux, M.; Schwessinger, B.; Albrecht, C.; Chinchilla, D.; Jones, A.; Holton, N.; Malinovsky, F.G.; Tör, M.; de Vries, S.; Zipfel, C. The Arabidopsis Leucine-Rich Repeat Receptor–Like Kinases BAK1/SERK3 and BKK1/SERK4 Are Required for Innate Immunity to Hemibiotrophic and Biotrophic Pathogens. Plant Cell 2011, 23, 2440–2455. [Google Scholar] [CrossRef] [PubMed]
- Balint-Kurti, P.J.; Wisser, R.; Zwonitzer, J.C. Use of an Advanced Intercross Line Population for Precise Mapping of Quantitative Trait Loci for Gray Leaf Spot Resistance in Maize. Crop Sci. 2008, 48, 1696–1704. [Google Scholar] [CrossRef]
- Maschietto, V.; Colombi, C.; Pirona, R.; Pea, G.; Strozzi, F.; Marocco, A.; Rossini, L.; Lanubile, A. QTL mapping and candidate genes for resistance to Fusarium ear rot and fumonisin contamination in maize. BMC Plant Biol. 2017, 17, 20. [Google Scholar] [CrossRef] [PubMed]
- Luan, J.; Wang, F.; Li, Y.; Zhang, B.; Zhang, J. Mapping quantitative trait loci conferring resistance to rice black-streaked virus in maize (Zea mays L.). TAG Theor. Appl. Genet. Theor. Angew. Genet. 2012, 125, 781–791. [Google Scholar] [CrossRef] [PubMed]
- Lv, X.-L.; Li, X.-H.; Xie, C.-X.; Hao, Z.; Ji, H.; Shi, L.; Zhang, S. Comparative QTL mapping of resistance to sugarcane mosaic virus in maize based on bioinformatics. Hereditas 2008, 30, 101–108. [Google Scholar] [CrossRef] [PubMed]
- Qiu, H.; Tan, K.; Li, C.; Shen, T.; Zhang, Z. Identification of QTL for resistance to head smut in maize (Zea mays. L). Euphytica 2021, 217, 185–192. [Google Scholar] [CrossRef]
- Stanley, A.E.; Menkir, A.; Ifie, B.; Paterne, A.A.; Unachukwu, N.N.; Meseka, S.; Mengesha, W.A.; Bossey, B.; Kwadwo, O.; Tongoona, P.B.; et al. Association analysis for resistance to Striga hermonthica in diverse tropical maize inbred lines. Sci. Rep. 2021, 11, 24193–24207. [Google Scholar] [CrossRef]
- Pè, M.E.; Gianfranceschi, L.; Taramino, G.; Tarchini, R.; Angelini, P.; Dani, M.; Binelli, G. Mapping quantitative trait loci (QTLs) for resistance to Gibberella zeae infection in maize. Mol. Gen. Genet. MGG 1993, 241, 11–16. [Google Scholar]
- Robertson-Hoyt, L.A.; Jines, M.P.; Balint-Kurti, P.J.; Kleinschmidt, C.E.; White, D.G.; Payne, G.A.; Maragos, C.M.; Molnár, T.L.; Holland, J.B. QTL Mapping for Fusarium Ear Rot and Fumonisin Contamination Resistance in Two Maize Population. Crop Sci. 2006, 46, 1734–1743. [Google Scholar] [CrossRef]
- Berger, D.K.; Carstens, M.; Korsman, J.N.; Middleton, F.; Kloppers, F.J.; Tongoona, P.; A Myburg, A. Mapping QTL conferring resistance in maize to gray leaf spot disease caused by Cercospora zeina. BMC Genet. 2014, 15, 60–72. [Google Scholar] [CrossRef] [PubMed]
- Bartholomew, E.S.; Black, K.; Feng, Z.; Liu, W.; Shan, N.; Zhang, X.; Wu, L.; Bailey, L.; Zhu, N.; Qi, C.; et al. Comprehensive Analysis of the Chitinase Gene Family in Cucumber (Cucumis sativus L.): From Gene Identification and Evolution to Expression in Response to Fusarium oxysporum. Int. J. Mol. Sci. 2019, 20, 5309. [Google Scholar] [CrossRef] [PubMed]
- Cheng, H.; Shao, Z.; Lu, C.; Duan, D. Genome-wide identification of chitinase genes in Thalassiosira pseudonana and analysis of their expression under abiotic stresses. BMC Plant Biol. 2021, 21, 87–98. [Google Scholar] [CrossRef] [PubMed]
- Wang, S.; Fu, J. Insights into Auxin Signaling in Plant–Pathogen Interactions. Front. Plant Sci. 2011, 2, 74. [Google Scholar] [CrossRef] [PubMed]
- Navarro, L.; Dunoyer, P.; Jay, F.; Arnold, B.; Dharmasiri, N.; Estelle, M.; Voinnet, O.; Jones, J.D.G. A Plant miRNA Contributes to Antibacterial Resistance by Repressing Auxin Signaling. Science 2006, 312, 436–439. [Google Scholar] [CrossRef]
- Zhang, H.; Tan, X.; Li, L.; He, Y.; Hong, G.; Li, J.; Lin, L.; Cheng, Y.; Yan, F.; Chen, J.; et al. Suppression of auxin signalling promotes rice susceptibility to Rice black streaked dwarf virus infection. Mol. Plant Pathol. 2019, 20, 1093–1104. [Google Scholar] [CrossRef] [PubMed]
- Liu, P.-P.; Koizuka, N.; Martin, R.C.; Nonogaki, H. The BME3 (Blue Micropylar End 3) GATA zinc finger transcription factor is a positive regulator of Arabidopsis seed germination. Plant J. 2005, 44, 960–971. [Google Scholar] [CrossRef] [PubMed]
- Manzoor, M.A.; Sabir, I.A.; Shah, I.H.; Wang, H.; Yu, Z.; Rasool, F.; Mazhar, M.Z.; Younas, S.; Abdullah, M.; Cai, Y. Comprehensive Comparative Analysis of the GATA Transcription Factors in Four Rosaceae Species and Phytohormonal Response in Chinese Pear (Pyrus bretschneideri) Fruit. Int. J. Mol. Sci. 2021, 22, 12492. [Google Scholar] [CrossRef] [PubMed]
- Chen, X.; Guo, Z. Tobacco OPBP1 enhances salt tolerance and disease resistance of transgenic rice. Int. J. Mol. Sci. 2008, 9, 2601–2613. [Google Scholar] [CrossRef]
- Zhao, Y.; Wei, T.; Yin, K.Q.; Chen, Z.; Gu, H.; Qu, L.J.; Qin, G. Arabidopsis RAP2.2 plays an important role in plant resistance to Botrytis cinerea and ethylene responses. New Phytol. 2012, 195, 450–460. [Google Scholar] [CrossRef]
- Liu, D.; Chen, X.; Liu, J.; Ye, J.; Guo, Z. The rice ERF transcription factor OsERF922 negatively regulates resistance to Magnaporthe oryzae and salt tolerance. J. Exp. Bot. 2012, 63, 3899–3911. [Google Scholar] [CrossRef] [PubMed]


| Level of Illness Condition Level | Symptomatic Behavior Performance Symptoms |
|---|---|
| 1 | The plants show no signs of infection. |
| 2 | Mild infestation with greenish discoloration of infected leaves at the inoculation site |
| 3 | Moderate infestation, with small rice-like verrucae on leaves, leaf sheaths, etc. |
| 4 | Heavy infestation with severe deformation of leaves, stems, or stem bases with more and larger protruding verrucae |
| Sickness Index Condition Index | Capability of Resisting Condition Index | |
|---|---|---|
| 0–15.0 | Highly resistant | (high anti-HR) |
| 15.1–30.0 | Resistant | (Anti-R) |
| 30.1–50.0 | Moderately resistant | (CAGMR) |
| 50.1–70.0 | Susceptible | (Sense S) |
| 70.1–100.0 | Highly susceptible | (High-sensitivity HS) |
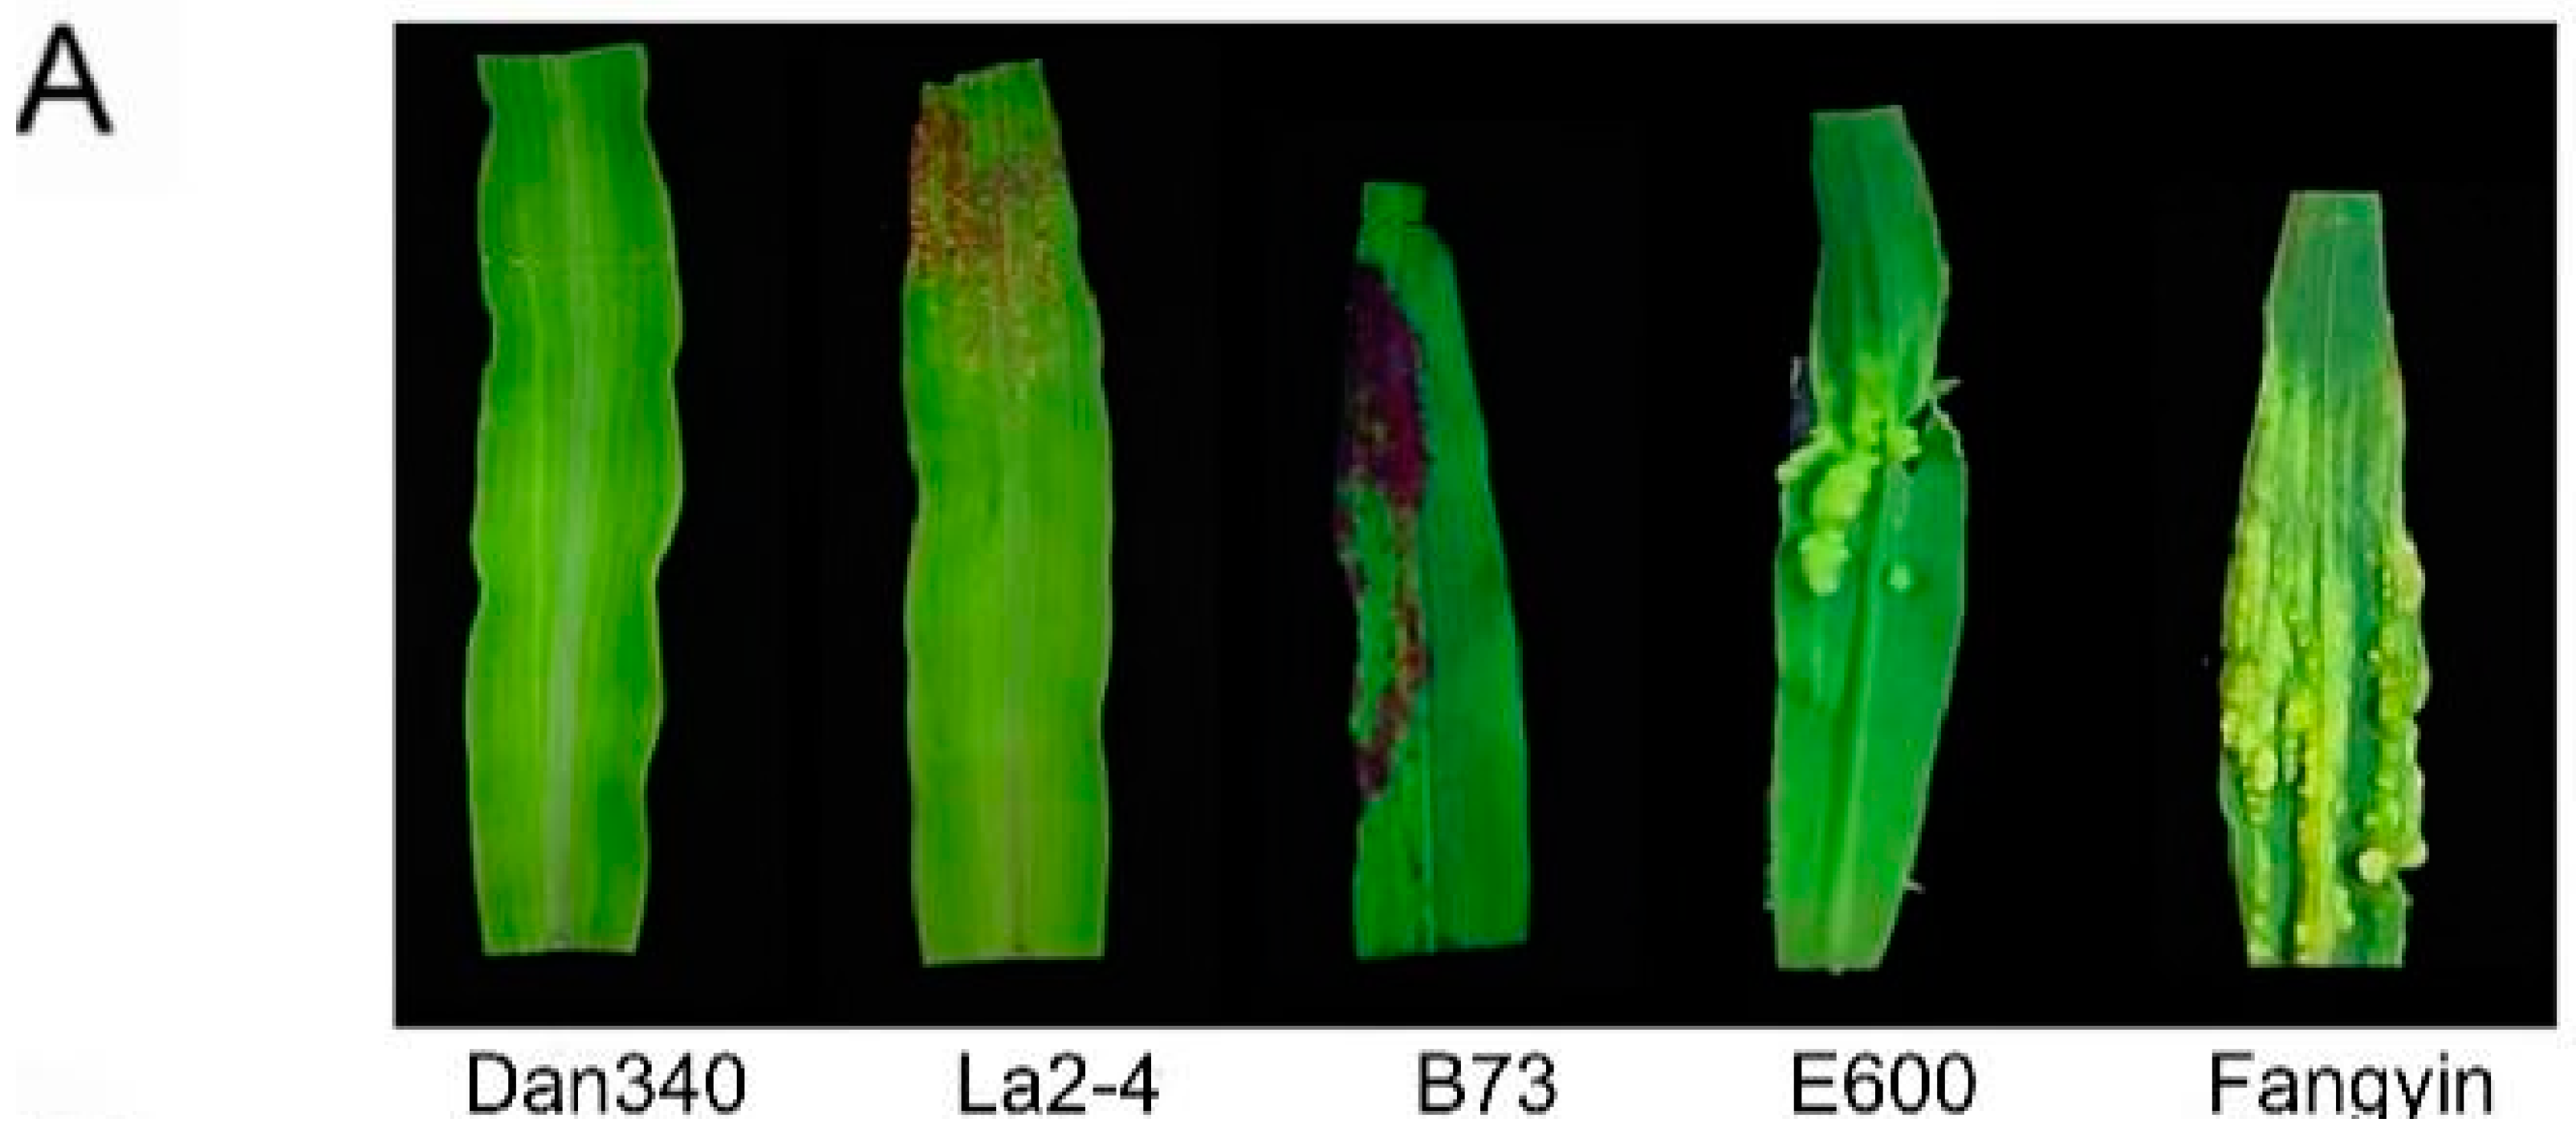
| Sickness Index Condition Index | Assortment Variety |
|---|---|
| highly resistant | Fanrong 2; LH74; Rock 38; DM07; 18; Dan 340; W668; M3; Zheng 58; Lo1125; B100; N138; L-1; Jingnuo 2; DH65232 (DH9); XOP2; Ay420; Dai 6; 444; ND246; Tai 184; K14; P25; Deer 65; Q1261; 1313; OQ603; ChengZi2142; 8982; Cheng698-3; e220; H21 |
| resistant | A632; He3; 6M502; bt1; b67; SC24-1; 91huang15; 757; Ys06; df24; 7236; Phn37; Ill12e; W9706; 08-64; Tuck488; K12; mbsj; W172; Phn82; Wil900; GY3; Lh123ht; D864; LH128; Huano IV3; Spoke 8527; HHe01; La2-4 |
| moderately resistant | B73; Bai197; Ibb15; W117; 9702; Qiong51; K514; Phh93; 85bai64; Wenhuang31413; Z31b; Php55; df27; 806a; Huangc; B12; Cr1ht; 1538; D15; 764; Along 812; Heng31; Lh162; 802; D857; Tuck 52106; Hai9-21; DH40; N42; ChangK; PHP85; 3335; 78002A; H66/6; Su75; D33A; Zheng32; PHJ33; Wobai; eQun4; NS501; Shen135; K22; DM101B; US68113; N68a; Drought21; 9711; SC14; B95. |
| susceptible | B127; Llegacy67; H114; Mo17; Lh59; 268; 3H2; W499; Phw51; Chang7-2; Gan41; DF20; D1139; M1016; M131-5; 17564; B78; D883; 78371A; VA26; Elect6; 68202; 624; Hb8229; 707; 68122; B394; SC11-1; DH65232; 1614; PHG86; LH156; 478; Long 72; E600; Medium 741 |
| high susceptible | l069; Lh132; BCC03; Q381; CT109; 1145; Tuck8112; t24; 3189; S53; P136; Lx9801; Fang citing; 7903e; D88; Y9961; Brigade 28; e588; Zong548-1521; Wil901 |
| SNP | Genome | Functional Notes | Previous Study | Journal |
|---|---|---|---|---|
| 1_244281660 | Zm00001d032946 | Chitinase 1 | Chitinase activities themselves remained unchanged under biotic stress, but their expression was widely upregulated under stress | BMC Plant Biology |
| 1_244281660 | Zm00001d032948 | fatty acid elongase | Fatty acid elongase activity directly affects the number and chain length of VLCFAs | The Plant Journal |
| 5_220156746 | Zm00001d018414 | IAA9—auxin-responsive Aux/IAA family member | Overexpression of miR393 inhibits growth hormone signaling and enhances Arabidopsis resistance to the bacterial pathogen Pseudomonas butyrica | Science |
| 5_220156746 | Zm00001d018421 | GATA transcription factor 8 | AtGATA8 (BME3) positively regulates seed germination in Arabidopsis thaliana | The Plant Journal |
| 7_88700440 | Zm00001d020043 | AP2-EREBP transcription factor | Rice OsERF922, on the other hand, negatively regulates resistance to rice blast disease | Journal of Experimental Botany |
Disclaimer/Publisher’s Note: The statements, opinions and data contained in all publications are solely those of the individual author(s) and contributor(s) and not of MDPI and/or the editor(s). MDPI and/or the editor(s) disclaim responsibility for any injury to people or property resulting from any ideas, methods, instructions or products referred to in the content. |
© 2024 by the authors. Licensee MDPI, Basel, Switzerland. This article is an open access article distributed under the terms and conditions of the Creative Commons Attribution (CC BY) license (https://creativecommons.org/licenses/by/4.0/).
Share and Cite
Yin, B.; Xu, L.; Li, J.; Zheng, Y.; Song, W.; Hou, P.; Zhu, L.; Jia, X.; Zhao, Y.; Song, W.; et al. Integrated Transcriptome and GWAS Analysis to Identify Candidate Genes for Ustilago maydis Resistance in Maize. Agriculture 2024, 14, 958. https://doi.org/10.3390/agriculture14060958
Yin B, Xu L, Li J, Zheng Y, Song W, Hou P, Zhu L, Jia X, Zhao Y, Song W, et al. Integrated Transcriptome and GWAS Analysis to Identify Candidate Genes for Ustilago maydis Resistance in Maize. Agriculture. 2024; 14(6):958. https://doi.org/10.3390/agriculture14060958
Chicago/Turabian StyleYin, Bingyu, Linjie Xu, Jianping Li, Yunxiao Zheng, Weibin Song, Peng Hou, Liying Zhu, Xiaoyan Jia, Yongfeng Zhao, Wei Song, and et al. 2024. "Integrated Transcriptome and GWAS Analysis to Identify Candidate Genes for Ustilago maydis Resistance in Maize" Agriculture 14, no. 6: 958. https://doi.org/10.3390/agriculture14060958
APA StyleYin, B., Xu, L., Li, J., Zheng, Y., Song, W., Hou, P., Zhu, L., Jia, X., Zhao, Y., Song, W., & Guo, J. (2024). Integrated Transcriptome and GWAS Analysis to Identify Candidate Genes for Ustilago maydis Resistance in Maize. Agriculture, 14(6), 958. https://doi.org/10.3390/agriculture14060958