Article

Deposition of Water and Emulsion Hollow Droplets on Hydrophilic and Hydrophobic Surfaces

1
School of Agricultural Engineering, Jiangsu University, Zhenjiang 212013, China
2
School of Energy and Power Engineering, Jiangsu University, Zhenjiang 212013, China
*
Author to whom correspondence should be addressed.
Agriculture 2024, 14(6), 960; https://doi.org/10.3390/agriculture14060960
Submission received: 20 April 2024 / Revised: 15 June 2024 / Accepted: 18 June 2024 / Published: 19 June 2024
(This article belongs to the Section Agricultural Technology)

Abstract

:
The deposition of spray droplets is a hot topic in the field of plant protection. The air-induction nozzle, which is commonly used in agricultural spray, can produce droplets containing bubbles. However, few studies have addressed the deposition of hollow droplets. In the present study, we used experimental and numerical methods to investigate the deposition of hollow droplets. Three kinds of liquid—water, oil-based emulsion and organosilicon—were used to produce hollow droplets, and the diameter of droplets varied from 3 to 4.5 mm. Both hydrophilic and hydrophobic surfaces were selected as deposition targets. The results show that the deposition of hollow droplets can generate a central jet, which is similar to the Wortington jet. High deposition velocity and the large bubble volume were responsible for the large attainable height of the central jet. On the hydrophilic surface, for water hollow droplets with Weber number (We) ranging from 350 to 391, the central jet began to break up as the bubble fraction of the hollow droplet reached 0.15. Based on the numerical results, it was found that the internal pressure difference between the bottom liquid and the air cavity leads to the formation of the central jet. The bubble volume and impact velocity were both positively correlated with the internal pressure difference. The oil-based emulsion promoted the adherence of the hollow droplet by lubricating the hydrophobic surface. The oil-based emulsion hollow droplets shifted from rebounding to adhering on the hydrophobic surface as the emulsion concentration reached 0.4%.

Graphical Abstract

1. Introduction

The deposition of spray droplets on a surface is crucial for plant protection [1,2,3], the thermal spray-coating process [4] and ink-jet printing [5]. When hollow droplets impact a surface, they will produce a central jet [6,7]. However, the central jet may lead to a series of liquid stream breakup problems. The loss of liquid during droplet deposition can cause environmental pollution and reduce the efficacy of pesticides [8]. The air-induction nozzle yields droplets with high anti-drift ability [9,10]. The spray discharged from the air-induction nozzle contains both air and liquid, which is highly possible to produce hollow droplets containing bubbles [11,12]. In previous studies, the evolution of dense droplets when they impact a target has been extensively studied [13,14,15,16]. However, studies on hollow droplets have seldom been reported. Specifically, the change of bubble volume serves as an influential factor for the central jet but has received little attention. During pesticide spraying, the air-induction nozzle may produce hollow droplets with different bubble volume fractions, which typically range from 12% to 36% [9]. Therefore, it is necessary to investigate the effect of bubble volume on the central jet. The impact velocity is also of significance for the deposition of spray droplets [17,18,19,20]. High initial impact velocity is responsible for the high rebounding kinetic energy of the droplet. This will promote the development of the central jet breakup.
For the control of pests and diseases, additives such as emulsion and organosilicon are often added to pesticides [21,22,23,24]. These additives can help reduce the surface tension of the droplets and promote droplet spreading [25,26]. Essentially, it has been reported that emulsion facilitates the rupture of the spray liquid film, and the pesticide drift is prevented with increased droplet size [27,28,29,30]. Therefore, it is necessary to study the effect of emulsions on the deposition of hollow droplets. The leaves of many crops are hydrophobic, leading to great challenges in pesticide adhesion [31,32]. To extend the application of the air-induction nozzle, the mechanism of the deposition of hollow droplets on a hydrophobic surface deserves further investigation.
The central jet breakup of the hollow droplet leads to liquid loss, so the threshold of the central jet breakup for hollow droplets is of significance. In the present study, the effects of bubble volume and impact velocity were experimentally investigated, and the Coupled Level Set Volume of Fluid (CLSVOF) method was used [33]. Furthermore, the deposition of droplets on hydrophobic surfaces has always been a problem, so we applied oil-based emulsion hollow droplets to impact the hydrophobic lotus leaf surface. The adsorption mechanism was then analyzed. The threshold of emulsion concentration for hollow droplets to shift from rebounding to adhering on the surface was measured. The obtained conclusions are expected to provide theoretical guidance for the design and application of the air-induction nozzle.

2. Materials and Methods

2.1. Experimental Equipment and Method

The impact experiment was performed at room temperature and relative humidity. A sketch of the experimental system is shown in Figure 1. As indicated in Figure 1, two syringes and two syringe pumps (QHZS-001B, Shenzhen Qinhe Co., Shenzhen, China) were used to produce hollow droplets. Experimental liquid was stored in the vertical syringe while air was stored in the horizontal syringe. Firstly, the vertical syringe was pushed by a syringe pump, and a small droplet was formed at the tip of the syringe needle. Then, the needle of the horizontal syringe was inserted into the droplet, and air was injected into the droplet. The injection volume of the air was controlled by the horizontal syringe pump. After that, more liquid was squeezed out from the vertical syringe, and the droplet fell under the force of gravity. Due to the deviation of air bubbles in the droplet, the aforementioned process had to be repeated many times so as to obtain an ideal hollow droplet. The diameter of hollow droplets varied from 3 to 4.5 mm. The impact velocity of hollow droplets varied from 2.17 to 2.58 m/s. The impact velocity was modified by changing the falling height of the droplet. Based on the recent research [9], it is believed that the bubble volume fraction inside the hollow droplet produced by commercial air-induction nozzles ranges from 0.12 to 0.36. In our experiments, the bubble volume fraction ranged from 0.03 to 0.23. Generally, the bubble volume fraction used in our experiments were within the ranges produced by the commercial air-induction nozzles. Dynamic behaviors of the droplet were observed using a high-speed Olympus i-Speed TR camera and a Tokina Macro 100 F 2.8 D macro lens (Olympus I-Speed 3, Olympus Co., Shinjuku-ku, Tokyo, Japan). A lamp (TOZOYO EFIII-150W, Jinbei Co., Shanghai, China) served as the light source. A diffuser plate was mounted between the lamp and the target to uniformize the light distribution over the monitored zone. The exposure time of the camera was set to 2.16 μs to avoid motion blur, and the shooting frequency was 2000 fps. A total of 10,000 images was captured for each experimental condition. The resolution of the captured images was 1280 × 1024 pixels. The commercial image analysis software IPP (Image Pro Plus 6.0; Meyer Instruments, Houston, TX, USA) was used to measure the diameter of droplets in the image (in pixels). The actual and pixel length of scale were measured through IPP, and the ratio of the two lengths served as the scale of images. The initial droplet diameter  D 0  and spreading diameter  D t  were measured. The Weber number of droplets was calculated through  We = ρ U 2 D 0 / σ , where  ρ  is the density of liquid, U is the impact velocity of droplet,  D 0  is the initial diameter of droplet, and  σ  is the static surface tension of liquid.
In Figure 2, droplets of water deposited on different surfaces are shown. A glass slide was used as the hydrophilic surface, (U-004, Zhangzhou Wude Biotechnology Co., Zhangzhou, China), being the contact angle of 67.5° ± 3°. A lotus leaf was used as the hydrophobic surface, and the contact angle in this case was 140.3° ± 3°. The lotus leaf was cut into appropriate size and stuck on the glass slide. The contact angles were measured using an OCA measurement system (DataPhysics OCA25, DataPhysics Instruments GmbH, Filderstadt, Germany).
Water, oil-based emulsion and organosilicon were used in the experiments. The oil-based emulsion was prepared using water and commercial butachlor (Jiangsu Lvlilai Co., Kunshan, China), a kind of pre-emergent herbicide used in agriculture [34]. The main constituents of the commercial butachlor were: 60% (w/w) butachlor, 9% (w/w) Styrylphenyl polyoxyethylene ether (emulsifiers), 6% (w/w) sodium alkylbenzenesulfonate (emulsifiers) and 15% (w/w) cyclohexanone (dissolvant). The organosilicon solution was prepared with water and organosilicon surfactant (Shandong Lvlong Co., Zhucheng, China). The static surface tension was tested using the OCA measurement system. The dynamic viscosity of the three liquid mediums was measured using a rheometer (Brookfield R/S plus, Brookfield Viscometers Ltd., Harlow, UK).

2.2. Numerical Simulation

A two-dimensional numerical model for the impact of a hollow droplet on the wall was established using ANSYS FLUENT 2020 R1, and the evolution of the hollow droplet was simulated through the Coupled Level Set Volume of Fluid (CLSVOF) method. The model and boundary condition are shown in Figure 3a. Considering the symmetry of the computational domain and physical properties of the case, half of the whole computational domain was dedicated to numerical simulation. The dimensions of the domain used were 10 mm × 20 mm. No-slip boundary condition was defined at the bottom boundary of the domain, and non-reflective pressure outlet boundary conditions were applied at the upper, left and right boundaries of the domain. The SIMPLE method was used to couple pressure and velocity, and the PRESTO! method was used for the calculation of pressure. The second-order upwind scheme was conducive to convergence, and the Geo-Reconstruct approach was selected to calculate the volume fraction of the gas–liquid interface. The time step was set to  10 7  s, the step number was set to 120,000, and the time interval was set to 20. The numerical result was compared with the experimental data. Two characteristic parameters were selected for the comparison: one was the spreading factor  f * , ( f * = D t / D 0 ), and the other was the central jet height factor  H * , ( H * = H j / D 0 ). In this case,  H j  represents the central jet height.
The number of the grids discretizing the computational domain significantly influences the accuracy of the numerical result. Generally, the finer the grid, the more accurate the result. However, a high cost of simulation will entail, and more time and storage space are necessary. Here, four sets of grids, with total grid numbers of 30,000, 100,000, 350,000 and 550,000 were selected, as shown in Figure 4. Considering the consistency between the numerical result and the experimental data, the grid scheme with 350,000 grids was eventually selected. A further comparison between experimental and numerical results is illustrated in Figure 5. The formation of the central jet and the bubble collapsing are observed in the experimentally obtained images. Meanwhile, the agreement between the experimental and the numerical results is remarkable. Therefore, high fidelity of the numerical method is demonstrated.

3. Results and Discussion

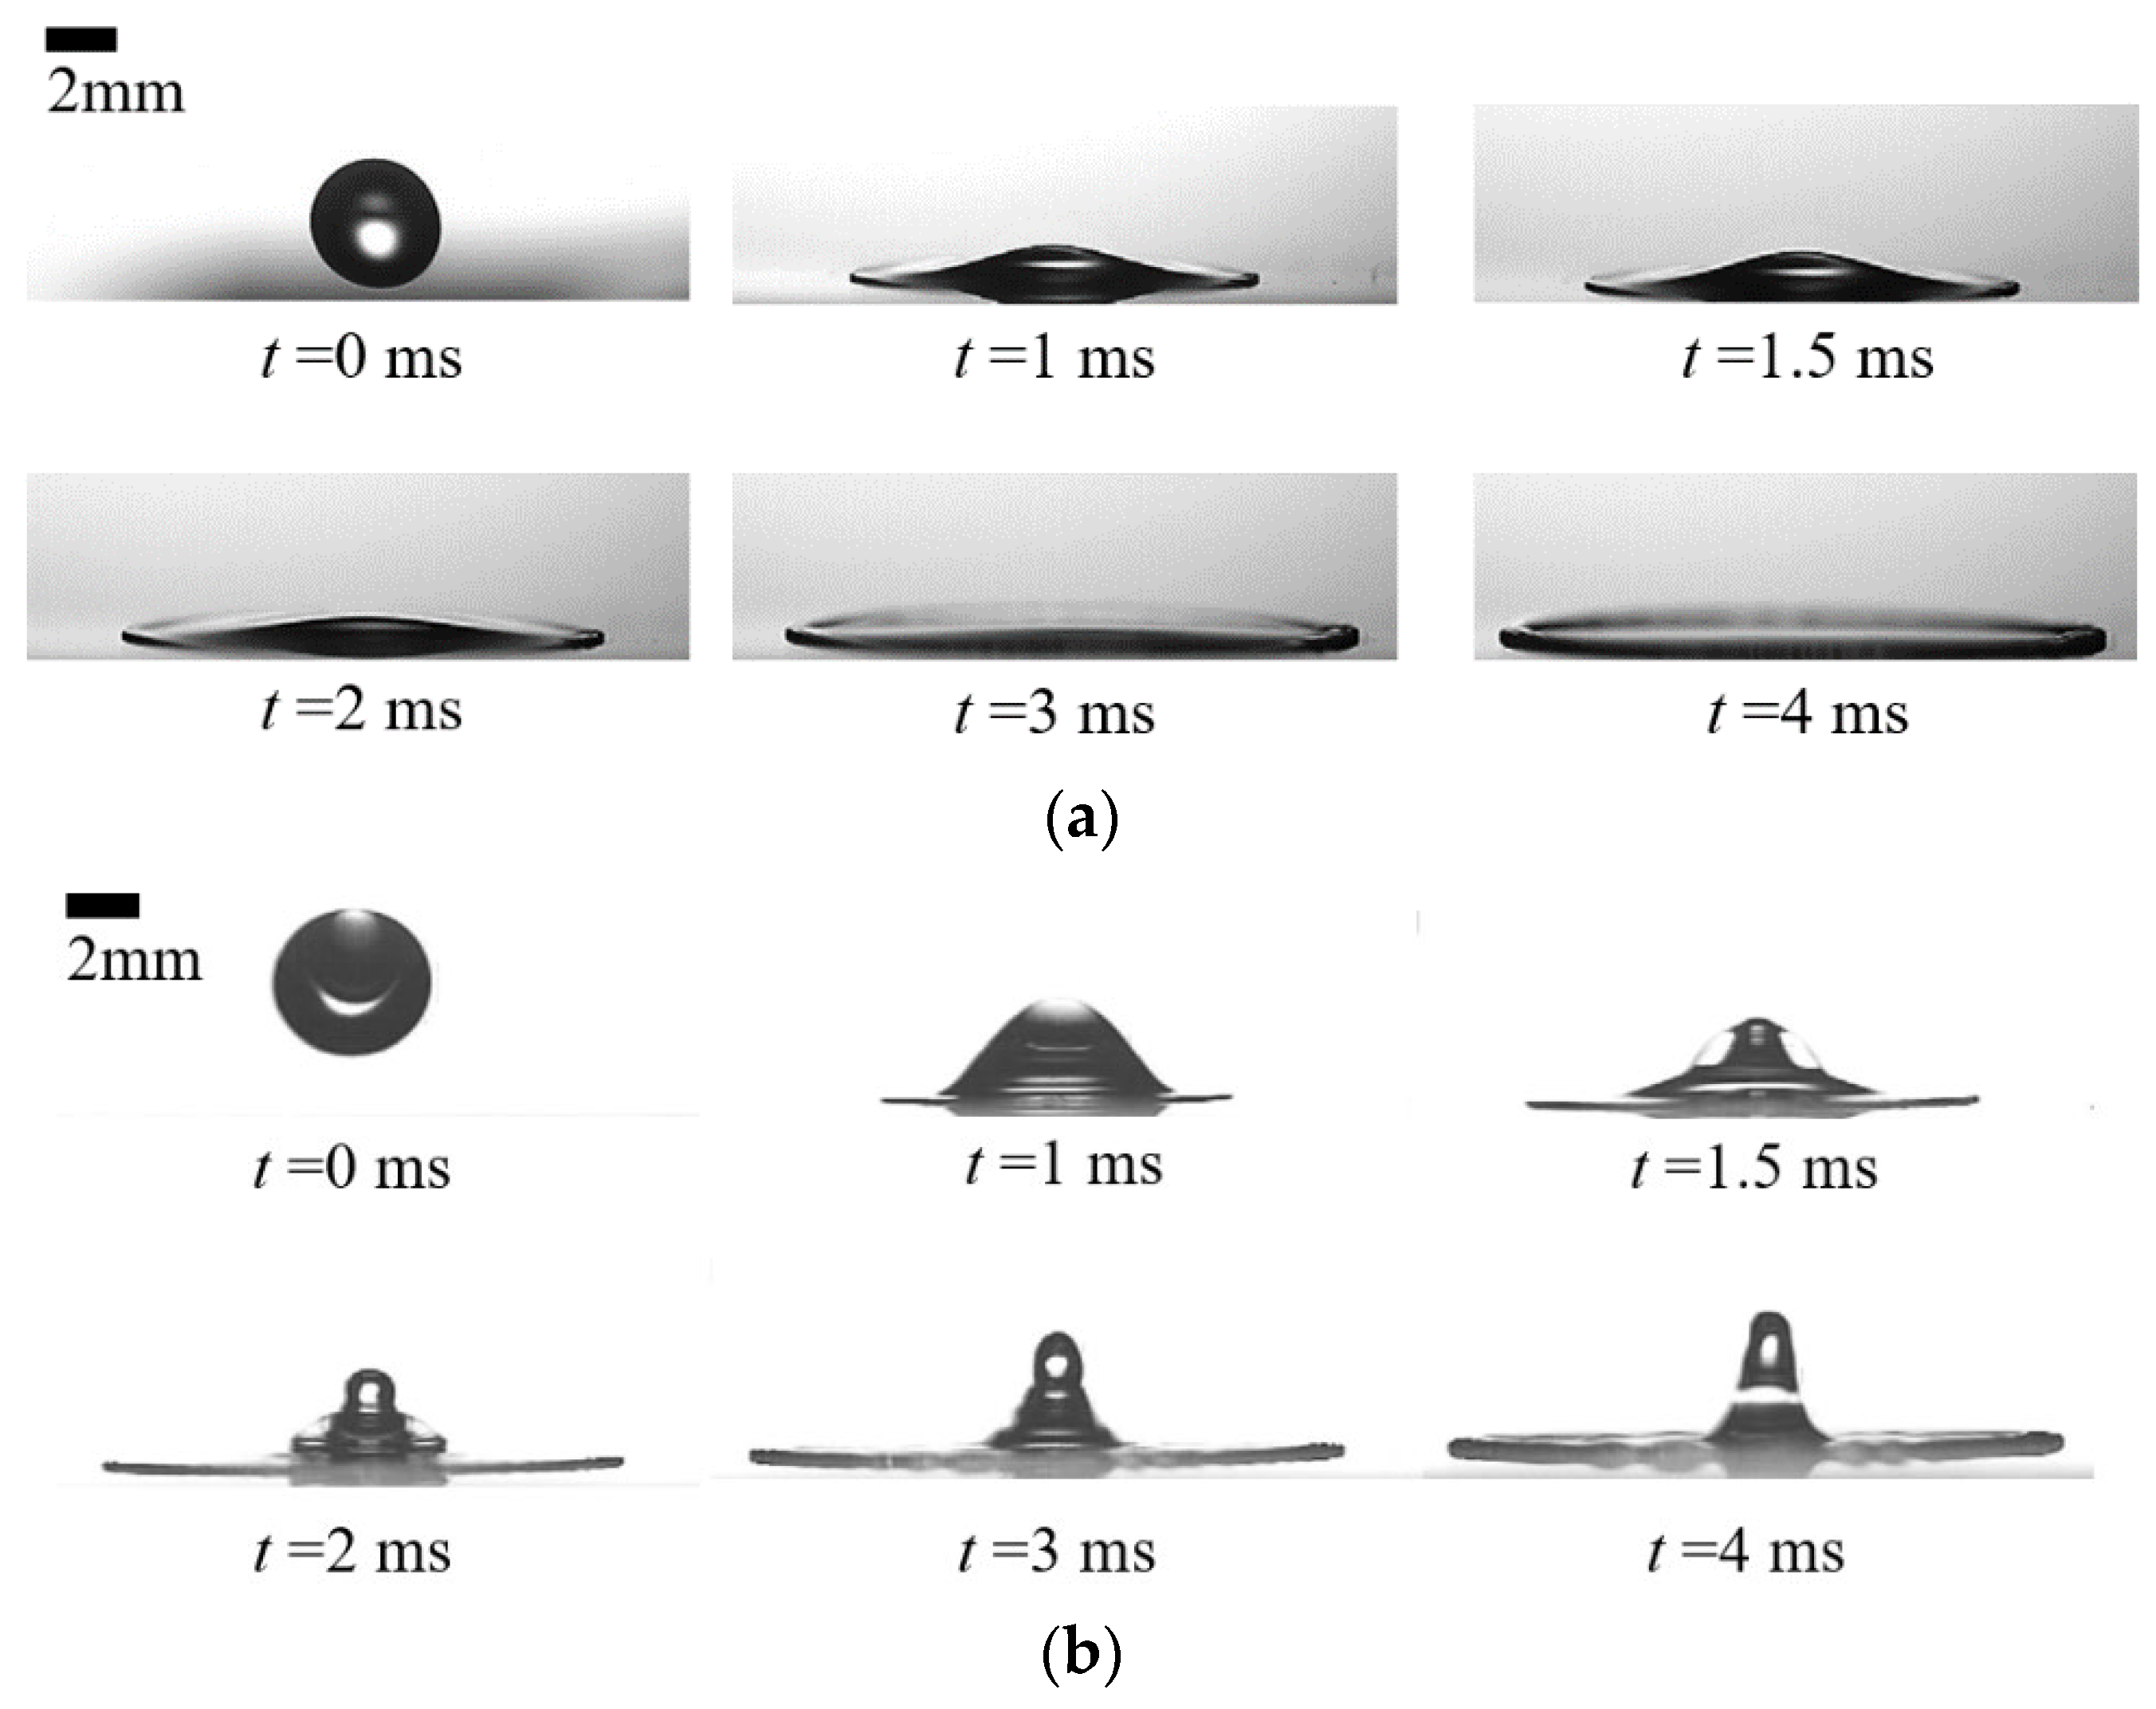
3.1. Dense Water Droplet and Hollow Water Droplet Impact on Hydrophilic Surface

The impact of a dense water droplet on a hydrophilic surface at a velocity of 2.58 m/s was observed. Such an event is illustrated in Figure 6a. At t = 1 ms, the droplet touched the surface and spread outward rapidly. At t = 3 ms, the central part of the droplet was thin. The spreading effect is remarkable, and the edge changes thickened. At t = 4 ms, the droplet spread outward to its maximum diameter. And the central part of the dense droplet was as thin as a film, while the outer edge of the volume collected most of the liquid. The whole spreading process was very stable without any splash. Then, the experiment of the impact of a hollow water droplet on the hydrophilic surface was conducted at the same velocity of 2.58 m/s, as shown in Figure 6b. The bubble volume fraction was represented by the dimensionless factor  V * ( V * = D B 3 / D 0 3 ). Considering that the bubble diameter,  D B  was affected by light refraction, we introduced a modified formula, namely  D B = D B   actual × 0.86  [35]. The expansion of a hollow droplet was similar to that of a dense droplet. However, the unique central jet brings more complex and diverse changes in terms of the jet height and internal liquid flow. At t = 1 ms, the inner bubble of the hollow droplet was pushed into a hemispherical shape by the bottom droplet, and at t = 1.5 ms, the central jet bounced upward from the bottom to touch the upper bubble shell. At t = 2 ms, the central jet protruded out from the bubble and extended upward. The central jet was generated due to the movement of the liquid along the bubble shell. The outside flowing liquid spread out in a disc pattern, and the liquid flowing toward the inside accumulated at the central part, forming a central jet. Furthermore, the bubble volume affected the height of the central jet, even causing a central jet breakup. For plant irrigation, liquid loss should be suppressed to prevent pesticide loss and environmental pollution.

3.2. Effect of Bubble Volume on Central Jet Breakup

The deposition of hollow water droplets with different bubble volumes after they impacted the hydrophilic surface is illustrated in Figure 7. As observed in Figure 7, the height of the central jet increased with  V * . At  V * ~0.04, the height of the central jet increased constantly when t increased from 0 to 3 ms, and then decreased at t = 5.5 ms. At  V * ~0.07, the height of the central jet increased consistently until t = 5 ms and decreased gradually till t = 9 ms. At  V * ~0.13 and 0.17, with increasing bubble size, the breakup of the central jet was initiated for the hollow droplets at t = 7.5 ms at  V * ~0.13 and t = 14 ms at  V * ~0.17. They both exhibited ejected drops, and then the central jet extended upward and separated from the bottom. The data of 15 cases of hollow water droplets impacting the surface are diagrammed in Figure 8, where  V *  ranges from 0.03 to 0.23. In Figure 8, the phenomenon of jet breakup becomes more frequent as the bubble size increases. When  V *  varied between 0.03 and 0.15, less jet breakup was evidenced, and the average  H max *  was about 0.7. As  V *  varied between 0.15 and 0.23, the jet breakup occurred frequently, while the average  H max *  was about 1.26. According to the experimental data, for a hollow water droplet with an impact velocity of U = 2.58 m/s and We of 350~391, the bubble volume fraction of  V * ~0.15 can be defined as a central jet breakup threshold. Beyond this threshold, the central jet of hollow water droplets will easily break and cause liquid loss.
To understand the mechanism of the formation of the central jet and the effect of bubble volume on the internal pressure of the hollow droplet, the pressure distributions in two typical hollow droplets ( V * ~0.05 and  V * ~0.2) are compared in Figure 9. At t = 0.2 ms, the hollow droplet of  V * ~0.05 had a small middle cavity and the cavity pressure was 2337 Pa, while the hollow droplet of  V * ~0.2 had a relatively large middle cavity with a lower pressure of 1624 Pa. Both of the bottom pressures were 4000 Pa. At t = 0.3 ms, the red-colored bottom region of the hollow droplet of  V * ~0.2 split, and the maximum pressure remained at 4000 Pa, while the pressure in the yellow-colored middle region decreased to 3287 Pa. This caused the liquid to flow from the red-colored region to the middle part, triggering the formation of the central jet. But the bottom of the hollow droplet of  V * ~0.05 had not yet split. At t = 0.6 ms, both exhibited a central jet, but the size of the central jet corresponding to  V * ~0.2 was relatively large. Through a comparison of the pressure distribution, it was demonstrated that the formation of the central jet depends greatly on the internal pressure difference, which drives the liquid flow from the bottom to the central part. It is also concluded that the larger the bubble volume, the greater the internal pressure difference for the hollow droplet, and so the formation of the central jet is facilitated.

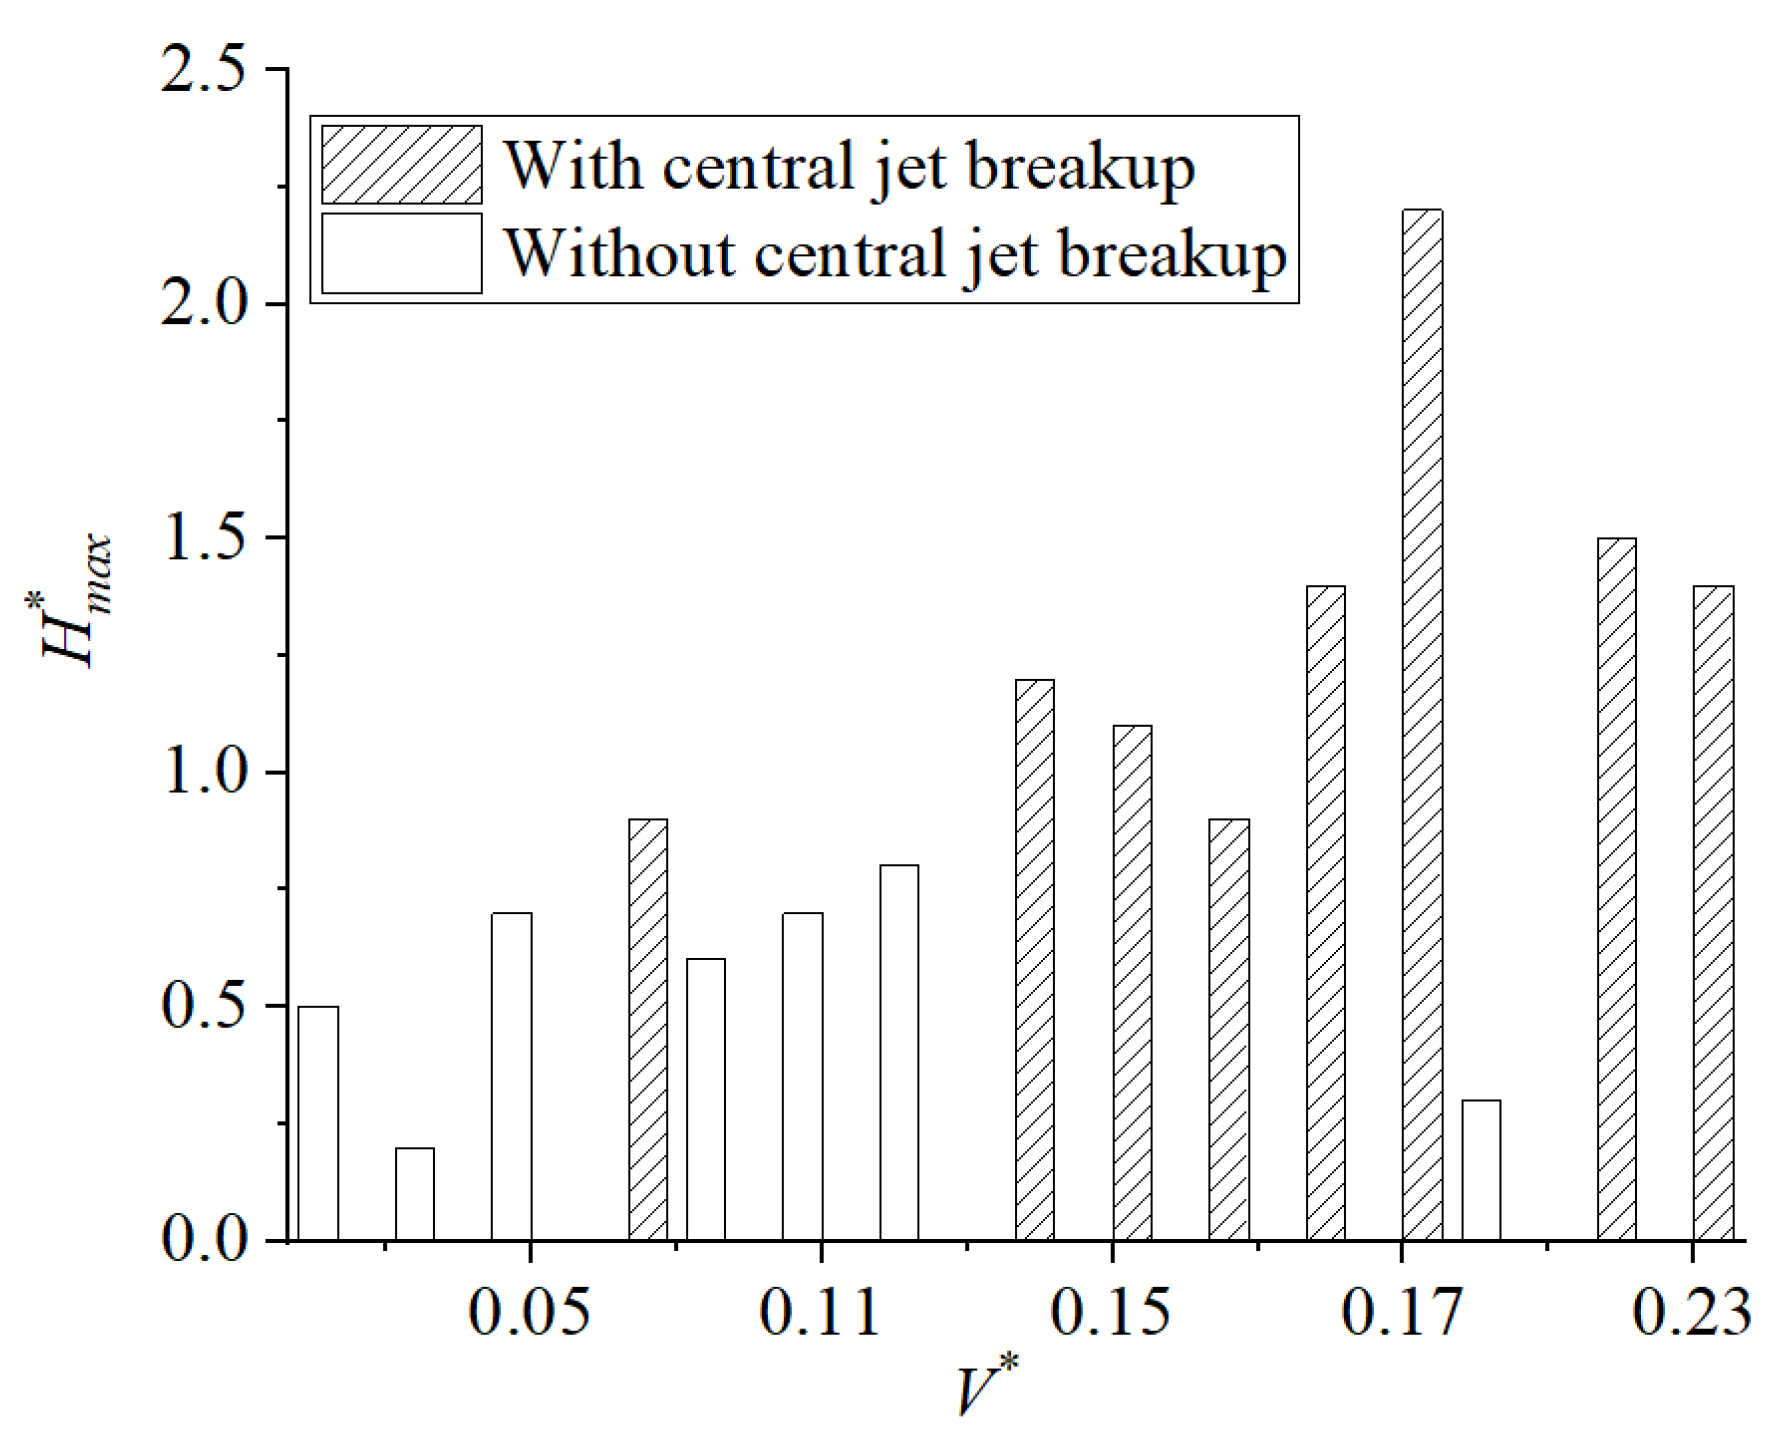
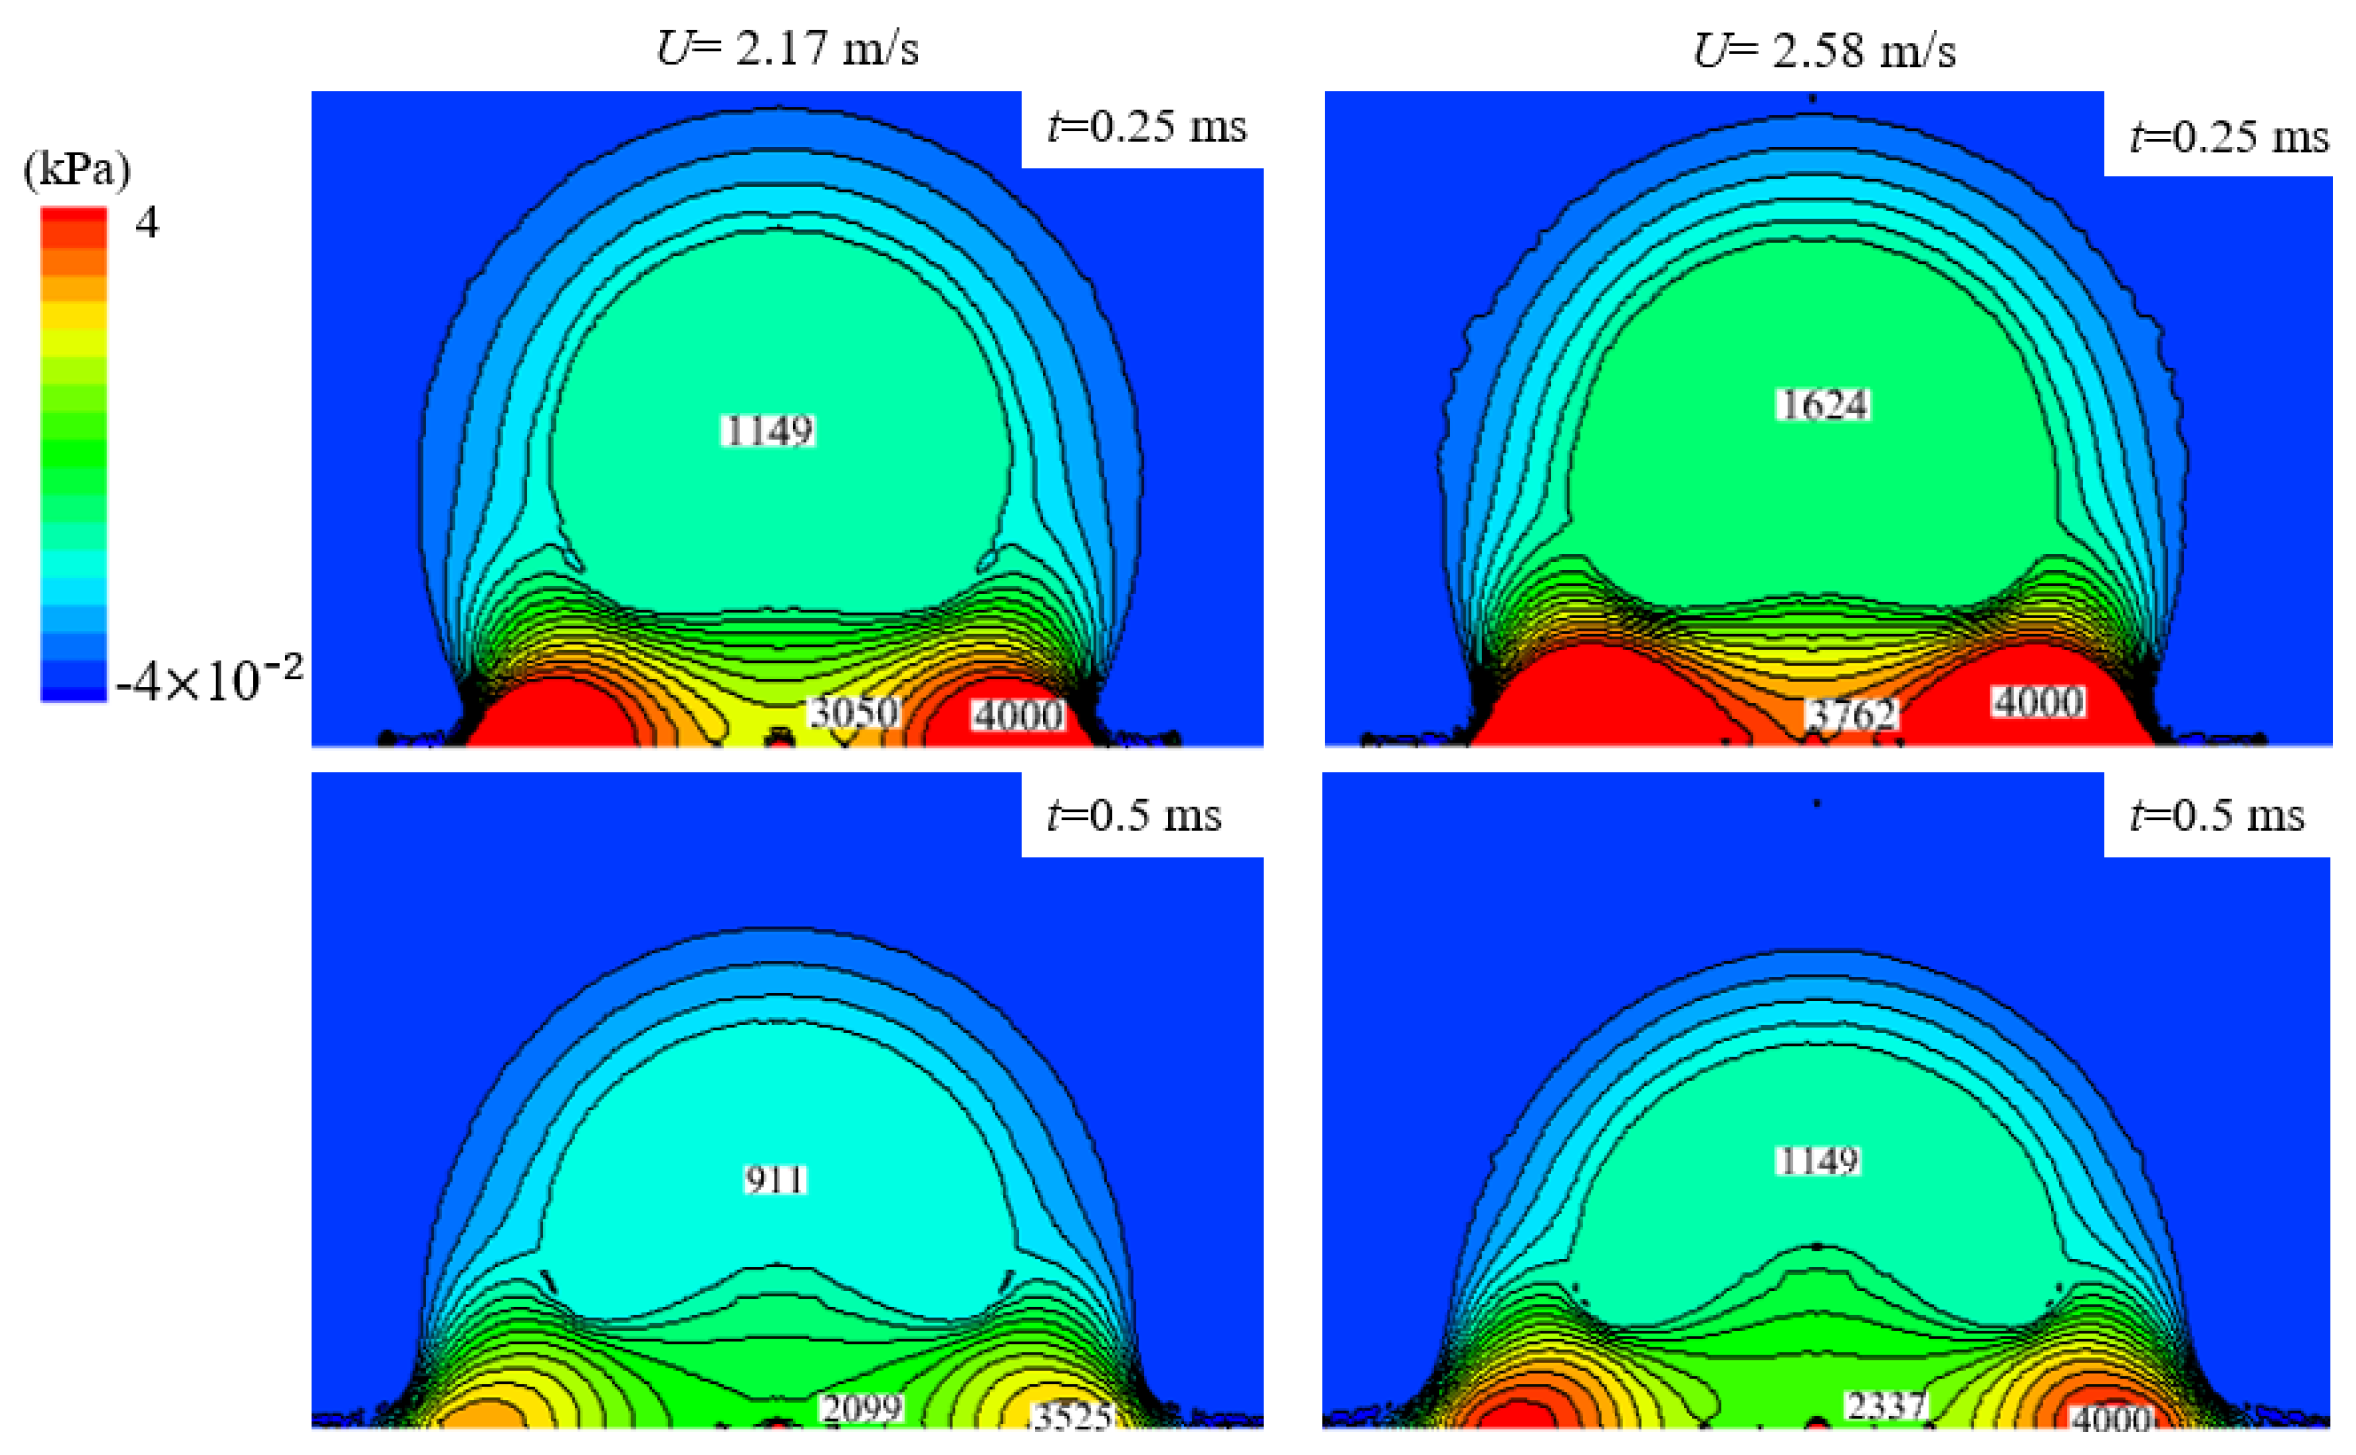
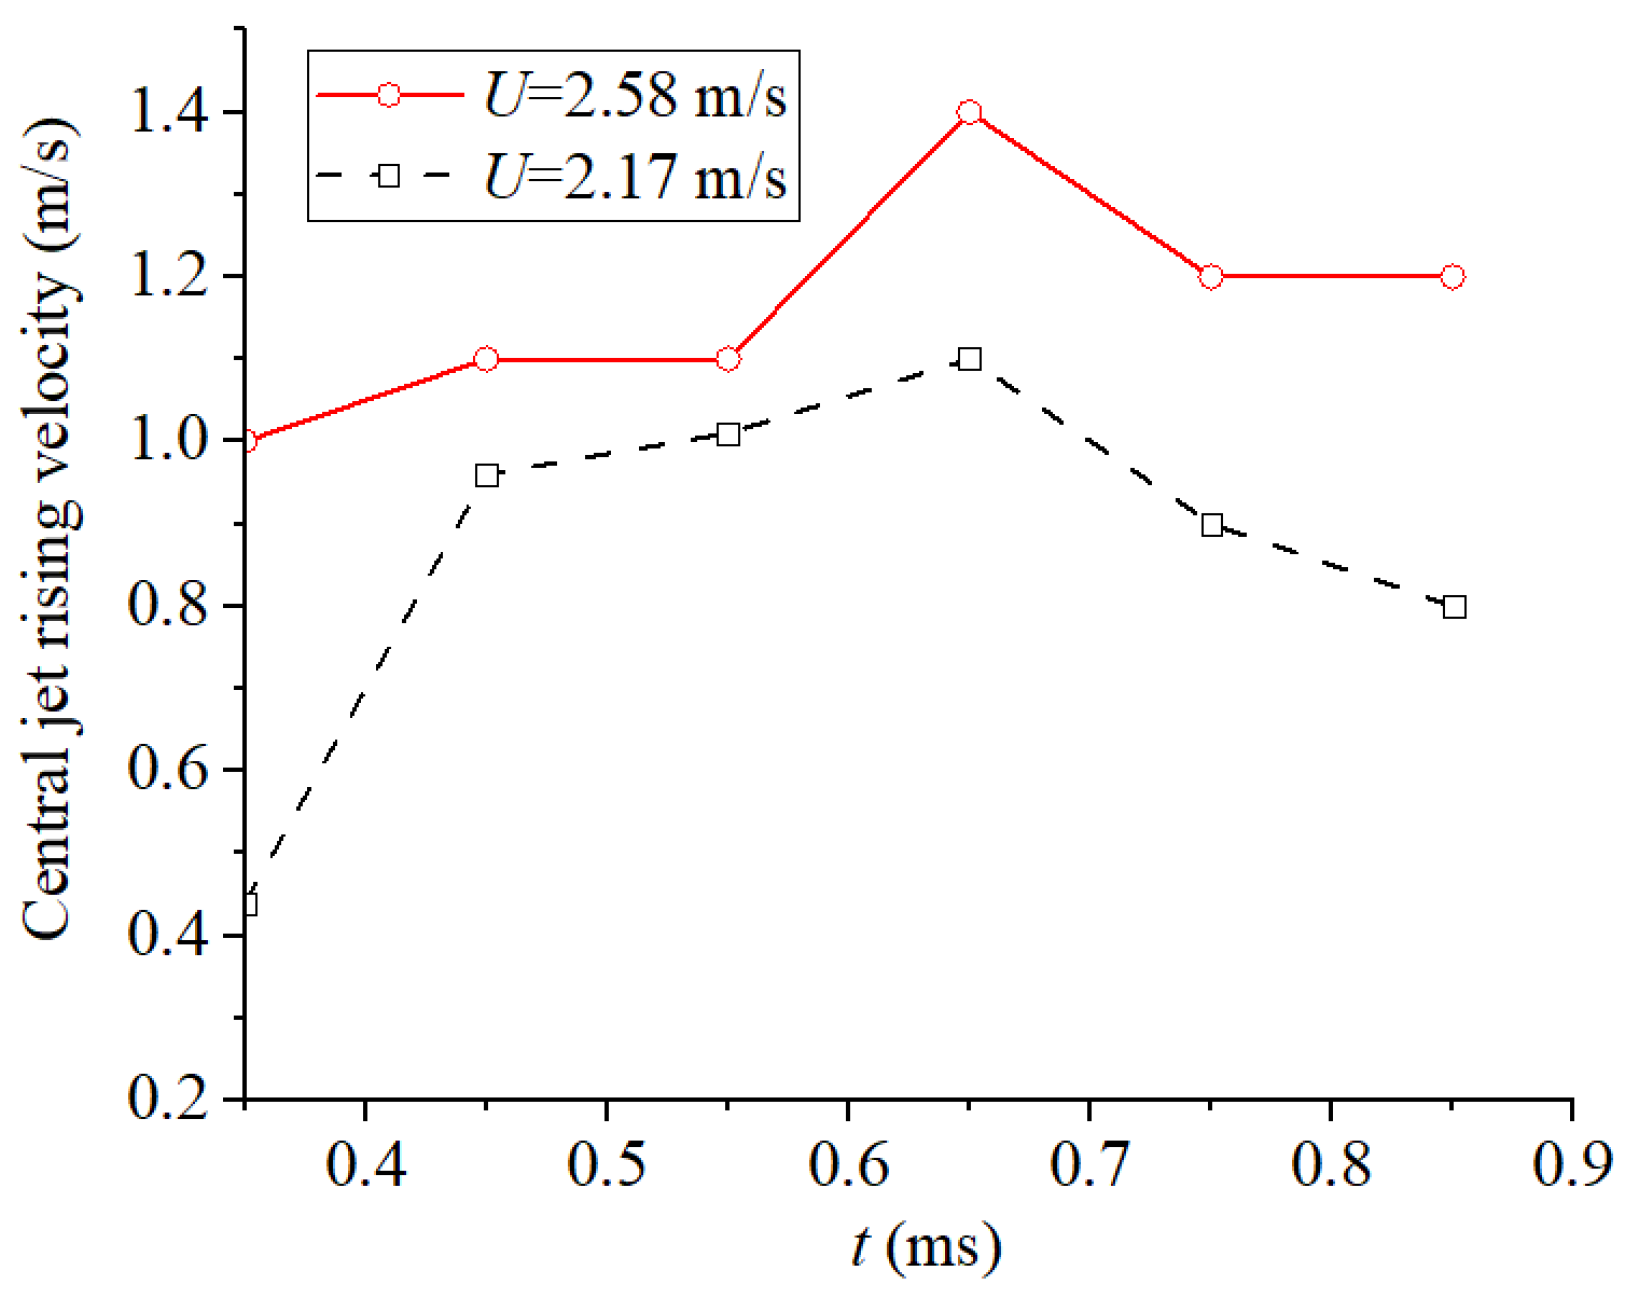
3.3. Effect of Impact Velocity on Central Jet Breakup

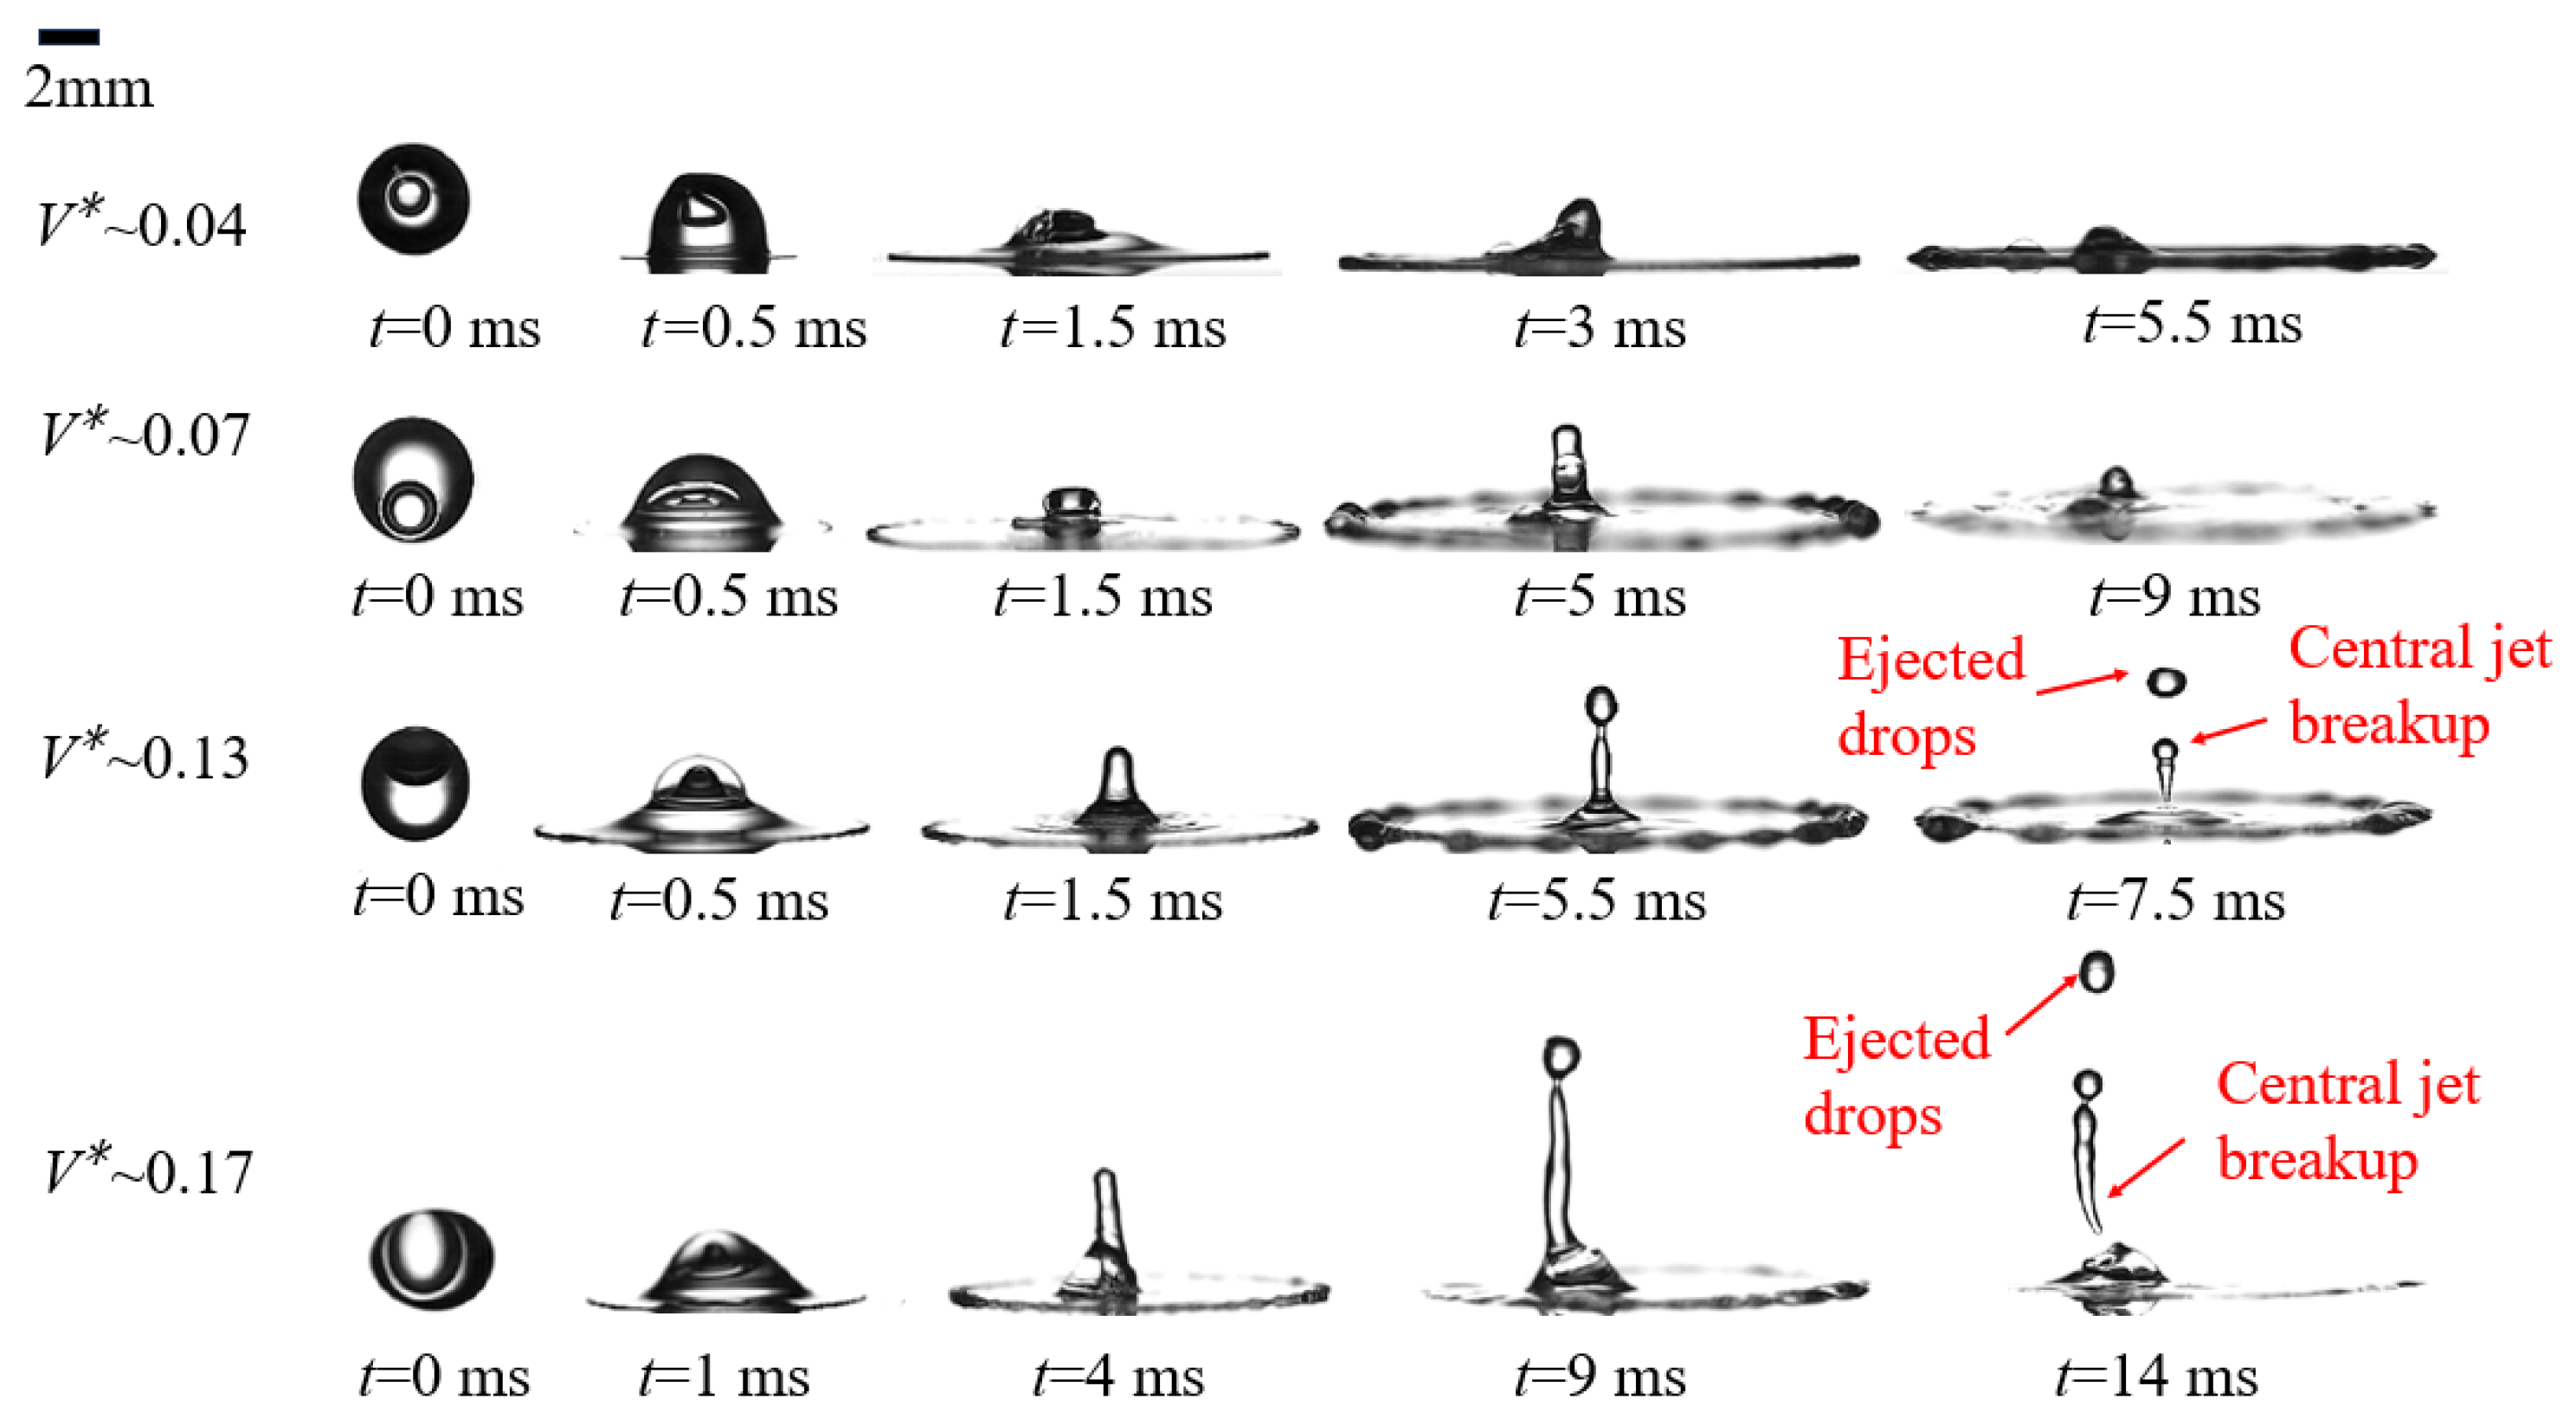
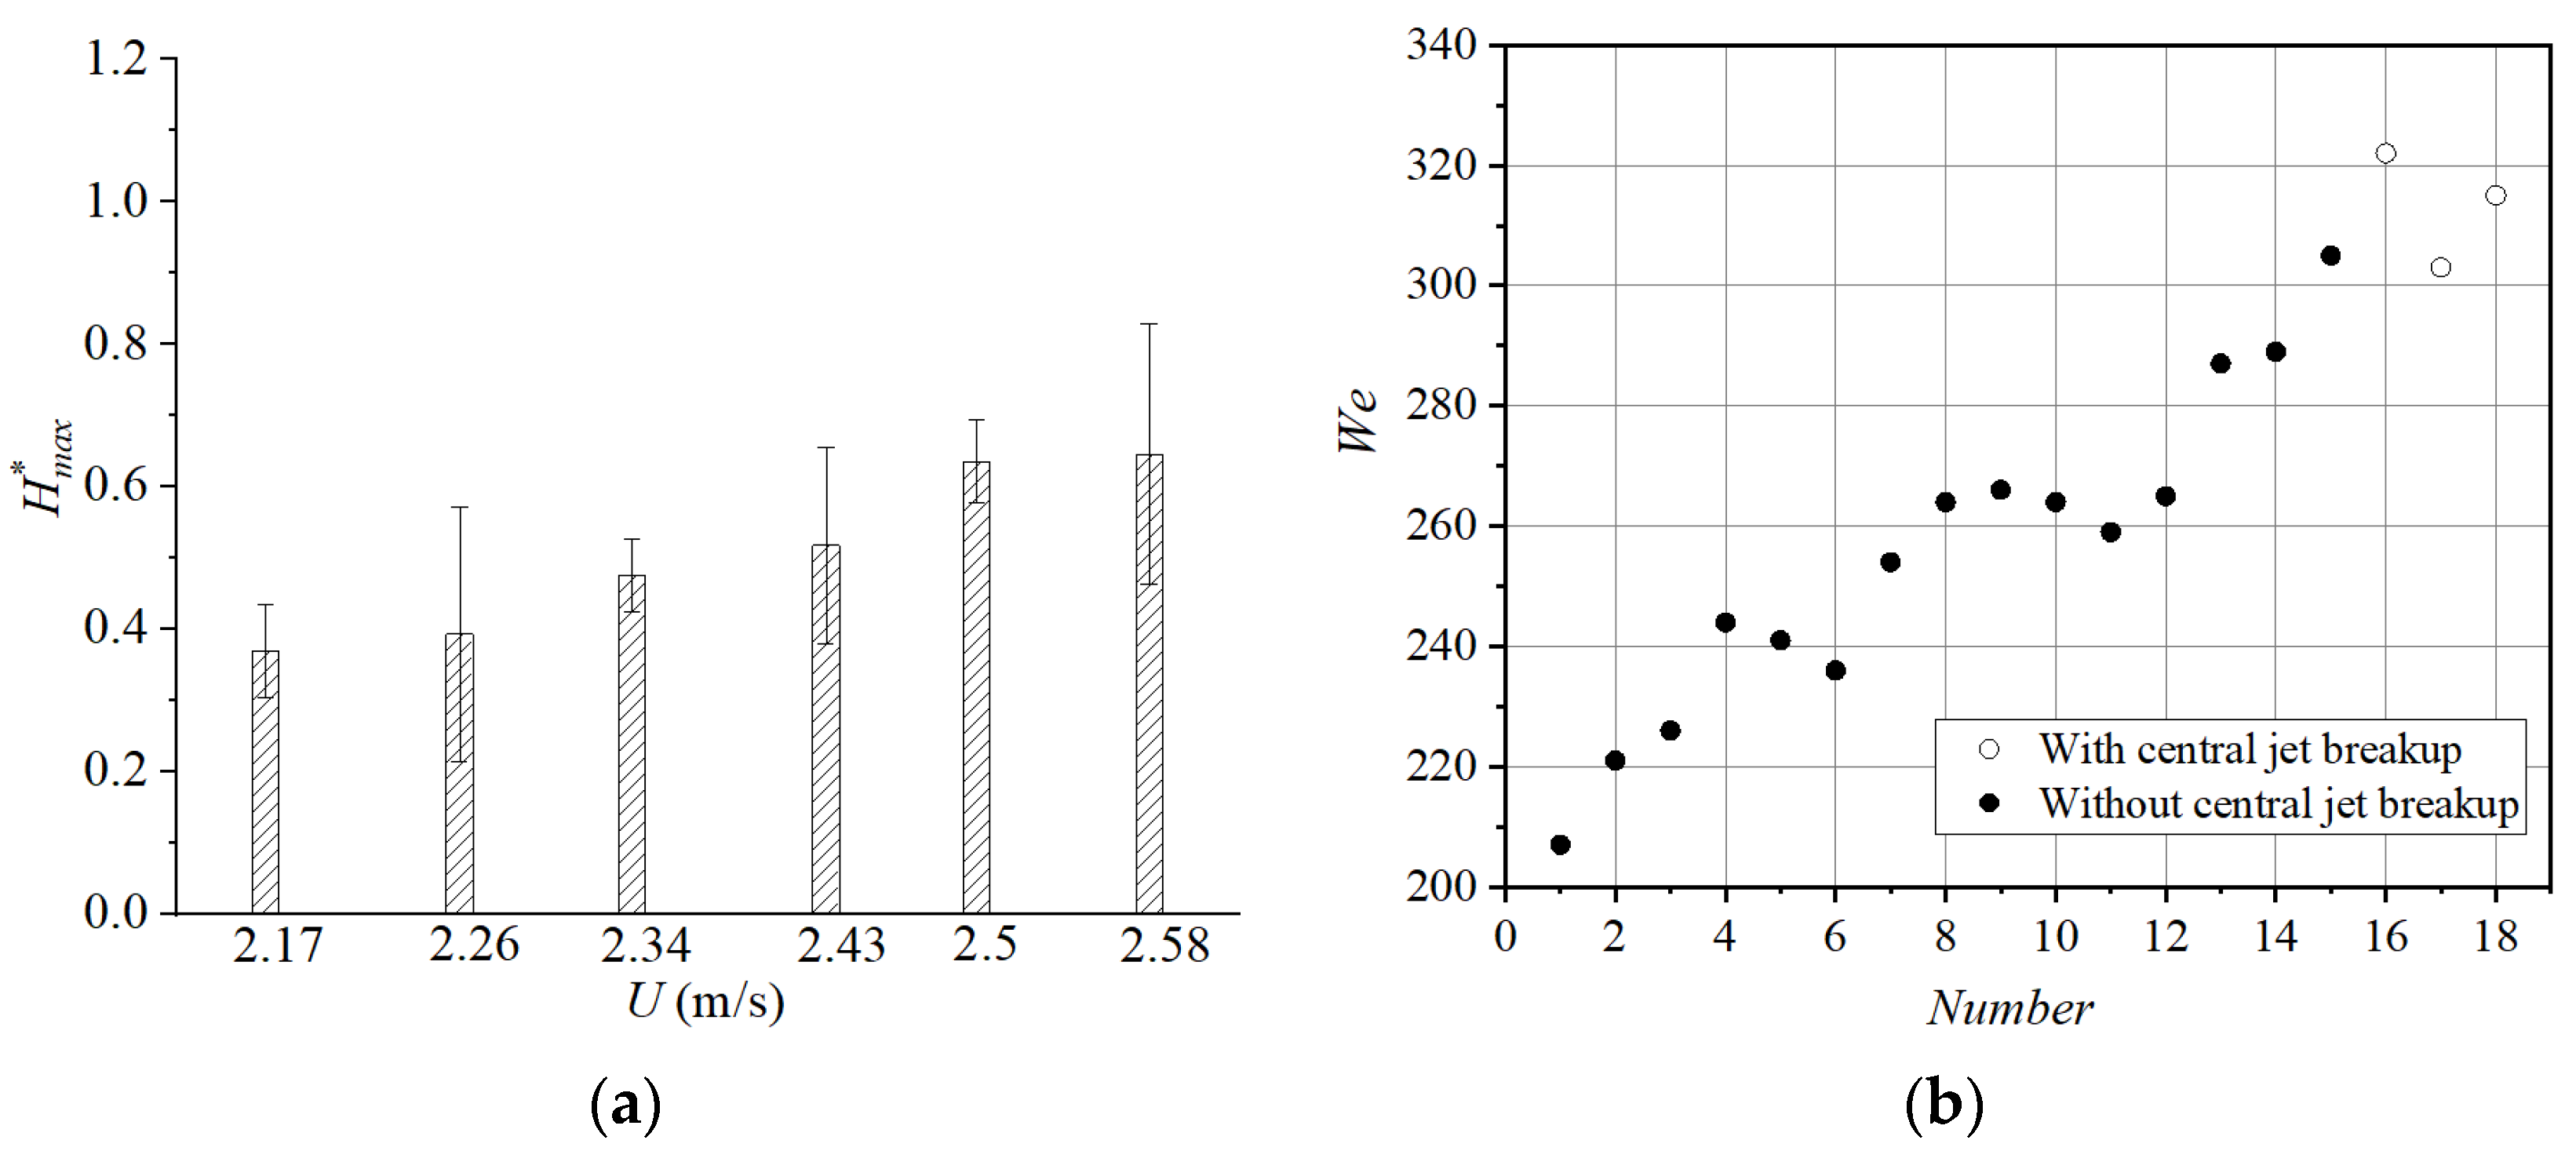
3.3.1. Central Jet Breakup of Hollow Droplet with  V * ~0.05 at Different Impact Velocities

To describe the effect of the impact velocity (U) on the breakup of the central jet, hollow droplets with a small bubble volume fraction of 0.05 were selected, and the experimental result is shown in Figure 10. As the impact velocity increased, the central jet became prominently protruding. At U = 2.17~2.34 m/s, there was no breakup of the central jet. But at U = 2.58 m/s and t = 13 ms, the extending central jet broke up when it interacted with the bubble and then ejected out. The increase of the impact velocity fed the central jet with more rebounding kinetic energy, resulting in the jet ascending and even breaking up. More detailed results are shown in Figure 11. In Figure 11a, as the impact velocity of the hollow droplet increased, the maximum central jet height factor  H max *  also increased. The smallest  H max *  was 0.369, while the largest was 0.646. In Figure 11b, it is seen that when We varied between 200 and 300, hollow droplets of  V * ~0.05 produced central jets, but the central jets hardly broke. At We > 300, the central jet breakup initiated. Based on the obtained results, to avoid central jet breakup and ensure precise droplet deposition, We of hollow droplets of  V * ~0.05 should not exceed 300.

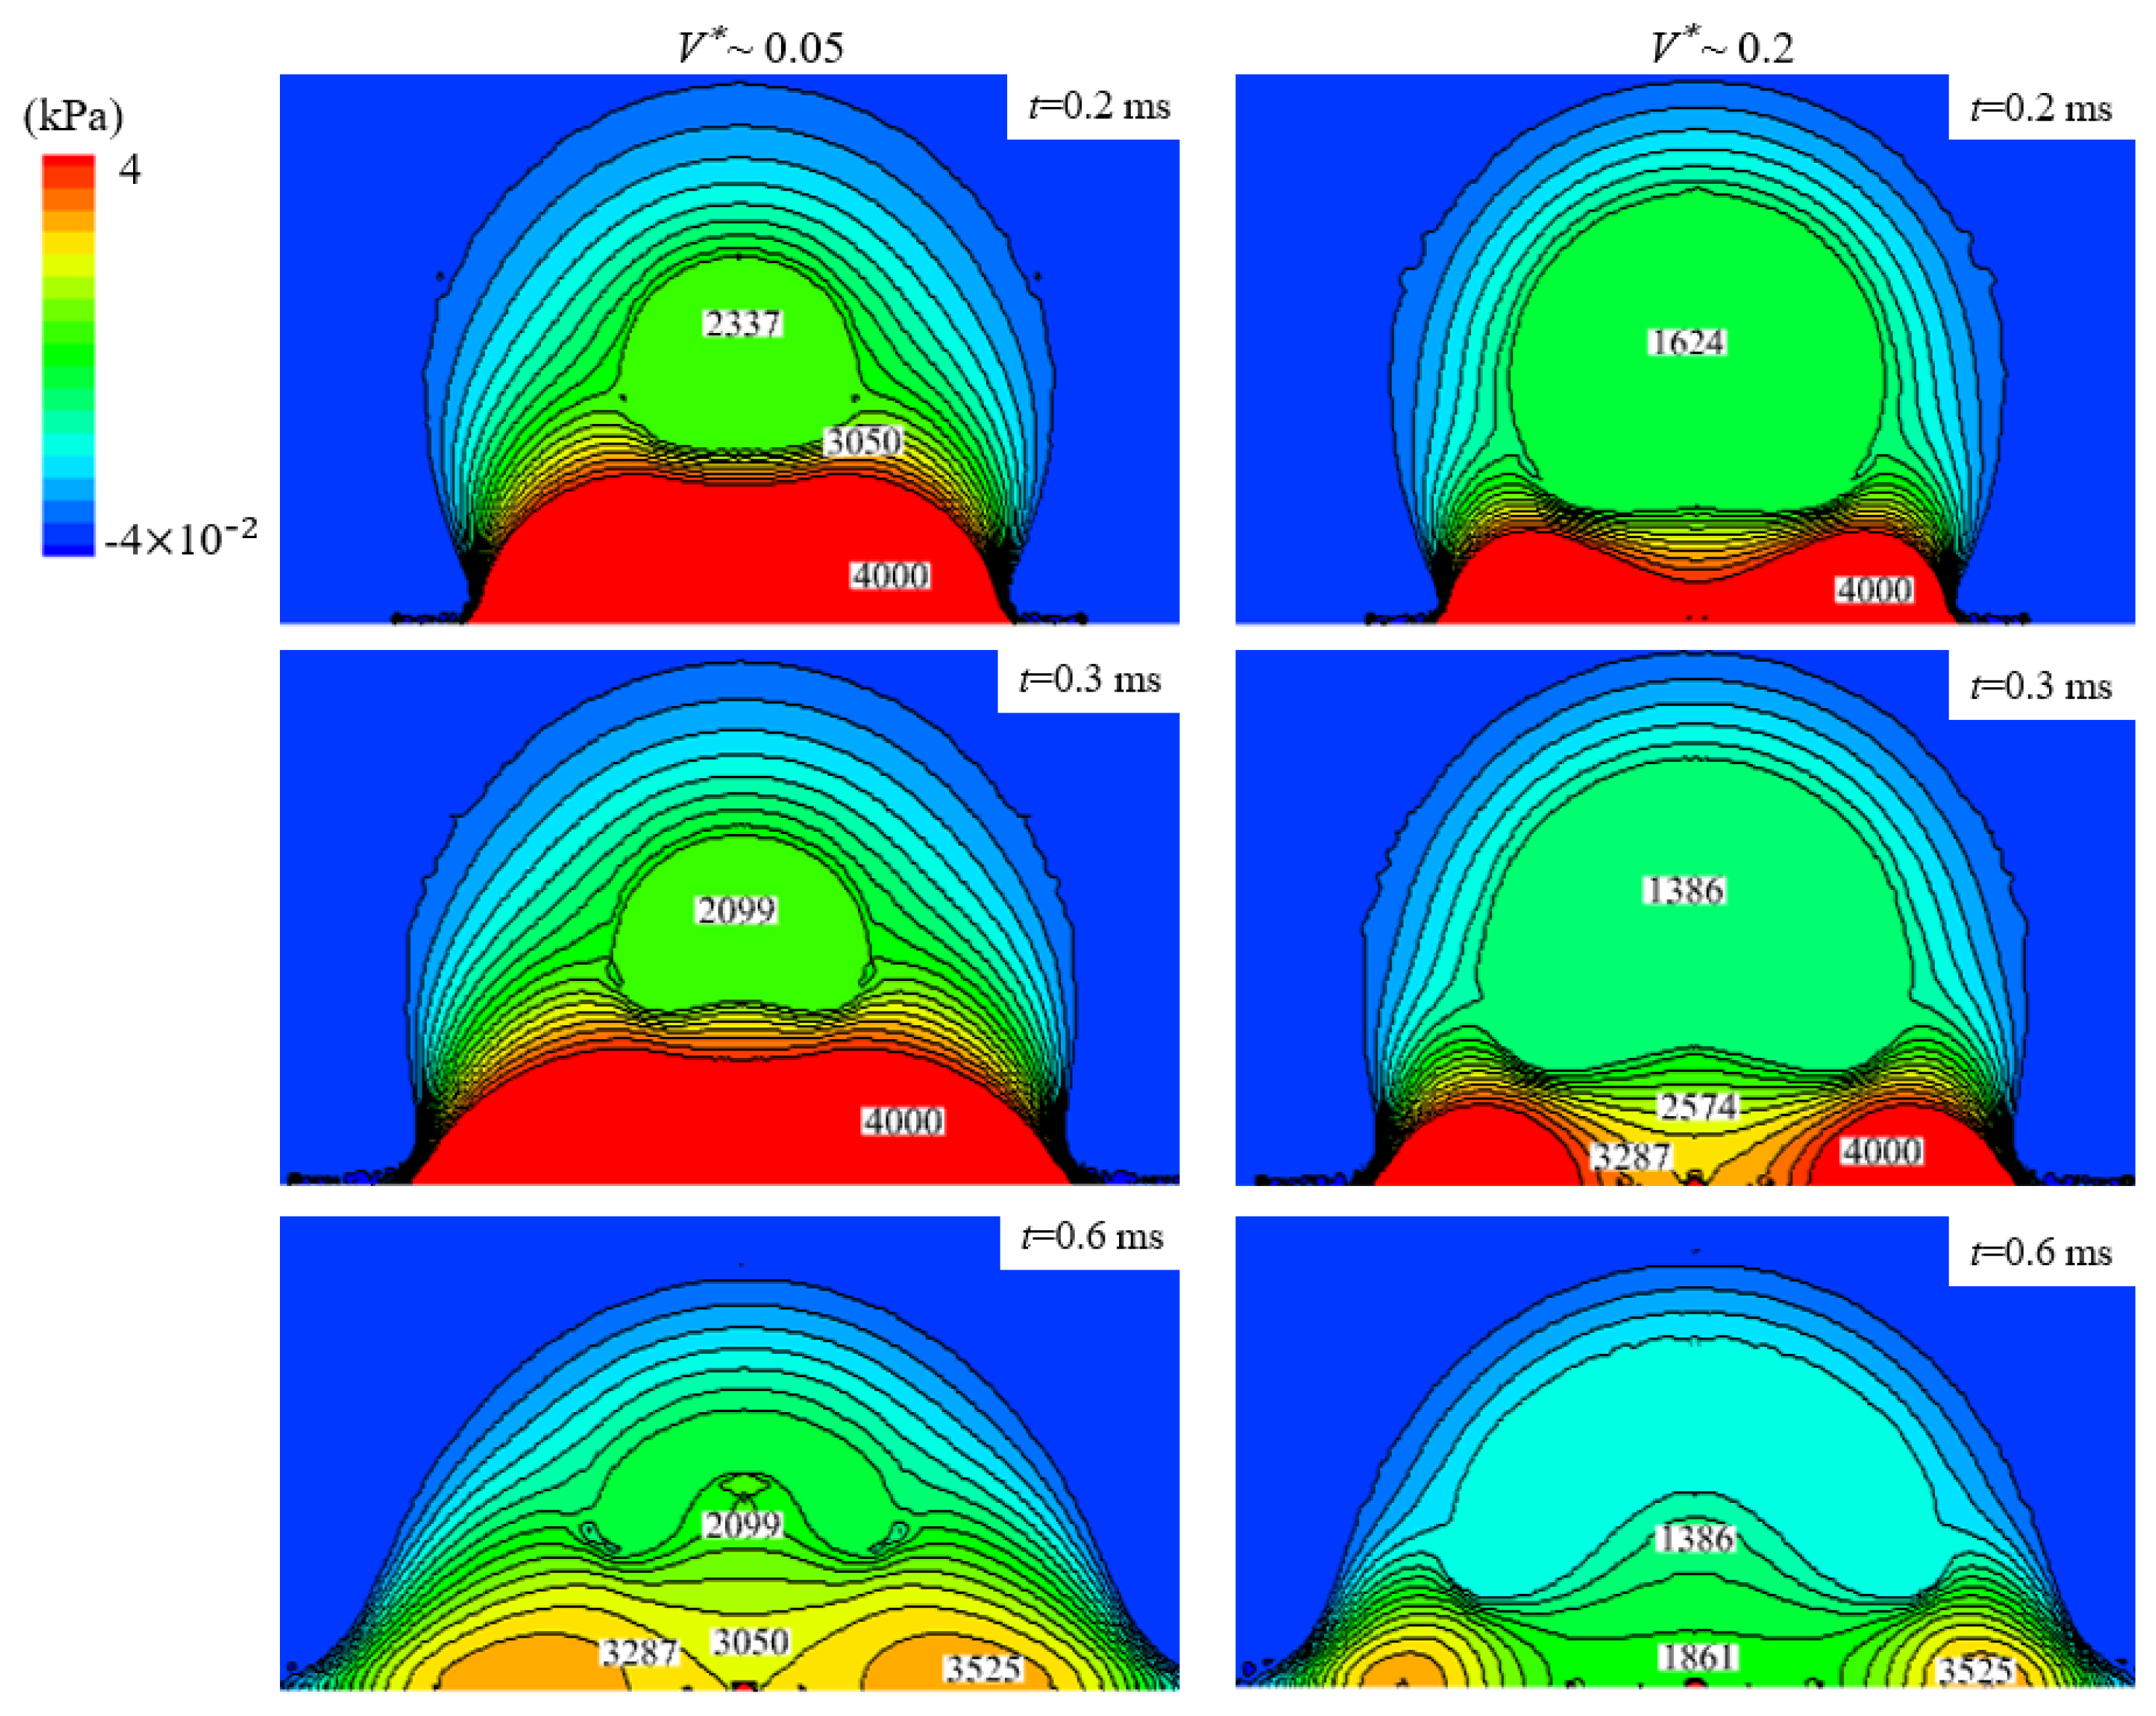
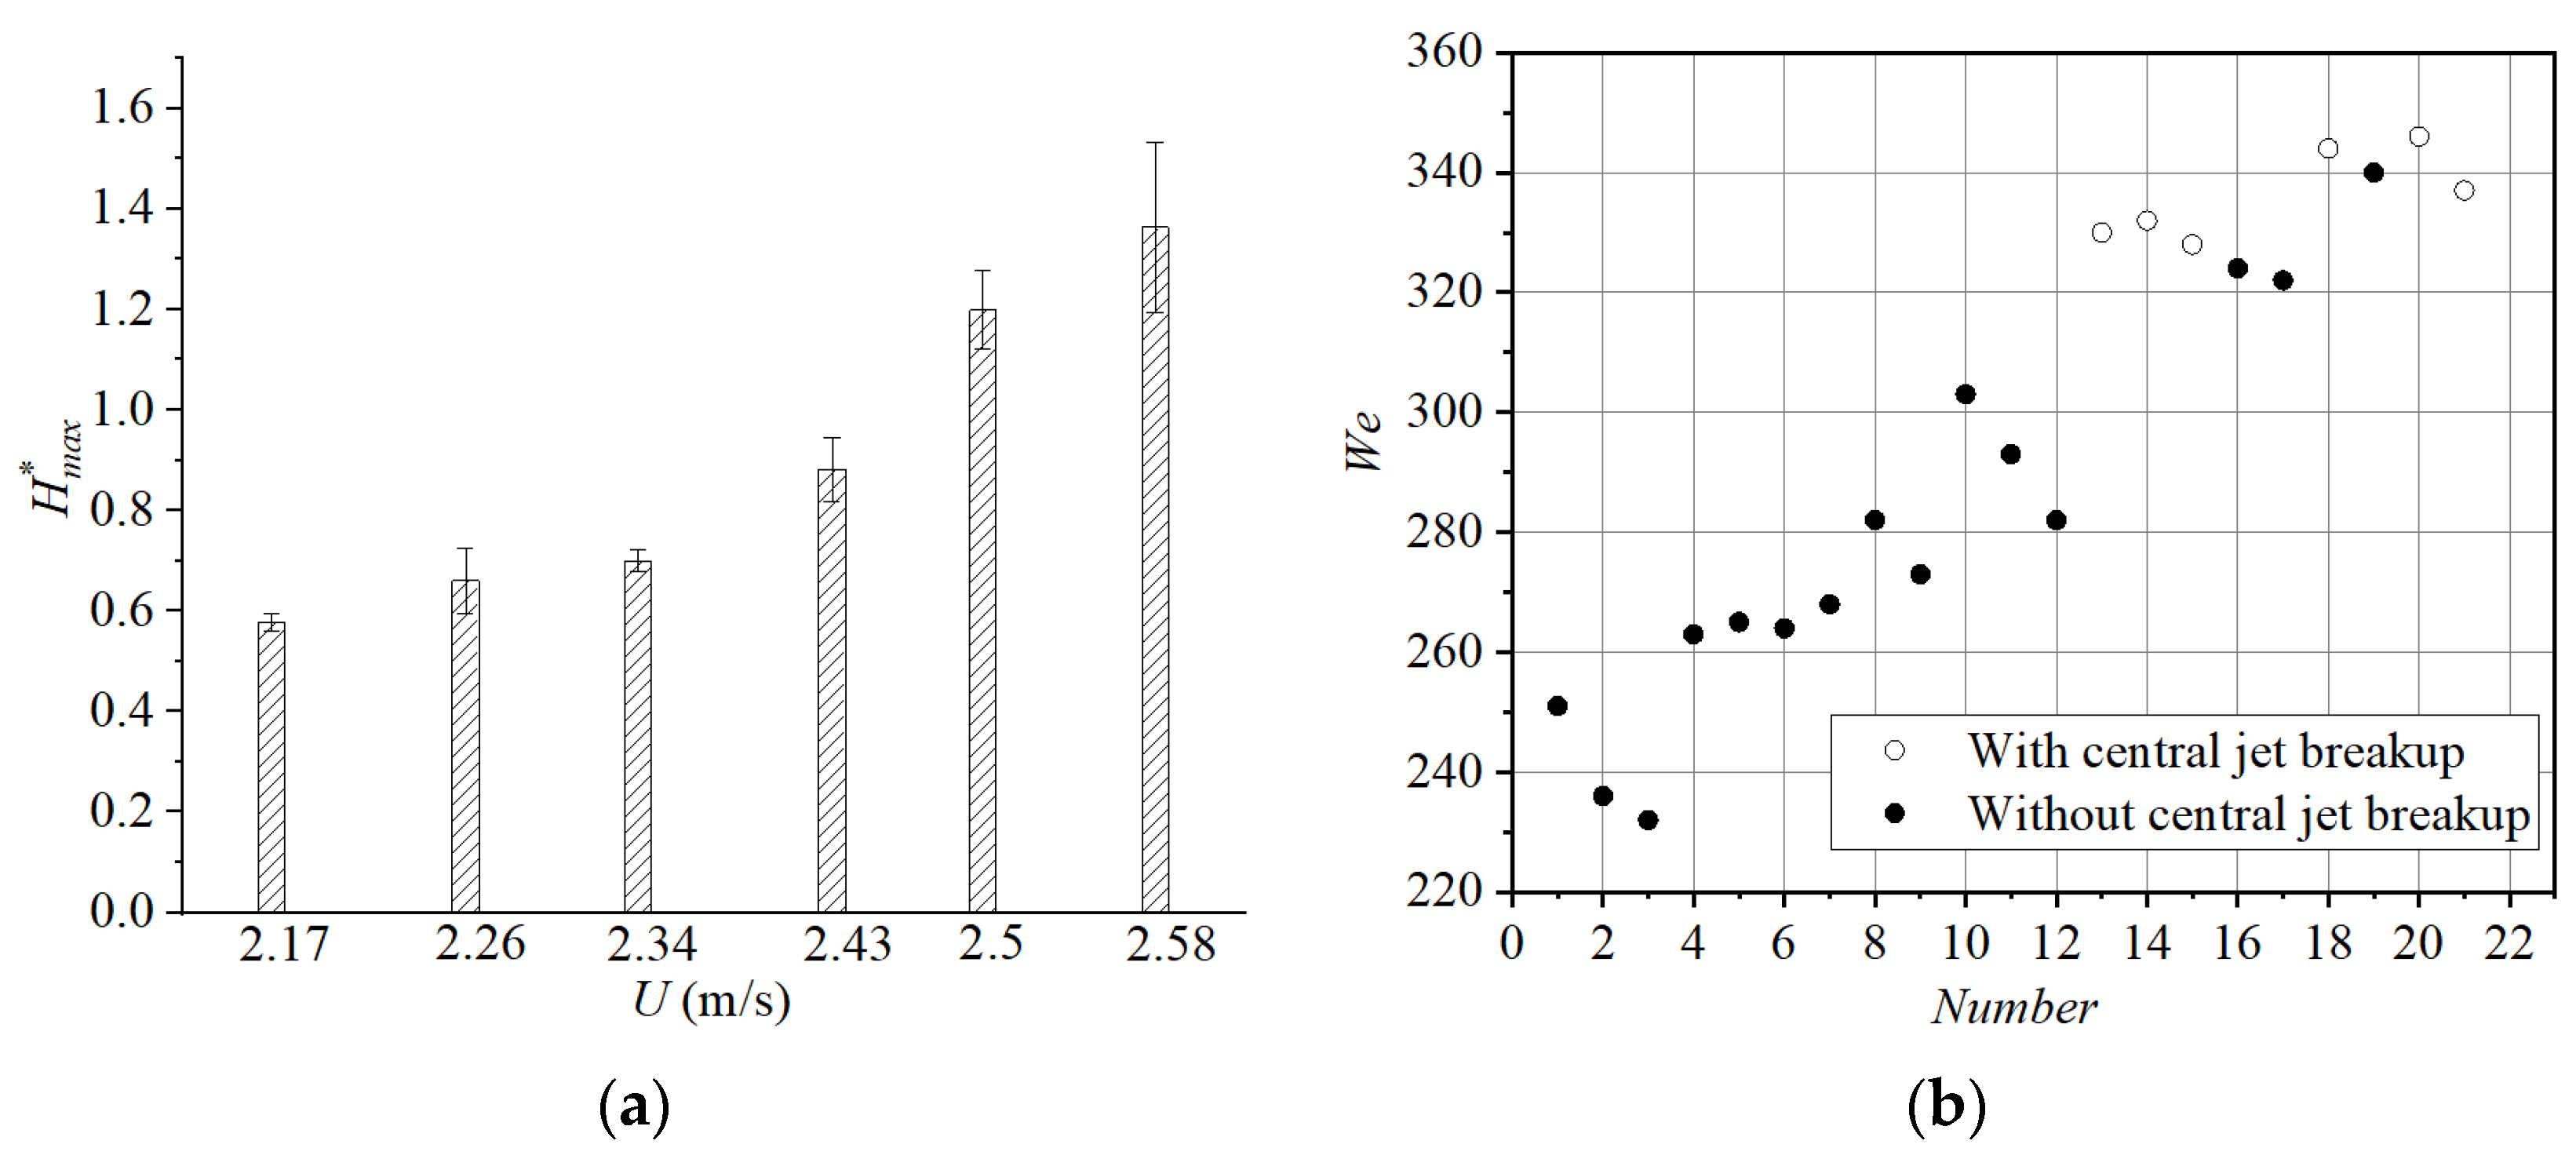
3.3.2. Central Jet Breakup of Hollow Droplet of  V * ~0.2 at Different Impact Velocities

For hollow droplets of  V * ~0.05, the volume of central jet breakup is relatively small, but for hollow droplets containing large bubbles, such as  V * ~0.2, the loss of liquid cannot be ignored. As shown in Figure 12, at U = 2.17 m/s, the central jet is clearly evidenced at t = 4.5 ms, and the tip of the jet drops at t = 8~12 ms. At U = 2.50 m/s and t = 4 ms, the central jet passed through the bubble which did not collapse but was squeezed to the left. At t = 6 ms, a small drop took form at the tip of the jet, and at t = 7 ms, the small drop ejected out, releasing a portion of the kinetic energy of the jet. This represents a pattern of partial central jet breakup. At U = 2.58 m/s and t =10 ms, the central jet ascended quite high and the liquid at the junction between the jet and the bottom was thin. Eventually, at t = 12 to 13 ms, the entire central jet ejected out, exhibiting a complete central jet breakup. More detailed results are shown in Figure 13. In Figure 13a, as the impact velocity of the hollow droplet increased, the maximum central jet height factor  H max *  increased gradually. The smallest  H max *  was 0.577, while the largest was 1.363. In Figure 13b, when We increased from 220 to 300, clear central jets but no jet breakup was recognized. However, as We varied between 320 and 360, the probability of central jet breakup increased, and according to Figure 12, the jet volume corresponding to  V * ~0.2 was much larger than that at  V * ~0.05, and the liquid loss was more remarkable. For the hollow droplets of  V * ~0.2, to avoid central jet breakup and ensure precise droplet deposition, We should not exceed 300, similar to that associated with  V * ~0.05.
In Figure 14, at U = 2.17 m /s and t = 0.25 ms, the pressure at the bottom center was 3050 Pa, and the pressure in the air cavity was 1149 Pa. At t = 0.5 ms, the maximum pressure in the yellow-colored area at the bottom was 3525 Pa, and the pressure at the bottom center was 2099 Pa, while the pressure in the air cavity was 911 Pa. The pressure difference between the yellow-colored area and the air cavity was 2614 Pa. At U = 2.58 m /s and t = 0.25 ms, the pressure at the bottom center was 3762 Pa. At t = 0.5 ms, the maximum pressure in the red-colored area of the bottom was 4000 Pa, and the pressure at the bottom center was 2337 Pa, while the pressure in the air cavity was 1149 Pa, and the pressure difference between the red-colored area and the air cavity is 2851 Pa. Therefore, it is concluded that when the impact velocity increases, the bottom pressure increases as well, and the pressure difference between the bottom and the air cavity is enlarged. Consequently, the formation of the central jet is accelerated, and the central jet is extended. A comparison of the central jet rising velocity at two different impact velocities is illustrated in Figure 15. It is evidenced that high impact velocity is responsible for high central jet rising velocity.

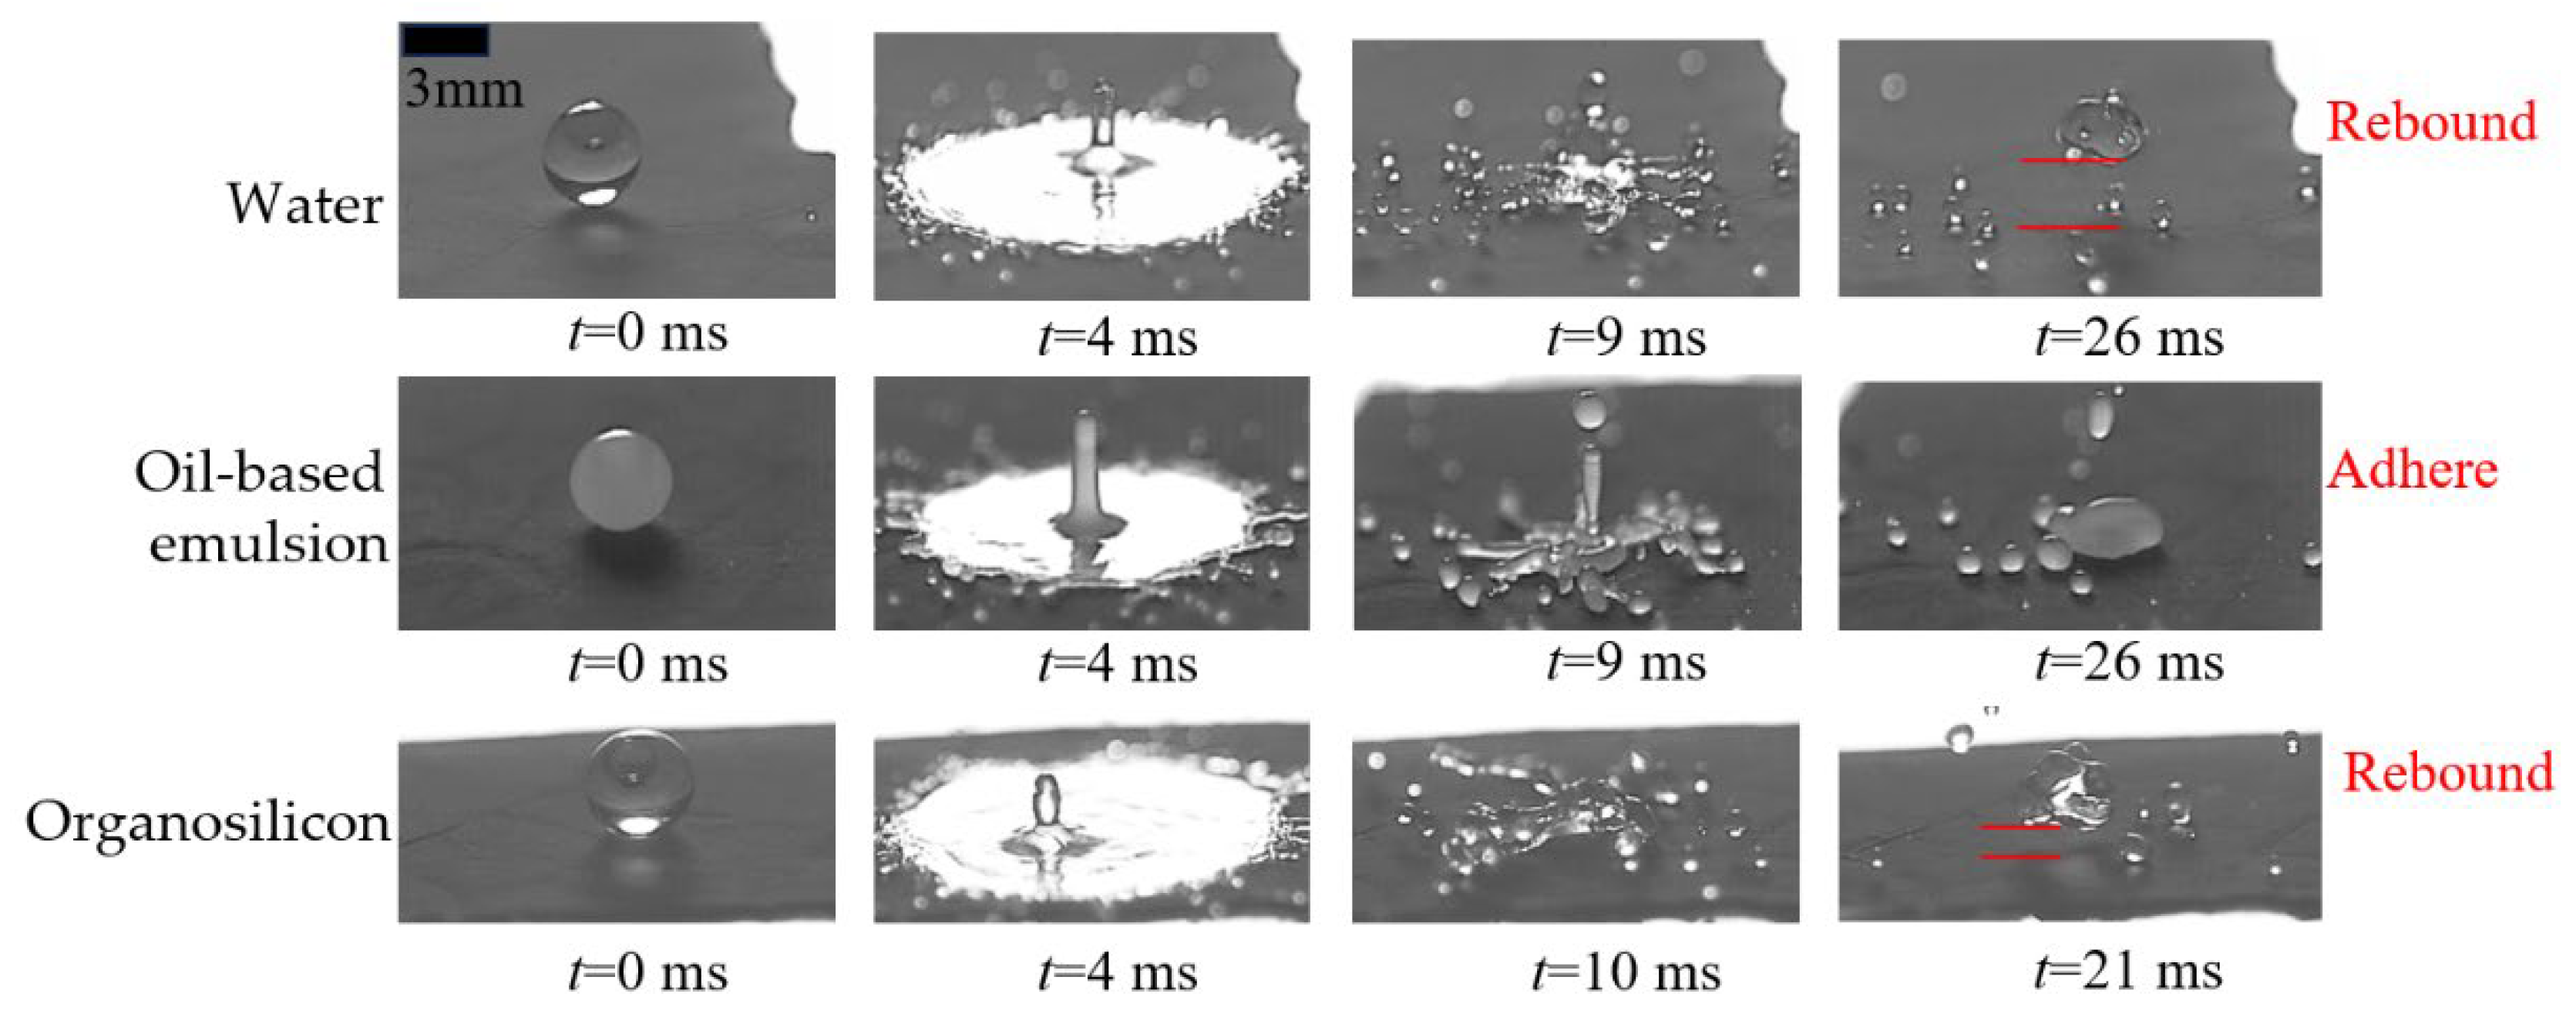
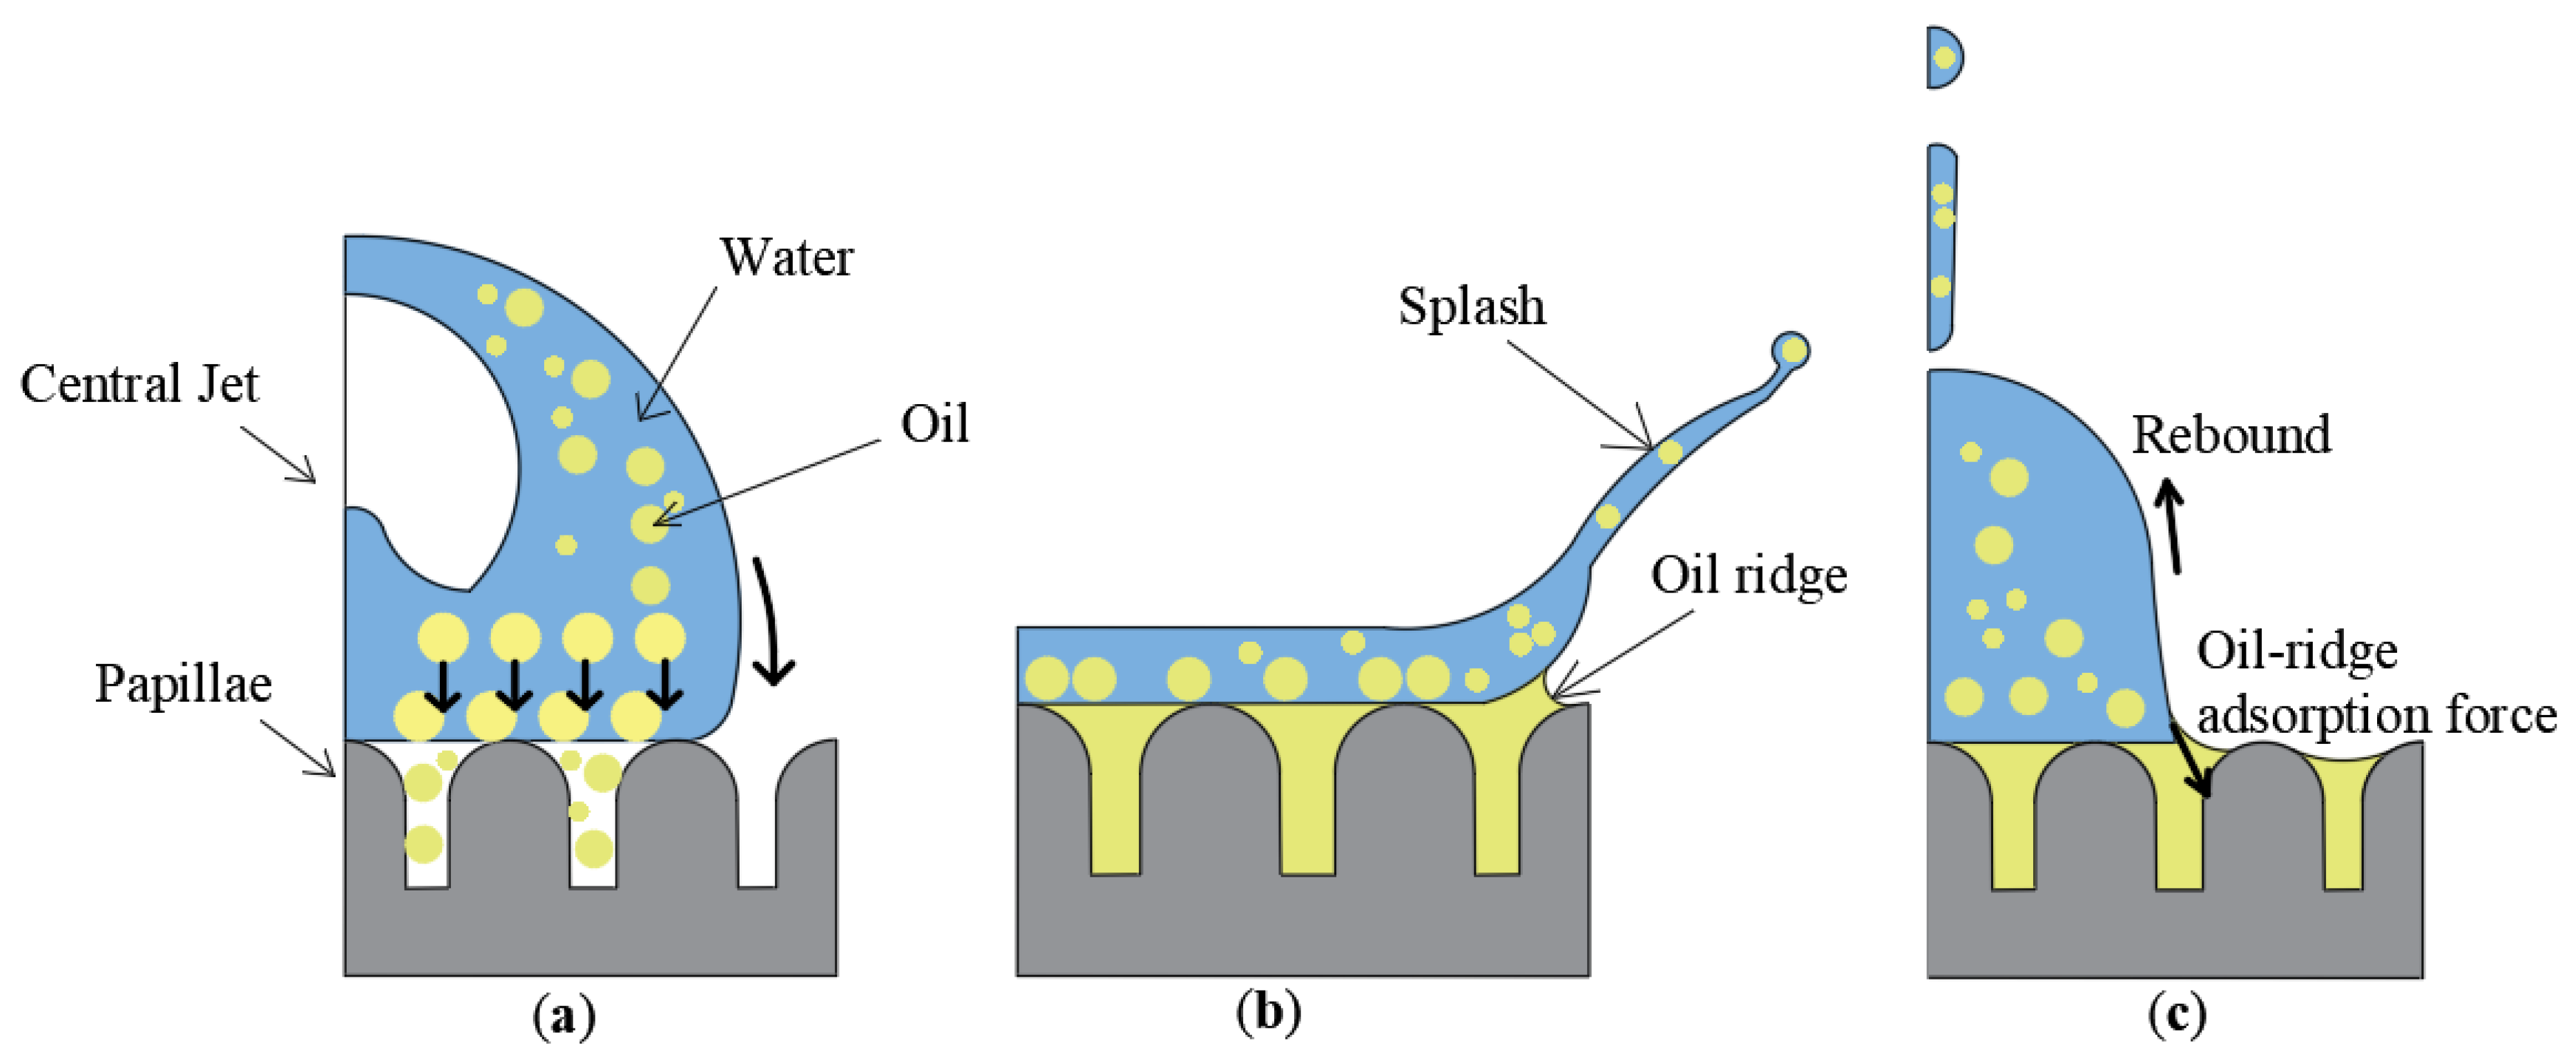
3.4. Effect of Oil-Based Emulsion on the Retention of Hollow Droplets

The static surface tension and dynamic viscosity of water, emulsion and organosilicon were tested, and the result is shown in Table 1. The evolution of three hollow droplets corresponding to the three liquids is illustrated in Figure 16. Three hollow droplets separately impacted the hydrophobic leaf surface. In the spreading stage, the central jet was remarkable at t = 4 ms, which is shared by the three cases. The water hollow droplet rebounded off the surface at t = 26 ms. The 0.02% organosilicon hollow droplet rebounded off at t = 25 ms. In contrast, the 0.8% emulsion hollow droplet adhered to the surface. According to the data in Table 1, the static surface tension of the 0.8% emulsion and the 0.02% organosilicon are similar, and the dynamic viscosity was nearly equivalent. Therefore, we can exclude the effects of viscosity and surface tension on droplet adsorption. Regarding the difference of the deposition of the oil-based emulsion droplet, the behaviors of oil molecules in the emulsion are expected to be considered.
The hydrophobicity of the lotus leaves is closely related to the papillae and gaps [36]. When a water droplet contacts the surface, the air in the gap is locked up, forming an air bag. The water droplet is only at a point of contact with the papillae. Therefore, under the action of surface tension, the water droplet contracts into a sphere and rolls freely over the surface. However, there are many oil molecules distributed in the oil-based emulsion. When the hollow droplet of the oil-based emulsion hits the hydrophobic leaf in the impact stage, as shown in Figure 17, the oil molecules move rapidly downward due to inertia and then penetrate into the texture gaps of the leaf surface. In the spread stage, the droplet exhibits a splashing form; meanwhile, more oil molecules accumulate to fill the gap, and an oil ridge is created at the edge. As reported in [37], oil molecules can lubricate hydrophobic surfaces. The oil molecules will separate the droplet from the hydrophobic surface and cause viscous dissipation during retraction, and the rebounding kinetic energy of the droplet is thereby reduced. In the rebound stage, the central jet breakup entails additional loss of rebounding kinetic energy of the droplet. At this point, the oil ridge will produce a downward adsorption force led by the capillary force to inhibit the droplet rebounding. Eventually, due to the loss of energy and the restraint of adsorption force, the droplets adhere to the hydrophobic leaf surface.
To find the critical emulsion concentration (C) at which the hollow emulsion droplets shift from rebounding to adhering on the surface, different emulsion concentrations were considered. In Figure 18, at C = 0.2% and t = 8 ms, the shrinking liquid of the hollow droplet was divided into upper and lower parts, where the lower part was dominated by the liquid contracting onto the surface. The upper part acted as a central jet that continues to move upward. Eventually, at t = 21 ms, driven by the inertia of the upper part, the lower part was also pulled off from the surface, resulting in droplet rebounding. At C = 0.4% and t = 9 ms, the same rebounding pattern was evidenced. But the lower part of the droplet was apparently restricted by the adsorption force, and then the upper and lower parts were separated. In this case, the upper part ejected out, whilst the lower part remained on the surface (t = 21 ms). The same adhesion pattern was also observed at C = 0.6% and 0.8%. Through the impact experiments, C = 0.4% is considered as the threshold emulsion concentration for hollow droplets of emulsion ( V * ~ 0.1 U ~ 2.58   m / s ) to adhere to the hydrophobic leaf surface.

4. Conclusions

The liquid loss during the deposition of spray droplets weakens the effect of pesticides and even pollutes the environment. In the present study, the phenomenon of central jet breakup during droplet deposition was investigated experimentally and numerically. The adsorption mechanism of hollow droplets of the emulsion on the hydrophobic surface was discussed. The main conclusions drawn from the study are as follows:
(1)
Large bubble volume was responsible for the large attainable height of the central jet. For hollow water droplets with impact velocity of 2.58 m/s, We ranged between 350 and 391, and the bubble volume fraction 0.15 can be roughly defined as a central jet breakup threshold. When the bubble volume fraction varied from 0.03 to 0.15, the central jet breakup was insignificant. When the bubble volume fraction varied from 0.15 to 0.23, the probability of central jet breakup was significantly high. The formation of the central jet depends on the internal pressure difference, which propels the liquid flow from the bottom to the center. The larger the bubble volume, the larger the internal pressure difference, and so the formation of the central jet is more convenient.
(2)
The attainable height of the central jet increased with velocity. For hollow droplets with the bubble volume fraction of about 0.05, as We ranged from 200 to 300, central jets were produced, but the jets hardly broke. At We > 300, the central jet breakup was initiated. For hollow droplets with the bubble volume fraction of about 0.2, as We varied from 220 to 300, the central jet breakup was insignificant. As We increased from 320 to 360, the probability of central jet breakup increased. For the hollow droplets with the bubble volume fraction of 0.05 or 0.2, to avoid central jet breakup, We < 300 is recommended. Meanwhile, high impact velocity results in high bottom pressure, and the pressure difference between the bottom and the air cavity is greater. Consequently, the formation of the central jet is accelerated.
(3)
Emulsion facilitated the adherence of the hollow droplet to the hydrophobic surface. This was attributed to the infiltration of oil molecules into the hydrophobic surface and the resultant formation of an oil ridge, rather than the surface tension or viscosity. Oil molecules will cause viscous dissipation of the shrinking droplet, coupled with energy loss due to the fingering splash and central jet breakup. Eventually, the rebound of the droplets is restrained by the inhibited force from the oil ridge. The emulsion concentration of 0.4% serves as a turning point at which the behavior of the hollow droplets shifts from rebounding to adhering on the hydrophobic surface.

Author Contributions

Methodology, C.G.; funding acquisition, C.G.; project administration, C.G.; formal analysis, F.J.; writing—original draft preparation, F.J.; writing—review and editing, C.K. All authors have read and agreed to the published version of the manuscript.

Funding

This research was funded by the National Natural Science Foundation of China (Nos. 51905220, 52311540154), Natural Science Foundation of Jiangsu Province, China (No. BK20231325) and A Project Funded by the Priority Academic Program Development of Jiangsu Higher Education Institutions (No. PAPD-2023-87).

Institutional Review Board Statement

This study did not require ethical approval.

Data Availability Statement

Data will be made available on request.

Acknowledgments

The authors thank the College of Agricultural Engineering of Jiangsu University for the experimental equipment.

Conflicts of Interest

The authors declare no conflicts of interest.

References

  1. Dai, S.; Wang, M.; Ou, M.; Zhou, H.; Jia, W.; Gao, R.; Wang, C.; Wang, G.; Li, Z.; Chen, H. Development and Experiment of an Online Measuring System for Spray Deposition. Agriculture 2022, 12, 1195. [Google Scholar] [CrossRef]
  2. Zhou, Q.; Xue, X.; Chen, C.; Cai, C.; Jiao, Y. Canopy deposition characteristics of different orchard pesticide dose models. Int. J. Agric. Biol. Eng. 2023, 16, 1–6. [Google Scholar] [CrossRef]
  3. Wu, S.; Liu, J.Z.; Wang, J.S.; Hao, D.H.; Wang, R.K. The motion of strawberry leaves in an air-assisted spray field and its influence on droplet deposition. Trans. ASABE 2021, 64, 83–93. [Google Scholar] [CrossRef]
  4. Solonenko, O.P.; Gulyaev, I.P.; Smirnov, A.V. Plasma processing and deposition of powdered metal oxides consisting of hollow spherical particles. Tech. Phys. Lett. 2008, 34, 1050–1052. [Google Scholar] [CrossRef]
  5. Jackson, F.F.; Kubiak, K.J.; Wilson, M.C.T.; Molinari, M.; Stetsyuk, V. Droplet misalignment limit for inkjet printing into cavities on textured surfaces. Langmuir 2019, 35, 9564–9571. [Google Scholar] [CrossRef] [PubMed]
  6. Kumar, A.; Gu, S.; Kamnis, S. Simulation of impact of a hollow droplet on a flat surface. Appl. Phys. A 2012, 109, 101–109. [Google Scholar] [CrossRef]
  7. Kumar, A.; Gu, S. Porous surfaces via impinging and solidifying molten hollow melt droplets on substrates. Trans. Indian Inst. Met. 2012, 65, 771–775. [Google Scholar] [CrossRef]
  8. Topping, C.J.; Aldrich, A.; Berny, P. Overhaul environmental risk assessment for pesticides. Science 2020, 367, 360–363. [Google Scholar] [CrossRef]
  9. Post, S.L. Drift of droplets from air-induction nozzles. Trans. ASABE 2019, 62, 1683–1687. [Google Scholar] [CrossRef]
  10. Alidoost, D.R.; Yu, S.; Choi, Y.; Lee, J. Effect of geometrical parameters of air-induction nozzles on droplet characteristics and behaviour. Biosyst. Eng. 2021, 209, 14–29. [Google Scholar] [CrossRef]
  11. Hu, J.; Liu, C.; Wang, C.; Li, Y.; Song, J.; Liu, Y.; Chu, X. Motion model for describing the quantity of air in droplets through changing the structure of air induction nozzle. Int. J. Agric. Biol. Eng. 2021, 14, 35–40. [Google Scholar] [CrossRef]
  12. Butler, E.; Swan, T.; Miller, P.C.H.; Waddelow, S.; Bradley, A.; Tuck, C.R. Design factors affecting spray characteristics and drift performance of air Induction nozzles. Biosyst. Eng. 2002, 82, 289–296. [Google Scholar] [CrossRef]
  13. Hong, W.; Ye, X.; Xue, R. Numerical simulation of deformation behavior of droplet in gas under the electric field and flow field coupling. J. Dispers. Sci. Technol. 2017, 39, 26–32. [Google Scholar] [CrossRef]
  14. Hyunyoung, O.; Heungsup, P.; Wallace, W.C.; Jeffrey, F.M.; Junyong, Z. Particle-Laden drop impacting on solid surfaces. J. Dispersion Sci. Technol. 2004, 25, 449–456. [Google Scholar] [CrossRef]
  15. Clanet, C.; BÉGuin, C.; Richard, D.; QuÉRÉ, D. Maximal deformation of an impacting drop. J. Fluid Mech. 2004, 517, 199–208. [Google Scholar] [CrossRef]
  16. Vaikuntanathan, V.; Sivakumar, D. Maximum Spreading of Liquid Drops Impacting on Groove-Textured Surfaces: Effect of Surface Texture. Langmuir 2016, 32, 2399–2409. [Google Scholar] [CrossRef] [PubMed]
  17. Asai, B.; Tan, H.; Siddique, A.U. Droplet Impact on a Micro-structured Hydrophilic Surface: Maximum Spreading, Jetting, and Partial Rebound. Int. J. Multiph. Flow 2022, 157, 104235. [Google Scholar] [CrossRef]
  18. Pasandideh-Fard, M.; Qiao, Y.M.; Chandra, S.; Mostaghimi, J. Capillary effects during droplet impact on a solid surface. Phys. Fluids. 1996, 8, 650–659. [Google Scholar] [CrossRef]
  19. Eggers, J.; Fontelos, M.A.; Josserand, C.; Zaleski, S. Drop dynamics after impact on a solid wall: Theory and simulations. Phys. Fluids. 2010, 22, 062101-1–062101-13. [Google Scholar] [CrossRef]
  20. Tsai, P.; Hendrix, M.H.W.; Dijkstra, R.R.M.; Shui, L.; Lohse, D. Microscopic structure influencing macroscopic splash at high Weber number. Soft Matter. 2011, 7, 11325–11333. [Google Scholar] [CrossRef]
  21. Zhao, R.; Yu, M.; Sun, Z.; Li, L.J.; Guo, X.Y.; Xu, Y.; Wu, X.M. Regulating droplet impact and wetting behaviors on hydrophobic leaves using a nonionic surfactant. J. Colloid Interface Sci. 2022, 629, 926–937. [Google Scholar] [CrossRef]
  22. Song, M.; Ju, J.; Luo, S.; Han, Y.; Dong, Z.; Wang, Y.; Gu, Z.; Zhang, L.; Hao, R.; Jiang, L. Controlling liquid splash on superhydrophobic surfaces by a vesicle surfactant. Sci. Adv. 2017, 3, e1602188. [Google Scholar] [CrossRef] [PubMed]
  23. Song, Y.; Huang, Q.; Liu, M.; Cao, L.; Li, F.; Zhao, P.; Cao, C. Wetting and deposition behaviors of pesticide droplets with different dilution ratios on wheat leaves infected by pathogens. J. Mol. Liq. 2023, 370, 120977. [Google Scholar] [CrossRef]
  24. Vernay, C.; Ramos, L.; Ligoure, C. Bursting of dilute emulsion-based liquid sheets driven by a marangoni effect. Phys. Rev. Lett. 2015, 115, 198302. [Google Scholar] [CrossRef] [PubMed]
  25. Panagiotis, E.T.; Edward, R.S.; Erich, A.M. Spreading of aqueous droplets with common and superspreading surfactants. A molecular dynamics study. Colloids Surf. A 2019, 581, 123810. [Google Scholar] [CrossRef]
  26. Han, X.; Li, W.; Zhao, H.; Li, J.; Tang, X.; Wang, L. Slippery damper of an overlay for arresting and manipulating droplets on nonwetting surfaces. Nat. Commun. 2021, 12, 3154. [Google Scholar] [CrossRef]
  27. Gong, C.; Li, D.; Kang, C.; Wang, Y. Visualisation of the evolution of perforations in oil-based emulsion sheets formed by flat-fan spray nozzles. Biosyst. Eng. 2021, 207, 68–80. [Google Scholar] [CrossRef]
  28. Gong, C.; Li, D.; Kang, C. Effect of oil-based emulsion on air bubbles in spray sheet produced through the air-induction nozzle. Pest Manag. Sci. 2022, 78, 5347–5357. [Google Scholar] [CrossRef]
  29. Yang, W.; Zhong, W.; Jia, W.; Ou, M.; Dong, X.; Zhang, T.; Ding, S.; Yu, P. The effect of oil-in-water emulsion pesticide on the evolution of liquid sheet rim disintegration and the spraying distribution. Crop Prot. 2023, 177, 106547. [Google Scholar] [CrossRef]
  30. Yang, W.; Jia, W.; Ou, M.; Zhong, W.; Jiang, L.; Wang, X. Effect of physical properties of an emulsion pesticide on the atomisation process and the spatial distribution of droplet size. Agriculture 2022, 12, 949. [Google Scholar] [CrossRef]
  31. Dorr, G.J.; Kempthorne, D.M.; Mayo, L.C.; Forster, W.A.; Zabkiewicz, J.A.; McCue, S.W.; Belward, J.A.; Turner, I.W.; Hanan, J. Towards a model of spray–canopy interactions: Interception, shatter, bounce and retention of droplet on horizontal leaves. Ecol. Modell. 2014, 290, 94–101. [Google Scholar] [CrossRef]
  32. Dorr, G.J.; Forster, W.A.; Mayo, L.C.; McCue, S.W.; Kempthorne, D.M.; Hanan, J.; Turner, I.W.; Belward, J.A.; Young, J.; Zabkiewicz, J.A. Spray retention on whole plants: Modelling, simulations and experiments. Crop Prot. 2016, 88, 118–130. [Google Scholar] [CrossRef]
  33. Li, D.; Zhang, D.; Zheng, Z. Numerical analysis of hollow droplet impacts on a dry flat surface. Int. J. Heat Mass Transfer. 2019, 129, 753–763. [Google Scholar] [CrossRef]
  34. Gong, C.; Kang, C.; Jia, W.; Yang, W.; Wang, Y. The effect of spray structure of oil-based emulsion spray on the droplet characteristics. Biosyst Eng. 2020, 198, 78–90. [Google Scholar] [CrossRef]
  35. Nasiri, M.; Amini, G.; Moreau, C.; Dolatabadi, A. Hollow droplet impact on a solid surface. Int. J. Multiph. Flow 2021, 143, 103740. [Google Scholar] [CrossRef]
  36. Liang, Y.; Peng, J.; Li, X.; Xu, J.; Zhang, Z.; Ren, L. From natural to biomimetic: The superhydrophobicity and the contact time. Microsc. Res. Tech. 2016, 79, 712–720. [Google Scholar] [CrossRef]
  37. Blanken, N.; Saleem, M.S.; Antonini, C.; Thoraval, M.J. Rebound of self-lubricating compound drops. Sci. Adv. 2020, 6, eaay3499. [Google Scholar] [CrossRef]
Figure 1. Schematic view of the experimental system.
Agriculture 14 00960 g001
Figure 2. Contact angle measurement: (a) 67.5° ± 3°, hydrophilic surface, and (b) 140.3° ± 3°, hydrophobic lotus leaf surface.
Agriculture 14 00960 g002
Figure 3. Numerical setup: (a) computational model and boundary conditions, and (b) definition of hollow droplet initial diameter ( D 0 ), spreading diameter ( D t ) and central jet height ( H j ).
Agriculture 14 00960 g003
Figure 4. Comparison of experimental and numerical results: (a) spreading factor  f * , and (b) central jet height factor  H * .
Agriculture 14 00960 g004
Figure 5. Comparison of the process of droplet impact between experimental and numerical results,  U   = 2.21   m / s .
Agriculture 14 00960 g005
Figure 6. Impact of a dense water droplet and a hollow water droplet on the hydrophilic surface: (a) a dense water droplet,  U   = 2.58   m / s , and (b) a hollow water droplet,  U   = 2.58   m / s ; the bubble volume fraction  V *  is 0.15.
Agriculture 14 00960 g006
Figure 7. Deposition of hollow water droplets with different bubble volume fractions ( V * ) impacting on the hydrophilic surface,  U   = 2.58   m / s .
Agriculture 14 00960 g007
Figure 8. Experimental results of hollow droplets impacting on the hydrophilic surface, with the V * ranging from 0.03 to 0.23. H max * is the maximum dimensionless central jet height.
Agriculture 14 00960 g008
Figure 9. Comparison of internal pressure of two typical hollow droplets with different bubble volume fractions ( V * ~0.05 and  V * ~0.2).
Agriculture 14 00960 g009
Figure 10. Hollow droplets with  V * ~0.05 impacting on the hydrophilic surface at different velocities.
Agriculture 14 00960 g010
Figure 11. Effect of impact velocity on central jet breakup: (a) the maximum central jet height  H max *  varies with velocity U, and (b) central jet breakup results of hollow droplets with  V * ~0.05 at different We.
Agriculture 14 00960 g011
Figure 12. Hollow droplets with  V * ~0.2 impacting on the hydrophilic surface at different impact velocities.
Agriculture 14 00960 g012
Figure 13. Effect of impact velocity on central jet breakup: (a) the maximum central jet height  H max *  varies with velocity U, and (b) central jet breakup results of hollow droplets with  V * ~0.2 at different We.
Agriculture 14 00960 g013
Figure 14. Comparison of the inner pressure of two typical hollow droplets at different impact velocities.
Agriculture 14 00960 g014
Figure 15. Relationship between impact velocity and central jet rising velocity.
Agriculture 14 00960 g015
Figure 16. The deposition of hollow droplets ( V * ~ 0.1 ,   U   = 2.58   m / s )  on the hydrophobic lotus leaf surface: water, oil-based emulsion and organosilicon. The red line shows the height of rebound.
Agriculture 14 00960 g016
Figure 17. Schematic diagram of an emulsion hollow droplet impact on the hydrophobic leaf surface resulting in adsorption, including the impact stage (a), spread stage (b) and rebound stage (c).
Agriculture 14 00960 g017
Figure 18. Deposition of hollow emulsion droplets ( V * ~ 0.1 ,   U = 2.58   m / s )  with different concentrations (C) on the hydrophobic lotus leaf surface. The red line shows the adherent position.
Agriculture 14 00960 g018
Table 1. Static surface tension and dynamic viscosity of water (W), emulsion (E) and organosilicon (O).
ConcentrationStatic Surface Tension
σ  (mN/m)
Dynamic Viscosity
γ  (mPa·s)
0% (W)72.140.83
0.8% (E)33.640.86
0.02% (O)31.100.80
Disclaimer/Publisher’s Note: The statements, opinions and data contained in all publications are solely those of the individual author(s) and contributor(s) and not of MDPI and/or the editor(s). MDPI and/or the editor(s) disclaim responsibility for any injury to people or property resulting from any ideas, methods, instructions or products referred to in the content.

