Article

Identification and Characterization of Resistance Loci to Stripe Rust in Winter Wheat Breeding Line YN1813

1
College of Agronomy, Xinjiang Agricultural University, Urumqi 830052, China
2
College of Agronomy, Henan Agricultural University, Zhengzhou 450046, China
3
Wheat Research Institute, Gansu Academy of Agricultural Sciences, Lanzhou 730070, China
4
Crop Research Institute, Sichuan Academy of Agricultural Sciences, Chengdu 610066, China
*
Authors to whom correspondence should be addressed.
Agriculture 2024, 14(7), 1044; https://doi.org/10.3390/agriculture14071044
Submission received: 8 May 2024 / Revised: 19 June 2024 / Accepted: 27 June 2024 / Published: 29 June 2024
(This article belongs to the Section Crop Genetics, Genomics and Breeding)

Abstract

:
The development and deployment of diverse resistance sources in novel wheat cultivars underpin the durable control of stripe rust. The objectives of this study were to identify quantitative trait loci (QTL) associated with stripe rust resistance in the Chinese wheat breeding line YN1813 and to provide wheat breeders with original genes with potentially durable resistance. A total of 306 F7:8 recombinant inbred lines (RIL), derived from a cross between YN1813 (infection type 0–3 and disease severity 1–36%) and the moderately susceptible landrace Chinese Spring (IT 7–9 and DS 41–65%), were assessed for stripe rust disease severity in the field at Qingshui in Gansu and Pixian in Sichuan in 2020 and 2021 following inoculation with a mixture of the currently predominant Pst races. The parents and RIL were genotyped using the Wheat 55K single-nucleotide polymorphism (SNP) array. The total length of the constructed genetic linkage map was 3896.30 cm, with an average interval of 1.30 cm between adjacent markers. Two major QTL were identified on chromosome 7B and 7D across all tested environments. QYr.hau-7B was mapped to a 2.26 cm interval between the SNP markers AX-110908486AX-89658728AX-109489314 on chromosome 7B, explaining 0.9% to 16.9% of the phenotypic variation. QYr.hau-7D was positioned in a 0.67 cm interval flanked by the SNP markers AX-111654594 and AX-89378255, explaining 0.4% to 21.4% of the phenotypic variation. The QTL on 7D likely correspond to the previously known gene Yr18, whereas QYr.hau-7B was presumed to be a novel gene adjacent to YrZH84 or the core part of YrZH84. SNP markers closely linked with QYr.hau-7B were converted to allele-specific quantitative PCR-based genotyping assay (AQP) markers and validated in a panel of 712 wheat accessions. The group possessing a positive allele (TT) of AQP_AX-89658728 significantly (p < 0.05) decreased the IT by 45.8% and the DS by 63.2%. QYr.hau-7B and its markers could be useful in breeding programs to improve the level and durability of stripe rust resistance.

1. Introduction

Wheat (Triticum aestivum L.) is a staple food crop world-wide, providing substantial amounts of nutrients for humans [1]. The estimated global wheat production in 2023 was 788.5 million tonnes (FAO, http://www.fao.org/worldfoodsituation/en/, accessed on 11 February 2024). Wheat stripe rust, caused by Puccinia striiformis Westend. f. sp. tritici Erikss. (Pst), is one of the most common, widespread, and damaging diseases of wheat world-wide [2,3]. Usually, yield losses due to stripe rust vary from 10% to 70% depending on the prevailing cultivars grown, climatic conditions, and disease pressure. From 1958 to 2003, twelve severe stripe rust outbreaks occurred in the United States, with yield losses of up to 25% [2]. In the last few years, stripe rust has affected 4.2 million ha wheat annually and caused heavy yield losses in northwestern and southwestern China [4].
Breeding for disease resistance helps to reduce the frequency of less severe disease outbreaks, thereby reducing yield losses. Using stripe-rust-resistant wheat cultivars is also the most sustainable and practical method to control this disease [5]. However, the constant emergence of new virulent races is the main challenge for stripe rust control. These new races are able to overcome the protection provided by overused fungicides (or potentially overused resistance genes). Only relatively few of the many resistance genes identified continue to confer resistance. Therefore, it is necessary to mine new stripe rust resistance genes and deploy them, preferably in multiple gene combinations.
To date, more than 80 stripe rust resistance genes have been formally named in common wheat and its relatives [6,7]. Most of them have been mapped by different types of molecular markers, and several linked markers have been successfully applied in molecular breeding, and a small number of Yr genes have been functionally validated in wheat: Yr36 [8], Yr18(Lr34) [9], Yr46(Lr67) [10], Yr10 [11], Yr15 [12], Yr5/YrSp [13], Yr7 [13], YrAS2388/Yr28 [14], YrU1 [15], and Yr27 [16]. With the availability of high-throughput genotyping platforms and recent advancements in genomic resources, novel methods for gene mapping and cloning are becoming available. A milestone in wheat genomes has been the completion of the entire Triticum aestivum cv. Chinese Spring reference genome sequence (RefSeq v1.0) and subsequent high-quality gene models (the International Wheat Genome Sequencing Consortium (IWGSC), http://www.wheatgenome.org/, accessed on 1 February 2021) [17]. Moreover, the developed high-throughput genotyping technologies, based on microarrays and next-generation sequencing (NGS), are widely used for wheat genome analyses [18]. NGS enables an efficient high-throughput discovery of DNA variants [19]. Single-nucleotide polymorphisms (SNPs) are primary markers for genetic analyses based on a chip hybrid. Nowadays, SNP assay platforms, such as Affymetrix Gene Chip, Illumina Bead Chip, Kompetitive Allele-Specific PCR (KASP) [20], and allele-specific quantitative PCR-based genotyping assay (AQP) [21], have been used in mapping and marker-assisted selection (MAS).
During the evaluation of more than 1300 wheat lines (including domestic and foreign landraces and cultivars) for stripe rust resistance in multiple artificially inoculated field nurseries in the last few years, we identified a few accessions with high resistance to prevalent Pst races in China. Among them, the new wheat breeding line YN1813, developed by Henan Agricultural University, displayed a high and consistent stripe rust resistance level. However, the genetic basis of the potentially durable resistance in this line was unknown. The aims of this study were to construct a high-density genetic map using the Wheat 55K SNP array to identify QTL for stripe rust resistance in YN1813. We then converted markers that are closely linked with QYr.hau-7B to AQP markers to enable MAS in breeding.

2. Materials and Methods

2.1. Plant Materials and Pst Races

The parents used were the resistant line YN1813 and the susceptible line Chinese Spring (CS). YN1813 is a new disease-resistant winter wheat breeding line with unknown pedigree, descending from a natural variant line in our wheat breeding nursery. CS is a Chinese Spring wheat landrace that is moderately to highly susceptible to the currently predominant Pst races in China [22]. The mapping population used in this study, consisting of 306 F7:8 recombinant inbred lines (RIL), was developed from crossing YN1813 × CS. The population was advanced from F2 to F7 generation through single-seed descent, and single F7 plants were harvested to generate F8 lines [23]. Jinmai 47 and Mingxian 169 were planted as susceptible controls in field stripe rust tests. A panel of 712 wheat accessions, including Chinese wheat cultivars, advanced breeding lines, and a few foreign wheat germplasms, were used to validate AQP markers developed based on flanking the SNP markers identified in QYr.hau-7B. The Pst races were provided by the Plant Protection Research Institute, Gansu Academy of Agricultural Sciences, Lanzhou, Gansu, China.

2.2. Phenotyping of Stripe Rust Resistance

To evaluate adult plants’ stripe rust responses, the 306 F7:8 RIL and their parents were grown in the field at Qingshui (106°12′ E, 34°73′ N, and average daily temperature of −11–23 °C), in the Gansu province of China (refereed as 20GS and 21GS) and Pixian (103°42′ E, 30°43′ N, and average daily temperature of 2–27 °C), in the Sichuan province of China (refereed as 20SC and 21SC) during the 2019–2020 and 2020–2021 growing seasons. F1 and their parents were grown in the field at Qingshui (refereed as 22GS) and Pixian (refereed as 22SC) during the 2021–2022 growing seasons. The field trials were conducted in a randomized complete block design with two replicates (GS) and three replicates (SC), respectively. Each plot consisted of 1 m rows with a spacing of 25 cm between rows, and 30 seeds were sown in each row. The susceptible spreaders Jinmai 47 and Mingxian 169 were planted every 40 rows and around the plots to ensure a uniform inoculation in Qingshui and Pixian, respectively. The spreader rows were inoculated with a urediniospore mixture of the currently predominant Pst races Gui22-1, CYR34, CYR32, CYR33, and ZS and a mixture of the Pst races CYR31, CYR32, CYR33, Hy6, Hy7, Shui4, and Shui6 at Qingshui and Pixian, respectively.
The panel of 712 wheat accessions was evaluated for adult plant resistance (APR) at Xuchang Campus (113°48′ E, 34°80′ N) of Henan Agricultural University, in the Henan province of China, during the 2020–2021 and 2021–2022 cropping seasons. The field trials were planted using a randomized complete block design with two replicates. Thirty seeds were planted in 1.2 m rows with a 20/40 cm row space. Mingxian 169 was used as the susceptible control and also planted surrounding the plots to increase and spread urediniospores for adequate and uniform rust levels for reliable screening. Mixed urediniospores of the currently predominant Pst races CYR32, CYR33, CYR34, and ZS were artificially inoculated on the spreader rows of wheat in the standing to jointing stage (145 days and 116 days after sowing, respectively).
Infection type (IT) and disease severity (DS) were used to evaluate the adult plants’ stripe rust reactions. The ITs of the penultimate leaves were rated on a 0–9 scale, with 0–6 considered resistant and 7–9 susceptible [24]. The rust response of at the susceptible control was noted as 8–9. The DS on the penultimate leaves from 5 randomly selected plants in each plot was rated as the percentage of leaf area covered by the fungal colonies at the grain filling stage and averaged to represent the phenotype of each plot [25]. The final rating of each line was used for analysis.

2.3. Phenotypic Statistical Analysis

Mean DS data were used for QTL analysis. Pearson’s correlation coefficients (r) among different environments were calculated using SAS statistical software v 9.0 (SAS Institute Inc., Cary, NC, USA), and significant differences between groups were evaluated by Student’s t-tests conducted in the same program. Broad-sense heritability (H2) was estimated using the “AOV” tool in QTL IciMapping v4.2 (https://www.isbreeding.net, accessed on 31 January 2021) [26]. Violin plots, Boxplots, and Histograms of the phenotype data were drawn using “ggviolin” and “ggplot2” packages of RStudio v4.1.2 software.

2.4. Genotyping, Linkage Map Construction, and QTL Analysis

Genomic DNA was extracted from seeds of the 306 RIL and two parents using a modified CTAB (cetyl-trimethyl-ammonium bromide) method [27]. DNA quality and quantity were assessed using a NanoDrop ND-1000 (Thermo Scientific, Wilmington, DE, USA). The Affymetrix wheat 55K SNP array (China Golden Marker Biotechnology Co., Ltd., Beijing, China, http://www.cgmb.com.cn, accessed on 3 September 2020) was used to genotype the complete genomes of the 306 RIL and parents. The polyploid version of the Affymetrix Genotyping Console™ (GTC) software (Affymetrix, Santa Clara, CA, USA) was used to conduct SNP allele clustering and genotype calling on the raw SNP data. SNP markers that were missing in the parents, or with no polymorphism in the parents or progenies, and missing data frequencies > 20% were excluded from further analysis by SNP and the BIN tool in IciMapping v4.2. A single marker with the minimum amount of missing data from each bin was selected and used to construct a genetic map. Linkage groups were assigned by referring to annotated chromosomal location markers. Unlinked markers were excluded from the QTL analysis. Genetic distances were calculated using the Kosambi mapping function in IciMapping v4.2. Linkage maps were graphically visualized with MapDraw v2.1 [28].
QTL analysis was conducted using the inclusive composite interval mapping with the additive tool (ICIM-ADD) function of IciMapping v4.2. The QTL of each environment was detected using the biparental population (BIP) module with walking step = 0.20 cm, PIN = 0.001, and logarithm of odd (LOD) score values ≥ 3.0. The phenotypic variances explained by individual QTL and the additive effects at LOD peaks were also calculated. QTL detected in four environments was treated as a major and stable one. The QTL was named based on the International Rules of Genetic Nomenclature (https://wheat.pw.usda.gov/ggpages/wgc/98/Intro.htm, accessed on 15 February 2021), where “HAU” represents Henan Agricultural University.

2.5. Haplotype Analysis

Haplotype analysis was performed to identify haplotype variants of QYr.hau-7B in the collection of 712 wheat accessions and the genetic interval of QYr.hau-7B in the RIL. Informative markers linked to the target QTL were screened from the Wheat 55K SNP array data of the YN1813 × CS population. The marker selection criteria were as follows: (1) the marker was located in the confidence interval of the target QTL; with (2) minor allelic frequency greater than 5% and missing values < 10% in the 712 wheat accessions. To analyze haplotypes, marker groups were clustered, and linkage disequilibrium plots based on the alternate D’/LOD color scheme were generated in Haploview v4.2 [29]. Haplotypes detected in more than 4 lines were considered to be predominant haplotypes. Phenotypic differences between haplotype groups were highlighted using box plots based on the average IT and DS values of groups.

2.6. AQP Marker Development and Validation

The closely linked SNP markers and the flanking SNP markers within the physical interval of the QYr.hau-7B were used to develop AQP markers using PolyMarker [30] (Table S1). The AQP primers were synthesized by Sangon Biotech (Shanghai) Co., Ltd., Shanghai, China. A total of 8 μL reaction volumes contained 3.89 μL genomic DNA (50–100 ng) and 4.11 μL mixture consisting of 4 μL HiGeno 2× Probe Mix A (JiaCheng Biotech Co., Ltd., Beijing, China) and 0.11 μL primer mixture. The cycling conditions were as follows: 95 °C for 10 min, followed by 10 cycles of 95 °C for 20 s and 61 °C (−0.6 °C per cycle) for 40 s, and then 34 cycles of 95 °C for 20 s and 55 °C for 40 s. AQP assays were performed on a MiniAmp™ thermal cycler (Thermo Fisher Scientific Inc., Bartlesville, OK, USA). The marker end-point fluorescent image was visualized using the QuantStudio5 real-time PCR detection system (Thermo Fisher Scientific Inc., Bartlesville, OK, USA), and allelic discrimination was performed using the embedded program QuantStudio™ Design & Analysis Software v1.4.3. The polymorphisms of newly developed AQP markers were tested by the parents, and then, the effects of markers were estimated using the 712 wheat accessions with different genetic backgrounds.

3. Results

3.1. Inheritance of Stripe Rust Resistance

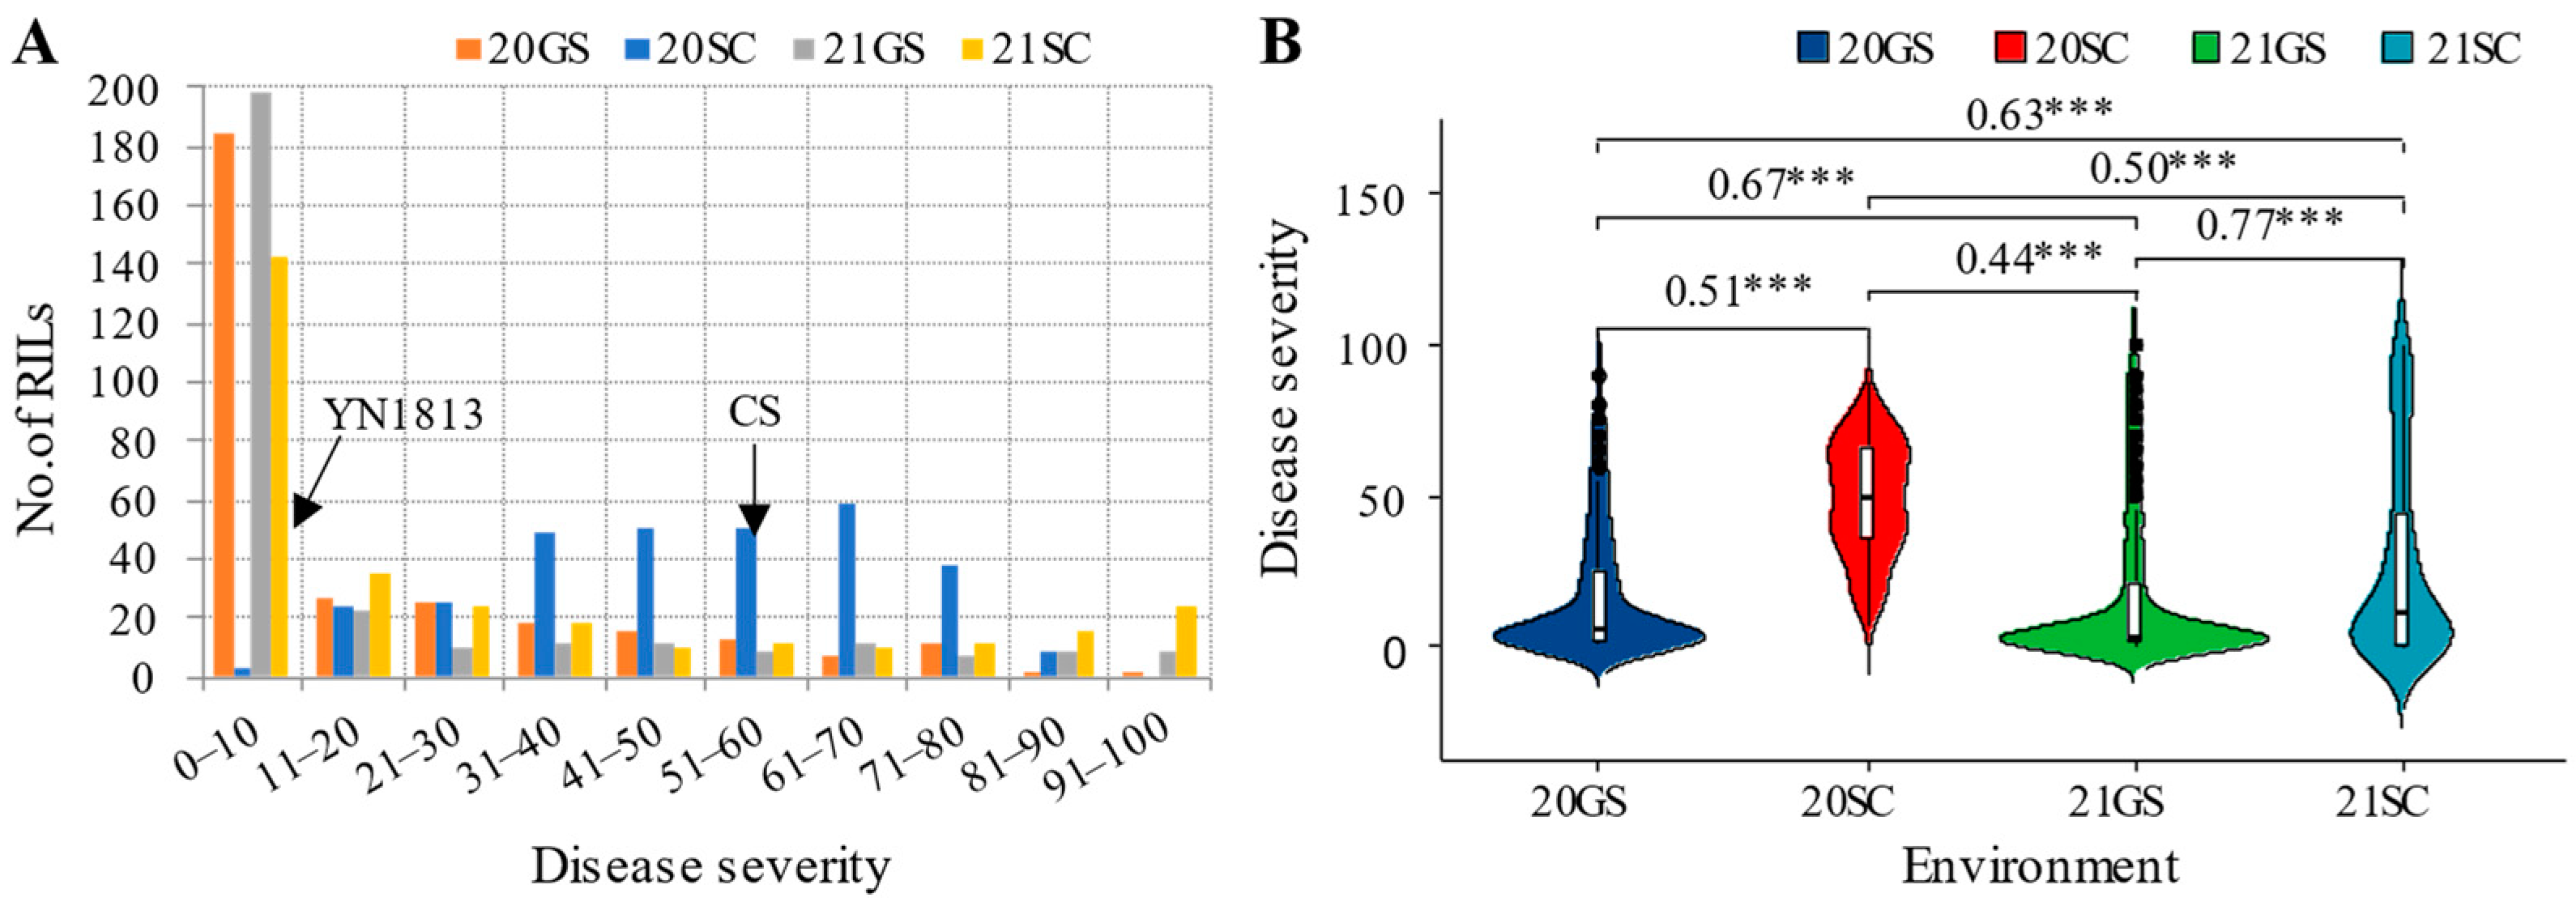
The adult plant response of YN1813 was consistently scored lower (IT 0–3 and DS 1–36%) than the susceptible parent CS (IT 7–9 and DS 41–65%) at all locations and years, and the response of F1 plants from cross YN1813 × CS displayed a high to moderate resistance reaction (IT 3–5) (Figure 1 and Table 1). Disease severity data for the RIL population were continuously distributed, ranging from 0 to 100%, indicating that adult plant resistance was polygenically controlled (Figure 2A). However, the pronounced skewness distribution towards resistant the of disease severity data suggested that a few major QTL with multiple minor QTL were involved in the RIL. The Pearson correlation coefficients (r) for stripe rust responses among environments were significant (p < 0.001), with r values ranging from 0.44 to 0.77 (p < 0.001) for disease severity (Figure 2B). The broad-sense heritability was 0.86 for disease severity (Table 1).

3.2. Genetic Linkage Maps

After removing redundant or monomorphic SNPs, the remaining 2987 bin markers were used for linkage map construction. The linkage map consisted of 28 linkage groups, including 2 groups each on chromosomes 6A, 1D, 3D, 4D, 5D, 6D, and 7D. The total length of the linkage map was 3896.30 cm, and the average interval between adjacent markers was 1.30 cm. The map lengths of the A, B, and D sub-genomes were 1366.58, 1136.28, and 1393.44 cm, respectively, with corresponding densities of 1.16, 1.18, and 1.66 cm/marker (Figure S1 and Table S2).

3.3. QTL Analysis of Stripe Rust Response

A total of 37 QTL were detected in the mapping population and located on all chromosomes except for chromosomes 1A, 1B, 2B, 4B, and 7A (Table S3). Among them, two QTL located on chromosomes 7B and 7D were repeatedly detected in all environments, and thus, they were considered to be stable QTL (Table 2). Twelve QTL were detected in two environments at the Gansu, and the remaining twenty-three QTL were only detected in one environment. These were considered to be undesired QTL.
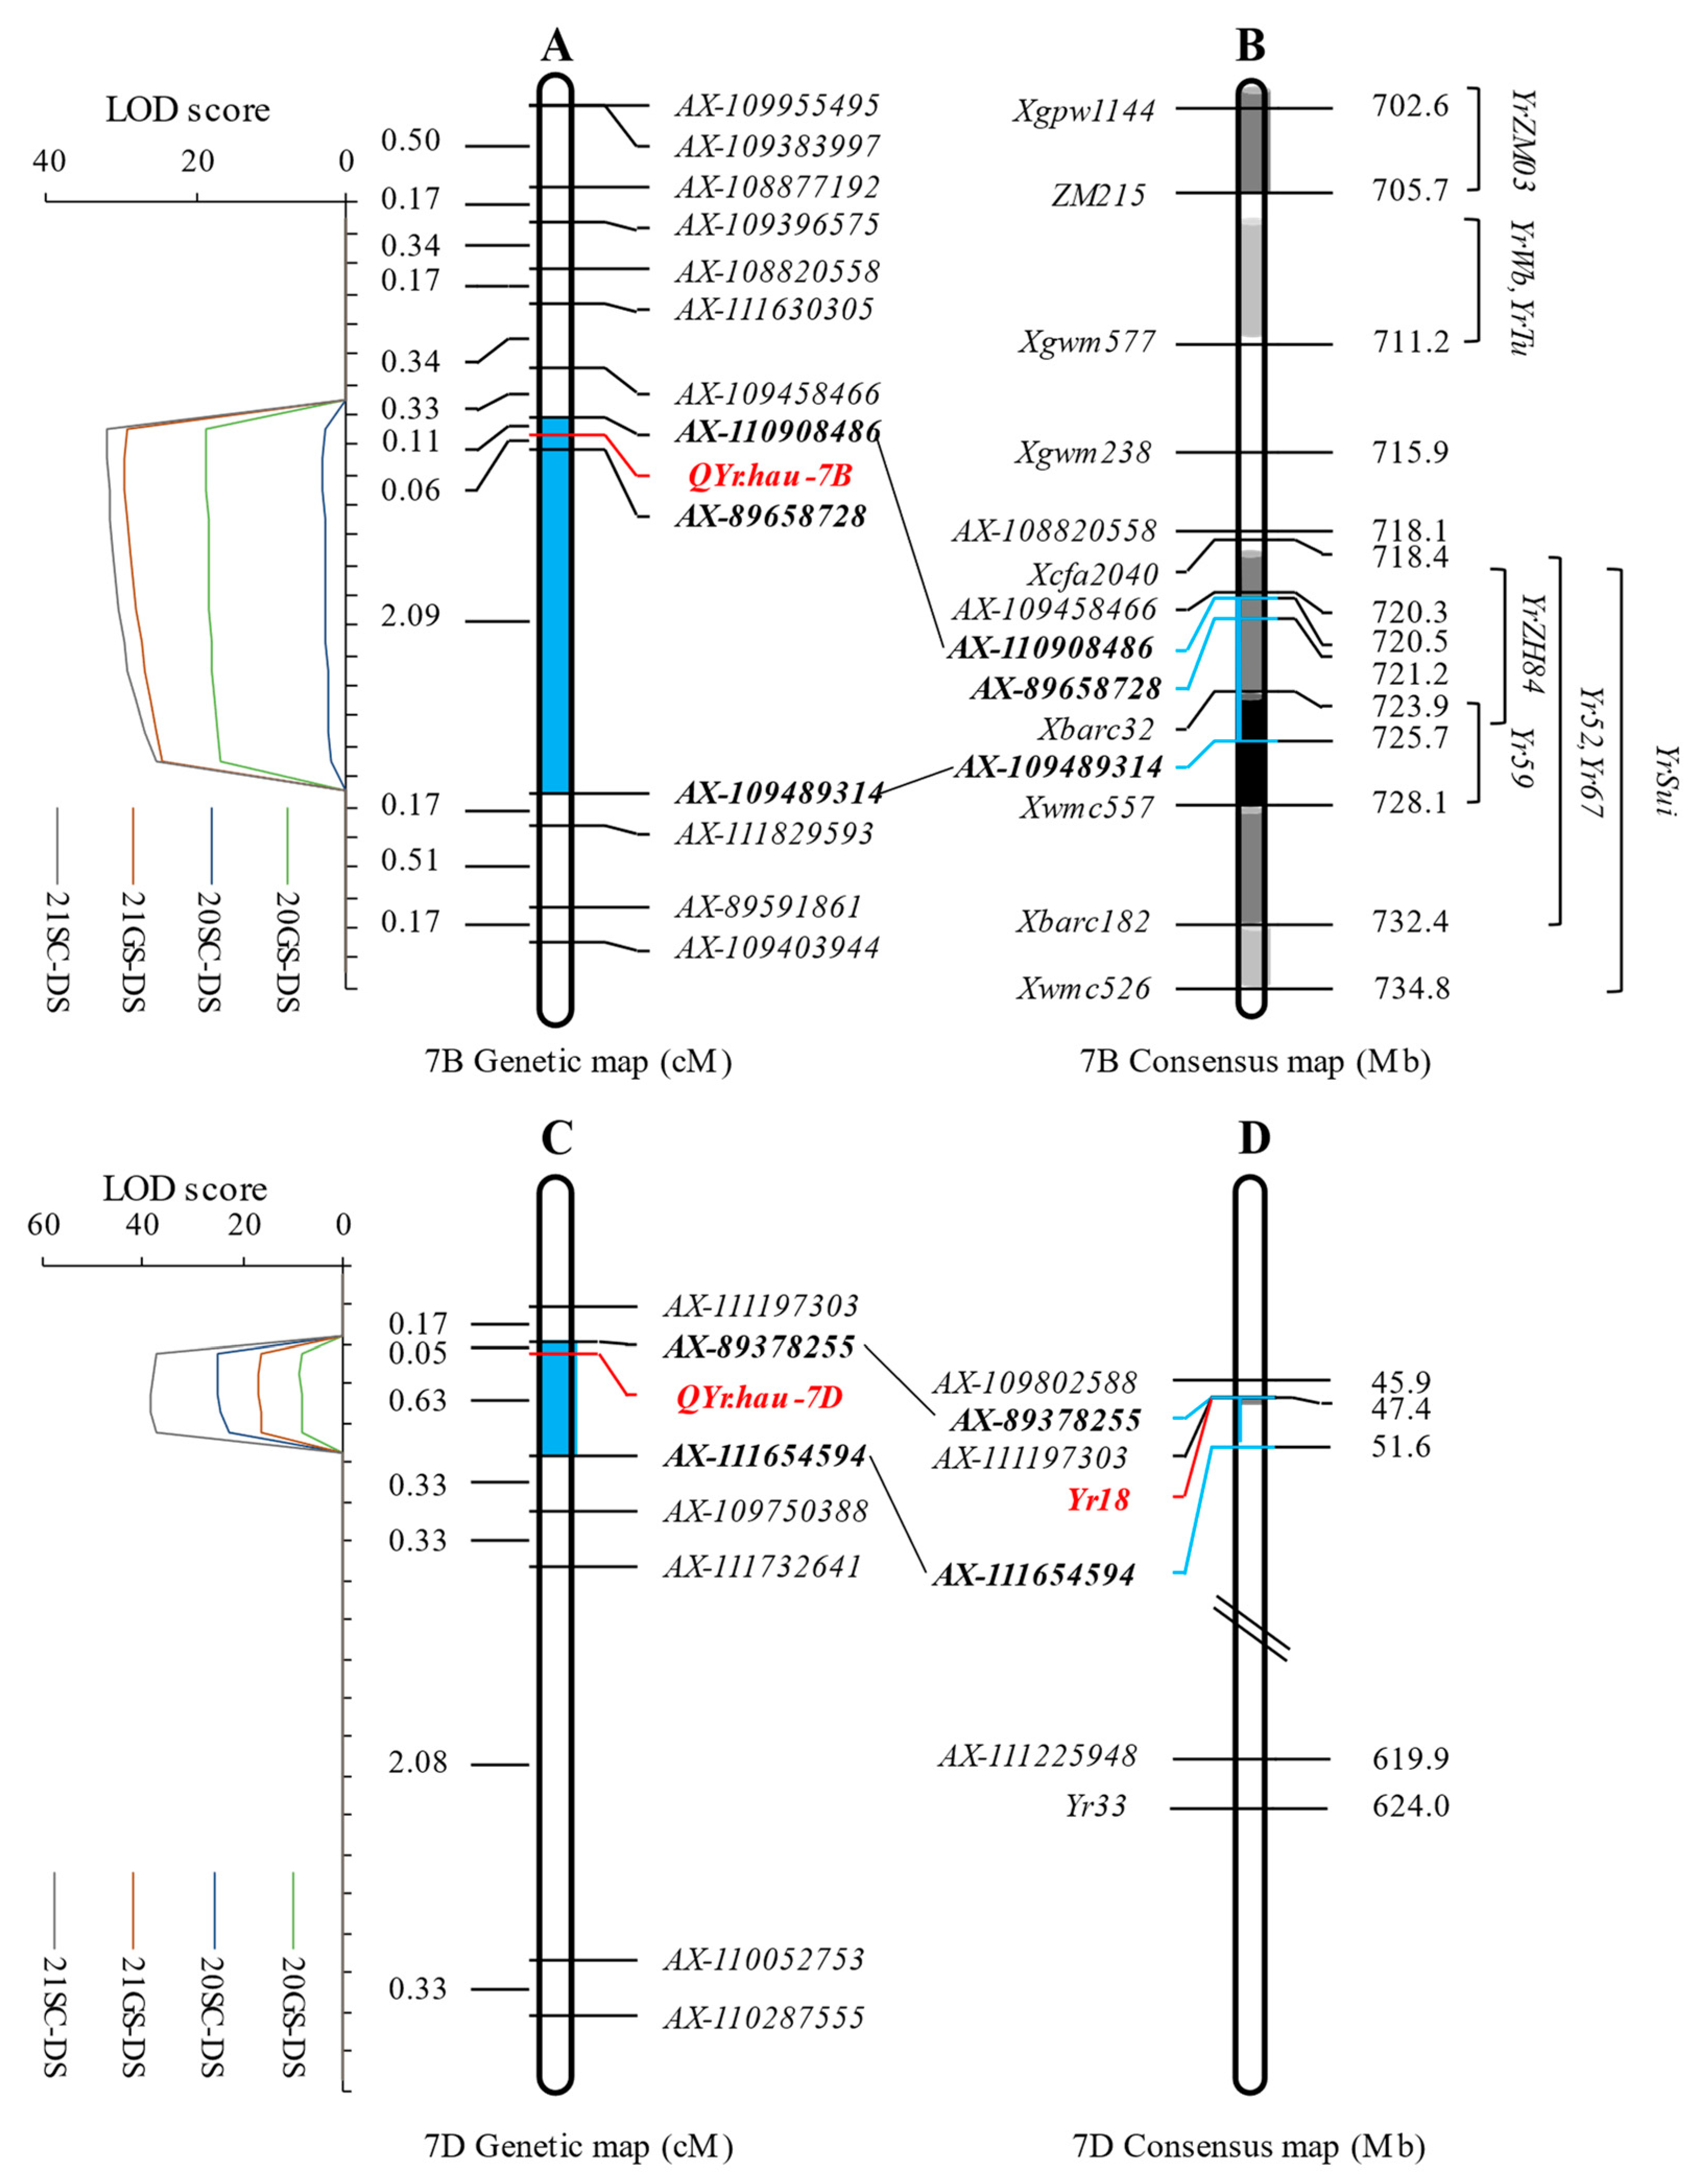
The QYr.hau-7B was detected in four environments, with LOD values ranging from 3.2 to 31.8. It explained 0.9–16.9% of the phenotypic variation and was positioned in a 2.26 cm genetic interval between markers AX-110908486AX-89658728AX-109489314 with genetic distances of 0.01–0.16 and 0.04–2.05 cm, respectively, corresponding to a 5.2 Mb physical interval (720.52–725.72 Mb) (Figure 3A). QYr.hau-7D, detected in all environments, was positioned in a 0.67 cm genetic interval flanked by the markers AX-111654594 and AX-89378255, with genetic distances of 0.63 and 0.05 cm, respectively, corresponding to a 4.27 Mb physical interval (47.38–51.65 Mb), and explained 0.4–21.4% of the phenotypic variation, with LOD values of 8.4–38.2 (Figure 3C). The positive alleles of the two loci were supplied by YN1813 and CS, respectively. The remaining 35 unstable and minor QTL were detected in less than three environments, explaining 0.2–9.8% of the phenotypic variation. Twenty-four and eleven positive alleles were from YN1813 and CS, respectively.

3.4. Effects of QYr.hau-7B and QYr.hau-7D on Stripe Rust Resistance

To determine the effects of the QTL combination, the 278 RIL (homozygous lines) in the mapping population were divided into groups containing different combinations of QTL, based on the genotype of markers, with the flanking markers AX-89658728 and AX-110908486 of QYr.hau-7B and the flanking markers AX-89378255 and AX-111197303 of QYr.hau-7D. Four groups were identified: group 1 (96 lines) carrying QYr.hau-7B and QYr.hau-7D, group 2 (37 lines) carrying none of them, group 3 (67 lines) carrying QYr.hau-7B only, and group 4 (78 lines) carrying QYr.hau-7D only (Figure 4). The average levels of DS of group 1 (4.3 ± 5.9%) and group 3 (13.3 ± 13.7%) were comparable, but they were significantly lower than group 2 (56.7 ± 21.7%) (p < 0.01). Although the average DS of group 4 (21.3 ± 19.4%) was significantly higher than those of group 1 and group 3, it was significantly lower than that of group 2 (p < 0.05). These results indicated that the QYr.hau-7B locus showed better resistance than the QYr.hau-7D locus, and stacking QYr.hau-7B and QYr.hau-7D should be an effective strategy for improving the resistance to stripe rust in a wheat breeding program.

3.5. Analysis of QYr.hau-7B and QYr.hau-7D Compared with the Known Yr Genes on the Chromosome 7B and 7D

To examine the relationship of QYr.hau-7B, QYr.hau-7D, and other genes reported on chromosome 7B and 7D, all were projected onto a physical map based on IWGSC RefSeq v.1.0 and the locations of markers flanking the various genes. A large number of Yr genes were mapped on chromosome 7B, such as Yr79 [31], YrMY37 [32], Yr041133 [33], Yr39 [34], YrZM103 [35], YrTu and YrWb [36], Yr52 [37], Yr59 [38], Yr67(YrC591) [39,40], YrZH84 [41], and YrSuj [42]. According to positions on the genetic and physical maps, QYr.hau-7B was located within the overlapping interval, including the genes YrZH84, Yr52/Yr67, and YrSu (Figure 3B). These results point to a likely commonality of resistance-gene-rich clusters on chromosome 7BL. The marker Xcfa2040, closely linked with YrZH84/Yr59/Yr67, had polymorphism among the parents and some R/S descendant lines (Tables S4 and S5). However, polymorphism was not detected among the parents and some R/S descendant lines using the markers Xbarc32, Xwmc557, and Xbarc182, which are closely linked with the genes YrZH84/Yr59, Yr59, and Yr67. QYr.hau-7B was presumed to be a novel gene adjacent to YrZH84 or the core part of YrZH84. In contrast, a few Yr genes were located on the chromosome 7D, such as Yr18 on the short arm and Yr33 on the long arm. The alignment showed that the QYr.hau-7D interval contains the genomic interval of the cloned gene Yr18, and its peak is around 47.4 Mb, close to Yr18. The STS marker csLV34, closely linked with Yr18, was used to detect polymorphism among the parents and some offspring. It was found that Chinese Spring carried the Yr18 gene (Table S5), suggesting that QYr.hau-7D may be the stripe rust resistance gene Yr18 (Figure 3D).

3.6. Development of AQP Markers for QTL Validation and Marker-Assisted Selection

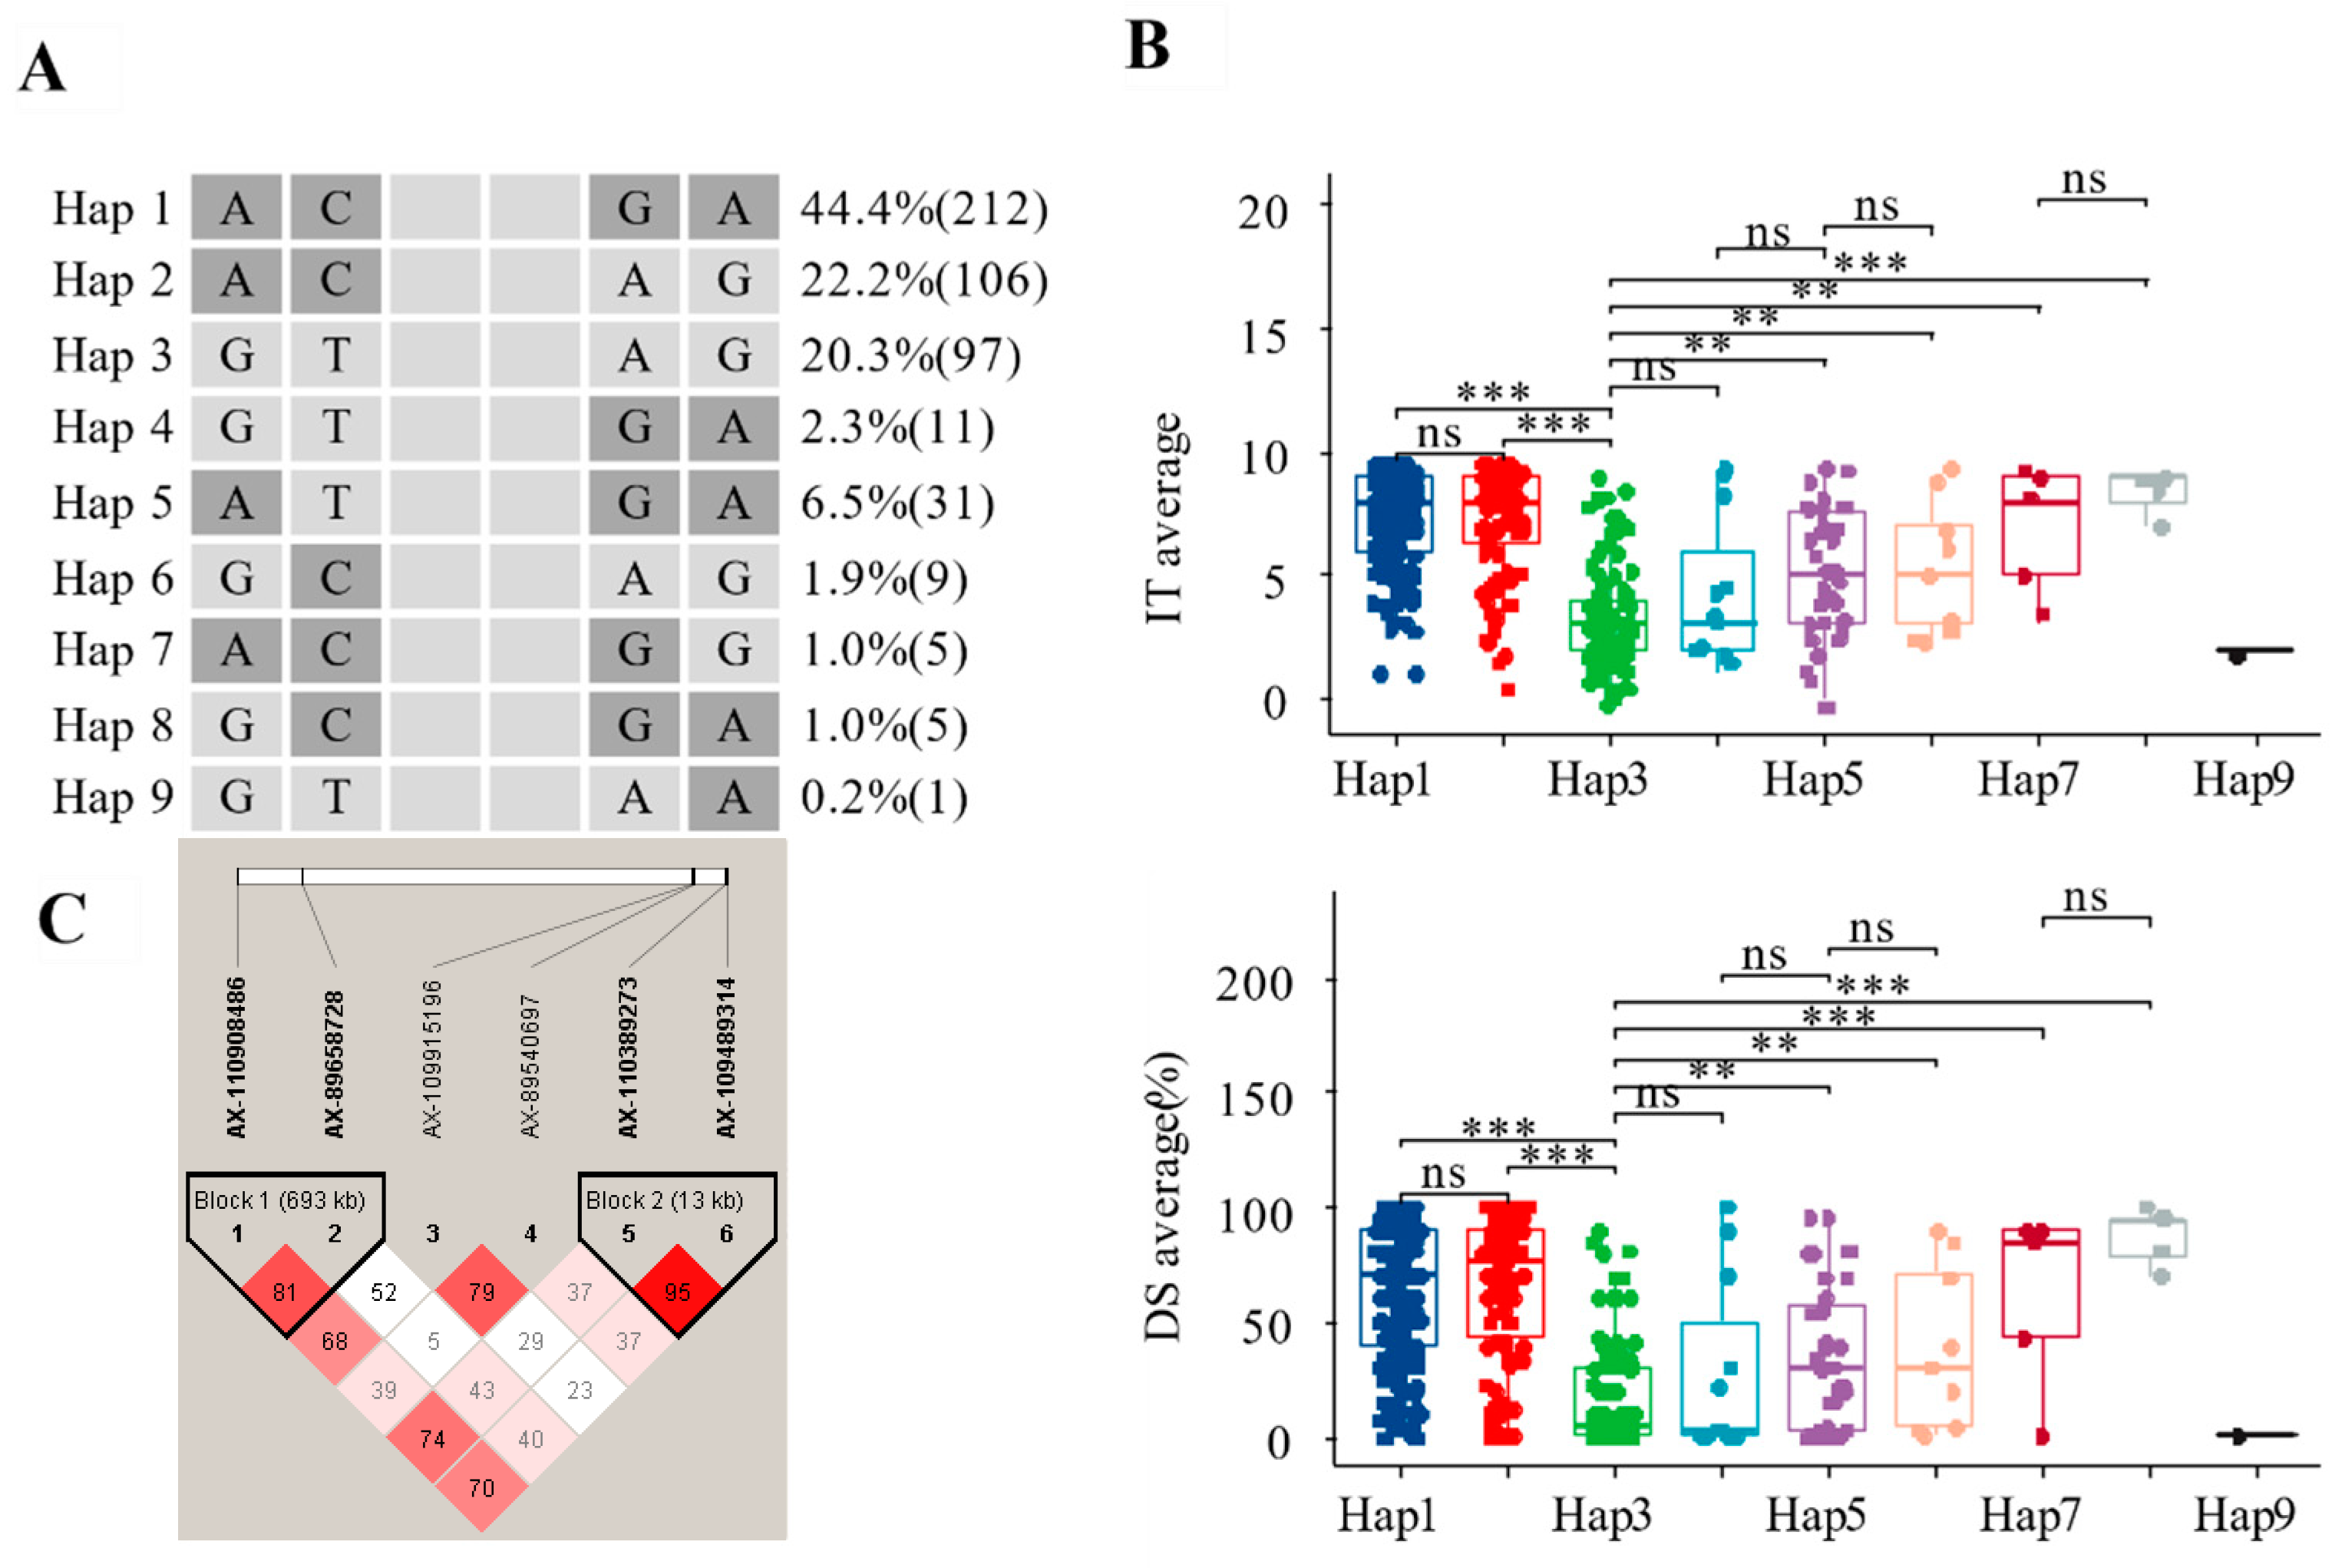
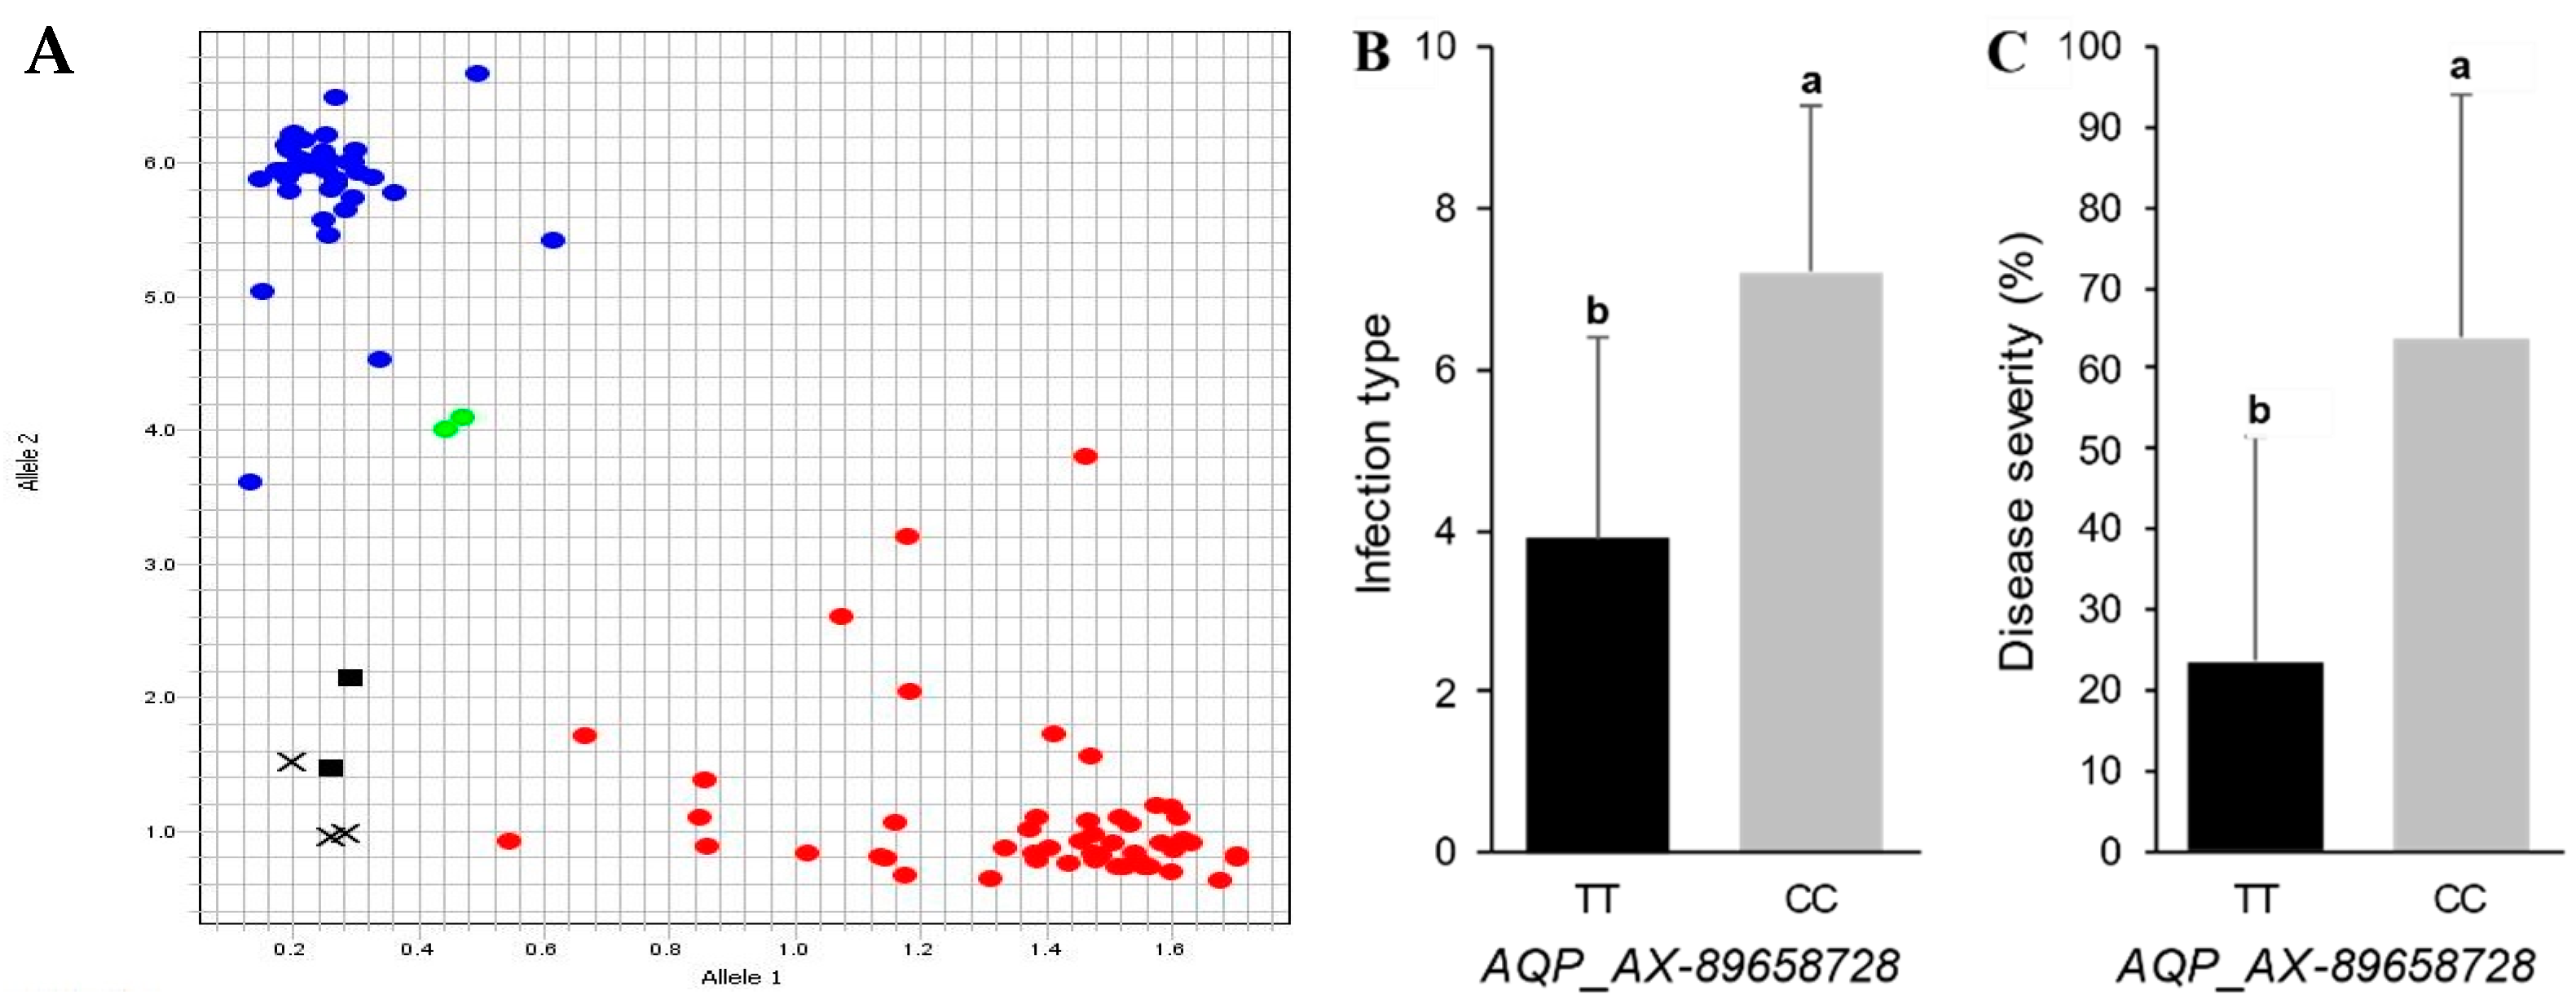
As QYr.hau-7B was a stable and potentially new QTL, the distribution of QYr.hau-7B in wheat accessions was assessed by haplotype analysis. Within the QYr.hau-7B interval flanked by the markers AX-110908486 and AX-109489314 (a physical distance of approximately 5.2 Mb), we identified six informative SNP markers from the Wheat 55K SNP array data of the QTL mapping RIL populations. These SNP markers were converted to AQP markers and were used to screen a panel of 712 wheat accessions (Table S6). Four of these AQP markers were separated into two linkage blocks by linkage disequilibrium analysis (Figure 5C) and formed eight major haplotypes (n ≥ 5) and one minor haplotype. Among them, 97 lines (20.3%) were clustered with YN1813 in Hap 3 (Figure 5A). The average DS of Hap 3 (19.1%) was lower than that of the other seven haplotypes (Hap 1 = 65.6%, Hap 2 = 65.7%, Hap 4 = 29.1%, Hap 5 = 34.9%, Hap 6 = 38.3%, Hap 7 = 61.8%, and Hap 8 = 88.0%) (Figure 5B and Table S7), indicating that Hap 3 was the most representative of the resistance allele of QYr.hau-7B. Combined with these markers’ recombination information and haplotype scores, the block 1 interval was tightly linked with the QYr.hau-7B region, and marker AQP_AX-89658728 was a QYr.hau-7B locus-specific marker. Single-marker analyses showed that AQP_AX-89658728 could place 531 lines (except for heterozygous lines and un-call lines) into two groups. The group possessing a positive allele (TT) of AQP_AX-89658728 significantly (p < 0.05) decreased IT by 45.8% and DS by 63.2% (Figure 6). For example, zhoumai 22, zhoumai 36, Zhongyu 1220, Aikang 58, and RL6077 with the TT allele have better resistance to stripe rust races. Thus, AQP_AX-89658728 can be used as a diagnostic marker for QYr.hau-7B to incorporate this QTL into breeding populations.

3.7. Distribution of Resistance Accessions and Resistance Genotype (TT) in Different Source Accessions

Subsequently, we performed the analysis of the distribution of resistant materials and resistance genotype (TT) in different source accessions. The results found that this panel of 712 wheat accessions were mainly from Henan, Sichuan, Shandong, Hebei, Jiangsu, Anhui, Beijing, and Shaanxi in China and CIMMYT, containing 339, 50, 48, 44, 42, 41, 25, 21, and 46 accessions, respectively (Table 3). Among them, the resistant accessions from Henan, Sichuan, Beijing, Shaanxi, and CIMMYT had relatively high proportions of 47.2%, 80.0%, 44.0%, 71.4%, and 71.7%, respectively, while those from Shandong, Hebei, Jiangsu and Anhui had relatively low proportions, only 4.9%~11.9%. A resistance genotype (TT) was detected in 24, 104, and 7 resistant materials from CIMMYT, Henan, and Beijing, accounting for 72.7%, 65.0%, and 63.6%, respectively, but only 17.5% resistant materials were detected in the sample from Sichuan, and a TT site was not detected in the disease-resistant materials from Shaanxi. This indicates that this gene was widely used in CIMMYT, Henan, and Beijing, but other resistance sources are dominant in Sichuan and Shaanxi. Therefore, the resistance gene QYr.hau-7B needs to be introduced and utilized in Sichuan, Shaanxi, and other wheat regions.

4. Discussion

4.1. QTL Analysis

When analyzing the DS data, we found a pronounced skewness distribution towards resistance in the DS data. This phenomenon suggests that a few major QTL with multiple minor QTL were involved in the RIL. However, to our surprise, a total of 37 QTL were detected in the mapping population, including 2 stable QTL and 35 unstable QTL. Among the 35 unstable QTL, 23 QTL were only detected in one environment, which may be related to the winter–spring crosses and the larger RIL population. Winter–spring crosses lead to an inconsistent heading stage among various lines, and a larger RIL population leads to a more diversified heading stage, resulting in a few lines having incomplete onset in different environments due to their late heading stage, which affects the results of the QTL analysis. Liu et al. [43] detected eight QTLs for stripe rust resistance using the 170 RIL population across four environments. Interestingly, twelve QTL were detected in two years at the Gansu, but QTL was not detected in two years at the Sichuan, which may be related to different Pst races at the two test sites and more Pst race types. This is because the spreader rows were inoculated with a urediniospore mixture of the currently predominant Pst races Gui22-1, CYR34, CYR32, CYR33, and ZS and a mixture of the Pst races CYR31, CYR32, CYR33, Shui4, Shui6, Hy6, and Hy7 at Qingshui and Pixian, respectively. Although there were few Pst race types in the Gansu, CYR34 is now the prevailing pathotype in China following its identification in 2009 [44]. It is so virulent that only a few known genes (12), such as Yr5, Yr15, and Yr32, remain effective [45]. Its broad virulence may have inspired the resistance of some minor genes in the population. However, what we need is for the stable major QTL sites to be identified in multiple environments. The two stable and major QTL identified in this study showed resistance to the above stripe rust races, providing resistance genes for future large-scale disease resistance breeding and utilization.

4.2. Candidate Region Analysis of QYr.hau-7B

Mapping genes were often affected by many factors. In some cases, the same QTL was located on the adjacent marker intervals under the different environments, which was often treated as a large marker interval. Then, fine mapping was performed in this large marker interval to narrow the target interval. When Deng et al. [46] mapped the adult plant stripe rust resistance QTL on chromosomes 6AL, 5BL, and 7DS in the Chinese wheat landrace Yibinzhuermai, the adjacent marker intervals under the different environments of the same QTL were treated as large target intervals. In the present study, we also encountered a similar problem. QYr.hau-7B was positioned in a 0.17 cm genetic interval between the markers AX-110908486 and AX-89658728 in 20GS and 21SC, but it was also mapped in a 2.09 cm genetic interval between the markers AX-89658728 and AX-109489314 in 20SC and 21GS. When the distribution of QYr.hau-7B in 712 wheat accessions was assessed by haplotype analysis, the linkage disequilibrium analysis showed that the Block1 interval marker was not tightly linked to four adjacent markers, and a haplotype analysis found that the Block1 interval (AX-110908486AX-89658728) was tightly linked to the disease resistance of QYr.hau-7B. Subsequently, we conducted a linkage disequilibrium analysis and haplotype analysis of RIL recombinants using six informative SNP markers within the physical interval of AX-110908486AX-89658728AX-109489314 from the Wheat 55K SNP array data of the YN1813 × CS population (Figure S2, Table S8). These six markers were divided into two blocks: Block1 consisting of AX-110908486 and AX-89658728, and Block2 consisting of AX-109915196, AX-89540697, AX-110389273, and AX-109489314. Through comparing the marker recombination type and stripe rust resistance reaction of five haplotypes from RIL recombinants, the Block1 interval was tightly linked with the QYr.hau-7B region, and the marker AQP_AX-89658728 was a QYr.hau-7B locus-specific marker. So, QYr.hau-7B may be mapped in a genetic interval flanked by AX-110908486AX-89658728AX-109915196. Within the QYr.hau-7B target interval, we viewed polymorphisms of all SNP markers, detected from the wheat 55K chip between the parents. Thirty consecutive markers from AX-811168714 (adjacent to the marker AX-89658728) to AX-109352027 (adjacent to the marker AX-109915196) showed non-polymorphism between parents, with a physical distance span of 3.78 Mb (721,413,907 bp to 725,1963,68 bp) (Table S9). These results provide further evidence for confirming the region of QYr.hau-7B on chromosome 7B, and the QYr.hau-7B peak was around AX-89658728. Therefore, it was speculated that QYr.hau-7B may be mapped in the marker interval between AX-110908486 and AX-89658728, corresponding to an approximately 700 kb (720.5–721.2 Mb) physical interval against IWGSC RefSeq v1.0.

4.3. Comparison of QYr.hau-7B with Previously Reported Genes

Previous studies reported several Yr genes on chromosome 7B and elucidated the relationships among them [33,47]. These genes were separated into two groups: the first group consisted of Yr2, Yr6, Yr39, and Yr79 and was clustered in a more proximal chromosome region between the SSR markers Xbarc72 and Xgwm517; the second group consisted of Yr67 (YrC591), YrZH84, Yr52, and Yr59 and was clustered in a more distal region between the SSR markers Xgwm577 and Xwmc526 [31]. Genes in the first group were positioned more than 50 Mb away from QYr.hau-7B, indicating that they were unlikely to be identical to QYr.hau-7B. In the consensus map, including the second group (Figure 3b), YrZM103 in the Chinese cultivar Zhengmai 103 [35], and YrTu and YrWb [36] in the Ethiopian lines Tusie and Wabe, respectively, were located proximally to QYr.hau-7B, with physical distances of more than 10Mb against the RefSeq v1.0. Yr52 [37], Yr59 [38], Yr67(YrC591) [39,40], YrZH84 [41], and YrSuj [42] were located in distal regions to QYr.hau-7B, overlapping with the QYr.hau-7B candidate region. Yr52 in the Indian line PI 183527 [37] and Yr59 in the Iraqi line PI 178759 [38] are high-temperature adult plant (HTAP) resistance genes. Virulence of CYR34 on genotypes with Yr2, Yr6, and Yr67 was observed in other studies [32,44], and YrSuj may be the same gene as Yr67 (YrC591) [42]. These results provide further evidence for differences between QYr.hau-7B and other genes on chromosome 7B. YrZH84 in the China core germplasm Zhou8425B was located in a 6.2 cm genetic interval flanked by the markers Xcfa2040 and Xbarc32, with genetic distances of 1.4 cm and 4.8 cm, respectively, corresponding to a 5.5 Mb physical interval (718.4–723.9 Mb) [41]. Then, YrZH84 was again located in a 2.2 cm genetic interval flanked by the markers Xcfa2040 and Xrga-1, with genetic distances of 1.4 cm and 0.8 cm, respectively [48]. In this study, we speculated that QYr.hau-7B was positioned in a 0.17 cm genetic interval flanked by the markers AX-110908486 and AX-89658728, corresponding to an approximately 700 kb (720.5–721.2 Mb) physical interval. The genetic distance of QYr.hau-7B was reduced by 6.03 cm and 2.03 cm compared to the previously genetic distance mapped for YrZH84. QYr.hau-7B may be the core part of YrZH84 or the adjacent new genes based on the germplasm source and the location on the physical map, which lays the foundation for future gene mining.

5. Conclusions

In this study, two major QTL were identified on chromosome 7B and 7D across all tested environments. The QYr.hau-7B locus showed better resistance than the QYr.hau-7D locus, and stacking QYr.hau-7B and QYr.hau-7D should be an effective strategy for improving the resistance to stripe rust in a wheat breeding program. It was speculated that QYr.hau-7B was positioned in a 0.17 cm genetic interval flanked by the markers AX-110908486 and AX-89658728, corresponding to an approximately 700 kb (720.5–721.2 Mb) physical interval. QYr.hau-7B may be the core part of YrZH84 or the adjacent new genes. The positive allele (TT) of AQP_AX-89658728, a tightly linked marker with QYr.hau-7B, significantly decreased the ITs by 45.8% and DS by 63.2%. AQP_AX-89658728 can be used as a diagnostic marker for QYr.hau-7B to incorporate this QTL into breeding populations.

Supplementary Materials

The following supporting information can be downloaded at https://www.mdpi.com/article/10.3390/agriculture14071044/s1: Figure S1: Density distribution map of the markers in the genetic linkage map; Figure S2: Haplotype analysis of QYr.hau-7B associated with stripe rust resistance in the RIL derived from YN1813 × CS; Table S1: Allele-specific quantitative PCR-based genotyping assay (AQP) primers used to genotype accessions for QTL validation; Table S2: Basic information of individual chromosome maps based on the wheat 55K SNP array in the YN1813 × CS recombinant inbred line population; Table S3: Quantitative trait loci (QTL) for stripe rust resistance detected in the YN1813 × CS RIL population using disease severity (DS) data across all environments; Table S4: Molecular markers and primer sequences used to detect known genes; Table S5: Marker detection results in parents, some descendants, and Zhou 8425B; Table S6: Marker detection results of AQP markers flanking QYr.hau-7B in 712 wheat accessions; Table S7: Haplotype analysis of QYr.hau-7B region in 712 wheat accessions; Table S8: Haplotype data on SNP markers within the QYr.hau-7B regions in 291 RIL derived from YN1813 × CS; Table S9: All SNP markers in the QYr.hau-7B target interval detected in 55K SNP array.

Author Contributions

Conceptualization, H.G. and G.Y.; software, Y.R.; validation, J.T., Y.G. and Y.L.; formal analysis, J.T.; investigation, J.T., Y.G., Y.L., B.B. and L.W.; writing—original draft preparation, J.T.; writing—review and editing, H.G., J.T. and Y.G.; visualization, J.T.; funding acquisition, H.G. and G.Y. All authors have read and agreed to the published version of the manuscript.

Funding

This research was funded by Xinjiang Key Research and Development Program (2022B02001-3), Zhongyuan Thousand Talents Program Project (204200510029), Henan Science and Technology Research and Development Plan Joint Fund (application breakthrough) project (222103810002), and Henan Agricultural University Top Talent Project (30500678).

Institutional Review Board Statement

Not applicable.

Data Availability Statement

All data generated or analyzed during this study are included in this published article. The raw data can be made available upon request.

Acknowledgments

The authors thank Qiuzhen Jia of Gansu Academy of Agricultural Sciences for providing stripe rust urediniospores and Xiangguo Chen, Fangfang Zhang, Genyuan Zhang, and Ruiyu Hu of Henan Agricultural University for sorting out the RIL seeds.

Conflicts of Interest

The authors declare no conflicts of interest.

References

  1. Shewry, P.R.; Hey, S.J. The contribution of wheat to human diet and health. Food Energy Secur. 2015, 4, 178–202. [Google Scholar] [CrossRef] [PubMed]
  2. Chen, X.M. Epidemiology and control of stripe rust [Puccinia striiformis f. sp. tritici] on wheat. Can. J. Plant Pathol. 2005, 27, 314–337. [Google Scholar] [CrossRef]
  3. Wellings, C.R. Global status of stripe rust: A review of historical and current threats. Euphytica 2011, 179, 129–141. [Google Scholar] [CrossRef]
  4. He, Z.H.; Lan, C.X.; Chen, X.M.; Zhou, Y.C.; Zhuang, Q.S.; Xia, X.C. Progress and perspective in research of adult-plant resistance to stripe rust and powdery mildew in wheat. Sci. Agric. Sin. 2011, 44, 2193–2215, (In Chinese with English Abstract). [Google Scholar]
  5. Chen, X.M. Integration of cultivar resistance and fungicide application for control of wheat stripe rust. Can. J. Plant Pathol. 2014, 36, 311–326. [Google Scholar] [CrossRef]
  6. McIntosh, R.A.; Dubcovsky, J.; Rogers, W.J.; Xia, X.C.; Raupp, W.J. Catalogue of gene symbols for wheat 2020 Supplement. Ann. Wheat Newslett. 2020, 66, 109–149. Available online: https://wheat.pw.usda.gov/GG3/WGC (accessed on 30 August 2022).
  7. Klymiuk, V.; Chawla, H.S.; Wiebe, K.; Ens, J.; Fatiukha, A.; Govta, L.; Fahima, T.; Pozniak, C.J. Discovery of stripe rust resistance with incomplete dominance in wild emmer wheat using bulked segregant analysis sequencing. Commun. Biol. 2022, 5, 826. [Google Scholar] [CrossRef] [PubMed]
  8. Fu, D.L.; Uauy, C.; Distelfeld, A.; Blechl, A.; Epstein, L.; Chen, X.M.; Sela, H.; Fahima, T.; Dubcovsky, J. A Kinase-START gene confers temperature-dependent resistance to wheat stripe rust. Science 2009, 323, 1357–1360. [Google Scholar] [CrossRef]
  9. Krattinger, S.G.; Lagudah, E.S.; Spielmeyer, W.; Singh, R.P.; Huerta-Espino, J.; Mcfadden, H.; Bossolini, E.; Selter, L.L.; Keller, B. A putative ABC transporter confers durable resistance to multiple fungal pathogens in wheat. Science 2009, 323, 1360–1363. [Google Scholar] [CrossRef]
  10. Moore, J.W.; Herrera-Foessel, S.; Lan, C.X.; Schnippenkoetter, W.; Ayliffe, M.; Huerta-Espino, J.; Lillemo, M.; Viccars, L.; Milne, R.; Periyannan, S.; et al. A recently evolved hexose transporter variant confers resistance to multiple pathogens in wheat. Nat. Genet. 2015, 47, 1494–1498. [Google Scholar] [CrossRef]
  11. Liu, W.; Frick, M.; Huel, R.; Nykiforuk, C.L.; Wang, X.M.; Gaudet, D.A.; Eudes, F.; Conner, R.L.; Kuzyk, A.; Chen, Q.; et al. The stripe rust resistance gene Yr10 encodes an evolutionary-conserved and unique CC–NBS–LRR sequence in wheat. Mol. Plant 2014, 7, 1740–1755. [Google Scholar] [CrossRef]
  12. Klymiuk, V.; Yaniv, E.; Huang, L.; Raats, D.; Fatiukha, A.; Chen, S.S.; Feng, L.H.; Frenkel, Z.; Krugman, T.; Lidzbarsky, G.; et al. Cloning of the wheat Yr15 resistance gene sheds light on the plant tandem kinase-pseudokinase family. Nat. Commun. 2018, 9, 3735. [Google Scholar] [CrossRef]
  13. Marchal, C.; Zhang, J.P.; Zhang, P.; Fenwick, P.; Steuernagel, B.; Adamski, N.M.; Boyd, L.; Mcintosh, R.; Wulff, B.B.H.; Berry, S.; et al. BED-domain-containing immune receptors confer diverse resistance spectra to yellow rust. Nat. Plants 2018, 4, 662–668. [Google Scholar] [CrossRef]
  14. Zhang, C.Z.; Huang, L.; Zhang, H.F.; Hao, Q.Q.; Lyu, B.; Wang, M.N.; Epstein, L.; Liu, M.; Kou, C.L.; Qi, J.; et al. An ancestral NB-LRR with duplicated 3′UTRs confers stripe rust resistance in wheat and barley. Nat. Commun. 2019, 10, 178–202. [Google Scholar] [CrossRef]
  15. Wang, H.; Zou, S.H.; Li, Y.W.; Lin, F.Y.; Tang, D.Z. An ankyrin-repeat and WRKY-domain-containing immune receptor confers stripe rust resistance in wheat. Nat. Commun. 2020, 11, 1353. [Google Scholar] [CrossRef]
  16. Athiyannan, N.; Abrouk, M.; Boshoff, W.H.P.; Cauet, S.; Rodde, N.; Kudrna, D.; Mohammed, N.; Bettgenhaeuser, J.; Botha, K.S.; Derman, S.S.; et al. Long-read genome sequencing of bread wheat facilitates disease resistance gene cloning. Nat. Genet. 2022, 54, 227–231. [Google Scholar] [CrossRef]
  17. Clavijo, B.J.; Venturini, L.; Schudoma, C.; Accinelli, G.G.; Kaithakottil, G.; Wright, J.; Borrill, P.; Kettleborough, G.; Heavens, D.; Chapman, H.; et al. An improved assembly and annotation of the allohexaploid wheat genome identifies complete families of agronomic genes and provides genomic evidence for chromosomal translocations. Genome Res. 2017, 27, 885–896. [Google Scholar] [CrossRef]
  18. Wang, M.; Wang, S.B.; Liang, Z.; Shi, W.M.; Gao, C.X.; Xia, G.M. From genetic stock to genome editing: Gene exploitation in wheat. Trends Biotechnol. 2018, 36, 160–172. [Google Scholar] [CrossRef]
  19. Allen, A.M.; Barker, G.L.; Wilkinson, P.; Burridge, A.; Winfield, M.; Coghill, J.; Uauy, C.; Griffiths, S.; Jack, P.; Berry, S.; et al. Discovery and development of exome-based, co-dominant single nucleotide polymorphism markers in hexaploid wheat (Triticum aestivum L.). Plant Biotechnol. J. 2013, 11, 279–295. [Google Scholar] [CrossRef]
  20. Rasheed, A.; Hao, Y.F.; Xia, X.C.; Khan, A.; Xu, Y.B.; Varshney, R.K.; He, Z.H. Crop breeding chips and genotyping platforms: Progress, challenges, and perspectives. Mol. Plant 2017, 10, 1047–1064. [Google Scholar] [CrossRef]
  21. Zhou, C.E.; Liu, D.; Zhang, X.; Wu, Q.M.; Liu, S.J.; Zeng, Q.D.; Wang, Q.L.; Wang, C.F.; Li, C.L.; Singh, R.P.; et al. Combined linkage and association mapping reveals two major QTL for stripe rust adult plant resistance in Shaanmai 155 and their haplotype variation in common wheat germplasm. Crop J. 2022, 10, 783–792. [Google Scholar] [CrossRef]
  22. Liu, Z.Y.; Zhang, H.Z.; Bai, B.; Li, J.; Huang, L.; Xu, Z.B.; Chen, Y.X.; Liu, X.; Cao, T.J.; Li, M.M.; et al. Current status and strategies for utilization of stripe rust resistance genes in wheat breeding program of China. Sci. Agric. Sin. 2024, 57, 34–51, (In Chinese with English Abstract). [Google Scholar]
  23. Nsabiyera, V.; Bariana, H.S.; Qureshi, N.; Wong, D.; Hayden, M.J.; Bansal, U.K. Characterisation and mapping of adult plant stripe rust resistance in wheat accession Aus27284. Theor. Appl. Genet. 2018, 131, 1459–1467. [Google Scholar] [CrossRef]
  24. Line, R.f.; Qayoum, A. Virulence, Aggressiveness, Evolution, and Distribution of Races of Puccinia striiformis (The Cause of Stripe Rust of Wheat) in North America, 1968–1987; Technical Bulletin Number 1788; United States Department of Agriculture, Agricultural Research Service (USDA-ARS): Pullman, WA, USA, 1992.
  25. Bariana, H.S.; McIntosh, R.A. Cytogenetic studies in wheat. XV. Location of rust resistance genes in VPM1 and their genetic linkage with other disease resistance genes in chromosome 2A. Genome 1993, 36, 476–482. [Google Scholar] [CrossRef]
  26. Meng, L.; Li, H.H.; Zhang, L.Y.; Wang, J.K. QTL IciMapping: Integrated software for genetic linkage map construction and quantitative trait locus mapping in biparental populations. Crop J. 2015, 3, 269–283. [Google Scholar] [CrossRef]
  27. Bansal, U.; Bariana, H.; Wong, D.; Randhawa, M.; Wicker, T.; Hayden, M.; Keller, B. Molecular mapping of an adult plant stem rust resistance gene Sr56 in winter wheat cultivar Arina. Theor. Appl. Genet. 2014, 127, 1441–1448. [Google Scholar] [CrossRef]
  28. Liu, R.H.; Meng, J.L. MapDraw: A Microsoft excel macro for drawing genetic linkage maps based on given genetic linkage data. Hereditas 2003, 25, 317–321, (In Chinese with English Abstract). [Google Scholar]
  29. Barrett, J.C.; Fry, B.; Maller, J.; Daly, M.J. Haploview: Analysis and visualization of LD and haplotype maps. Bioinformatics 2005, 21, 263–265. [Google Scholar] [CrossRef]
  30. Ramirez-Gonzalez, R.H.; Uauy, C.; Caccamo, M. PolyMarker: A fast polyploid primer design pipeline. Bioinformatics 2015, 31, 2038–2039. [Google Scholar] [CrossRef]
  31. Feng, J.Y.; Wang, M.N.; See, D.R.; Chao, S.M.; Zheng, Y.L.; Chen, X.M. Characterization of novel gene Yr79 and four additional quantitative trait loci for all-stage and high-temperature adult-plant resistance to stripe rust in spring wheat PI 182103. Phytopathology 2018, 108, 737–747. [Google Scholar] [CrossRef]
  32. Ren, Y.; Li, S.R.; Xia, X.C.; Zhou, Q.; He, Y.J.; Wei, Y.M.; Zheng, Y.L.; He, Z.H. Molecular mapping of a recessive stripe rust resistance gene YrMY37 in Chinese wheat cultivar Mianmai 37. Mol. Breed. 2015, 35, 97. [Google Scholar] [CrossRef]
  33. Li, Y.H.; Lin, R.M.; Hu, J.H.; Shi, X.H.; Qiu, D.; Wu, P.P.; Goitom, G.H.; Wang, S.Q.; Zhang, H.J.; Yang, L.; et al. Mapping of wheat stripe rust resistance gene Yr041133 by BSR-seq analysis. Crop J. 2022, 10, 447–455. [Google Scholar] [CrossRef]
  34. Lin, F.; Chen, X.M. Genetics and molecular mapping of genes for race-specific all-stage resistance and non-race-specific high-temperature adult-plant resistance to stripe rust in spring wheat cultivar Alpowa. Theor. Appl. Genet. 2007, 114, 1277–1287. [Google Scholar] [CrossRef]
  35. Zhang, H.Z.; Xie, J.Z.; Chen, Y.X.; Liu, X.; Wang, Y.; Yan, S.H.; Yang, Z.S.; Zhao, H.; Wang, X.C.; Jia, L.H.; et al. Mapping stripe rust resistance gene YrZM103 in wheat cultivar Zhengmai 103 by BSR-seq. Acta Agron. Sin. 2017, 43, 1643–1649. [Google Scholar] [CrossRef]
  36. Dawit, W.; Flath, K.; Weber, W.E.; Schumann, E.; Röder, M.S.; Chen, X.M. Postulation and mapping of seedling stripe rust resistance genes in Ethiopian bread wheat cultivars. J. Plant Pathol. 2012, 94, 403–409. [Google Scholar]
  37. Ren, R.S.; Wang, M.N.; Chen, X.M.; Zhang, Z.J. Characterization and molecular mapping of Yr52 for high-temperature adult-plant resistance to stripe rust in spring wheat germplasm PI 183527. Theor. Appl. Genet. 2012, 125, 847–857. [Google Scholar] [CrossRef] [PubMed]
  38. Zhou, X.L.; Wang, M.N.; Chen, X.M.; Lu, Y.; Kang, Z.S.; Jing, J.X. Identification of Yr59 conferring high-temperature adult-plant resistance to stripe rust in wheat germplasm PI 178759. Theor. Appl. Genet. 2014, 127, 935–945. [Google Scholar] [CrossRef]
  39. Li, Y.; Niu, Y.C.; Chen, X.M. Mapping a stripe rust resistance gene YrC591 in wheat variety C591 with SSR and AFLP markers. Theor. Appl. Genet. 2009, 118, 339–346. [Google Scholar] [CrossRef]
  40. Xu, H.X.; Zhang, J.; Zhang, P.; Qie, Y.M.; Niu, Y.C.; Li, H.J.; Ma, P.T.; Xu, Y.F.; An, D.G. Development and validation of molecular markers closely linked to the wheat stripe rust resistance gene Yrc591 for marker-assisted selection. Euphytica 2014, 198, 317–323. [Google Scholar] [CrossRef]
  41. Li, Z.F.; Zheng, T.C.; He, Z.H.; Li, G.Q.; Xu, S.C.; Li, X.P.; Yang, G.Y.; Singh, R.P.; Xia, X.C. Molecular tagging of stripe rust resistance gene YrZH84 in Chinese wheat line Zhou 8425b. Theor. Appl. Genet. 2006, 112, 1098–1103. [Google Scholar] [CrossRef]
  42. Lan, C.X.; Zhang, Y.L.; Herrera-foessel, S.A.; Basnet, B.R.; Huerta-espino, J.; Lagudah, E.S.; Singh, R.P. Identification and characterization of pleiotropic and co-located resistance loci to leaf rust and stripe rust in bread wheat cultivar Sujata. Theor. Appl. Genet. 2015, 128, 549–561. [Google Scholar] [CrossRef] [PubMed]
  43. Liu, S.J.; Wang, X.T.; Zhang, Y.Y.; Jin, Y.G.; Xia, Z.H.; Xiang, M.J.; Huang, S.; Qiao, L.Y.; Zheng, W.J.; Zeng, Q.D.; et al. Enhanced stripe rust resistance obtained by combining Yr30 with a widely dispersed, consistent QTL on chromosome arm 4BL. Theor. Appl. Genet. 2022, 135, 351–365. [Google Scholar] [CrossRef]
  44. Liu, B.; Liu, T.G.; Zhang, Z.Y.; Jia, Q.Z.; Wang, B.T.; Gao, L.; Peng, Y.L.; Jin, S.L.; Chen, W.Q. Discovery and pathogenicity of CYR34, a new race of Puccinia striiformis f. sp. tritici in China. Acta Phytopathol. Sin. 2017, 47, 681–687, (In Chinese with English Abstract). [Google Scholar]
  45. Wu, J.H.; Wang, Q.L.; Chen, X.M.; Wang, M.J.; Mu, J.M.; Lv, X.N.; Huang, L.L.; Han, D.J.; Kang, Z.S. Stripe rust resistance in wheat breeding lines developed for central Shaanxi, an overwintering region for Puccinia striiformis f. sp. tritici in China. Can. J. Plant Pathol. 2016, 38, 317–324. [Google Scholar] [CrossRef]
  46. Deng, M.; Long, L.; Cheng, Y.K.; Yao, F.J.; Guan, F.N.; Wang, Y.Q.; Li, H.; Pu, Z.E.; Li, W.; Jiang, Q.T.; et al. Mapping a stable adult-plant stripe rust resistance QTL on chromosome 6AL in Chinese wheat landrace Yibinzhuermai. Crop J. 2022, 10, 1111–1119. [Google Scholar] [CrossRef]
  47. Mu, J.M.; Huang, S.; Liu, S.J.; Zeng, Q.D.; Dai, M.F.; Wang, Q.L.; Wu, J.H.; Yu, S.Z.; Kang, Z.S.; Han, D.E. Genetic architecture of wheat stripe rust resistance revealed by combining QTL mapping using SNP-based genetic maps and bulked segregant analysis. Theor. Appl. Genet. 2019, 132, 443–455. [Google Scholar] [CrossRef] [PubMed]
  48. Yin, G.H.; Wang, J.W.; Wen, W.E.; He, Z.H.; Li, Z.F.; Wang, H.; Xia, X.C. Mapping of wheat stripe rust resistance gene YrZH84 with RGAP markers and its application. Acta Agron. Sin. 2009, 35, 1274–1281, (In Chinese with English Abstract). [Google Scholar] [CrossRef]
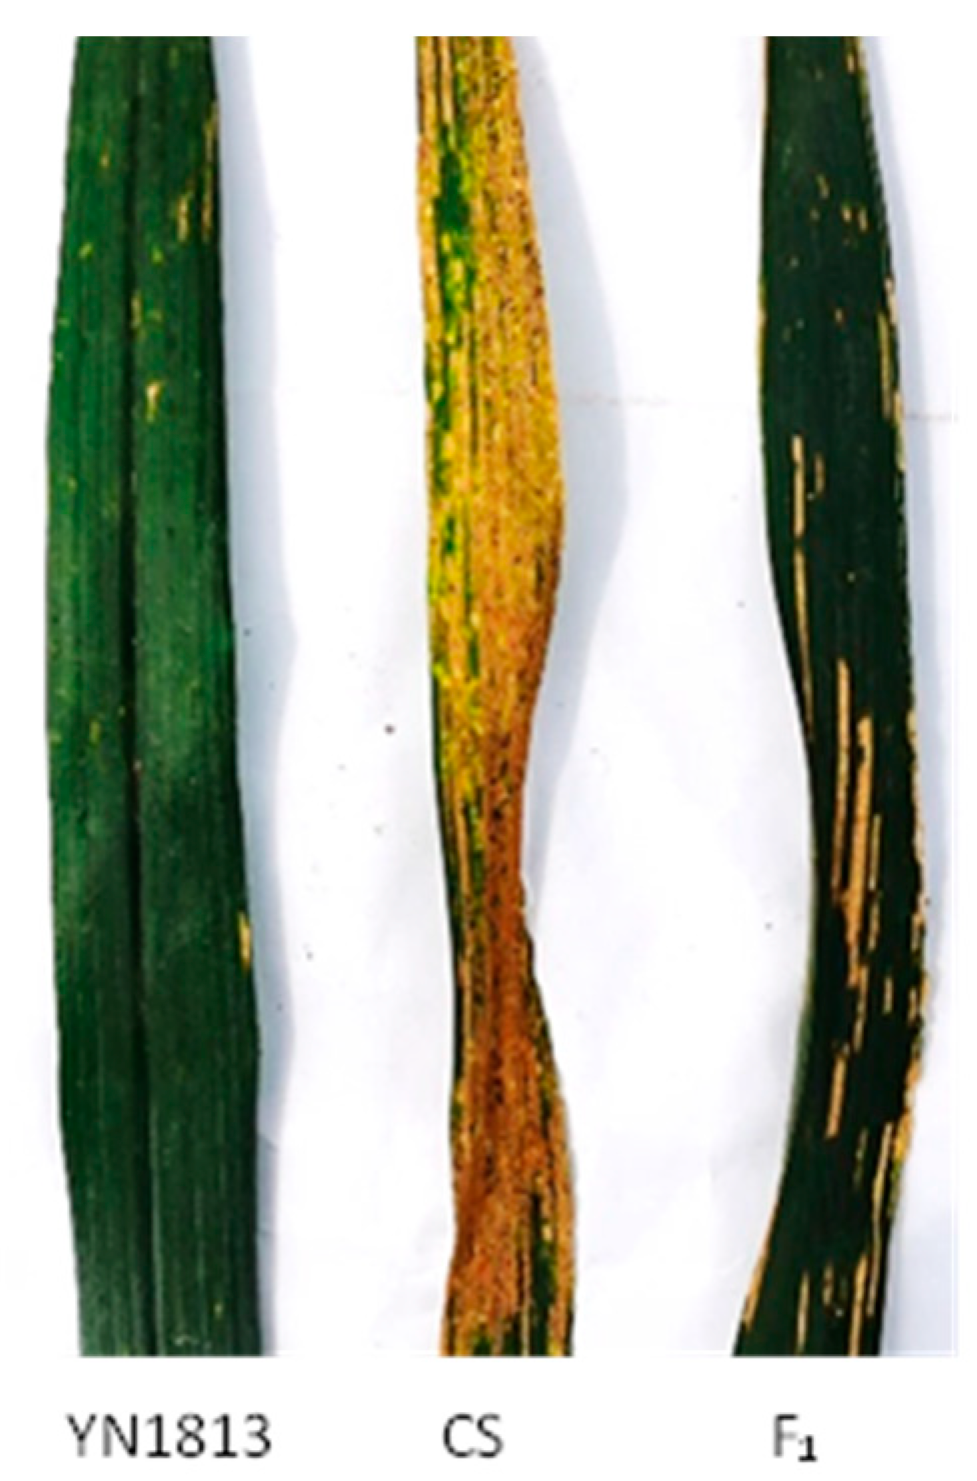
Figure 1. Phenotypic reactions of resistant parent YN1813, susceptible parent Chinese Spring (CS), and F1 progeny to mixed Pst races in the field in 22GS, respectively. YN1813 displayed a high resistance reaction (IT 0 to 3), CS displayed a moderate to high susceptible reaction (IT 7 to 9), and F1 plants from cross YN1813 × CS displayed a high to moderate resistance reaction (IT 3 to 5).
Agriculture 14 01044 g001
Figure 2. Frequency distribution and correlations among environments of disease severity for 306 RIL. (A) Mean disease severity frequency distributions for 306 RIL at the adult plant stages. The average values for the parents YN1813 and CS are indicated by arrows, respectively. (B) Violin plots of the disease severity probability density distributions for RIL in all environments. The values of correlation coefficients (r) for mean disease severity of the RIL across environments are shown in the violin plots. ***, p < 0.001.
Agriculture 14 01044 g002
Figure 3. Linkage map and QTL mapping of QYr.hau-7B and QYr.hau-7D (A,C) and the consensus map used to compare with previously identified QTL or genes associated with stripe rust resistance (B,D). The QTL positions marked by red letters in (A,C) are the average positions of the QTL peaks in different environments. The colored columns on the chromosome indicate the corresponding gene.
Agriculture 14 01044 g003
Figure 4. Box plots for average disease severity at the adult plant stage associated with the two QTLs identified in the YN1813 × CS RIL. ** and ***, p < 0.01 and p < 0.001, respectively.
Agriculture 14 01044 g004
Figure 5. Thorough haplotype analysis at QYr.hau-7B locus in 447 wheat accessions. (A) Recombinants involving adjacent markers with number of lines in each group indicated in parenthesis. French gray and dark gray squares represent homozygous resistant sites and homozygous susceptible sites, respectively. (B) Boxplot displays average infection type (IT) and disease severity (DS) of each group (haplotype) at adult growth stage. The ns, ** and ***, p > 0.05, p < 0.01, and p < 0.001, respectively. (C) LD heatmap surrounding QYr.hau-7B.
Agriculture 14 01044 g005
Figure 6. The genotyping results of some test materials and the difference in infection type and disease severity between two groups placed by AQP_AX89658728. (A) The genotyping results of some test materials using the AQP_AX-89658728 marker; the red dot, blue dot, green dot, and black squares indicate homozygous lines for the HEX-labeled alleles, homozygous lines for the FAM-labeled alleles, heterozygous lines, and negative controls (NTC), respectively; × indicates that the material is not typed. (B,C) lower-case letters on the error line, p < 0.01.
Agriculture 14 01044 g006
Table 1. Phenotypic reactions and H2 of parents and RIL populations to Pst isolates.
EnvironmentsParentsRIL (n = 306)H2
YN1813CSMinMaxMean
IT
20GS09094.4
21GS37093.6
21SC37094.2
DS (%)
20GS15919016.00.82
20SC366578748.50.82
21GS258010017.00.87
21SC141010026.80.94
Average10.155.51.894.227.10.86
Table 2. QTL for stripe rust resistance, detected in the YN1813 × CS RIL population using disease severity data from all environments.
QTL,
Environment
Genetic
Position a
(cM)
Flanking MarkerGenetic
Interval
(cM)
Physical
Interval b
(Mb)
LODPVE
(%)
Add
QYr.hau-7B
20GS-DS444.21AX-110908486AX-89658728444.22–444.05720.5–721.218.90.9−9.6
20SC-DS444.01AX-89658728AX-109489314444.05–441.96721.2–725.73.22.2−3.1
21GS-DS444.01AX-89658728AX-109489314444.05–441.96721.2–725.729.83.7−13.9
21SC-DS444.21AX-110908486AX-89658728444.22–444.05720.5–721.231.816.9−15.4
QYr.hau-7D
20GS-DS294.60AX-89378255AX-111654594294.65–293.9747.4–51.68.40.46.3
20SC-DS294.60AX-89378255AX-111654594294.65–293.9747.4–51.625.320.49.8
21GS-DS294.60AX-89378255AX-111654594294.65–293.9747.4–51.616.91.910.1
21SC-DS294.40AX-89378255AX-111654594294.65–293.9747.4–51.638.221.417.6
LOD, logarithm of odds score; PVE, percentage of phenotypic variation explained by the QTL; Add, additive effect of the resistance allele. a Peak position in centiMorgans (cM) from the first linked marker of the relevant linkage group. b Physical location in mega base (Mb) from linked markers in wheat genome.
Table 3. Distribution of resistance accessions and resistance genotypes (TTs) across different source accessions in 712 accessions.
CountryOriginNo.IT MeanDS MeanR No. (%)R/TT No. (%)
ChinaHenan3395.948.3160 (47.2)104 (65)
ChinaSichuan504.626.340 (80.0)7 (17.5)
ChinaShandong488.278.55 (10.4)1 (20.0)
ChinaHebei448.281.55 (11.4)2 (40.0)
ChinaJiangsu428.384.15 (11.9)1 (20.0)
ChinaAnhui418.282.12 (4.9)1 (50.0)
ChinaBeijing255.947.911 (44.0)7 (63.6)
ChinaShanxi215.944.915 (71.4)0 (0.0)
Chinaother195.947.710 (52.6)5 (50.0)
ChinaGuizhou66.345.54 (66.7)0 (0.0)
ChinaYunnan42.88.84 (100.0)0 (0.0)
ChinaNingxia38.786.73 (100.0)0 (0.0)
ChinaChongqing25.026.52 (100.0)0 (0.0)
ChinaHubei25.050.01 (50.0)0 (0.0)
ChinaTianjin27.577.52 (100.0)0 (0.0)
ChinaShan’xi18.080.00 (0.0)0 (-)
ChinaXinjiang18.070.01 (100.0)0 (0.0)
CIMMYT 464.327.533 (71.7)24 (72.7)
Australia 76.455.72 (28.6)1 (50.0)
Europe 33.312.03 (100.0)2 (66.7)
France 36.350.31 (33.3)1 (100.0)
America 14.040.01 (100.0)1 (100.0)
Holland 13.01.01 (100.0)0 (0.0)
Mexico 14.040.01 (100.0)1 (100.0)
R No. (%), the number of resistance accessions identified in every area, with numbers in parentheses indicating the percentages; R/TT No. (%), the numbers of accessions identifying a TT genotype in resistance accessions identified in every area, with numbers in parentheses indicating the percentages.
Disclaimer/Publisher’s Note: The statements, opinions and data contained in all publications are solely those of the individual author(s) and contributor(s) and not of MDPI and/or the editor(s). MDPI and/or the editor(s) disclaim responsibility for any injury to people or property resulting from any ideas, methods, instructions or products referred to in the content.