Article

Cyclic Electron Flow Alleviates the Stress of Light Fluctuation on Soybean Photosynthesis

1
College of Agronomy, Sichuan Agricultural University, Chengdu 611130, China
2
Sichuan Engineering Research Center for Crop Strip Intercropping System, Sichuan Agricultural University, Chengdu 611130, China
3
Cash Crops Research Institute, Guangxi Academy of Agricultural Sciences, Nanning 530007, China
*
Author to whom correspondence should be addressed.
Agriculture 2024, 14(7), 1056; https://doi.org/10.3390/agriculture14071056
Submission received: 25 May 2024 / Revised: 25 June 2024 / Accepted: 28 June 2024 / Published: 30 June 2024
(This article belongs to the Section Crop Production)

Abstract

:
Crops often face light intensity fluctuations in natural settings. Intercropping is widely used to improve crop yield and resource utilization worldwide, but crops suffer from high-frequency and high-intensity light fluctuations due to mutual crop influence. Soybean is an important legume crop and is often intercropped with other crops, but little is known about soybean’s response to light fluctuation environments. Herein, three fluctuation frequencies (1, 10, and 20 min/cycle) were used to analyze soybean photosynthesis responses by measuring leaf growth, chlorophyll content, gas exchange, and electron transfer. Our data revealed that faster fluctuation frequencies led to the stronger suppression of soybean morphology and photosynthesis, with significant reductions of 31.31% and 21.58%, respectively. Damage to photosystems II (PSII) and I (PSI) also intensified, with significant decreases of 18.52% and 18.38% in their effective quantum yields Y(II) and Y(I). Additionally, increased fluctuation frequency exacerbated the consumption of the plastoquinone pool and linear electron flow but enhanced the cyclic electron flow across the thylakoid membrane and, thus, increased heat dissipation in PSII. Our findings indicate that an increased fluctuation frequency inflicted more severe damage on the soybean photosynthesis system. However, PSI-enhanced CEF improved NPQ and coordinated photoprotection to some extent.

1. Introduction

The global population is growing rapidly, whereas arable land is limited. Thus, the significant challenge of increasing food production is posed to humanity. Maximizing yield on restricted farmland requires exploiting the production potential of crops, cultivating varieties with high yield and light efficiency, and using efficient farming methods. Intercropping, which uses resources efficiently and offers various ecological benefits, enables multiple harvests in a single season. Crop yield depends directly or indirectly on photosynthesis products, highlighting the fundamental role of photosynthesis in yield formation [1,2]. Plant leaves receive light fluctuation under natural conditions caused by changes in the sun’s angle, cloud movement, and shading from upper crop leaves [3]. Consequently, lower crop leaves absorb irradiance levels that fluctuate intensely, with time scales ranging from seconds to hours. Crop leaves experience alternating light-and-dark stages, which may be periodic or irregular. Light fluctuation conditions produce plants with thinner leaves, lower leaf light-absorption rates, and overall inhibition [4]. Extensive research has been conducted on the adaptability of sun-loving plants, such as Arabidopsis, cucumber, and corn [5,6], and shade-tolerant plants, such as camellia and flat-leaf vanilla, to light fluctuation [7,8]. Light fluctuation environments induce changes in plant stomatal morphology, leaf thickness, chlorophyll (Chl) content, and photosynthesis characteristics. Shade-tolerant plants show less variation in these traits, likely because of their lower sensitivity to light fluctuation.
Photosynthesis’ response to light fluctuations is not immediate and varies based on the frequency, amplitude, and duration of light fluctuations, as well as the genetic and physiological traits of the species. Ever-changing light conditions influence the efficiency and adaptability of plant photosynthesis regulation mechanisms. Light fluctuation itself presents a potential stress condition capable of instantaneously generating extreme redox and thylakoid potentials, thereby necessitating a readjustment of the photosynthetic mechanism [9]. Previous studies have found that photosystems under light fluctuation can sustain varying degrees of damage. The primary light-induced damage to PSII involves the impairment of the donor-side oxygen-evolving complex and the obstruction of the PSII receptor-side P680* [10]. Aerobic conditions at normal temperatures initially deactivate the PSI receptor side and then destroy the PSI reaction center [11]. However, plants adapt to light fluctuation through various mechanisms, such as allocating absorbed light energy between photosynthesis and light-protective dissipation. They also regulate light-energy distribution between PSII and PSI through state transitions, maintaining an electron transfer rate that matches available light energy and regulating the oxidation state of PSI’s primary electron donor, P700. Fluctuating intense light generates excess electrons, triggering reactive oxygen species production and photosystem damage if not utilized promptly during the weak light phase [12].
As a light-protection mechanism, the cyclic electron flow (CEF) around PSI receives considerable research attention. CEF regulates the electron transfer rate, maintains ATP/NADPH balance, and protects photosystems [13]. In CEF, electrons from NADPH or ferredoxin return to the chloroplast quinone pool from PSI, generating ΔpH across the thylakoid membrane, which drives ATP synthesis by chloroplast ATP synthase. CEF enhances photosynthesis efficiency and avoids potential damage, showing the adaptability of plants to changing environments. The intensity and duration of external environmental light influence the photosynthetic physiological processes of plants. In a fluctuating environment, most plants have a conversion rate much lower than the theoretical maximum, suggesting considerable improvement potential. Current soybean photosynthesis research primarily uses controllable constant light conditions, which fail to capture the impact of a complex light environment on plants [14]. Although previous studies have emphasized the role of light fluctuation intensity, the potential impact of fluctuating frequency on photosynthesis remains unclear.
In the present study, the growth of soybeans, Chl content, gas exchange, and the photosystem electron transfer chain were measured under three different frequencies of light fluctuation and one constant light. We aimed to assess the response of different components of soybean photosynthetic electron transfer to light fluctuation frequency.

2. Materials and Methods

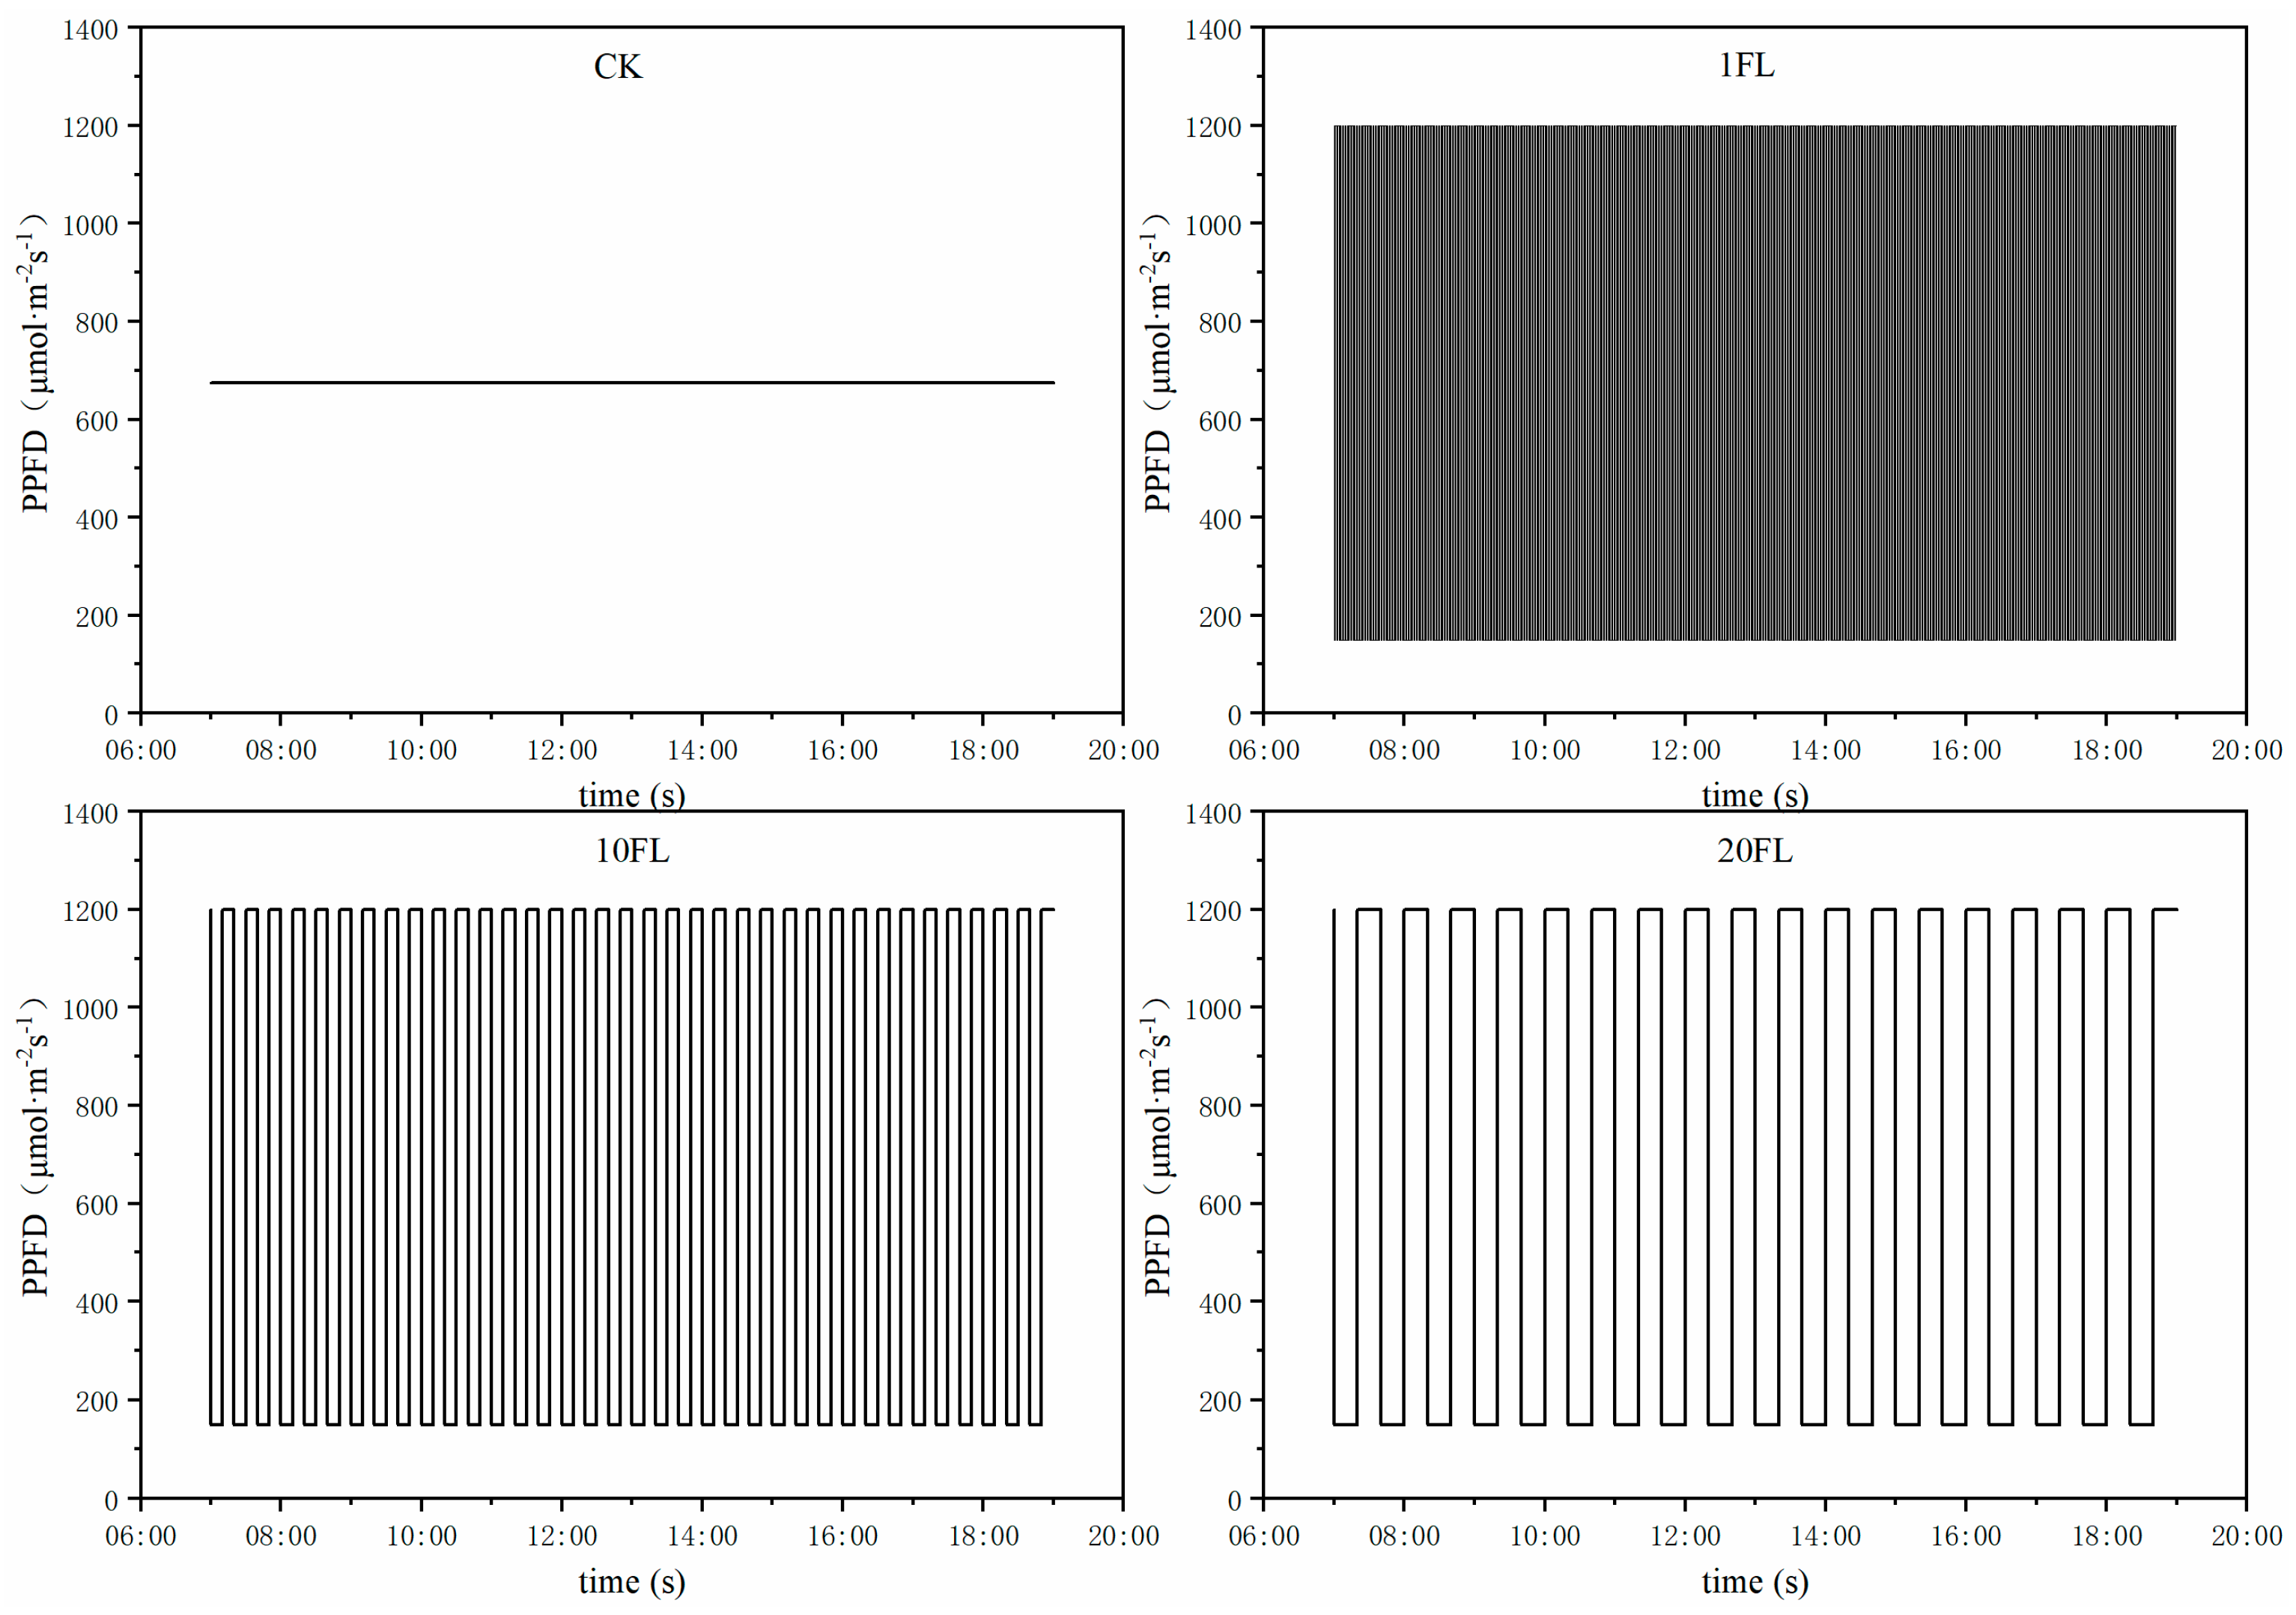
2.1. Plant Material and Growth Conditions

The pot experiment used the soybean variety William82 and was conducted in an artificial climate room, with a 12 h photoperiod and temperatures of 25 °C during the day and 22 °C at night. Seeds with full and uniform grains were allowed to germinate on a damp gauze in darkness. After germination, we selected the robust sprouts and planted them in the substrate of PINDSTRUP nutrient soil and vermiculite at a 3:1 ratio after removing the seed coating. We set up two types of LED lamps (1200 and 150 μmol·m−2·s−1) in the climate chamber and controlled the duration of strong and weak light by a relay. The experimental light was square wave fluctuation. We set up four treatments (Figure 1) as follows: constant light (CK) and different light fluctuation frequencies of strong and weak light, i.e., 1. 10, and 20 min (denoted as 1FL, 10FL, and 20FL, respectively). The average light intensity of the four light treatments was 675 μmol·m2·s−1 within one day. We sowed seeds in 400 mL pots filled with a mixed matrix of PINDSTRUP organic soil (Pindstrup Mosebrug A/S, Ryomgaard, Denmark) and vermiculite (v:v, 3:1) in a light chamber. We repeated the experiment twice. After 25 days, we measured all indicators after the third compound leaf of the soybean had fully expanded.

2.2. Measurement of Morphology and Photosynthetic Pigments

When the third compound leaf of the soybean plant was fully expanded, five plants with consistent growth were selected for each treatment. Plant height was determined by measuring the distance from the base of the plant to the growth point at the top with a ruler [15]. Samples were collected from the middle of the fully expanded compound leaf, avoiding the veins by punching holes. The punched samples and the remaining leaf tissue were placed in an envelope bag. They were then blanched at 105 °C for 1 h and dried at 80 °C until a constant weight was achieved. The dry mass of the leaf was measured, and the leaf area and specific leaf weight of individual soybean plants were calculated [16]. Similarly, five other plants with consistent growth were selected. Four circular samples with a diameter of 12 mm were collected from the middle compound leaf of each plant by punching holes. The pigments were extracted using a mixed solution of 45% acetone and 45% ethanol. They were then quantified using the Arnon (1949) method and a Specord 200-plus dual-beam UV spectrophotometer (Analytik, Jena, Germany) [17].

2.3. Measurement of Photosynthesis Capacity

A light-response curve was drawn on the fully expanded compound leaf of soybean using the LI-COR6800 Portable Photosynthesis System (LI-COR, Inc. Lincoln, NE, USA). The PAR in the leaf chamber was set to 2300 µmol·m−2·s−1, The carbon dioxide concentration was 400 μmol·m−2·s−1. After the soybean leaf was clamped into the leaf chamber, it was allowed to adapt for 20–30 min. Measurements were started after the photosynthesis parameters had stabilized. The light intensity gradient was set to 2300, 2200, 2000, 1800, 1600, 1400, 1200, 1000, 800, 600, 400, 250, 100, 50, 25, and 0 μmol·m−2·s−1 [18]. The measurement results were fitted with a right-angle hyperbolic correction model [19] to determine the maximum net photosynthesis rate (Pnmax), dark respiration rate (Rd), and light compensation point (Ic) for each soybean treatment. From the total soybean plants in the test treatment, we selected five morphologically homogeneous and representative plants for further analysis, and the average value of two batches of seedlings was taken as the final result.

2.4. Measurement of Chl Fluorescence Induction Kinetics

After the soybeans in each treatment had adapted to darkness (for 30 min), the Chl fluorescence induction kinetics were measured using a plant efficiency analyzer (HandyPEA, Norfolk, UK). Fluorescence transients were recorded during a 1 s light pulse. Each multiphase rise in fluorescence transients (OJIP curve) was analyzed according to the JIP test, as described in the literature. During the measurement, the middle part of a healthy compound leaf was selected, with 10 pots were measured for each treatment [20]. The following original data were retained: maximum fluorescence intensity (Fm), minimum fluorescence intensity (Fo) at 20 μs, and fluorescence intensity at 2 ms (J-step) and 30 ms (I-step). The Chl fluorescence yield (Fv, defined as Fm − Fo), i.e., the maximum quantum yield of PSII, was (Fv/Fm = 1 − Fo/Fm). When the maximum fluorescence value was reached (t = Fm), ABS/CSm represented the energy absorbed per unit leaf cross-sectional area, approximately equal to Fm. TR0/CSm represents the energy captured per unit leaf cross-sectional area. ET0/CSm represents the energy of electron transfer per unit leaf cross-sectional area. DI0/CSm represents the energy of heat dissipation per unit leaf cross-sectional area [21].

2.5. Measurement of P700 Oxidation and Plastoquinone (PQ) Size

The soybeans in each light treatment were initially measured for PSII parameters using a DUAL-PAM-100 instrument (Walz) with a saturating pulse (20,000 μmol photons·m−2·s−1, 300 ms). After at least 20 min of dark adaptation, the oxidation–reduction state of the PSI reaction center was analyzed by measuring the absorbance of P700 according to a predefined protocol [22]. After the P700 dark reduction curve was obtained, the plants did not need to adapt to darkness, and the size of the PQ pool was measured immediately. The far-red light was first turned on, followed by a waiting period of 10 s. Then, a single turnover saturation flash (ST) was turned on and maintained for an additional 10 s, followed by the activation of a multi-turnover saturation flash (MT) sustained for 30 s. The far-red light was then deactivated to conclude the measurements. The resulting curve was obtained and used to calculate the size of the PQ pool using the following formula: PQ size = MT area/ST area. This entire procedure was repeated five times for each treatment group to ensure accuracy and consistency in the results [15].

2.6. Statistical Analysis

Data were organized using Microsoft Excel 2016 software, and variance analysis (LSD) was performed on the data using SPSS 26.0. Significant differences were observed between the treatments at p < 0.05. GraphPad Prism8.0 was used to plot the graphs.

3. Results

3.1. Soybean Morphology and Photosynthetic Pigments

We first examined the morphological measurements and pigment extractions from soybeans subjected to various light treatments. As expected, with long-term exposure to light fluctuation, soybean growth is inhibited, and leaf Chl content is reduced (Table 1). As the frequency of light fluctuation increases, the inhibition of soybean plant height and leaf area per plant intensifies(Figure 2). Compared with the CK-treated control, the 1FL treatment resulted in a significant decrease in plant height of 31.31% and leaf area of 21.58%, respectively. Higher fluctuation frequencies result in a greater specific leaf weight in soybeans. We also measured the pigment content of soybean leaves. While higher frequencies significantly reduce Chl content, the effect on carotenoid content was not statistically significant among the four treatments. The order of reduction in Chl content was 1FL < 10FL < 20FL. Under 1FL treatment, Chl and carotenoids decreased by 29.52% and 3.96%, respectively. Interestingly, under light fluctuation, the Chl a/b content increased compared with constant light. Specifically, under the 20FL treatment, it significantly rose by 22.17%.

3.2. Soybean Photosynthesis and Fluorescence

We obtained the light-response curves of soybean leaves and fitted the results to the rectangular hyperbola correction model(Figure 3a–d).
This determined the maximum net photosynthesis rate (Pnmax), dark respiration rate (Rd), and light compensation point (Ic) for each soybean treatment. Under light fluctuation, Pnmax decreased. It further decreased as fluctuation frequency increased. At the fastest frequency, 1FL, Pnmax significantly dropped by 14.64%. Light fluctuation also reduced Rd and Ic. At slower frequencies, Rd and Ic were higher. Specifically, under 20FL treatment, Rd and Ic significantly fell by 42.89% and 46.13%, respectively. The fluorescence induction kinetics curve revealed an increase in fluorescence value at the O-J point with higher fluctuation frequency(Figure 3e–j). The primary differences between treatments occurred at the J point (Fj), with stronger fluorescence observed at higher fluctuation frequencies (1FL > 10FL > 20FL). Four specific activity parameters, namely, ABS/CSm, TR0/CSm, ET0/CSm, and DI0/CSm, reflect the activity per PSII reaction center. These parameters consistently exhibit a decrease under long-term light fluctuation. Specifically, a higher fluctuation frequency (1FL) corresponds to a lower value.

3.3. Soybean Photosystem Energy Allocation

Figure 4a shows that in soybeans under different light-fluctuation conditions, Y(II) decreases as the fluctuation frequency increases (1FL), with an 18.52% reduction in PSII’s light–energy conversion rate compared to the control condition (CK). Conversely, Y(NO), the quantum yield of non-regulated energy dissipation within PSII, increased significantly by 14.29% under 1FL and by 3.36% and 6.75% under 10FL and 20FL, respectively. Y(NPQ), the quantum yield of regulated energy dissipation in PSII, showed even more pronounced responses. It increased significantly by 27.38% under 1FL and by 25.18% under 10FL. Figure 4b,c shows that Fv/Fm, reflecting the maximum light–energy conversion efficiency of PSII, increased by a modest 0.31% under 20FL. However, it decreased significantly under other treatments. No significant differences were found between the four treatments for qP (photochemical quenching) and NPQ (non-photochemical quenching). Figure 4e,f indicate that light fluctuation reduces Pm and Pm’. Notably, 1FL and 10FL treatments showed significantly lower values than 20FL. Additionally, a higher fluctuation frequency (1FL) corresponded with a lower Y(I). A significant reduction of 18.38% was observed under 1FL treatment.

3.4. Soybean Photosynthetic Electron Transport

Light fluctuation enhances the relative electron transport rates through PSII and PSI (Figure 5a–d).
The quantum yield of CEF around PSI, represented as Y(CEF), experiences a 14.08% increase under 10FL treatment with light fluctuation. The ratio of cyclic to linear electron flow, expressed as Y(CEF)/Y(II), escalates under 1FL and 10FL treatments but significantly diminishes under 20FL. Although the PSI donor side does not exhibit significant differences among treatments, light fluctuation induces PSI acceptor-side limitations, resulting in substantial increases of 49.79%, 45.40%, and 14.88% (Figure 5e,f).

3.5. Soybean Cyclic Electronic Transfer

Under conditions of light fluctuation, the decline rate of the P700 dark reduction curve accelerated (Figure 6a). The decline rates under 1FL and 10FL were similar and exceeded those under 20FL and CK. This suggests that an increase in the frequency of light fluctuation corresponded with an increase in the cyclic electron transfer rate around PSI. The functional PQ pool, a photosynthetic electron transporter, facilitates the transfer of electrons from PSII to the cytochrome b6f complex (Cyt b6f). It functions as an electron and proton buffer, maintaining an equilibrium in electron transfer between light systems. Under light fluctuation conditions, the PQ pool in soybeans escalates in frequency. The dashed line in Figure 5c represents the slope of fluorescence rise (K), which signifies cyclic electron activity. The computed slopes reveal the following order: 10FL > 1FL > 20FL > CK. While no significant difference was observed between 10FL and 1FL, both significantly deviated from CK and 20FL treatments.

4. Discussion

4.1. Frequent Light Fluctuations Inhibit Soybean Growth and Chl Content

Plants have robust regulatory capabilities to adapt to variations in light conditions within a certain range. This study shows that light fluctuation impedes soybean growth, primarily reducing leaf area and Chl content per plant (Table 1). The inhibition intensity on plants rises with the fluctuation frequency. Soybean leaves have a higher specific leaf weight under higher frequency light fluctuation, but the plant height and maximum net photosynthesis rate decrease. Wright et al. [23] demonstrated that increased specific leaf weight corresponds with a higher investment per unit leaf area, bolstering the plant’s resilience but resulting in a lower photosynthesis capacity and slower growth rate.
Plant leaves have key parameters for utilizing strong and weak light, i.e., the light saturation point and light compensation point [22,24]. The study shows that higher frequency light fluctuation lowers the light saturation point of soybean leaves but raises the light compensation point and dark respiration rate (Figure 3a–d). Previous studies have demonstrated that plant Chl content rises under weak light and falls under high light [25]. Due to the brief duration of low and high light periods under rapidly fluctuating light, Chl, damaged by strong light, may not recover during the weak light stage, resulting in lower photosynthesis in soybean leaves. Enhanced photorespiration in plants protects the photosynthetic apparatus from strong light, consumes high-energy electrons excited by the fluctuating strong light, and prevents severe photosystem damage [26].

4.2. High-Frequency Light Fluctuation Damages the Photosynthesis System

PSII and PSI, integral components of the photosynthetic electron transfer chain, play pivotal roles in photosynthesis’ photochemical reactions. The fluorescence induction kinetic OJIP curve results show that the main differences between each treatment occur in the “photochemical phase” O–J phase. The fluorescence rise in this stage of the phase is related to the closure of some PSII reaction centers, reflecting QA’s reduction level (Figure 3e,f) [25]. The study indicates that higher fluctuation frequency increases the fluorescence value from point O to J more, implying that high-frequency light fluctuation hinders the electron-transfer efficiency from QA to QB for the acceptor side. This finding agrees with the research by Chen Dong et al. on wheat [26]. The four specific activity parameters ABS/CSm, TR0/CSm, ET0/CSm, and DI0/CSm indicate the unit PSII reaction center’s activity. They all follow the same trend under different treatments, i.e., the PSII reaction center’s activity decreases with increased frequency (Figure 3e,f). This finding suggests that the D1 protein may be damaged, lowering the acceptor side of PSII’s performance [27].
Plant leaves use a minor portion in absorbed light for the photosynthetic electron chain but discharge the majority as heat dissipation and fluorescence. Excess light energy is produced when light absorption exceeds photosynthesis requirements. It can cause photoinhibition and damage the photosynthetic reaction center complex in the leaves, lowering photosynthesis efficiency [27]. Light-fluctuation frequency treatments change the soybean photosystem and light-energy allocation. The effective quantum yield and maximum light–energy conversion efficiency of PSII decreases with increased frequency, but qP and NPQ do not differ under different light treatments (Figure 4a–d). This finding differs from that of Qiao et al. [5]. They studied the C4 crop corn and found that rapidly fluctuating light lowers corn qP and raises NPQ. However, under treatments with faster fluctuation frequencies, the Y(NO) in soybean is higher, indicating that the photochemical energy conversion and protective regulatory mechanisms (such as heat dissipation) are still insufficient to completely consume the light energy absorbed by the plants. Thus, the excess energy affects PSI. Flickering light affects the PSI of angiosperms differently. Camellia [26] resists light inhibition, but rice [13] and tobacco [28] suffer from it. Light fluctuations can cause photoinhibition to PSI. This study shows that higher light-fluctuation frequency reduces the soybean PSI complex content and the actual photosynthesis efficiency (Figure 4e,f), damaging the soybeans’ PSI under rapidly fluctuating light.

4.3. Increasing the Fluctuation Frequency Enhances Cyclic Electron Flow and its Regulation

High-frequency light fluctuation damages the two important light systems of soybean, reducing their photosynthetic electron transfer and restricting the acceptor side of PSI (Figure 5). The over-reduction in ferredoxin (FeS) on the PSI acceptor side and the reaction of the hydroxyl group from the PSI donor side with reduced FeS causes the damage and degradation of the PSI complex [29]. In response to this rapid light fluctuation, soybean leaves increase the rate of cyclic electron transfer around PSI (Figure 6a). This process dissipates excess electrons on the PSI side of P700, which is in a higher oxidized state and optimizes the redox state of PSI [30]. Cyclic electron transfer also establishes ΔpH, which acidifies the thylakoid lumen and stimulates heat dissipation. Thus, excess excitation energy is safely and harmlessly dissipated as heat. Consequently, soybeans under rapidly fluctuating light have the same heat dissipation as those under other light treatments.
As a cyclic electron pathway, the NDH pathway reportedly consumes NADPH rapidly to prevent the over-reduction in the photosystem to establish ΔpH and stimulate the heat dissipation of the xanthophyll cycle for dissipating excess light energy, thereby alleviating photoinhibition [31]. A higher frequency of light fluctuation corresponds with a higher activity of the cyclic electron NDH pathway in soybean leaves (Figure 6c). This pathway is a necessary condition for the rapid oxidation of P700 in C3 plant leaves [12]. The functional PQ pool is a photosynthetic electron transfer agent. As a buffer pool for electrons and protons, it can balance the electron transfer between the two photosystems. Under light fluctuation, the PQ pool of soybeans increases, and the PQ pool increases with increased frequency (Figure 6b), leading to a reduced PQ pool (PQH2). All of these phenomena are connected (Figure 7).
The electrons on the acceptor side of PSI return to plastoquinone (PQH2) through ferredoxin (Fd), resulting in different H+ concentrations inside and outside the thylakoid lumen, creating a proton gradient across the thylakoid membrane (ΔpH). ΔpH can acidify the thylakoid lumen and stimulate heat dissipation, enhancing the photoprotection of soybean leaves under rapidly fluctuating light [13].

5. Conclusions

A slower light fluctuation frequency corresponded with a greater increase in the soybean leaf area. We observed a higher light–energy conversion rate in the photosynthetic system. An increase in fluctuation frequency can damage PSII and PSI, cause over-reduction in the PQ pool, and ultimately reduce the rate of the linear electron transfer chain. However, high-frequency light fluctuation stimulates cyclic electron transfer around PSI, which is conducive to the activation of heat dissipation in the thylakoid lumen. Thus, the photoprotection of soybean leaves under rapid light fluctuation is enhanced to a certain extent.

Author Contributions

Conceptualization, Y.L. and F.Y.; methodology, J.G.; software, Q.W.; validation, D.D., Y.Z. and W.Z.; formal analysis, X.T.; investigation, Z.S.; resources, W.Z.; data curation, J.G.; writing—original draft preparation, Y.L.; writing—review and editing, W.Y.; visualization, F.Y.; supervision, W.Y.; project administration, F.Y.; funding acquisition, F.Y. All authors have read and agreed to the published version of the manuscript.

Funding

This work was supported by the National Key Research and Development Program of China (2022YFD2300902); the Guangxi Key Research and Development Program of China (GuikeAB23026107); and the Program on Industrial Technology System of National Soybean (CARS-04-PS19).

Institutional Review Board Statement

Not applicable.

Data Availability Statement

The data presented in this study are available on request from the corresponding author.

Conflicts of Interest

The authors declare no conflict of interest.

References

  1. Yang, Y.; Wang, L.; Che, Z.; Wang, R.; Cui, R.; Xu, H.; Chu, S.; Jiao, Y.; Zhang, H.; Yu, D.; et al. Novel target sites for soybean yield enhancement by photosynthesis. J. Plant Physiol. 2022, 268, 153580. [Google Scholar] [CrossRef] [PubMed]
  2. De Souza, A.P.; Burgess, S.J.; Doran, L.; Hansen, J.; Manukyan, L.; Maryn, N.; Gotarkar, D.; Leonelli, L.; Niyogi, K.K.; Long, S.P. Soybean photosynthesis and crop yield are improved by accelerating recovery from photoprotection. Science 2022, 377, 851–854. [Google Scholar] [CrossRef] [PubMed]
  3. Durand, M.; Matule, B.; Burgess, A.J.; Robson, T.M. Sunfleck properties from time series of fluctuating light. Agr. Forest Meteorol. 2021, 308–309, 108554. [Google Scholar] [CrossRef]
  4. Longoni, F.; Grieco, M.; Santabarbara, S.; Harbinson, J. Editorial: Photosynthesis under fluctuating light. Front. Plant Sci. 2023, 14, 1220360. [Google Scholar] [CrossRef] [PubMed]
  5. Qiao, M.; Zhang, Y.; Liu, L.; Shi, L.; Ma, Q.; Chow, W.S.; Jiang, C. Do rapid photosynthetic responses protect maize leaves against photoinhibition under fluctuating light? Photosynth. Res. 2021, 149, 57–68. [Google Scholar] [CrossRef] [PubMed]
  6. Kono, M.; Yamori, W.; Suzuki, Y.; Terashima, I. Photoprotection of PSI by Far-Red Light Against the Fluctuating Light-Induced Photoinhibition in Arabidopsis thaliana and Field-Grown Plants. Plant Cell Physiol. 2017, 58, 35–45. [Google Scholar] [CrossRef] [PubMed]
  7. Wang, H.; Wang, X.Q.; Zeng, Z.L.; Yu, H.; Huang, W. Photosynthesis under fluctuating light in the CAM plant Vanilla planifolia. Plant Sci. 2022, 317, 111207. [Google Scholar] [CrossRef] [PubMed]
  8. Sun, H.; Zhang, S.B.; Liu, T.; Huang, W. Decreased photosystem II activity facilitates acclimation to fluctuating light in the understory plant Paris polyphylla. Biochim. Biophys. Acta (BBA)–Bioenerg. 2020, 1861, 148135. [Google Scholar] [CrossRef] [PubMed]
  9. Zhang, S.; Gong, J.; Xiao, C.; Yang, X.; Li, X.; Zhang, Z.; Song, L.; Zhang, W.; Dong, X.; Hu, Y. Bupleurum chinense and Medicago sativa sustain their growth in agrophotovoltaic systems by regulating photosynthetic mechanisms. Renew. Sustain. Energy Rev. 2024, 189, 114024. [Google Scholar] [CrossRef]
  10. Chauhan, J.; Prathibha, M.D.; Singh, P.; Choyal, P.; Mishra, U.N.; Saha, D.; Kumar, R.; Anuragi, H.; Pandey, S.; Bose, B.; et al. Plant photosynthesis under abiotic stresses: Damages, adaptive, and signaling mechanisms. Plant Stress 2023, 10, 100296. [Google Scholar] [CrossRef]
  11. Zivcak, M.; Brestic, M.; Kunderlikova, K.; Sytar, O.; Allakhverdiev, S.I. Repetitive light pulse-induced photoinhibition of photosystem I severely affects CO 2 assimilation and photoprotection in wheat leaves. Photosynth. Res. 2015, 126, 449–463. [Google Scholar] [CrossRef]
  12. Shimakawa, G.; Miyake, C. Changing frequency of fluctuating light reveals the molecular mechanism for P700 oxidation in plant leaves. Plant Direct 2018, 2, e73. [Google Scholar] [CrossRef] [PubMed]
  13. Yamori, W.; Shikanai, T. Physiological Functions of Cyclic Electron Transport Around Photosystem I in Sustaining Photosynthesis and Plant Growth. Annu. Rev. Plant Biol. 2016, 67, 81–106. [Google Scholar] [CrossRef] [PubMed]
  14. Wada, S.; Yamamoto, H.; Suzuki, Y.; Yamori, W.; Shikanai, T.; Makino, A. Flavodiiron Protein Substitutes for Cyclic Electron Flow without Competing CO 2 Assimilation in Rice. Plant Physiol. 2018, 176, 1509–1518. [Google Scholar] [CrossRef] [PubMed]
  15. Li, H.; Zeng, S.; Luo, X.; Fang, L.; Liang, Z.; Yang, W. Effects of small ridge and furrow mulching degradable film on dry direct seeded rice. Sci. Rep. 2021, 11, 317. [Google Scholar] [CrossRef] [PubMed]
  16. Sunoj, V.; Prasad, P.; Ciampitti, I.A.; Maswada, H.F. Narrowing Diurnal Temperature Amplitude Alters Carbon Tradeoff and Reduces Growth in C(4) Crop Sorghum. Front. Plant Sci. 2020, 11, 1262. [Google Scholar] [CrossRef] [PubMed]
  17. Arnon, D.I. Copper Enzymes in Isolated Chloroplasts. Polyphenoloxidase in Beta Vulgaris. Plant Physiol. 1949, 24, 1–15. [Google Scholar] [CrossRef] [PubMed]
  18. Sun, J.; Lu, N.; Xu, H.; Maruo, T.; Guo, S. Root Zone Cooling and Exogenous Spermidine Root-Pretreatment Promoting Lactuca sativa L. Growth and Photosynthesis in the High-temperature Season. Front. Plant Sci. 2016, 7, 368. [Google Scholar] [CrossRef] [PubMed]
  19. Chen, J.; Wu, F.H.; Wang, W.H.; Zheng, C.J.; Lin, G.H.; Dong, X.J.; He, J.X.; Pei, Z.M.; Zheng, H.L. Hydrogen sulphide enhances photosynthesis through promoting chloroplast biogenesis, photosynthetic enzyme expression, and thiol redox modification in Spinacia oleracea seedlings. J. Exp. Bot. 2011, 62, 4481–4493. [Google Scholar] [CrossRef] [PubMed]
  20. Schansker, G.; Tóth, S.Z.; Strasser, R.J. Methylviologen and dibromothymoquinone treatments of pea leaves reveal the role of photosystem I in the Chl a fluorescence rise OJIP. Biochim. Biophys. Acta (BBA)–Bioenerg. 2005, 1706, 250–261. [Google Scholar] [CrossRef] [PubMed]
  21. Strasserf, R.J.; Srivastava, A.; Govindjee. Polyphasic Chlorophyll a Fluorescence Transient in Plants and Cyanobacteria. Photochem. Photobiol. 1995, 61, 32–42. [Google Scholar] [CrossRef]
  22. Kabir, M.Y.; Nambeesan, S.U.; Díaz-Pérez, J.C. Carbon dioxide and light curves and leaf gas exchange responses to shade levels in bell pepper (Capsicum annuum L.). Plant Sci. 2023, 326, 111532. [Google Scholar] [CrossRef] [PubMed]
  23. Wright, I.J.; Reich, P.B.; Westoby, M.; Ackerly, D.D.; Baruch, Z.; Bongers, F.; Cavender-Bares, J.; Chapin, T.; Cornelissen, J.H.; Diemer, M.; et al. The worldwide leaf economics spectrum. Nature 2004, 428, 821–827. [Google Scholar] [CrossRef] [PubMed]
  24. Gao, P.; Tian, Z.; Lu, Y.; Lu, M.; Zhang, H.; Wu, H.; Hu, J. A decision-making model for light environment control of tomato seedlings aiming at the knee point of light-response curves. Comput. Electron. Agric. 2022, 198, 107103. [Google Scholar] [CrossRef]
  25. Xu, Y.; Chen, S.; Zhao, S.; Song, J.; Sun, J.; Cui, N.; Chen, X.; Qu, B. Effects of light intensity on the photosynthetic characteristics of Hosta genotypes differing in the glaucousness of leaf surface. Sci. Hortic. 2024, 327, 112834. [Google Scholar] [CrossRef]
  26. Huang, W.; Yang, Y.; Zhang, S. The role of water-water cycle in regulating the redox state of photosystem I under fluctuating light. Biochim. Biophys. Acta (BBA)–Bioenerg. 2019, 1860, 383–390. [Google Scholar] [CrossRef] [PubMed]
  27. Endo, T.; Uebayashi, N.; Ishida, S.; Ikeuchi, M.; Sato, F. Light energy allocation at PSII under field light conditions: How much energy is lost in NPQ-associated dissipation? Plant Physiol. Biochem. 2014, 81, 115–120. [Google Scholar] [CrossRef] [PubMed]
  28. Tan, S.; Liu, T.; Zhang, S.; Huang, W. Balancing light use efficiency and photoprotection in tobacco leaves grown at different light regimes. Environ. Exp. Bot. 2020, 175, 104046. [Google Scholar] [CrossRef]
  29. Sonoike, K. Photoinhibition of photosystem I. Physiol. Plantarum 2011, 142, 56–64. [Google Scholar] [CrossRef]
  30. Yang, Y.; Zhang, S.; Wang, J.; Huang, W. Photosynthetic regulation under fluctuating light in field-grown Cerasus cerasoides: A comparison of young and mature leaves. Biochim. Biophys. Acta (BBA)–Bioenerg. 2019, 1860, 148073. [Google Scholar] [CrossRef]
  31. Lu, J.; Wang, Z.; Yang, X.; Wang, F.; Qi, M.; Li, T.; Liu, Y. Cyclic electron flow protects photosystem I donor side under low night temperature in tomato. Environ. Exp. Bot. 2020, 177, 104151. [Google Scholar] [CrossRef]
Figure 1. Four light environment treatments were used in this study, CK, 1FL, 10FL, and 20FL, representing constant light and high and low light durations of 1, 10, and 20 min, respectively. The photoperiod was maintained for 12 h. The photosynthetic photon flux density was modulated via a relay, alternating between 1200 and 150 μmol·m−2·s−1. Despite these fluctuations, the total quantum flux density was conserved over a 24 h period, ensuring uniform light exposure across all experimental conditions.
Agriculture 14 01056 g001
Figure 2. Soybean morphology under different light fluctuation frequency treatments.
Agriculture 14 01056 g002
Figure 3. Changes in soybean photosynthesis and fluorescence under different frequency light-fluctuation treatments. (a) Light−response curve Pn. (b) Maximum net photosynthesis rate Pnmax. (c) Dark respiration rate Rd. (d) Light compensation point Ic. (e) OJIP fluorescence induction kinetics curve. (f) Fluorescence at J point (2 ms) on OJIP fluorescence induction curve. (gj) Energy absorbed, captured, transferred, and dissipated as heat per unit leaf area when reaching the maximum fluorescence (t = tFm). Columns are mean ± SD (n = 10 biological replicates); different letters indicate significant differences by LSD test (p < 0.05).
Agriculture 14 01056 g003
Figure 4. Image showing the impact of varying light frequencies on the soybean light system and light–energy allocation. Y(II), Y(NO), and Y(NPQ) in (a) represent the effective quantum yield, non-regulated energy dissipation, and regulated energy dissipation of PSII, respectively, summing to 1. (b) Fv/Fm is the maximum light–energy conversion efficiency of PSII, (c) presents qP, the photochemical quenching coefficient (swamp model), (d) details NPQ, the non-photochemical quenching coefficient, and (e) illustrates Pm and Pm’, the maximum P700 signals under dark and light conditions, indicating the content of effective PSI complexes and PSI activity, respectively. Lastly, (f) depicts Y(I), the actual photosynthesis efficiency of PSI. Different letters indicate significant differences by LSD test (p < 0.05).
Agriculture 14 01056 g004
Figure 5. The alterations in soybean photosynthetic electron transport due to varying light frequencies. ETR(II) and ETR(I) in (a,b) denote the relative electron transport rates through PSII and PSI. CEF and Y(CEF) in (c,d) represent cyclic electron flow and its quantum yield around PSI. Y(ND) and Y(NA) in (e,f) quantify non-photochemical energy dissipation in PSI due to donor-side and acceptor-side limitations. Different letters indicate significant differences by LSD test (p < 0.05).
Agriculture 14 01056 g005
Figure 6. Effects of light frequency variation on soybean cyclic electron transfer. It includes (a) the P700 dark reduction curve with a magnified view of the falling inflection point at 39–44 s, (b) the functional PQ pool represented as PQ = MT/ST, and (c) a hump with a dashed line indicating the slope of fluorescence rise (K). Different letters indicate significant differences by LSD test (p < 0.05).
Agriculture 14 01056 g006
Figure 7. Under normal and rapid light-fluctuation conditions, the photosynthetic electron chain behaves differently. (A) In nornal light plants, Various protein complexes such as PSII, Cyt b6f, PSI and ATPase are localised to the membrane of the cystoid. The electrons generated by cleavage of water molecules in the exocytosis complex pass sequentially through PSII, Cyt b6f, and PSI, and are finally delivered to NADP to form NADPH. The transmembrane proton gradient generated in this process drives ATP synthase to form ATP, whereas electrons are delivered only around PSI, and the process of ATP synthesis by ATPase through formation of the transmembrane proton gradient is called cyclic electron flow (CEF). (B) In Rapid Fluctuating light plants, PSII and PSI are damaged to varying degrees, which in turn affects the rate of linear photosynthetic electron transfer. This phenomenon is evidenced by a decrease in PSII protein activity and quantity, leading to an obstruction in the function of water photolysis and a subsequent decrease in the production of H+. Additionally, a decrease in the activity and quantity of PSI restricts the receptor side. The over-reduction of the PQ pool further impedes the transfer of H+ to the thylakoid. Despite these challenges, soybeans enhance cyclic electron transfer in environments with frequent light fluctuations. This process enables electrons to return to plastoquinone (PQH2) via ferredoxin (Fd). Concurrently, the difference in H+ concentration inside and outside the thylakoid creates a proton gradient across the thylakoid membrane (ΔpH). The resulting acidification of the thylakoid stimulates heat dissipation, thereby improving light protection.
Agriculture 14 01056 g007
Table 1. Effect of different light treatments on morphology and photosynthetic pigments in soybean.
TreatmentPlant Height (cm)Leaf Area Per Plant (dm2)Specific Leaf Weight (mg/cm2)Chl a + b
(mg/cm2)
Chl a/bCar (mg/cm2)
Ck22.42 ± 1.67 a4.16 ± 0.41 a4.22 ± 0.66 a14.23 ± 3.27 a2.4 ± 0.23 b2.58 ± 0.43 a
1FL17.13 ± 0.71 c2.85 ± 0.44 b4.46 ± 0.43 a10.03 ± 1.05 b2.62 ± 0.23 ab2.47 ± 0.21 a
10FL19.4 ± 1.3 c3.38 ± 1.08 ab3.85 ± 0.58 a11.25 ± 1.93 ab2.42 ± 0.14 b2.69 ± 0.47 a
20FL21.63 ± 0.99 b4.12 ± 1.05 a3.67 ± 0.58 a11.49 ± 1.77 ab2.93 ± 0.25 a3.08 ± 0.35 a
Notes: Different letters indicating significant differences as per the LSD test (p < 0.05).
Disclaimer/Publisher’s Note: The statements, opinions and data contained in all publications are solely those of the individual author(s) and contributor(s) and not of MDPI and/or the editor(s). MDPI and/or the editor(s) disclaim responsibility for any injury to people or property resulting from any ideas, methods, instructions or products referred to in the content.

