

Microbial Activity and Diversity in Soil Sown with Zea mays and Triticosecale

Abstract
:1. Introduction
2. Materials and Methods
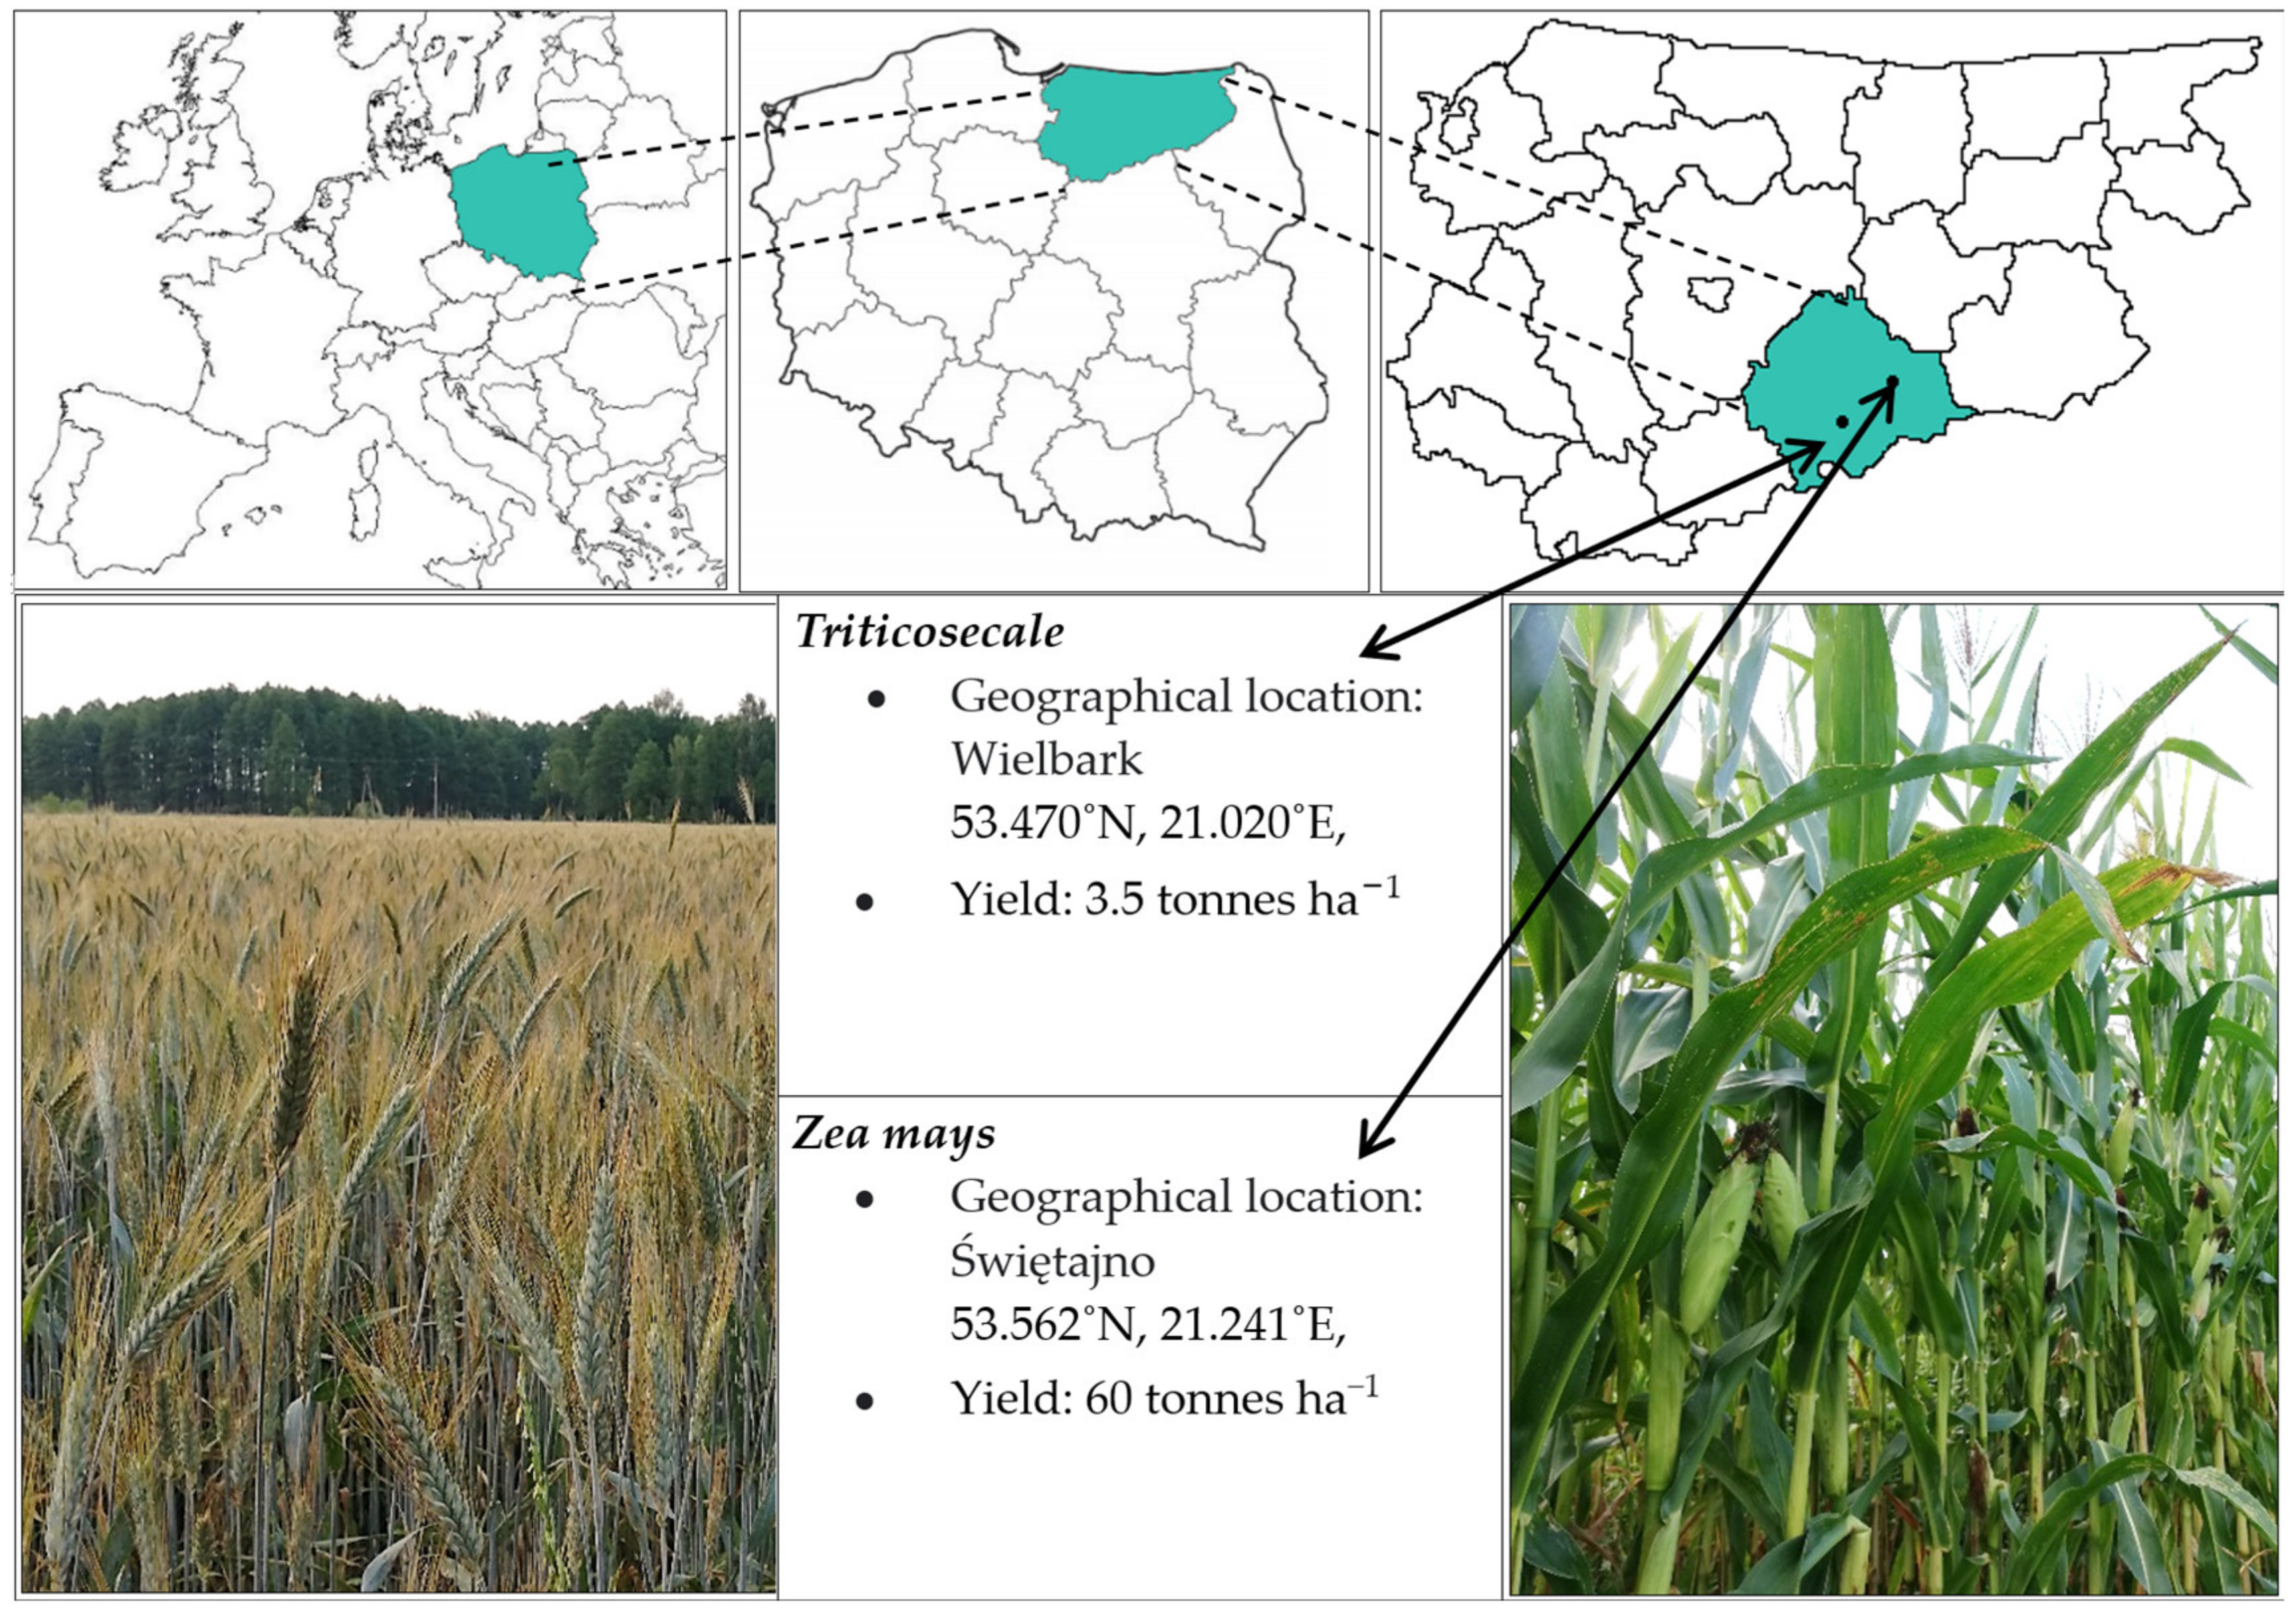
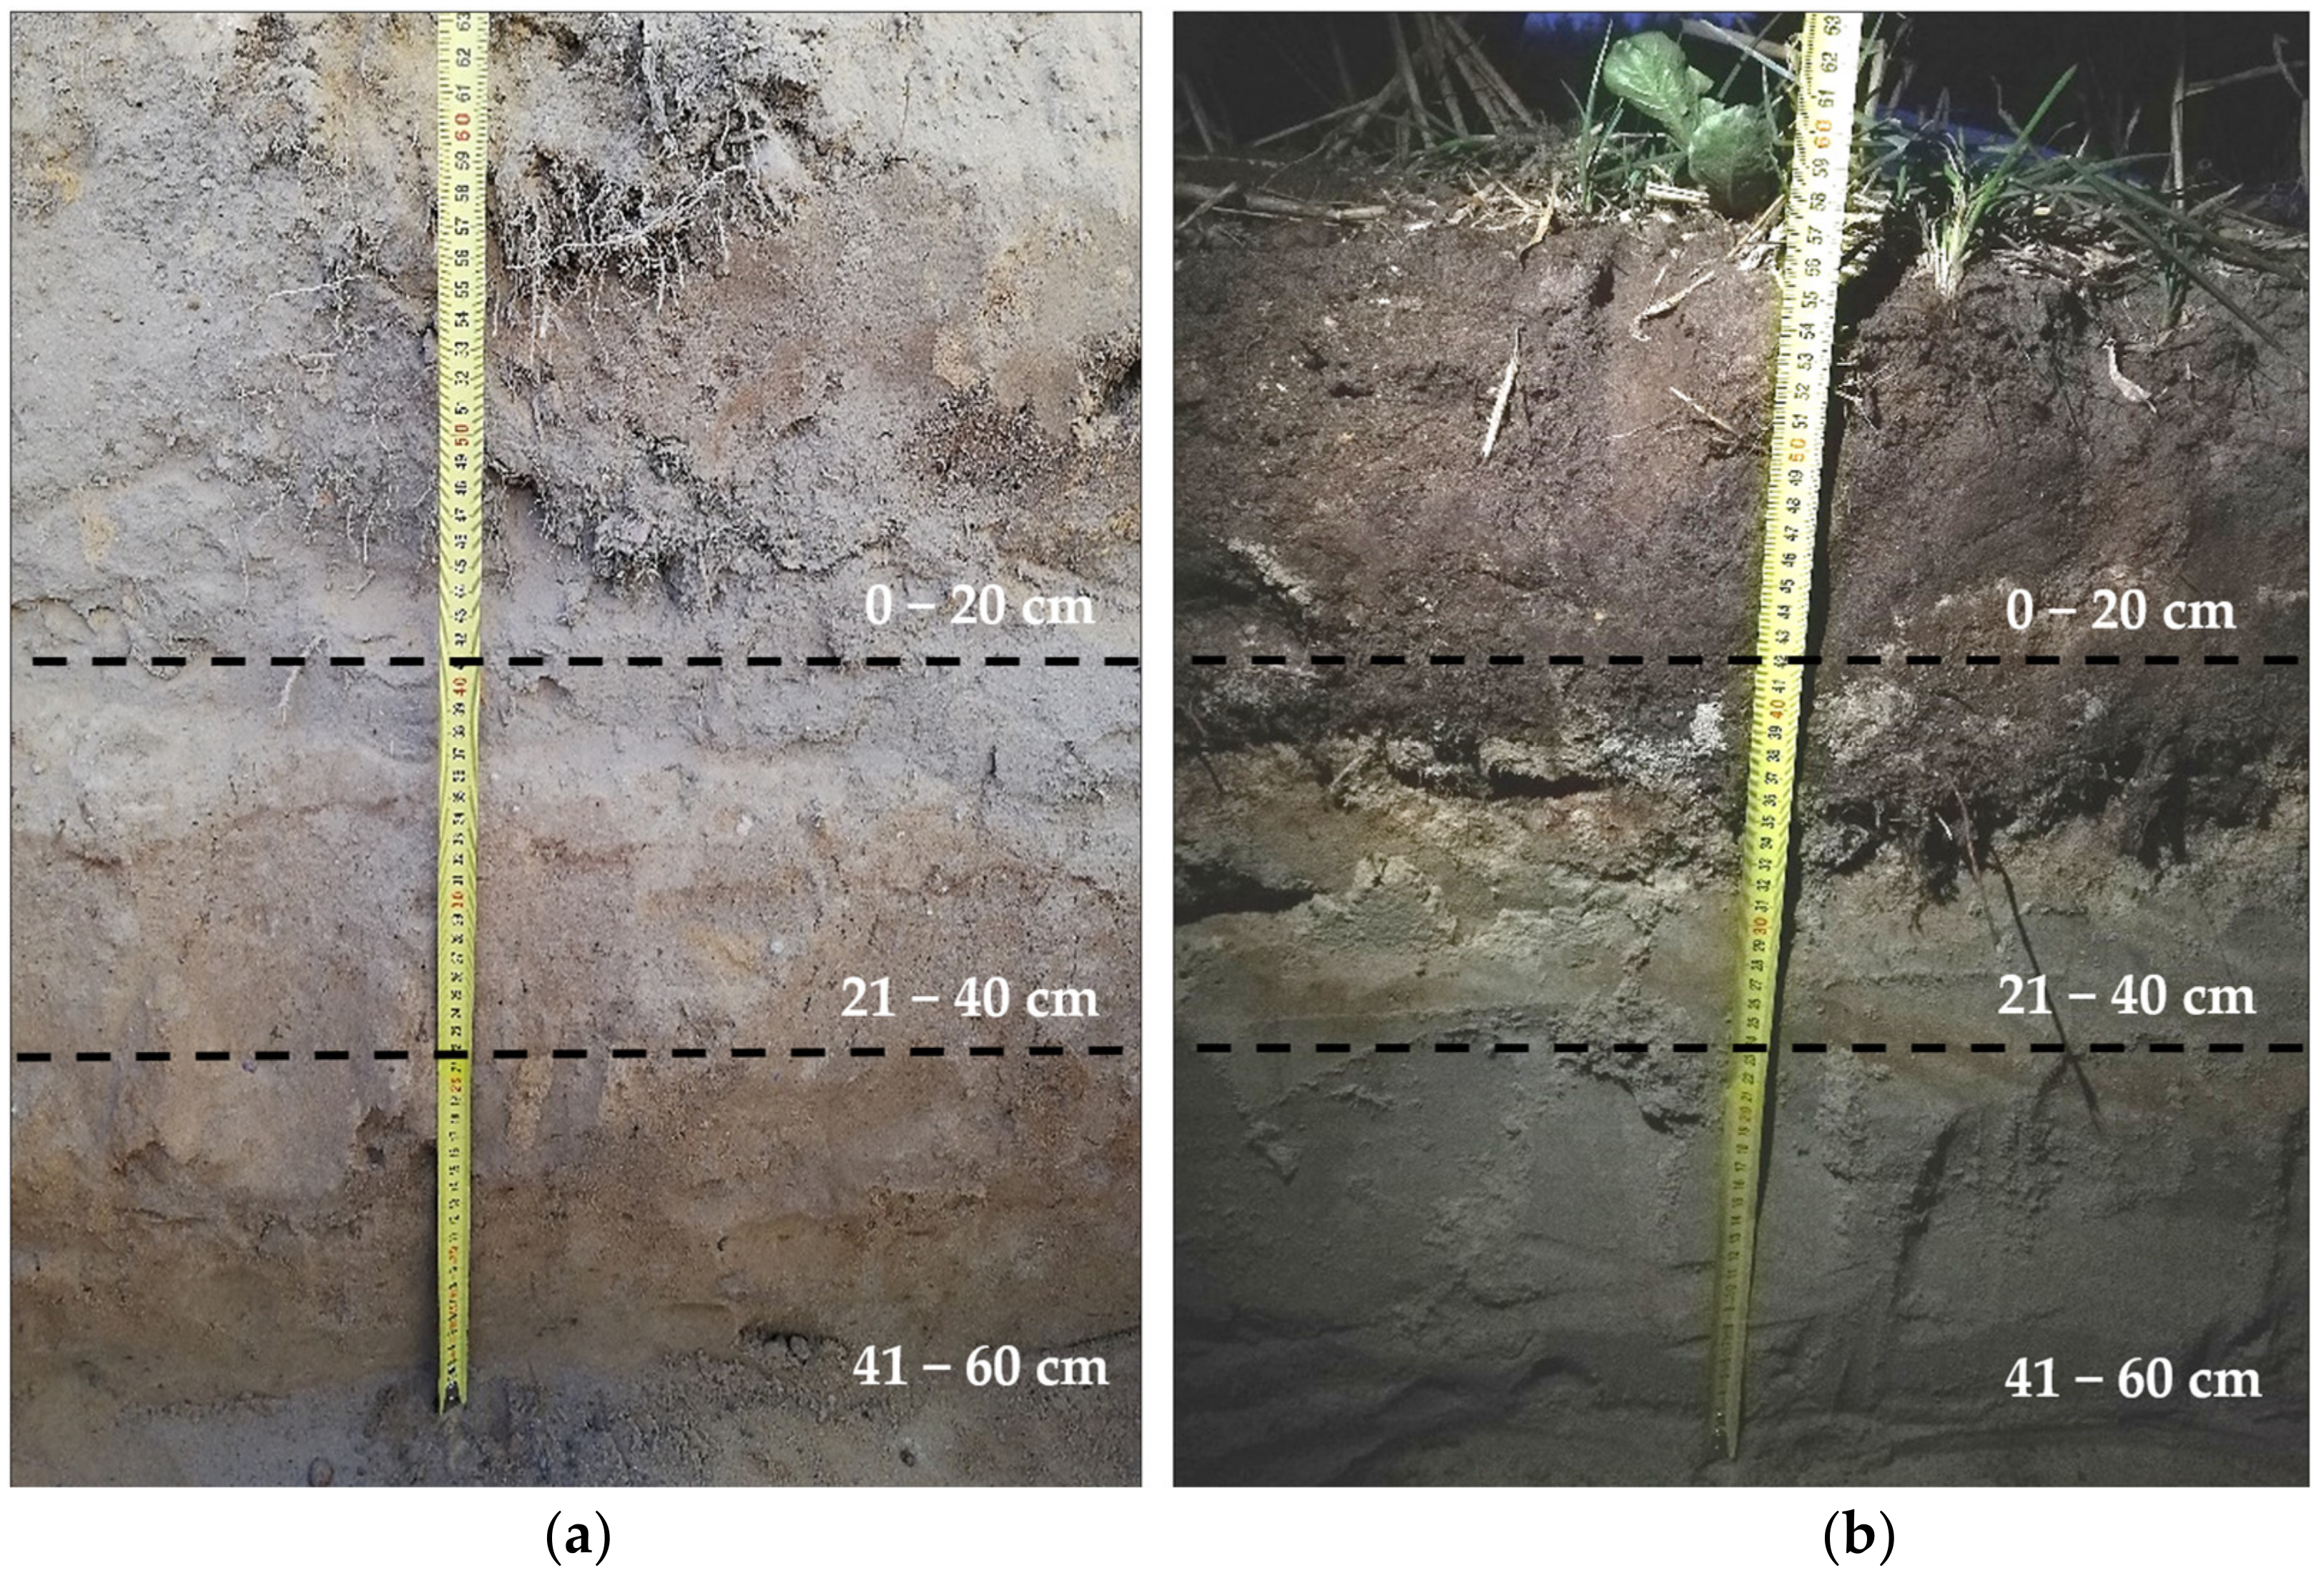
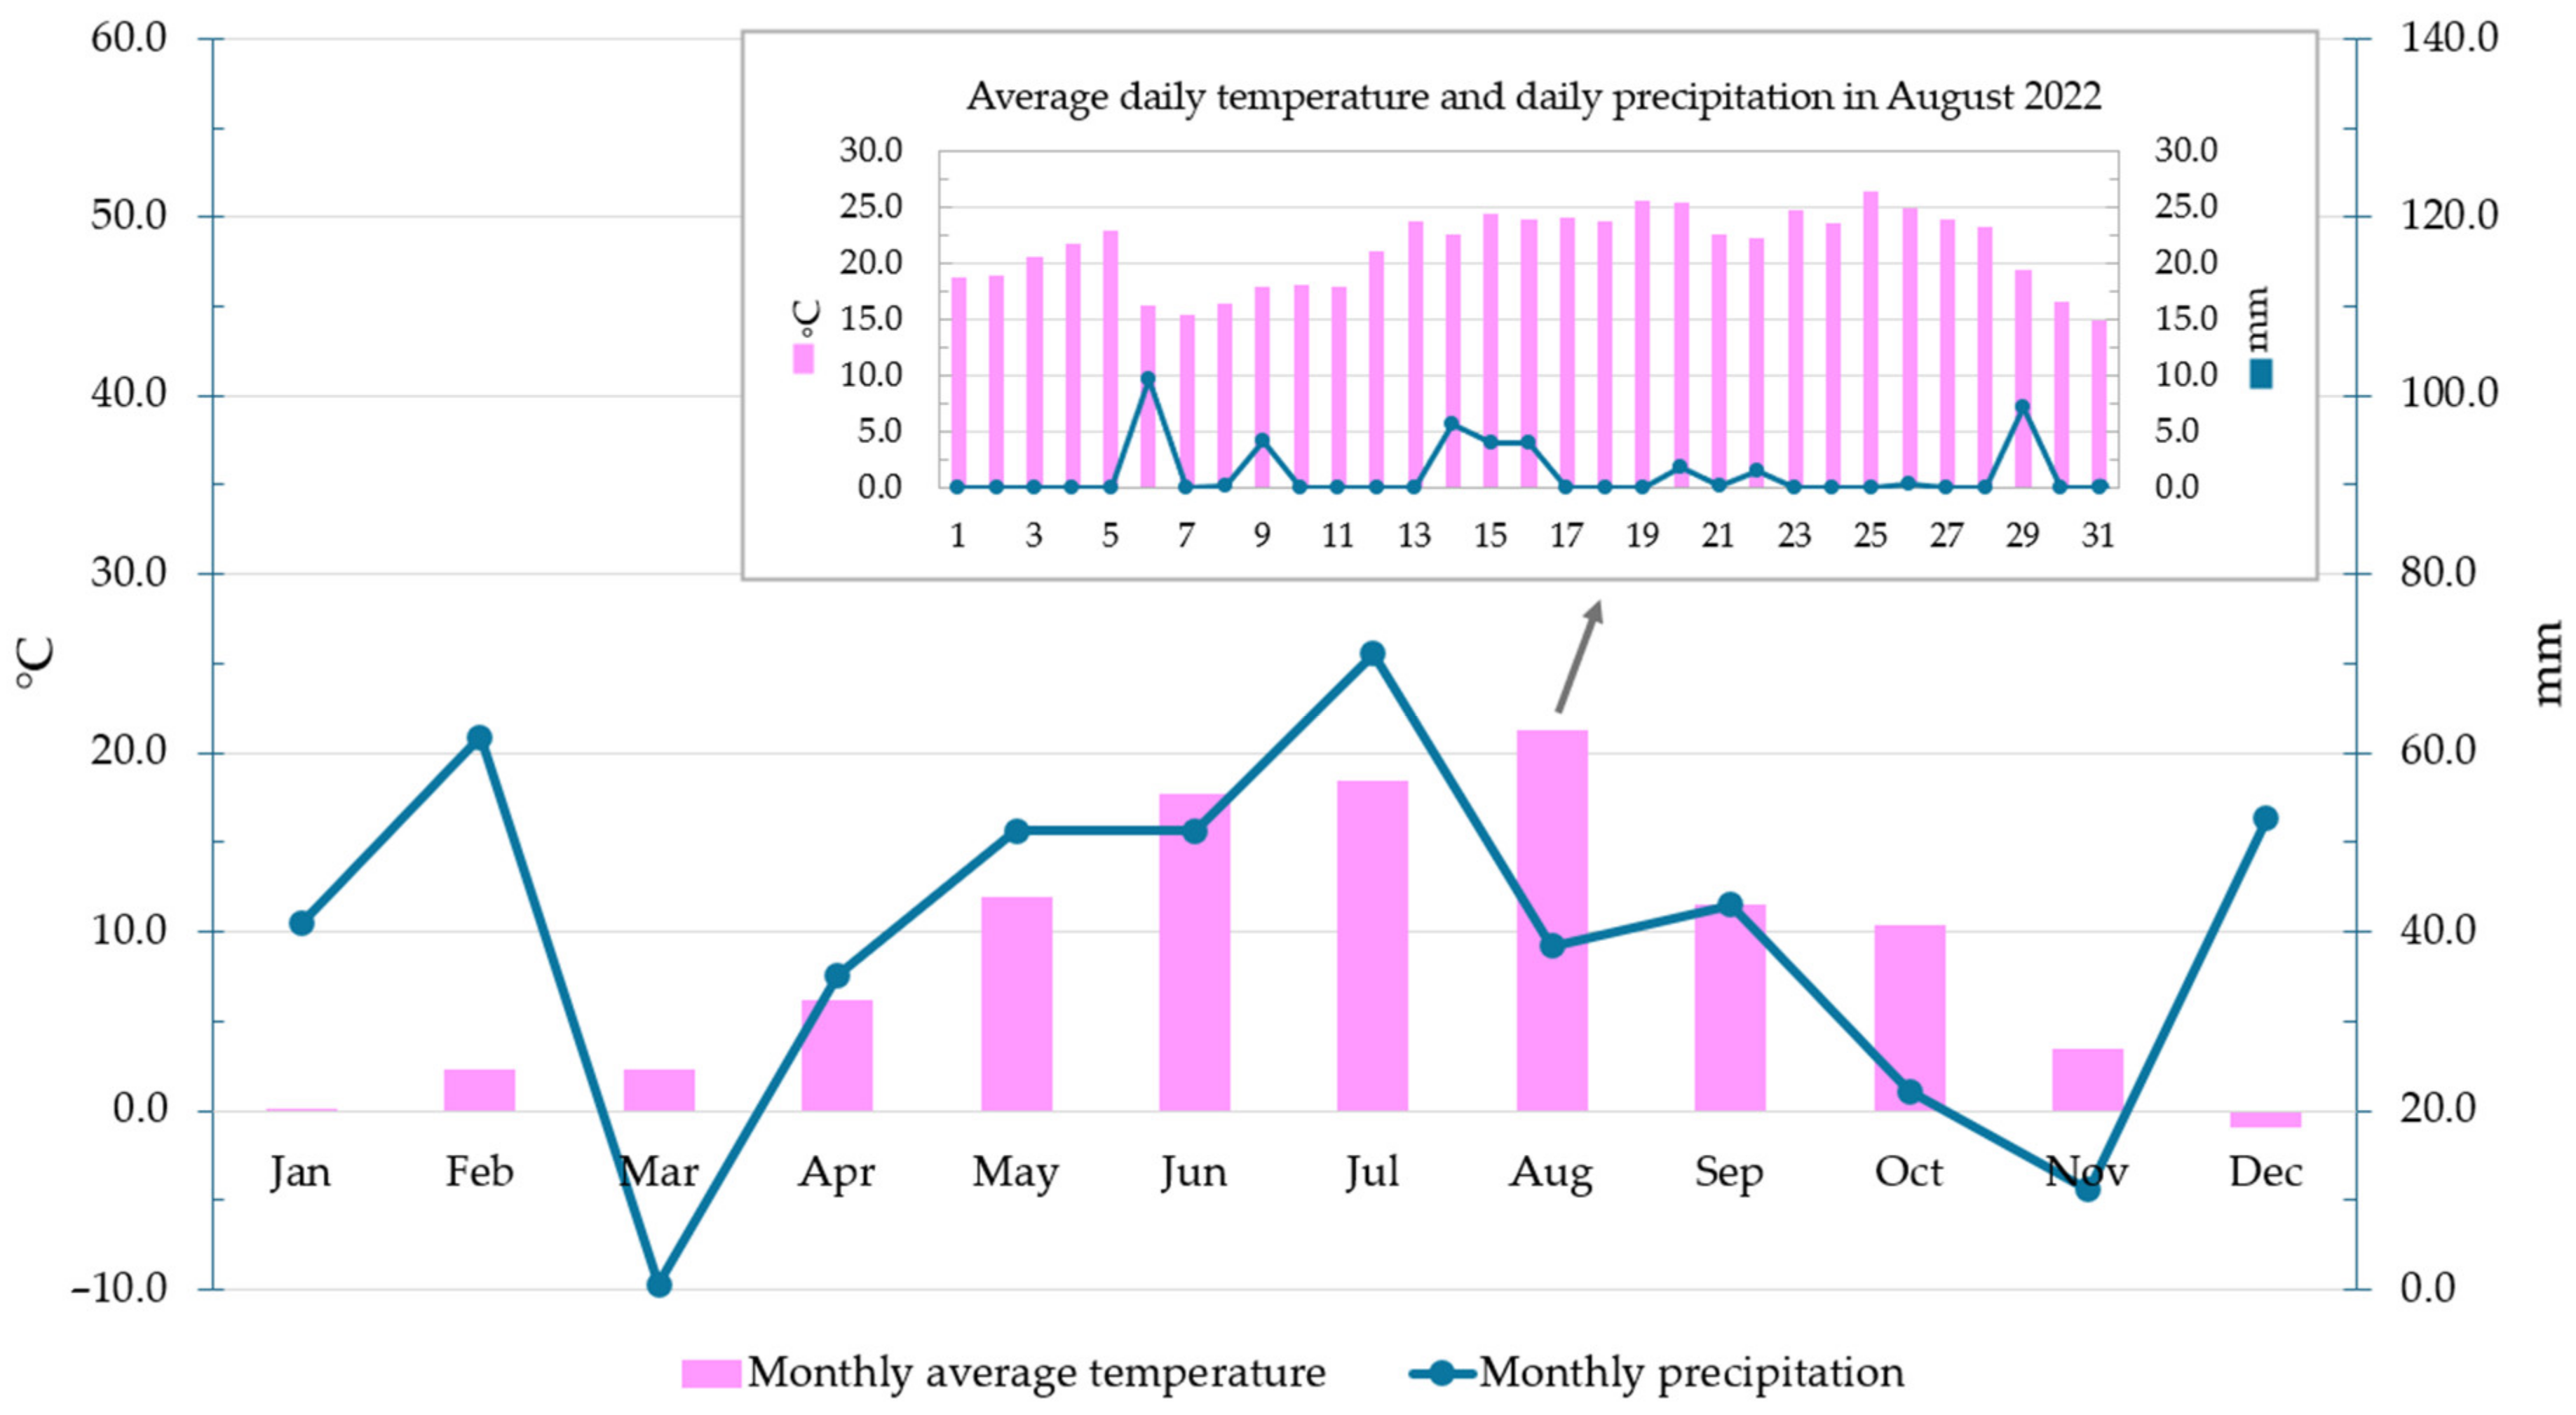
2.1. Soil Sampling Area
2.2. The Cultivation Technology of Zea mays and Triticosecale
2.3. Microbiological Analysis
2.4. Soil Biochemical Analysis
2.5. Analysis of Physicochemical and Chemical Properties
2.6. Statistical Analysis of Results
3. Results
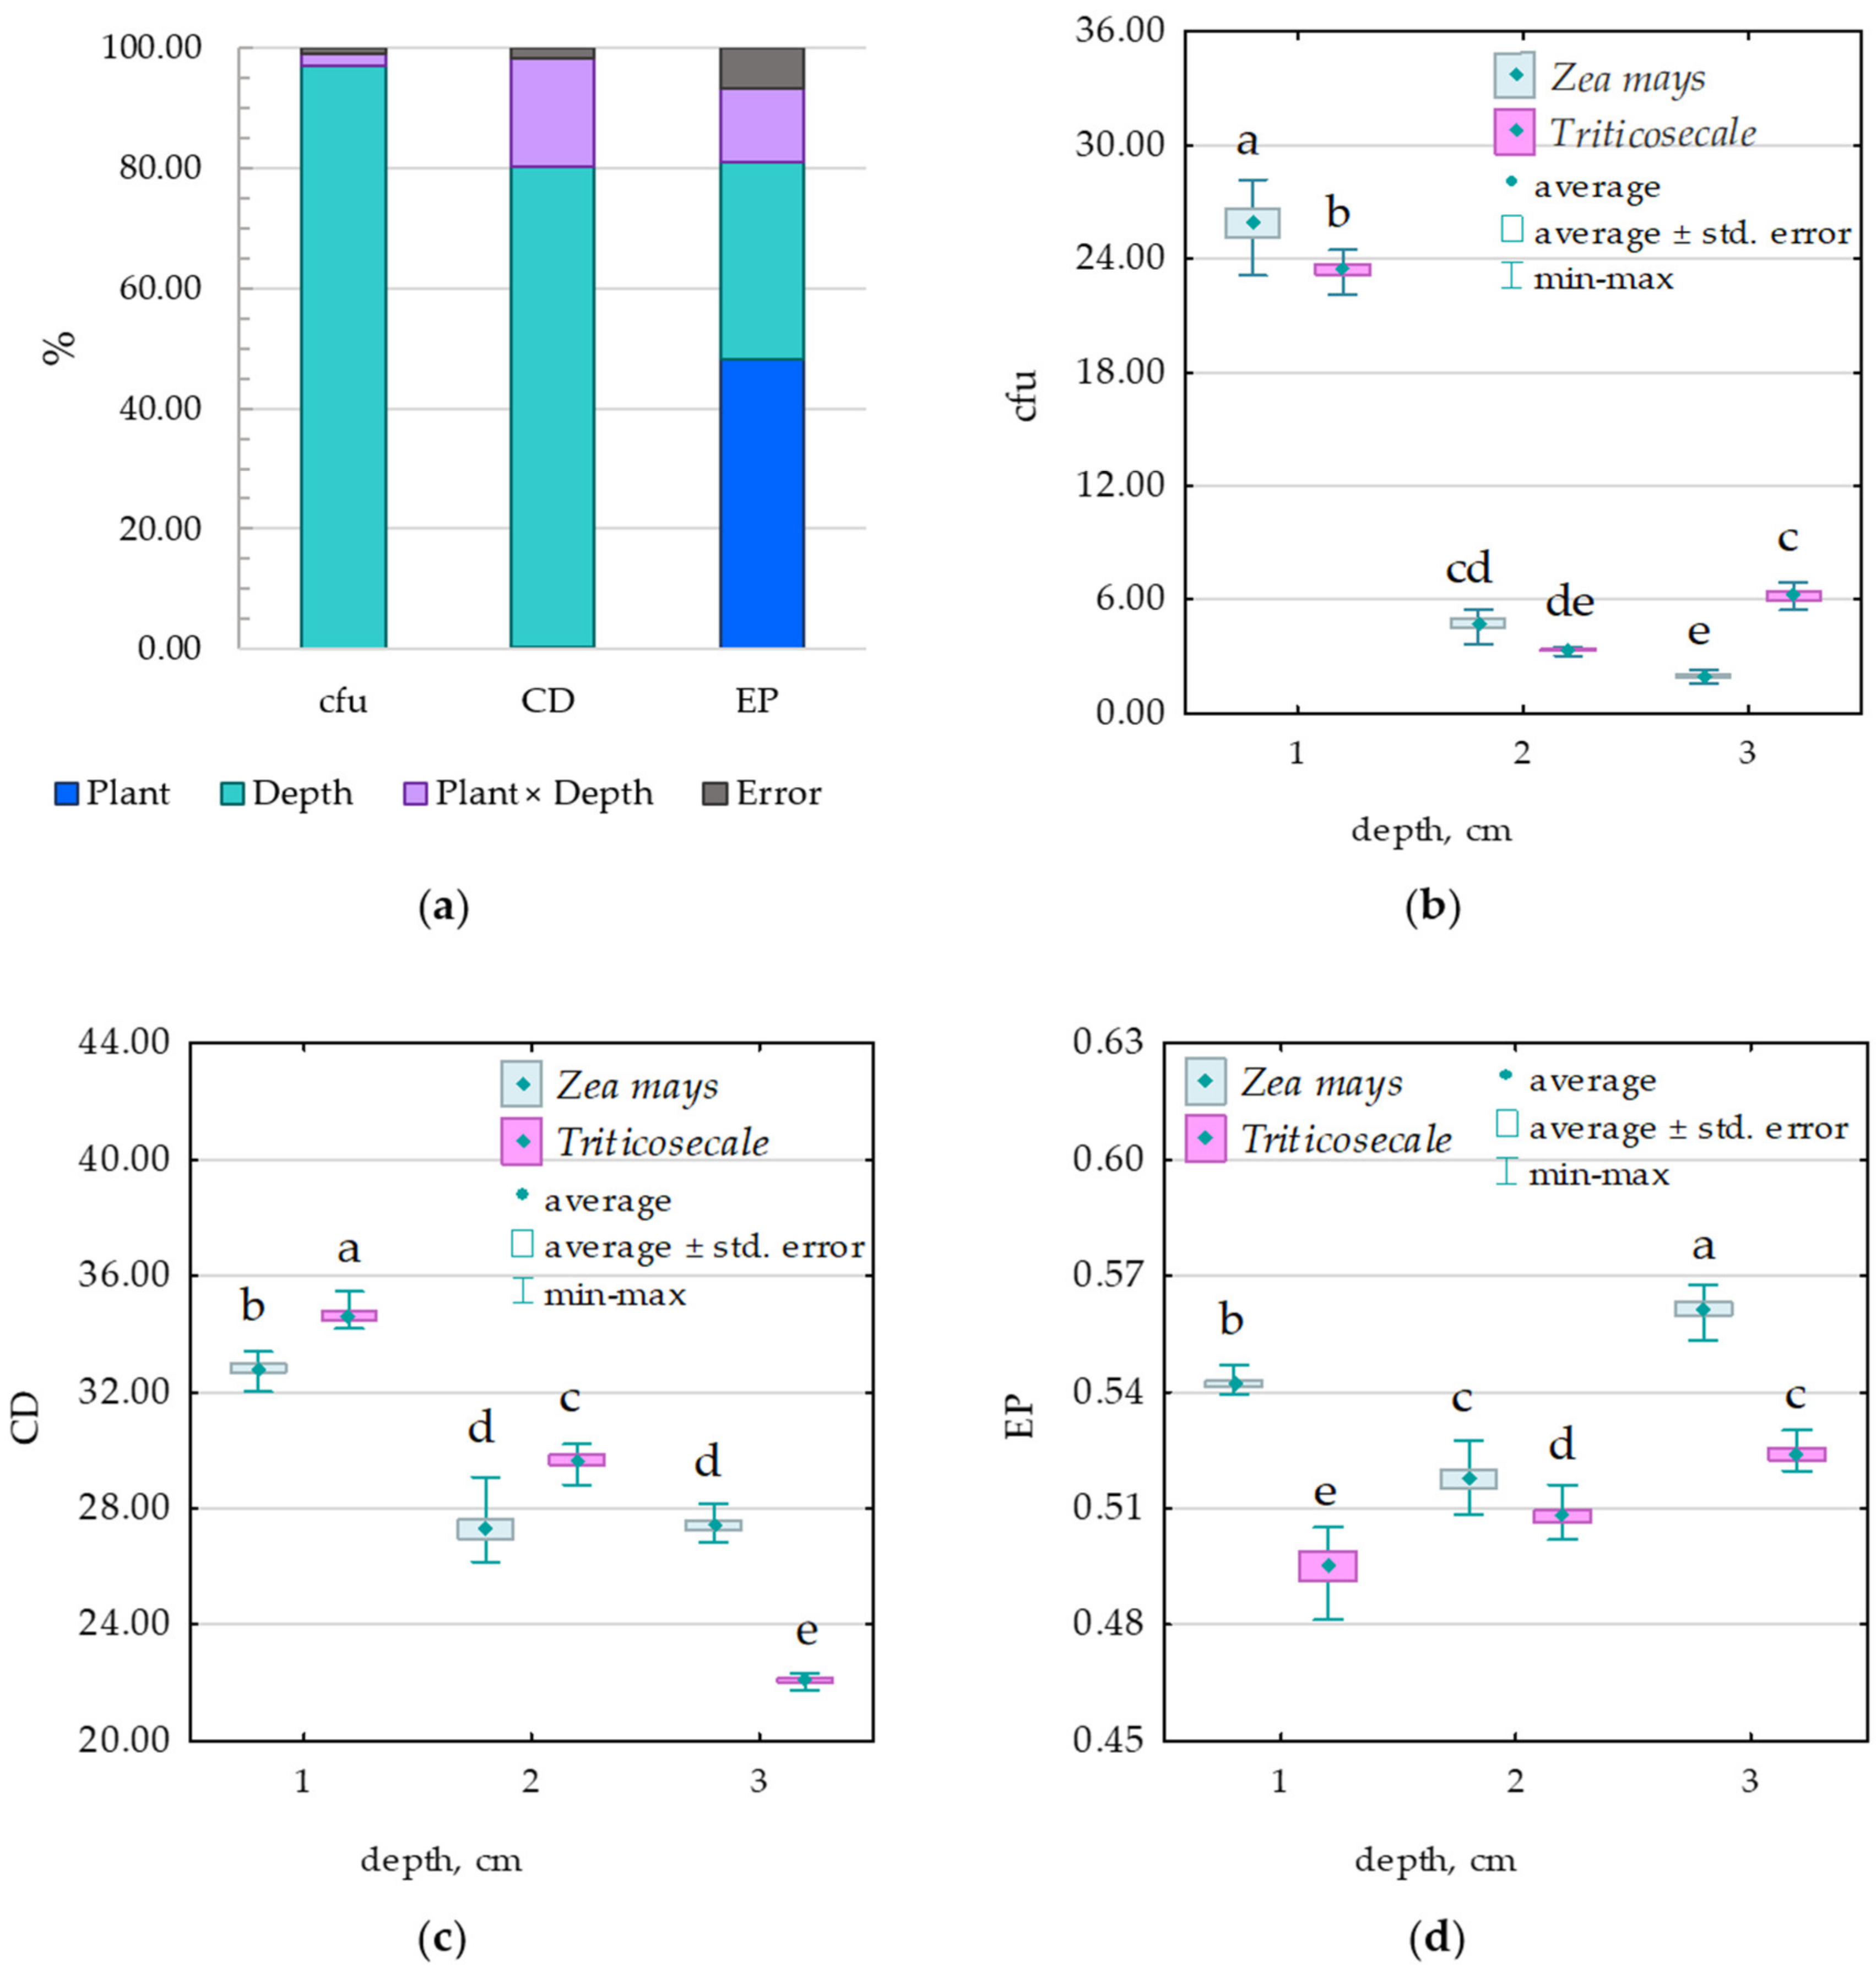
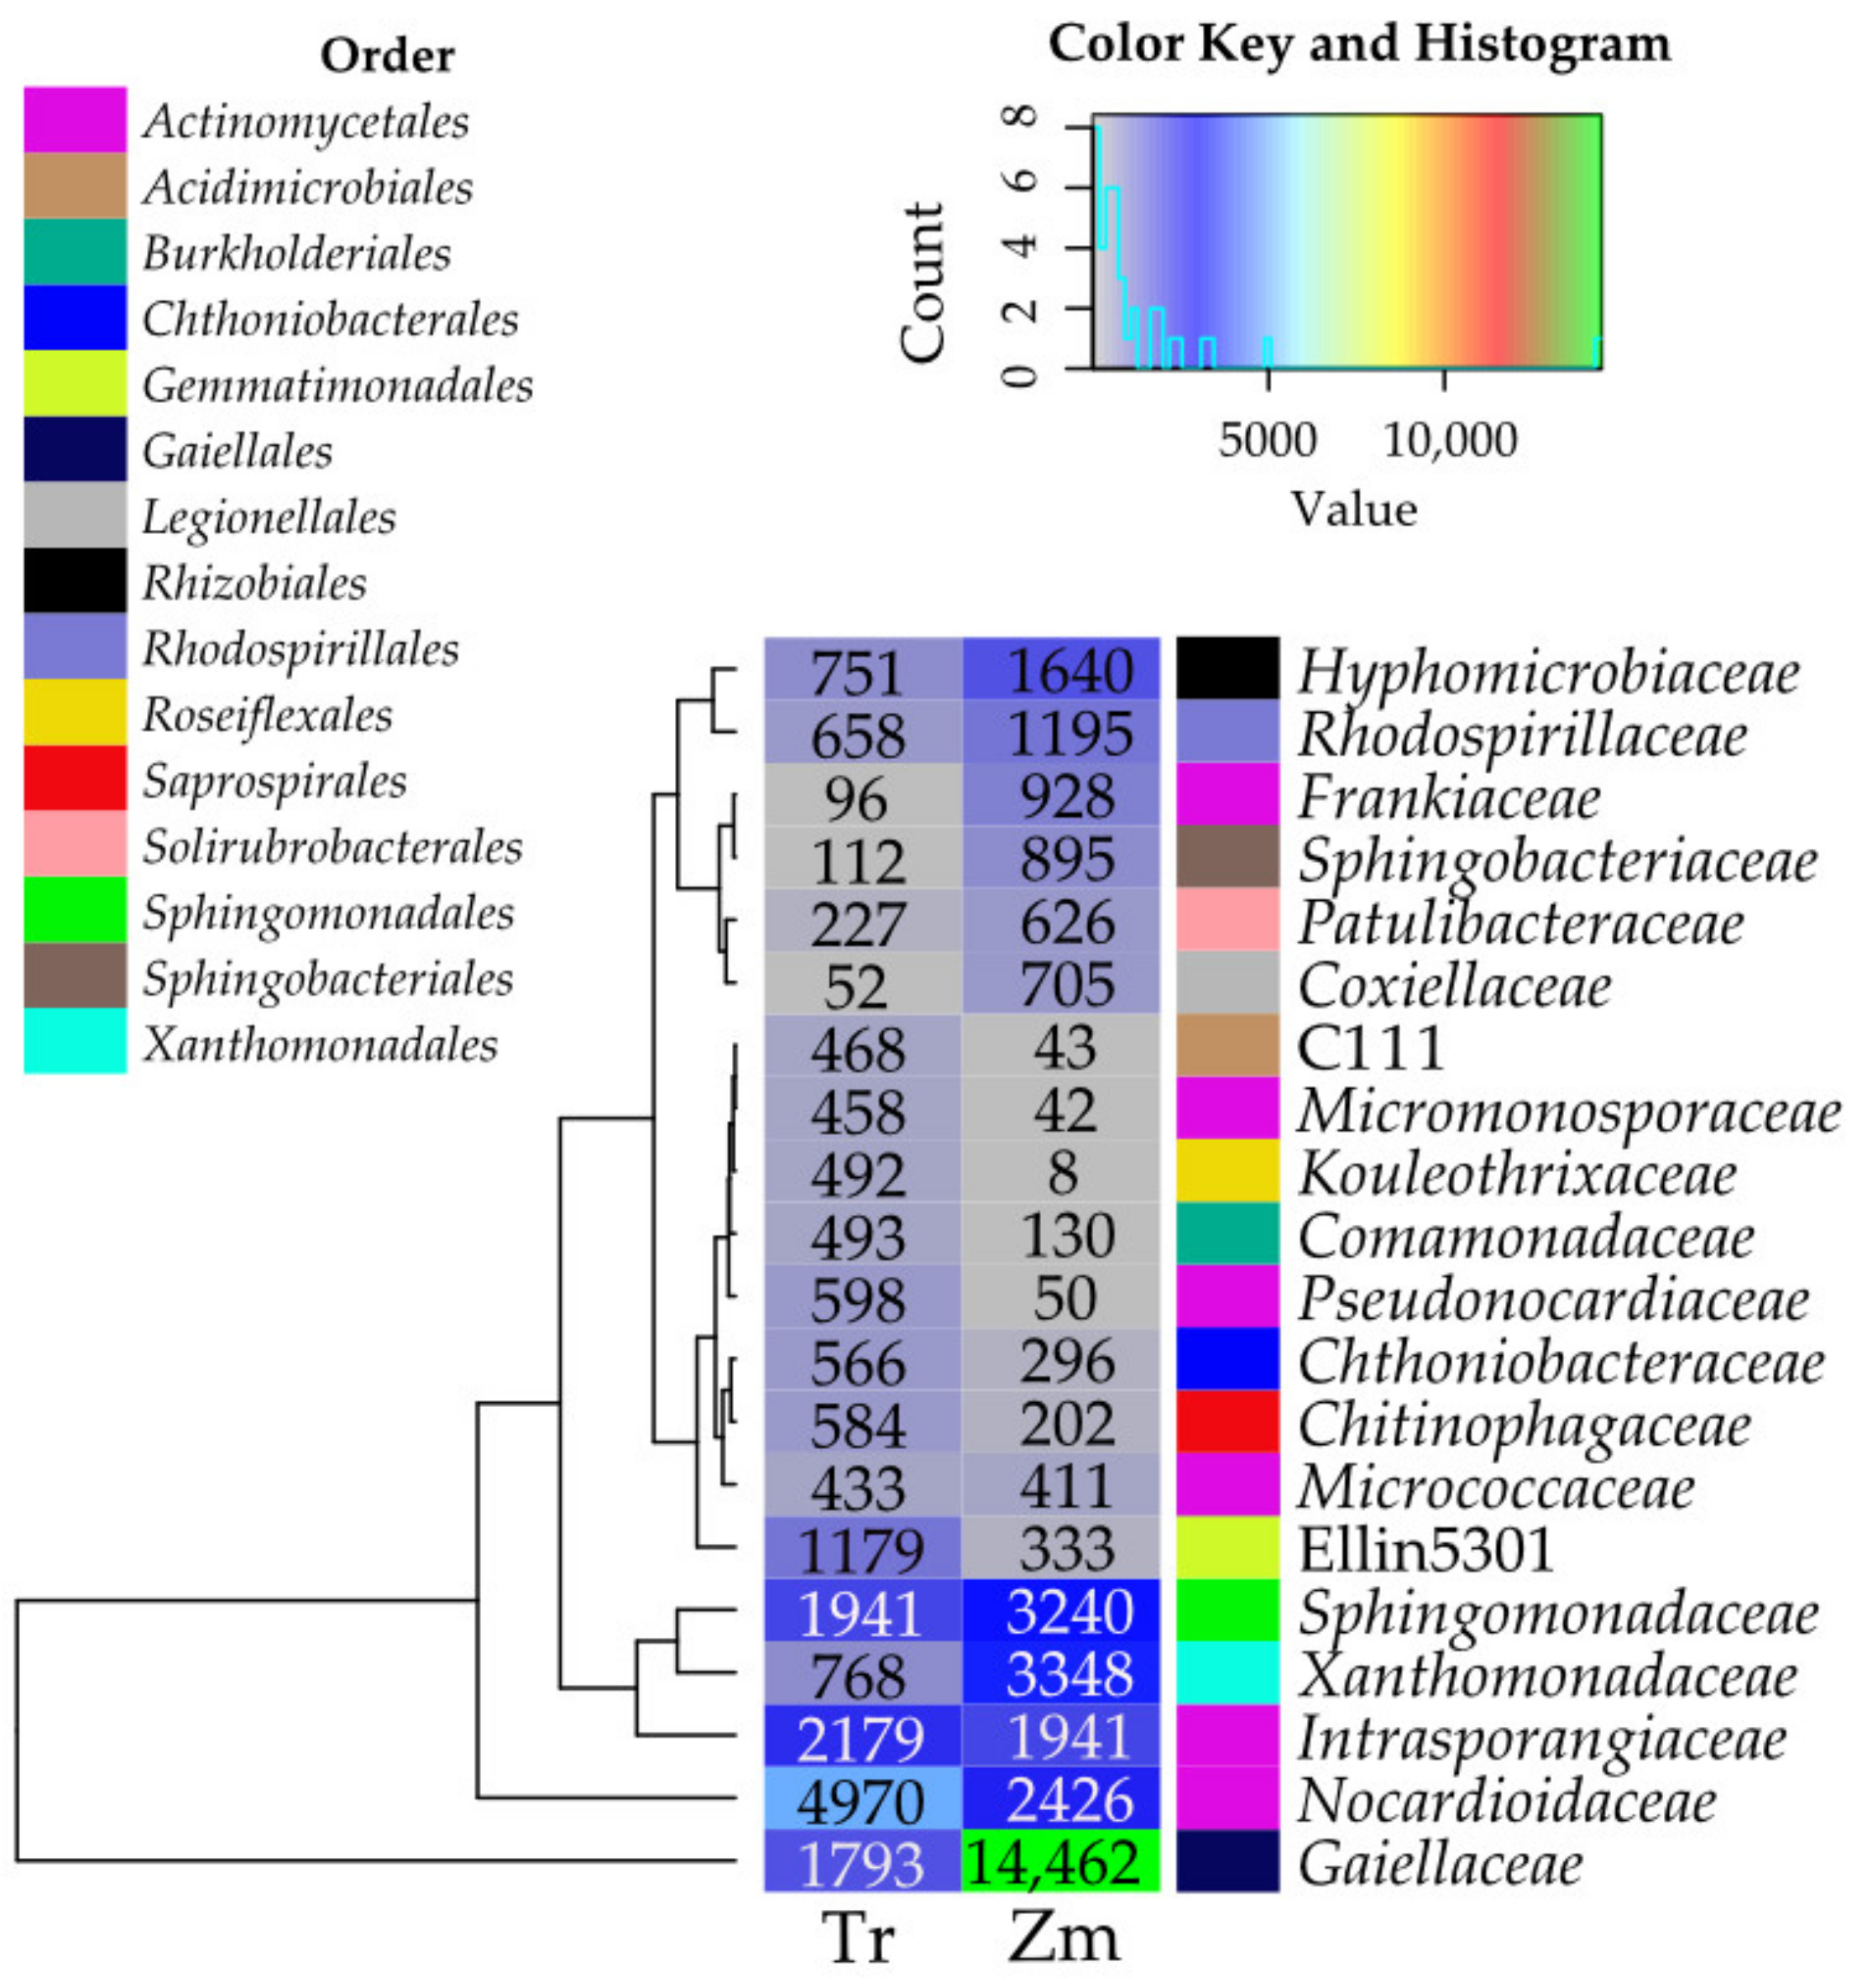
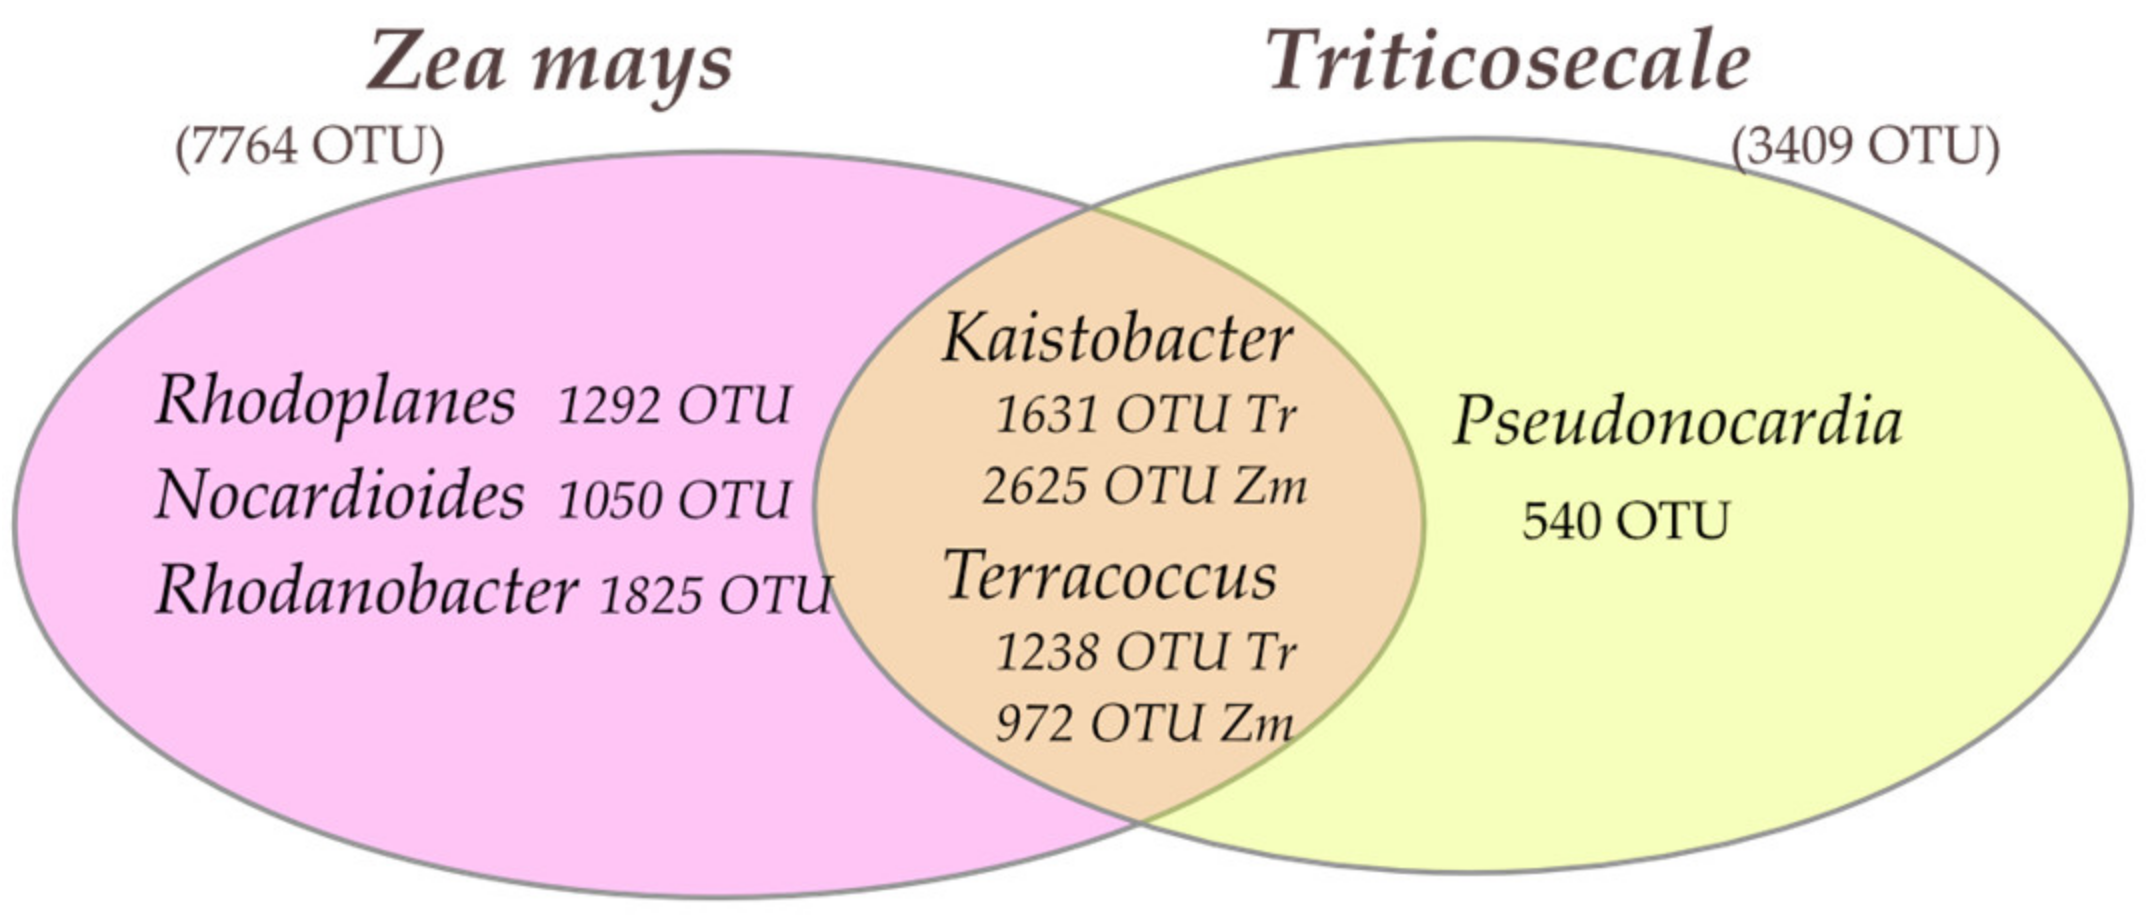
3.1. Microorganisms
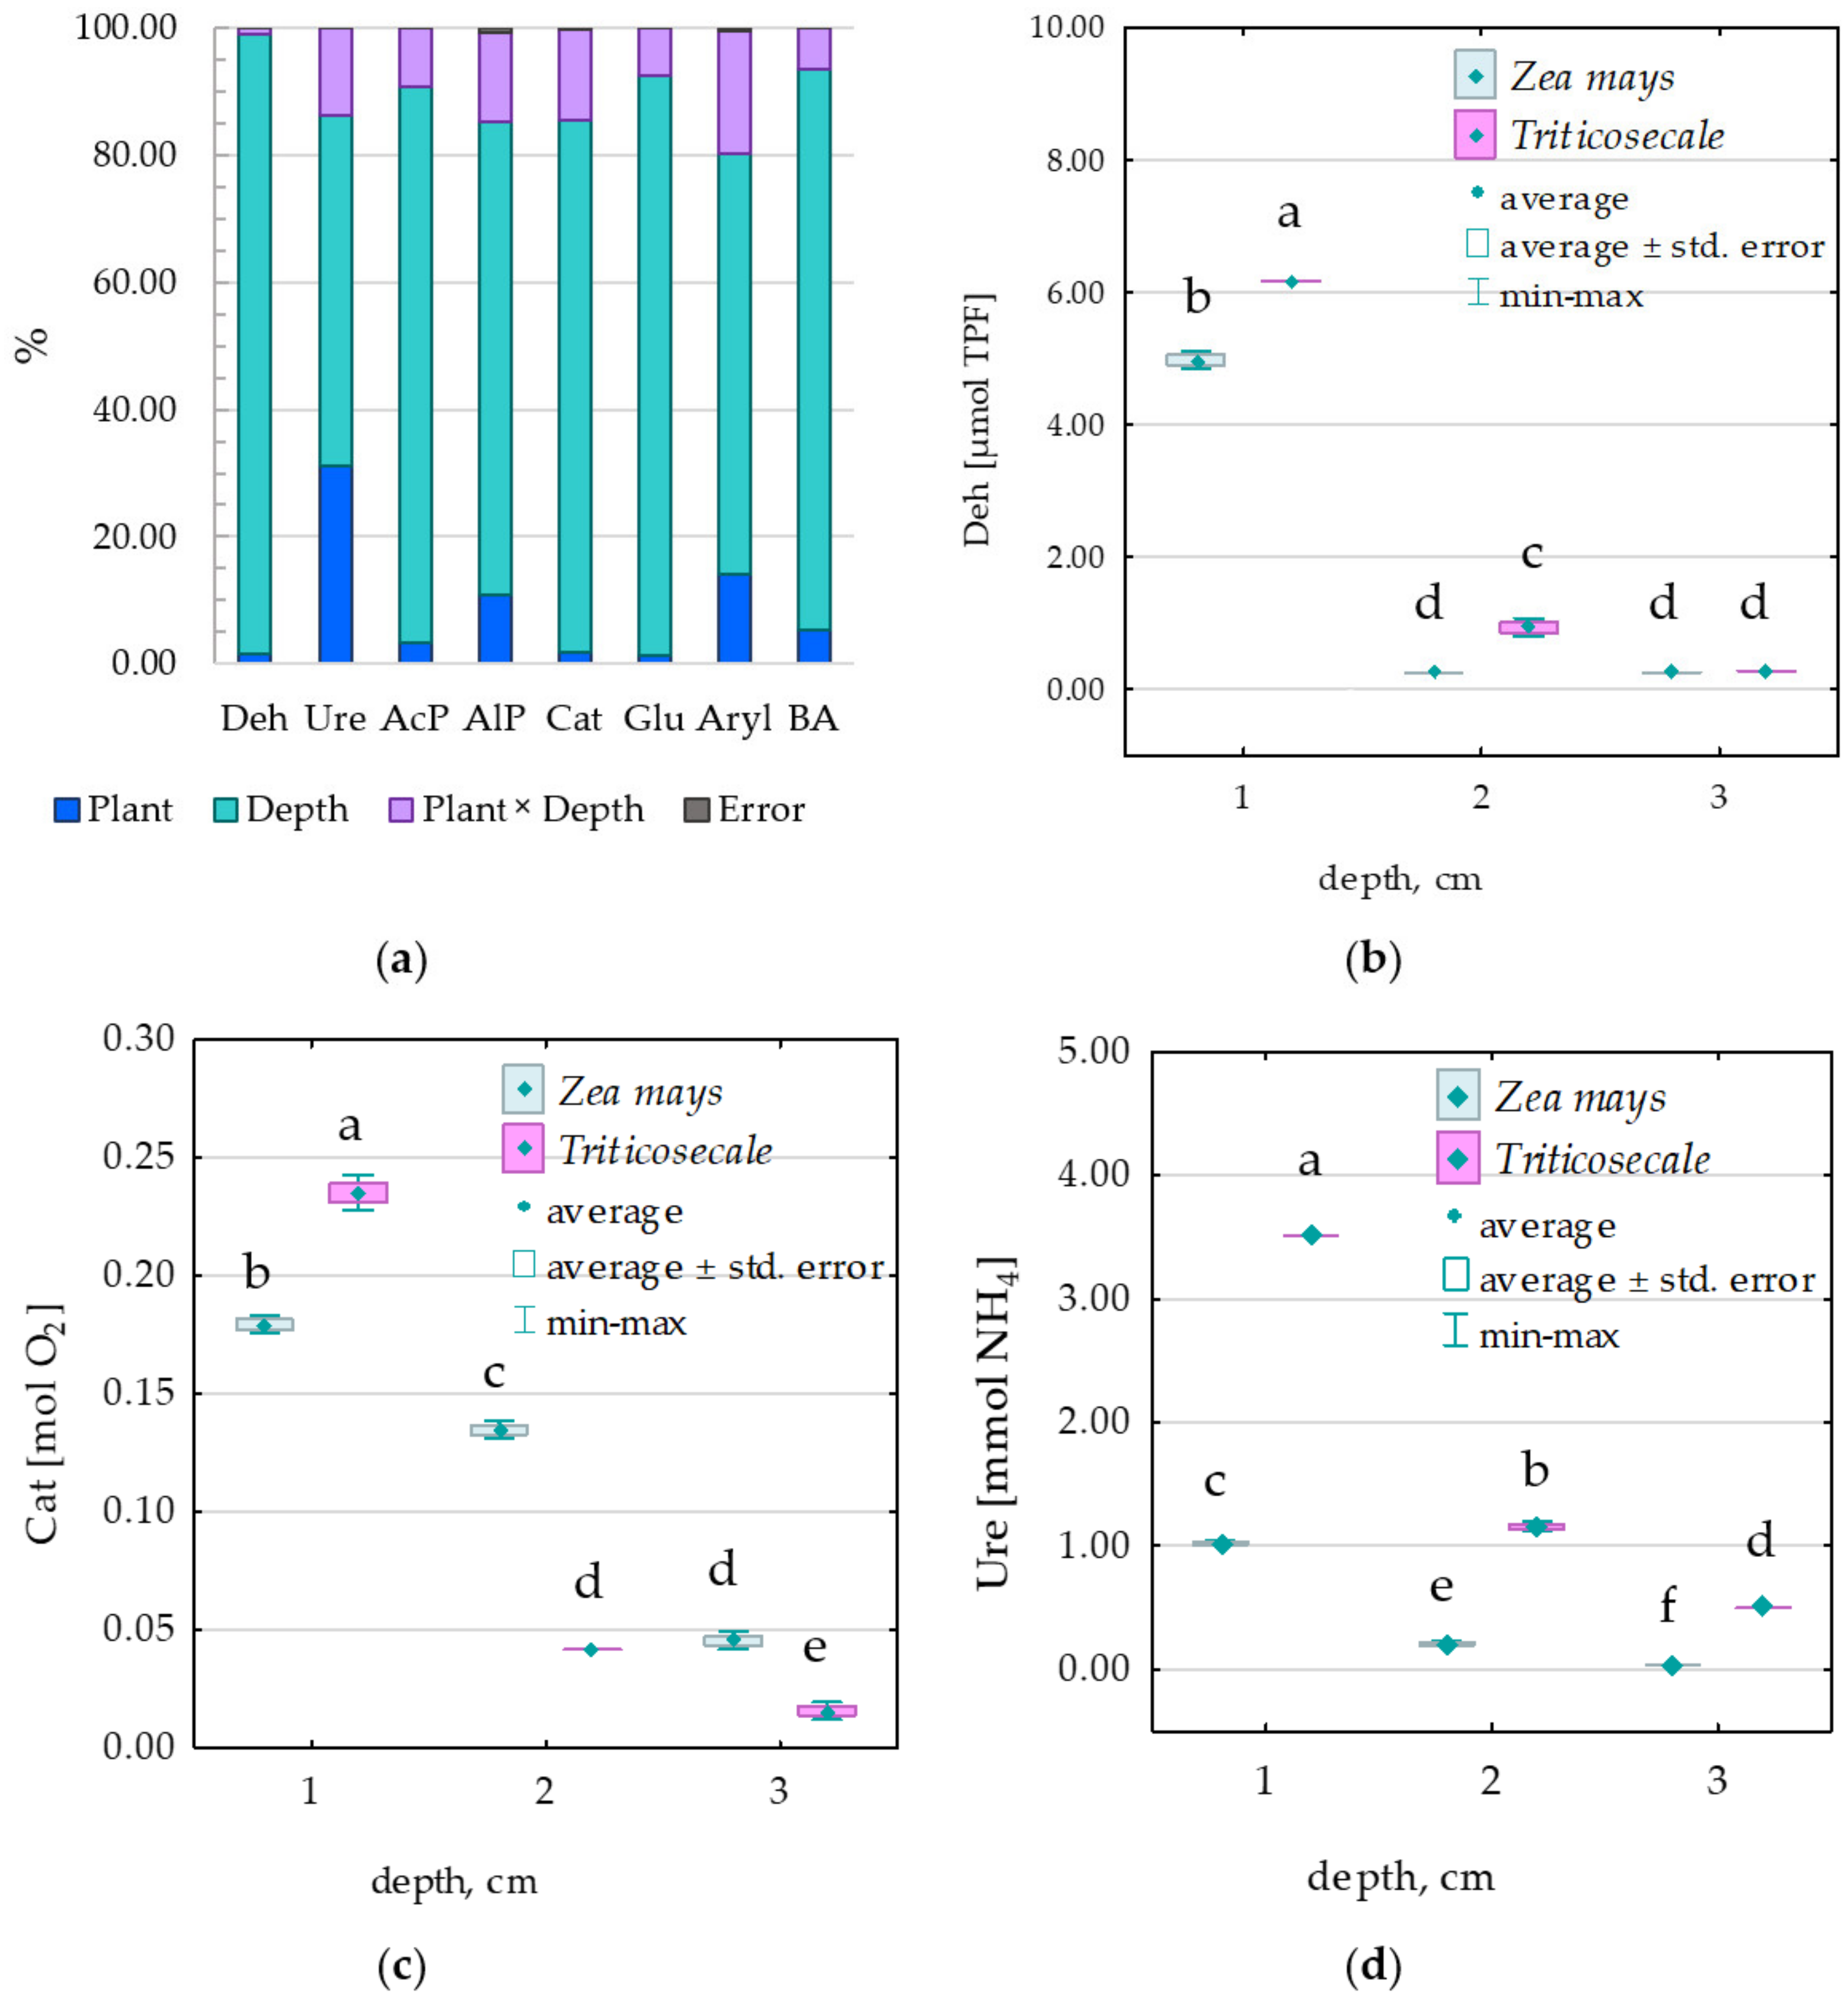
3.2. Enzymes
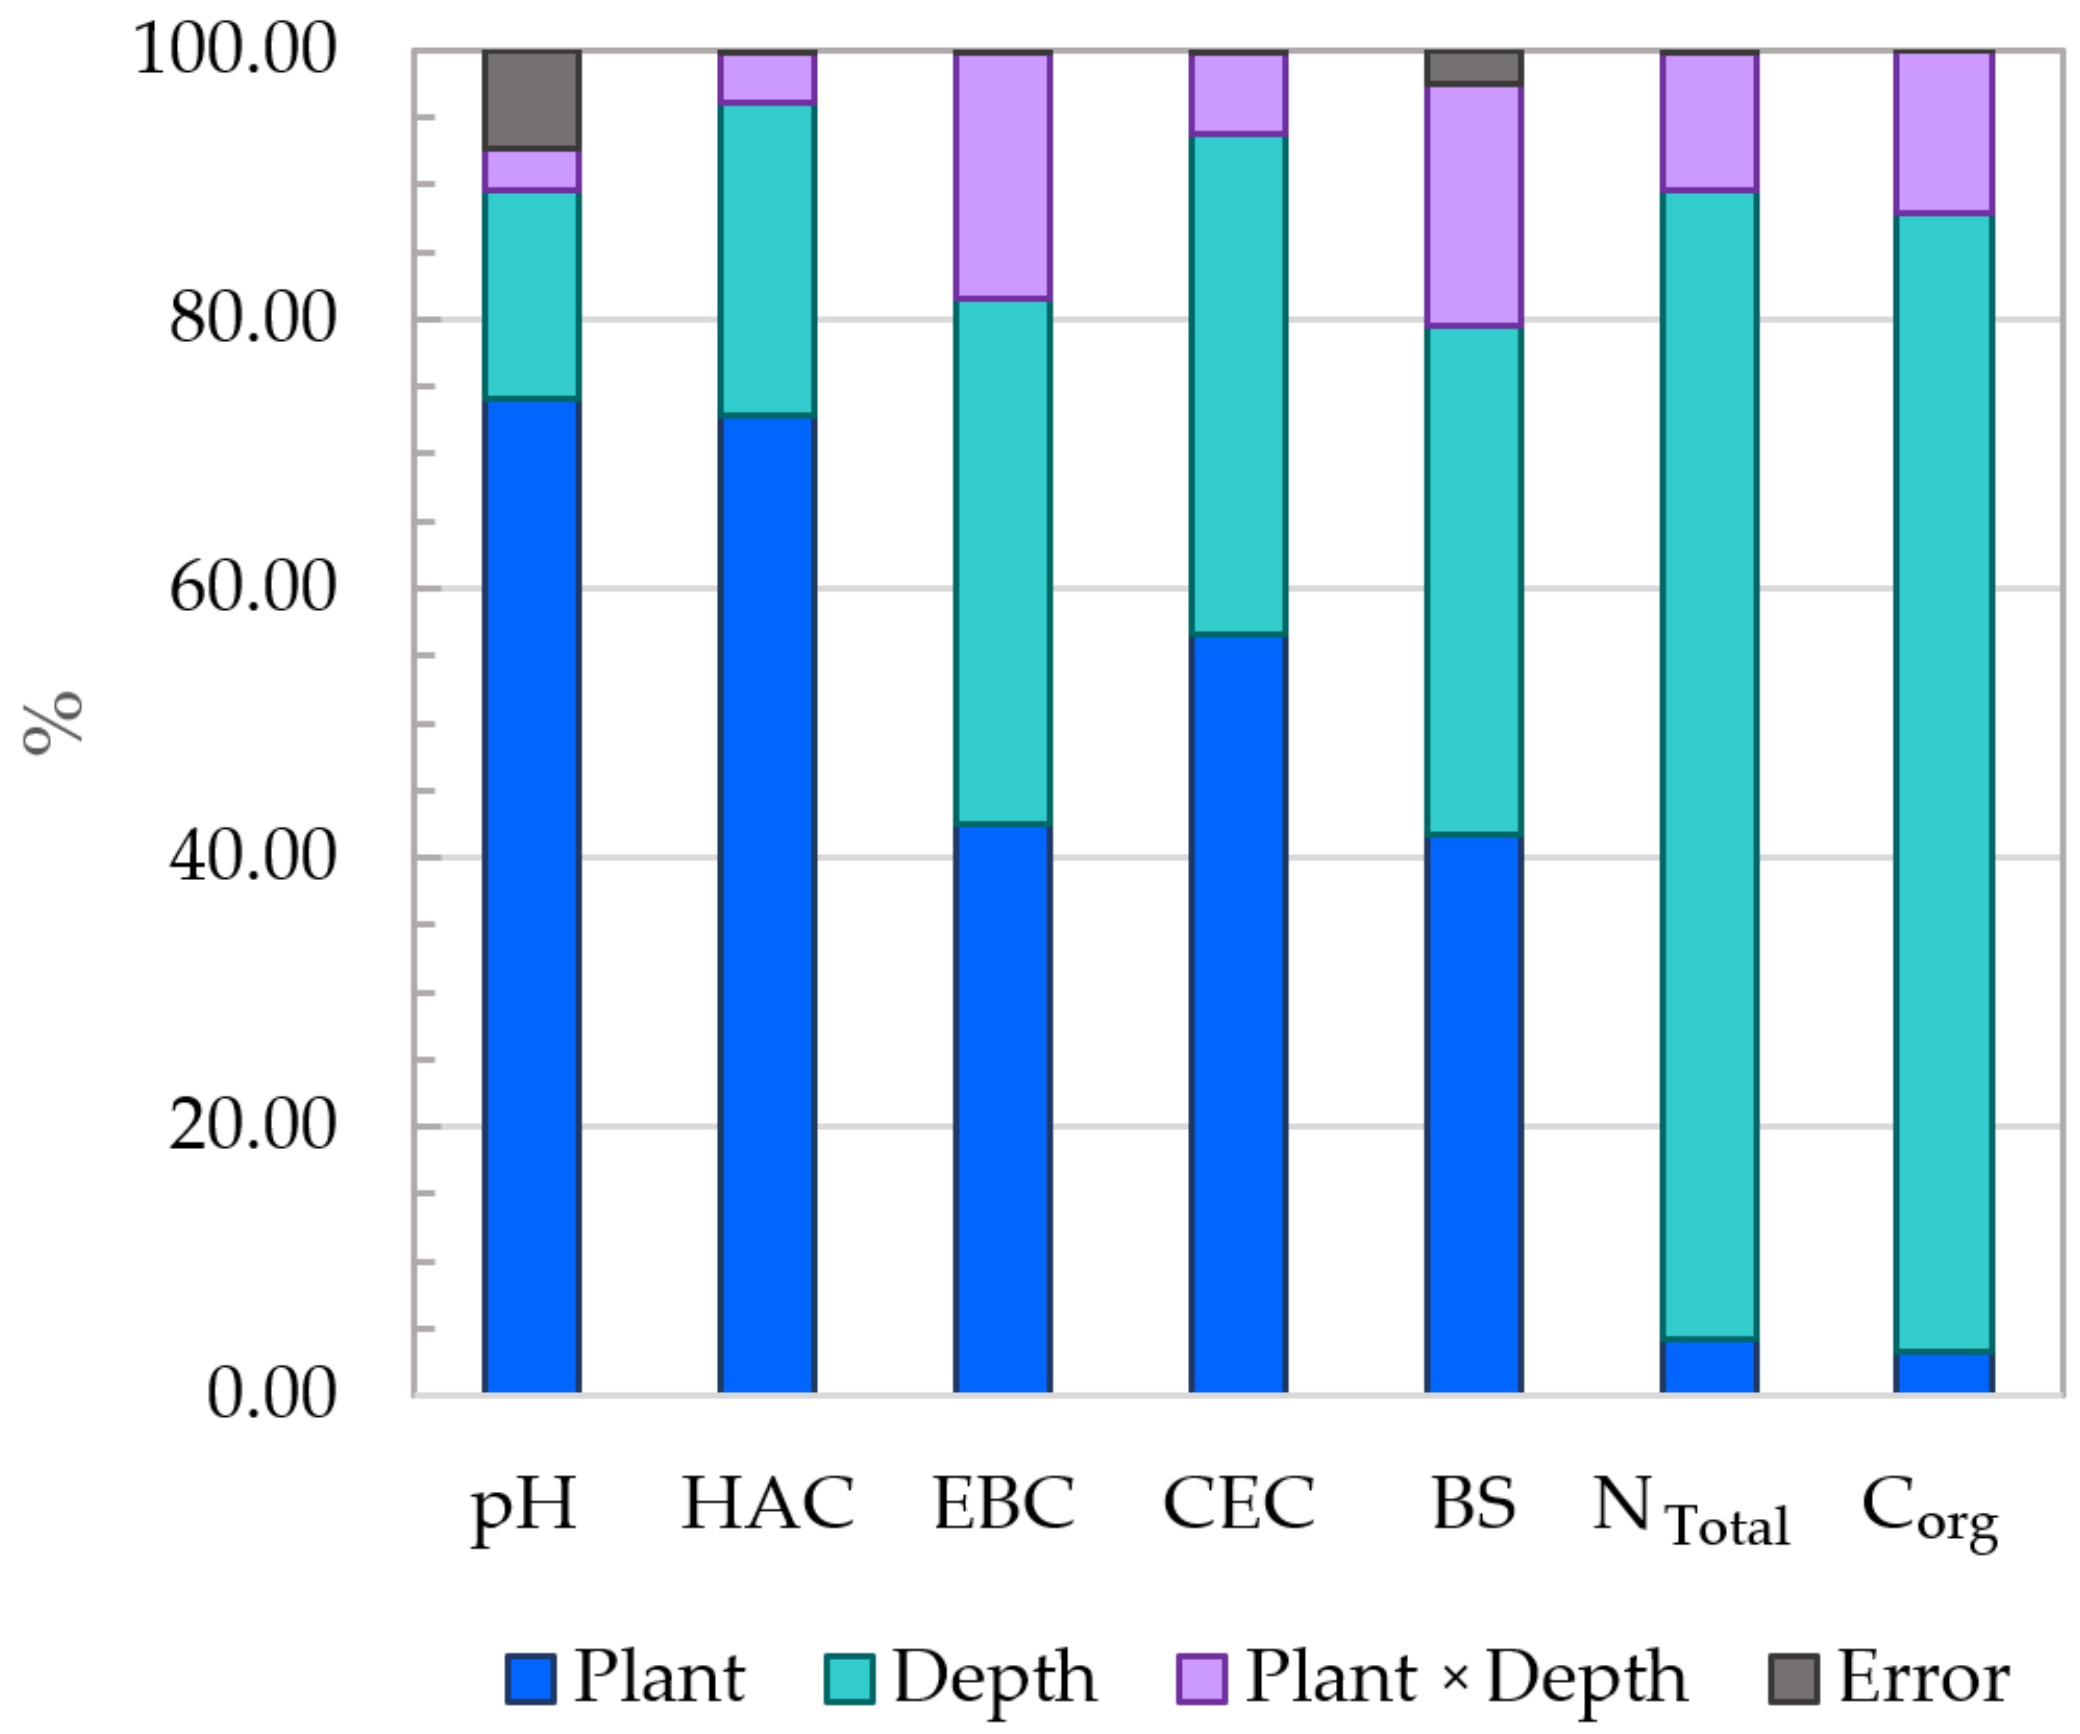
3.3. Physicochemical and Chemical Properties of Soil
3.4. Interactions between Microbiological, Biochemical, and Physicochemical Properties of Soil
4. Discussion
4.1. Abundance and Diversity of Microorganisms
4.2. Enzymatic Activity
4.3. Physicochemical Properties
5. Conclusions
Author Contributions
Funding
Institutional Review Board Statement
Data Availability Statement
Conflicts of Interest
References
- KOWR. (National Center for Agriculture Support). Grain Market in Poland. 2020. Available online: https://www.kowr.gov.pl/uploads/pliki/wydawnictwa/2020/Broszura_Rynek_zboz_w_Polsce_12.2020.pdf (accessed on 21 June 2024).
- Różewicz, M. Yield, grain quality and potential use of triticale in Poland. Pol. J. Agron. 2022, 49, 9–19. [Google Scholar] [CrossRef]
- Czembor, E.; Stępień, Ł.; Waśkiewicz, A. Effect of Environmental Factors on Fusarium Species and Associated Mycotoxins in Maize Grain Grown in Poland. PLoS ONE 2015, 10, e0133644. [Google Scholar] [CrossRef] [PubMed]
- FAO (Food and Agricultural Organization). FAOSTAT: Production: Crops and Livestock Products. 2023. Available online: https://www.fao.org/3/cc9205en/cc9205en.pdf.https://www.fao.org/worldfoodsituation/csdb/en (accessed on 21 June 2024).
- FAO. Statistical Yearbook; Word Food and Agriculture: Roma, Italy, 2015; Available online: https://openknowledge.fao.org/server/api/core/bitstreams/9a8e88e3-5814-49c9-b350-1d68a745ca6a/content (accessed on 1 February 2024).
- Melykh, K.; Jha, S. Regulation of biomass production in eu from global socioeconomic perspective. Int. J. New Econ. Soc. Sci. 2016, 4, 71–77. [Google Scholar] [CrossRef]
- Osman, K.T. Plant nutrients and soil fertility management. In Soils; Springer: Dordrecht, The Netherlands, 2013. [Google Scholar] [CrossRef]
- Javed, A.; Ali, E.; Afzal, K.B.; Osman, A.; Riaz, S. Soil Fertility: Factors affecting soil fertility, and biodiversity responsible for soil fertility. Inter. J. Plant Anim. Environ. Sci. 2022, 12, 021–033. [Google Scholar] [CrossRef]
- Saglam, M.; Dengiz, O. Distribution and evaluation of soil fertility based on geostatistical approach in bafra deltaic plain. Turk. Tarim. Gida. Bilim. Teknol. Derg. 2014, 1, 186–195. [Google Scholar] [CrossRef]
- Nguemezi, C.; Tematio, P.; Yemefack, M.; Tsozue, D.; Silatsa, T.B.F. Soil quality and soil fertility status in major soil groups at the Tombel area, South-West Cameroon. Heliyon 2020, 6, e03432. [Google Scholar] [CrossRef] [PubMed]
- Rodríguez, S.L.; van Bussel, L.G.J.; Alkemade, R. Classification of agricultural land management systems for global modeling of biodiversity and ecosystem services. Agri. Ecosys. Environ. 2024, 360, 108795. [Google Scholar] [CrossRef]
- Alkemade, R.; van Bussel, L.G.J.; Rodríguez, S.L.; Schipper, A.M. Global biodiversity assessments need to consider mixed multifunctional land-use systems. Curr. Opin. Environ. Sust. 2022, 56, 101174. [Google Scholar] [CrossRef]
- Blicharska, M.; Smithers, R.J.; Mikusinski, G.; Ronnback, P.; Harrison, P.A.; Nilsson, M.; Sutherland, W.J. Biodiversity’s contributions to sustainable development. Nat. Sust. 2019, 2, 1083–1093. [Google Scholar] [CrossRef]
- Petersson, M.; Stoett, P. Lessons learnt in global biodiversity governance. Inter. Environ. Agreem. 2022, 22, 333–352. [Google Scholar] [CrossRef]
- Leadley, P.; Gonzalez, A.; Obura, D.; Krug, C.B.; Londono-Murcia, M.C.; Millette, K.L.; Radulovici, A.; Rankovic, A.; Shannon, L.J.; Archer, E.; et al. Achieving global biodiversity goals by 2050 requires urgent and integrated actions. One Earth 2022, 5, 597–603. [Google Scholar] [CrossRef]
- Paleari, S. The EU policy on climate change, biodiversity, and circular economy: Moving towards a Nexus approach. Environ. Sci. Pol. 2024, 151, 103603. [Google Scholar] [CrossRef]
- Shen, Z.F.; Zhang, W.X.; Shao, Y.H.; Leilei, S.; Shengjie, L.; Nannan, S.; Shenglei, F. Soil biota and sustainable agriculture: A review. Acta Ecol. Sin. 2020, 10, 3183–3206. [Google Scholar] [CrossRef]
- Santos, S.S.; Scholer, A.; Nielsen, T.K.; Hansen, L.H.; Schloter, M.; Winding, A. Land use as a driver for protist community structure in soils under agricultural use across Europe. Sci. Tot. Environ. 2020, 717, 137228. [Google Scholar] [CrossRef]
- Pulleman, M.M.; de Boer, W.; Giller, K.E.; Kuyper, T.W. Soil biodiversity and nature-mimicry in agriculture; the power of metaphor? Outlook Agric. 2022, 51, 75–90. [Google Scholar] [CrossRef]
- Bargaz, A.; Lyamlouli, K.; Chtouki, M.; Zeroual, Y.; Dhiba, D. Soil microbial resources for improving fertilizers efficiency in an integrated plant nutrient management system. Front. Microbiol. 2018, 9, 1606. [Google Scholar] [CrossRef]
- Nath, M.; Bhatt, D.; Bhatt, M.D.; Prasad, R.; Tuteja, N. Microbe-mediated enhancement of nitrogen and phosphorus content for crop improvement. In Crop Improvement through Microbial Biotechnology; Elsevier: Amsterdam, The Netherlands, 2018; pp. 291–301. [Google Scholar] [CrossRef]
- Liang, J.L.; Liu, J.; Jia, P.; Yang, T.T.; Zeng, Q.W.; Zhang, S.C.; Liao, B.; Shu, W.S.; Li, J.T. Novel phosphate-solubilizing bacteria enhance soil phosphorus cycling following ecological restoration of land degraded by mining. ISME J. 2020, 14, 1600–1613. [Google Scholar] [CrossRef] [PubMed]
- Younas, T.; Umber, M.; Gondal, A.H.; Aziz, H.; Khan, M.S.; Jabbar, A.; Shahzad, H.; Panduro-Tenazoa, N.M.; Jamil, M.; Ore Areche, F. A comprehensive review on impact of microorganisms on soil and plant. J. Biores. Manag. 2022, 9, 109–118. Available online: https://corescholar.libraries.wright.edu/jbm/vol9/iss2/12 (accessed on 1 February 2024).
- Basu, S.; Kumar, G.; Chhabra, S.; Prasa, R. Role of soil microbes in biogeochemical cycle for enhancing soil fertility. New Fut. Develop. Microb. Biotechnol. Bioeng. 2021, 13, 149–157. [Google Scholar] [CrossRef]
- Ray, P.; Lakshmanan, V.; Labbé, J.L.; Craven, K.D. Microbe to microbiome: A paradigm shift in the application of microorganisms for sustainable agriculture. Front. Microbiol. 2020, 11, 622926. [Google Scholar] [CrossRef]
- Meurer, K.; Barron, J.; Chenu, C.; Coucheney, E.; Fielding, M.; Hallett, P.; Herrmann, A.M.; Keller, T.; Koestel, J.; Larsbo, M.; et al. A framework for modeling soil structure dynamics induced by biological activity. Glob. Chang. Biol. 2020, 26, 5382–5403. [Google Scholar] [CrossRef] [PubMed]
- Boros-Lajszner, E.; Wyszkowska, J.; Borowik, A.; Kucharski, J. The response of the soil microbiome to contamination with cadmium, cobalt, and nickel in soil sown with Brassica napus. Minerals 2021, 11, 498. [Google Scholar] [CrossRef]
- Breza-Boruta, B.; Bauza-Kaszewska, J. Effect of microbial preparation and biomass incorporation on soil biological and chemical properties. Agriculture 2023, 13, 969. [Google Scholar] [CrossRef]
- Wang, X.; Zhou, M.; Wang, H.; Yue, H.; Zhang, Y.; Jiang, F.; Ge, H.; Huang, Y.; Lin, J. Depth-dependent responses of the soil bacterial community under vegetation restoration in soil erosion areas of southern China. Land Degrad. Develop. 2024, 35, 1142–1154. [Google Scholar] [CrossRef]
- Coolen, M.J.L.; van de Giessen, J.; Zhu, E.Y.; Wuchter, C. Bioavailability of soil organic matter and microbial community dynamics upon permafrost thaw. Environ. Microbiol. 2011, 13, 2299–2314. [Google Scholar] [CrossRef] [PubMed]
- Wang, C.; Liu, D.; Bai, E. Decreasing soil microbial diversity is associate with decreasing microbial biomass under nitrogen addition. Soil Biol. Biochem. 2018, 120, 126–133. [Google Scholar] [CrossRef]
- Li, S.; Wang, P.; Chen, Y.; Wilson, M.C.; Yang, X.; Ma, C.; Lu, J.; Chen, X.; Wu, J.; Shu, W.; et al. Island biogeography of soil bacteria and fungi: Similar patterns, but different mechanisms. ISME J. 2020, 14, 1886–1896. [Google Scholar] [CrossRef]
- Shen, C.; Xiong, J.; Zhang, H.; Feng, Y.; Lin, X.; Li, X.; Liang, W.; Chu, H. Soil pH drives the spatial distribution of bacterial communities along elevation on Changbai Mountain. Soil Biol. Biochem. 2013, 57, 204–2011. [Google Scholar] [CrossRef]
- Bartram, A.K.; Jiang, X.; Lynch, M.D.; Masella, A.P.; Nicol, G.W.; Dushoff, J.; Neufeld, J.D. Exploring links between pH and bacterial community composition in soils from the Craibstone Experimental Farm. FEMS Microbiol. Ecol. 2014, 87, 403–415. [Google Scholar] [CrossRef]
- Shen, C.; Shi, Y.; Kunkun, F.; He, J.-S.; Adams, J.M.; Ge, Y.; Chu, H. Soil pH dominates elevational diversity pattern for bacteria in high elevation alkaline soils on the Tibetan Plateau. FEMS Microbiol. Ecol. 2019, 95, fiz003. [Google Scholar] [CrossRef]
- Kang, E.; Li, Y.; Zhang, X.; Yan, Z.; Wu, H.; Li, M.; Yan, Z.; Zhang, K.; Wang, J.; Kang, X. Soil pH and nutrients shape the vertical distribution of microbial communities in an alpine wetland. Sci. Tot. Environ. 2021, 774, 145780. [Google Scholar] [CrossRef]
- Micenkova, L.; Sedlacek, I.; Hrbacek, F.; Svec, P.; Nyvlt, D.; Pantucek, R.; Maslanova, I. Effect of soil depth on the structure of bacterial composition in the active layer at five geologically distinct sites on James Ross and Vega Islandsin Antarctica. Polar Biol. 2024, 47, 295–303. [Google Scholar] [CrossRef]
- Bickel, S.; Or, D. Soil bacterial diversity mediated by microscale aqueous-phase processes across biomes. Nat. Comm. 2020, 11, 116. [Google Scholar] [CrossRef] [PubMed]
- García-Ruiz, R.; Ochoa, V.; Hinojosa, M.B.; Carreira, J.A. Suitability of enzyme activities for the monitoring of soil quality improvement in organic agricultural systems. Soil Biol. Biochem. 2008, 40, 2137–2145. [Google Scholar] [CrossRef]
- Mijangos, I.; Pérez, R.; Albizu, I.; Garbisu, C. Effects of fertilization and tillage on soil biological parameters. Enz. Microb. Technol. 2006, 40, 100–106. [Google Scholar] [CrossRef]
- Rieznik, S.; Havva, D.; Chekar, O. Enzymatic activity of typical chernozems under the conditions of the organic farming systems. Sci. Pap. Ser. A Agron. 2021, 64, 114–119. Available online: https://agronomyjournal.usamv.ro/pdf/2021/issue_2/Art15.pdf (accessed on 1 February 2024).
- Utobo, E.B.; Tewari, L. Soil enzymes as bioindicators of soil ecosystem status. App. Ecol. Environ. Res. 2015, 13, 147–169. [Google Scholar] [CrossRef]
- Lee, S.-H.; Kim, M.-S.; Kim, J.-G.; Kim, S.-O. Use of soil enzymes as indicators for contaminated soil monitoring and sustainable management. Sustainability 2020, 12, 8209. [Google Scholar] [CrossRef]
- Mencel, J.; Mocek-Płóciniak, A.; Kryszak, A. Soil microbial community and enzymatic activity of grasslands under different use practices: A review. Agronomy 2022, 12, 1136. [Google Scholar] [CrossRef]
- Yu, H.; Fan, P.; Hou, J.; Dang, Q.; Cui, D.; Xi, B.; Tan, W. Inhibitory effect of microplastics on soil extracellular enzymatic activities by changing soil properties and direct adsorption: An investigation at the aggregate-fraction level. Environ. Pollut. 2020, 267, 115544. [Google Scholar] [CrossRef]
- Hatfield, J.L.; Antle, J.; Garrett, K.A.; Izaurralde, R.C.; Mader, T.; Marshall, E.; Nearing, M.; Robertson, G.P.; Ziska, L. Indicators of climate change in agricultural systems. Clim. Chang. 2020, 163, 1719–1732. [Google Scholar] [CrossRef]
- de Alcantara, I.R.; Vieira Filho, J.E.R.; Gasques, J.G. Farming Production in Brazil: Innovation and land-sparing effect. Inter. J. Agri. Biosys. Engin. 2021, 15, 93–100. Available online: https://www.researchgate.net/publication/355572364 (accessed on 1 February 2024).
- Dotaniya, M.L.; Aparna, K.; Dotaniya, C.K.; Singh, M.; Regar, K.L. Chapter 33—Role of soil enzymes in sustainable crop production. In Enzymes in Food Biotechnology; Academic Press: Cambridge, MA, USA, 2019; pp. 569–589. [Google Scholar] [CrossRef]
- Bungau, S.; Behl, T.; Aleya, L.; Bourgeade, P.; Aloui-Sosse, B.; Purza, A.L.; Abid, A.; Samuel, A.D. Expatiating the impact of anthropogenic aspects and climatic factors on long-term soil monitoring and management. Environ. Sci. Pollut. Res. 2021, 28, 30528–30550. [Google Scholar] [CrossRef] [PubMed]
- Kanarek, P.; Breza-Boruta, B.; Pawłowski, M.; Kobierski, M. Evolution of microbiological and chemical properties of soils as a result of anthropogenic denudation. Agriculture 2023, 13, 2247. [Google Scholar] [CrossRef]
- Bonilla-Bedoya, S.; Valencia, K.; Herrera, M.A.; López-Ulloa, M.A.; Donoso, D.A.; José Pezzopane, E.M. Mapping 50 years of contribution to the development of soil quality biological indicators. Ecol. Indic. 2023, 148, 110091. [Google Scholar] [CrossRef]
- Wyszkowska, J.; Borowik, A.; Zaborowska, M.; Kucharski, J. The usability of sorbents in restoring enzymatic activity in soils polluted with petroleum-derived products. Materials 2023, 16, 3738. [Google Scholar] [CrossRef] [PubMed]
- Wyszkowska, J.; Borowik, A.; Kucharski, M.; Kucharski, J. Applicability of biochemical indices to quality assessment of soil polluted with heavy metals. J. Elem. 2013, 18, 733–756. [Google Scholar] [CrossRef]
- Burns, R.G.; DeForest, J.L.; Marxsen, J.; Sinsabaugh, R.L.; Stromberger, M.E. Soil enzymes in a changing environment: Current knowledge and future directions. Soil Biol. Biochem. 2013, 58, 216–234. [Google Scholar] [CrossRef]
- Delgado-Baquerizo, M.; Oliverio, A.M.; Brewer, T.E.; Benavent-Gonzalez, A.; Eldridge, D.J.; Bardgett, R.D.; Maestre, F.T.; Singh, B.K.; Fierer, N. A global atlas of the dominant bacteria found in soil. Science 2018, 359, 320–325. [Google Scholar] [CrossRef]
- Dobrzynski, J.; Wierzchowski, P.S.; Stępień, W.; Gorska, E.B. The Reaction of cellulolytic and potentially cellulolytic spore-forming bacteria to various types of crop management and farmyard manure fertilization in bulk soil. Agronomy 2021, 11, 772. [Google Scholar] [CrossRef]
- Alami, M.M.; Pang, Q.; Gong, Z.; Yang, T.; Tu, D.; Zhen, O.; Yu, W.; Alami, M.J.; Wang, X. Continuous cropping changes the composition and diversity of bacterial communities: A meta-analysis in nine different fields with different plant cultivation. Agriculture 2021, 11, 1224. [Google Scholar] [CrossRef]
- Rao, D.; Meng, F.; Yan, X.; Zhang, M.; Yao, X.; Kim, K.S.; Zhao, J.; Qiu, Q.; Xie, F.; Zhang, W. Changes in soil microbial activity, bacterial community composition and function in a long-term continuous soybean cropping system after corn insertion and fertilization. Front. Microbiol. 2021, 12, 638326. [Google Scholar] [CrossRef]
- Yang, R.; Qi, Y.; Yang, L.; Chen, T.; Deng, A.; Zhang, J.; Song, Z.J.; Ge, B. Rotation regimes lead to significant differences in soil macrofaunal biodiversity and trophic structure with the changed soil properties in a rice-based double cropping system. Geoderma 2022, 405, 115424. [Google Scholar] [CrossRef]
- Hao, J.; Chai, Y.N.; Lopes, L.D.; Ordonez, R.A.; Wright, E.E.; Archontoulis, S.; Schachtman, D.P. The effects of soil depth on the structure of microbial communities in agricultural soils in Iowa (United States). App. Environ. Microbiol. 2021, 87, e02673-20. [Google Scholar] [CrossRef]
- Brodziński, Z.; Cymes, I.; Dragańska, E.; Borawska, M.; Brodzińska, K.; Janikowska-Kiśluk, A.; Linkowski, P. Wieloletni plan Działania LPW Powiatu Szczycieńskiego. Warmińsko-Mazurski Ośrodek Doradztwa Rolniczego. 2022. Available online: https://wmodr.pl/files/Tn2q2v7QVRx6SWlyzVqho7LbpwGmypoR2cEgNkqf.pdf (accessed on 1 February 2024).
- Von Cossel, M.; Lewandowski, I.; Elbersen, B.; Staricki, I.; Van Eupen, M.; Iqbal, Y.; Mantel, S.; Scordia, D.; Testa, G.; Cosentino, S.L.; et al. Marginal agricultural land low-input systems for biomass production. Energies 2019, 12, 3123. [Google Scholar] [CrossRef]
- Huang, J.; Hartemink, A.E. Soil and environmental issues in sandy soils. Earth-Sci. Rev. 2020, 28, 103295. [Google Scholar] [CrossRef]
- IMGW-PIB. Available online: https://klimat.imgw.pl/pl/climate-maps/#Mean_Temperature/Yearly/1991-2020/3/Autumn (accessed on 14 May 2024).
- Weather Center. Available online: https://www.pogodowecentrum.pl/archiwum-pogody/szczytno (accessed on 14 May 2024).
- Lipińska, A.; Wyszkowska, J.; Kucharski, J. Microbiological and biochemical activity in soil contaminated with pyrene subjected to bioaugmentation. Water Air Soil Pollut. 2021, 232, 45. [Google Scholar] [CrossRef]
- Zaborowska, M.; Wyszkowska, J.; Borowik, A.; Kucharski, J. Bisphenol A—A dangerous pollutant distorting the biological properties of soil. Inter. J. Mol. Sci. 2021, 22, 12753. [Google Scholar] [CrossRef] [PubMed]
- Ferris, M.J.; Muyzer, G.; Ward, D.M. Denaturing gradient gel electrophoresis profiles of 16s rRNA-defined populations inhabiting a hot spring microbial mat community. App. Environ. Microbiol. 1996, 62, 340–346. [Google Scholar] [CrossRef]
- Öhlinger, R. Dehydrogenase activity with the substrate TTC in: Methods in soil biology. In Methods in Soil Biology; Schinner, F., Öhlinger, R., Kandeler, E., Margesin, R., Eds.; Springer: Berlin, Germany, 1996; p. 241. [Google Scholar]
- Johnson, J.I.; Temple, K.L. Some variables affecting measurement of catalase activity in soil. Soil Sci. Soc. Am. J. 1964, 28, 207–209. [Google Scholar] [CrossRef]
- Alef, K.; Nannipieri, P. Methods in Applied Soil Microbiology and Biochemistry; Academic London: London, UK, 1995; pp. 316–365. [Google Scholar]
- Wyszkowska, J.; Borowik, A.; Zaborowska, M.; Kucharski, J. The potential for restoring the activity of oxidoreductases and hydrolases in soil contaminated with petroleum products using perlite and dolomite. Appl. Sci. 2024, 14, 3591. [Google Scholar] [CrossRef]
- Statsoft, Inc. Statistica 2017 (Data Analysis Software System), Version 12.5. Available online: www.statsoft.com (accessed on 10 February 2024).
- Warnes, G.R.; Bolker, B.; Bonebakker, L.; Gentleman, R.; Huber, W.; Liaw, A.; Lumley, T.; Maechler, M.; Magnusson, M.; Moeller, S.; et al. Gplots: Various R Programming Tools for Plotting Data. Gplots 3.1.3. 2022. Available online: https://Cran.r-Project.Org/Web/Packages/Gplots/ (accessed on 10 February 2024).
- Krzywinski, M.; Schein, J.; Birol, İ.; Connors, J.; Gascoyne, R.; Horsman, D.; Jones, S.J.; Marra, M.A. Circos: An Information Aesthetic for Comparative Genomics. Genome Res. 2009, 19, 1639–1645. [Google Scholar] [CrossRef]
- R Core Team. R: A Language and Environment for Statistical Computing; R Foundation for Statistical Computing: Vienna, Austria, 2022; Available online: https://www.r-project.org/ (accessed on 10 February 2024).
- RStudio Team. RStudio: Integrated Development for R; RStudio Version 2023.06.0; PBC: Boston, MA, USA, 2020; Available online: http://www.rstudio.com/ (accessed on 10 February 2024).
- Heberle, H.; Meirelles, G.V.; da Silva, F.R.; Telles, G.P.; Minghim, R. InteractiVenn: A web-based tool for the analysis of sets through Venn diagrams. BMC Bioinform. 2015, 16, 169. [Google Scholar] [CrossRef] [PubMed]
- Sokol, N.; Pett-Ridge, J.; Blazewicz, S.; Hestrin, R.; Slessarev, E.; Marschmann, G.; Brodie, E.; Nicolas, A.; Firestone, M.; Hungate, B.; et al. Life and death in the soil microbiome: How ecological processes influence biogeochemistry. Nat. Rev. Microbiol. 2022, 20, 415–430. [Google Scholar] [CrossRef] [PubMed]
- Hu, L.; Robert, C.A.; Cadot, S.; Zhang, X.; Ye, M.; Li, B.; Manzo, D.; Chervet, N.; Steinger, T.; Van Der Heijden, M.G. Root exudate metabolites drive plant-soil feedbacks on growth and defense by shaping the rhizosphere microbiota. Nat. Comm. 2018, 9, 2738. [Google Scholar] [CrossRef] [PubMed]
- Mundra, S.; Kjønaas, O.J.; Morgado, L.N.; Krabberød, A.K.; Ransedokken, Y.; Kauserud, H. Soil Depth Matters: Shift in composition and inter-kingdom co-occurrence patterns of microorganisms in forest soils. FEMS Microbiol. Ecol. 2021, 97, fiab022. [Google Scholar] [CrossRef] [PubMed]
- Li, Y.; Niu, W.; Wang, J.; Liu, L.; Zhang, M.; Xu, J. Effects of artificial soil aeration volume and frequency on soil enzyme activity and microbial abundance when cultivating greenhouse tomato. Soil Sci. Soc. Am. J. 2016, 80, 1208–1221. [Google Scholar] [CrossRef]
- Yin, C.; Jones, K.L.; Peterson, D.E.; Garrett, K.A.; Hulbert, S.H.; Paulitz, T.C. Members of soil bacterial communities sensitive to tillage and crop rotation. Soil Biol. Biochem. 2010, 42, 2111–2118. [Google Scholar] [CrossRef]
- Andam, C.; Choudoir, M.; Vinh Nguyen, A.; Sol Park, H.; Buckley, D. Contributions of ancestral inter-species recombination to the genetic diversity of extant Streptomyces lineages. ISME J. 2016, 10, 1731–1741. [Google Scholar] [CrossRef] [PubMed]
- Shan, K.K.; Modi, B.; Pandey, H.P.; Subedi, A.; Aryal, G.; Pandey, M.; Shrestha, J. Diversified Crop Rotation: An approach for sustainable agriculture production. Adv. Agri. 2021, 9, 8924087. [Google Scholar] [CrossRef]
- More, S.S.; Shinde, S.E.; Kasture, M.C. Root exudates a key factor for soil and plant: An overview. Phar. Innov. J. 2019, 8, 449–459. [Google Scholar]
- Liu, Y.; Xu, Z.; Chen, L.; Xun, W.; Shu, X.; Chen, Y.; Sun, X.; Wang, Z.; Ren, Y.; Shen, Q.; et al. Root colonization by beneficial rhizobacteria. FEMS Microbiol. Rev. 2024, 48, fuad066. [Google Scholar] [CrossRef] [PubMed]
- Chagas, F.O.; Pessotti, R.D.C.; Caraballlo-Rodríguez, A.M.; Pupo, M.T. Chemical signaling involved in plant-microbe interactions. Chem. Soc. Rev. 2018, 47, 1652–1704. [Google Scholar] [CrossRef] [PubMed]
- Stass, A.; Smit, I.; Eticha, D.; Oettler, G.; Horst, W.J. The significance of organic-anion exudation for the aluminum resistance of primary triticale derived from wheat and rye parents differing in aluminum resistance. J. Plant Nut. Soil Sci. 2008, 171, 634–642. [Google Scholar] [CrossRef]
- Yang, L.T.; Qi, Y.P.; Jiang, H.X.; Chen, L.-S. Roles of organic acid anion secretion in aluminum tolerance of higher plants. BioMed Res. Inter. 2013, 2, 173682. [Google Scholar] [CrossRef]
- del Pozo, A.; Méndez-Espinoza, A.M.; Castillo, D. Chapter 13—Triticale. In Neglected and Underutilized Crops, Future Smart Food; Elsevier: Amsterdam, The Netherlands, 2023; pp. 325–362. [Google Scholar] [CrossRef]
- Wu, H.; Wu, L.; Zhu, Q.; Wang, J.; Qin, X.; Xu, J.; Kong, L.; Chen, J.; Lin, S.; Khan, M.U.; et al. The role of organic acids on microbial deterioration in the Radix pseudostellariae rhizosphere under continuous monoculture regimes. Sci. Rep. 2017, 7, 3497. [Google Scholar] [CrossRef] [PubMed]
- Rolfe, S.A.; Griffiths, J.; Ton, J. Crying out for help with root exudates: Adaptive mechanisms by which stressed plants assemble health-promoting soil microbiomes. Curr. Opin. Microbiol. 2019, 49, 73–82. [Google Scholar] [CrossRef] [PubMed]
- Feng, H.; Fu, R.; Hou, X.; Lv, Y.; Zhang, N.; Liu, Y.; Xu, Z.; Miao, Y.; Krell, T.; Shen, Q.; et al. Chemotaxis of beneficial rhizobacteria to root exudates: The first step towards root-microbe rhizosphere interactions. Inter. J. Mol. Sci. 2021, 22, 6655. [Google Scholar] [CrossRef] [PubMed]
- Liu, Y.; Feng, H.; Fu, R.; Zhang, N.; Du, W.; Shen, Q.; Zhang, R. Induced root-secreted D-galactose functions as a chemoattractant and enhances the biofilm formation of Bacillus velezensis SQR9 in an McpA-dependent manner. App. Microbiol. Biotechnol. 2020, 104, 785–797. [Google Scholar] [CrossRef]
- Sampedro, I.; Parales, R.E.; Krell, T.; Hill, J.E. Pseudomonas chemotaxis. FEMS Microbiol. Rev. 2015, 39, 17–46. [Google Scholar] [CrossRef]
- Rayne, N.; Aula, L. Livestock manure and the impacts on soil health: A review. Soil Sys. 2020, 4, 64. [Google Scholar] [CrossRef]
- Strom, N.; Hu, W.; Haarith, D.; Chen, S.; Bushley, K. Interactions between soil properties, fungal communities, the soybean cyst nematode, and crop yield under continuous corn and soybean monoculture. App. Soil Ecol. 2020, 147, 103388. [Google Scholar] [CrossRef]
- Mitra, D.; Mondal, R.; Khoshru, B.; Senapati, A.; Radha, T.K.; Mahakur, B.; Uniyal, N.; Myo, E.M.; Boutaj, H.; Guerra Sierra, B.E.; et al. Actinobacteria-enhanced plant growth, nutrient acquisition, and crop protection: Advances in soil, plant, and microbial multifactorial interactions. Pedosphere 2022, 32, 149–170. [Google Scholar] [CrossRef]
- Mawang, C.I.; Azman, A.S.; Mohd Fuad, A.S.; Ahamad, M. Actinobacteria: An eco-friendly and promising technology for the bioaugmentation of contaminants. Biotech. Rep. 2021, 32, e00679. [Google Scholar] [CrossRef] [PubMed]
- Bao, Y.; Dolfing, J.; Guo, Z.; Chen, R.; Wu, M.; Li, Z.; Lin, X.; Feng, Y. Important ecophysiological roles of non-dominant Actinobacteria in plant residue decomposition, especially in less fertile soils. Microbiome 2021, 9, 84. [Google Scholar] [CrossRef] [PubMed]
- Bukar, M.; Sodipo, O.; Dawkins, K.; Ramirez, R.; Kaldapa, J.T.; Tarfa, M.; Esiobu, N. Microbiomes of top and sub-layers of semi-arid soils in north-eastern Nigeria are rich in Firmicutes and Proteobacteria with surprisingly high diversity of rare species. Adv. Microbiol. 2019, 9, 102–118. [Google Scholar] [CrossRef]
- Eldridge, D.J.; Maestre, F.T.; Koen, T.B.; Delgado-Baquerizo, M. Australian dryland soils are acidic and nutrient-depleted, and have unique microbial communities compared with other drylands. J. Biog. 2018, 45, 2803–2814. [Google Scholar] [CrossRef] [PubMed]
- Sun, W.; Xiao, E.; Krumins, V.; Häggblom, M.M.; Dong, Y.; Pu, Z.; Li, B.; Wang, Q.; Xiao, T.; Li, F. Rhizosphere microbial response to multiple metal(loid)s in different contaminated arable soils indicates crop-specific metal-microbe interactions. App. Environ. Microbiol. 2018, 84, e00701-18. [Google Scholar] [CrossRef]
- Gorelova, S.V.; Muratova, A.Y.; Zinicovscaia, I.; Okina, O.I.; Kolbas, A. Prospects for the use of Echinochloa frumentacea for phytoremediation of soils with multielement anomalies. Soil Sys. 2022, 6, 27. [Google Scholar] [CrossRef]
- Rogozhina, E.V.; Zakharikhina, L.V.; Kizilov, A.S.; Gorlenko, M.V. Structural and functional state of the microbial communities in the ancient soloids of archaeological monuments on the Russian Black Sea Coast. Eur. Soil Sci. 2024, 57, 290–300. [Google Scholar] [CrossRef]
- Prakash, O.; Green, S.J.; Singh, P.; Jasrotia, P.; Kostka, J.E. Stress-related ecophysiology of members of the genus Rhodanobacter isolated from a mixed waste contaminated subsurface. Fron. Environ. Sci. Engin. 2021, 15, 23. [Google Scholar] [CrossRef]
- Ma, Y.; Wang, J.; Liu, Y.; Wang, X.; Zhang, B.; Zhang, W.; Chen, T.; Liu, G.; Xue, L.; Cui, X. Nocardioides: “Specialists” for hard-to-degrade pollutants in the environment. Molecules 2023, 28, 7433. [Google Scholar] [CrossRef] [PubMed]
- Peng, W.; Li, X.; Song, J.; Jiang, W.; Liu, Y.; Fan, W. Bioremediation of cadmium- and zinc-contaminated soil using Rhodobacter Sphaeroides. Chemosphere 2018, 197, 33–41. [Google Scholar] [CrossRef] [PubMed]
- Sit, C.S.; Ruzzini, A.C.; Van Arnam, E.B.; Ramadhar, T.R.; Currie, C.R.; Clardy, J. Variable genetic architectures produce virtually identical molecules in bacterial symbionts of fungus-growing ants. Proc. Nat. Acad. Sci. USA 2015, 112, 13150–13154. [Google Scholar] [CrossRef]
- Holmes, N.A.; Innocent, T.M.; Heine, D.; Bassam, M.A.; Worsley, S.F.; Trottmann, F.; Patrick, E.H.; Yu, D.W.; Murrell, J.C.; Schiøtt, M. Genome analysis of two Pseudonocardia phylotypes associated with acromyrmex leafcutter ants reveals their biosynthetic potential. Front. Microbiol. 2016, 7, 2073. [Google Scholar] [CrossRef]
- Singh, N.; Singh, V.; Rai, S.N.; Vamanu, E.; Singh, M.P. Metagenomic analysis of garden soil-derived microbial consortia and unveiling their metabolic potential in mitigating toxic hexavalent chromium. Life 2022, 12, 2094. [Google Scholar] [CrossRef] [PubMed]
- Riahi, H.S.; Heidarieh, P.; Fatahi-Bafghi, M. Genus Pseudonocardia: What we know about its biological properties, abilities and current application in biotechnology. J. App. Microbiol. 2022, 132, 890–906. [Google Scholar] [CrossRef]
- Wołejko, E.; Jabłońska-Trypuć, A.; Wydro, U.; Butarewicz, A.; Łozowicka, B. Soil biological activity as an indicator of soil pollution with pesticides—A review. App. Soil Ecol. 2020, 147, 103356. [Google Scholar] [CrossRef]
- Loeppmann, S.; Blagodatskaya, E.; Pausch, J.; Kuzyakov, Y. Enzyme properties down the soil profile—A matter of substrate quality in rhizosphere and detritusphere. Soil Biol. Biochem. 2016, 103, 274–283. [Google Scholar] [CrossRef]
- Akhtar, K.; Wang, W.; Ren, G.; Khan, A.; Feng, Y.; Yang, G. Changes in soil enzymes, soil properties, and maize crop productivity under wheat straw mulching in Guanzhong, China. Soil Till. Res. 2018, 182, 94–102. [Google Scholar] [CrossRef]
- Zhang, C.; Li, J.; Wang, J.; Liu, B.G.; Wang, G.; Guo, L.; Peng, S. Decreased temporary turnover of bacterial communities along soil depth gradient during a 35-year grazing exclusion period in a semiarid grassland. Geoderma 2019, 351, 49–58. [Google Scholar] [CrossRef]
- Chen, Y.; Han, M.; Yuan, X.; Cao, G.; Zhu, B. Seasonal changes in soil properties, microbial biomass and enzyme activities across the soil profile in two alpine ecosystems. Soil Ecol. Lett. 2021, 3, 383–394. [Google Scholar] [CrossRef]
- Piotrowska-Długosz, A.; Długosz, J.; Gryta, A.; Frąc, M. Responses of N-cycling enzyme activities and functional diversity of soil microorganisms to soil depth, pedogenic processes and cultivated plants. Agronomy 2022, 12, 264. [Google Scholar] [CrossRef]
- Yao, Y.; Shao, M.; Fu, X.; Wang, X.; Wei, X. Effects of shrubs on soil nutrients and enzymatic activities over a 0–100 cm soil profile in the desert-loess transition zone. Catena 2019, 174, 362–370. [Google Scholar] [CrossRef]
- Wolińska, A.; Szafranek-Nakonieczna, A.; Zielenkiewicz, U.; Tomczyk-Żak, K.; Banach, A.; Błaszczyk, M.; Stępniewska, Z. Quantified characterization of soil biological activity under crop cultivation. J. Adv. Biol. 2016, 8, 1655–1665. [Google Scholar] [CrossRef]
- Jaskulska, R. The Level of luvisols biochemical activity in midfield shelterbelt and winter triticale (xTriticosecale Wittm. ex A. Camus) cultivation. Agronomy 2020, 10, 1644. [Google Scholar] [CrossRef]
- Zhang, L.; Li, L.; Pan, X.; Shi, Z.; Feng, X.; Gong, B.; Li, J.; Wang, L. Enhanced growth and activities of the dominant functional microbiota of chicken manure composts in the presence of maize straw. Front. Microbiol. 2018, 9, 1131. [Google Scholar] [CrossRef]
- Finney, D.M.; Buyer, J.S.; Kaye, J.P. Living cover crops have immediate impacts on soil microbial community structure and function. J. Soil Water Conserv. 2017, 72, 361–373. [Google Scholar] [CrossRef]
- da Consolação Rosado, M.; de Araújo, G.J.; Pallini, A.; Venzon, M. Cover crop intercropping increases biological control in coffee crops. Biol. Contr. 2021, 160, 104675. [Google Scholar] [CrossRef]
- Woźniak, A.; Kawecka-Radomska, M. Crop management effect on chemical and biological properties of soil. Inter. J. Plant Prod. 2016, 10, 391–402. [Google Scholar] [CrossRef]
- Lopes, A.A.C.; de Sousa, D.M.G.; Chaer, G.M.; Junior, F.B.R.; Goedert, W.J.; Mendes, I.C. Interpretation of microbial soil indicators as a function of crop yield and organic carbon. Soil Sci. Soc. Am. J. 2013, 77, 461–472. [Google Scholar] [CrossRef]
- Maurya, S.; Abraham, J.S.; Somasundaram, S.; Toteja, R.; Gupta, R.; Makhija, S. Indicators for assessment of soil quality: A mini-review. Environ. Mon. Assess. 2020, 192, 604. [Google Scholar] [CrossRef] [PubMed]
- Hermans, S.M.; Buckley, H.L.; Case, B.S.; Curran-Cournane, F.; Taylor, M.; Lear, G. Using soil bacterial communities to predict physico-chemical variables and soil quality. Microbiome 2020, 8, 79. [Google Scholar] [CrossRef] [PubMed]
- Dhaliwal, S.S.; Naresh, R.K.; Mandal, A.; Walia, M.K.; Gupta, R.K.; Singh, R.; Dhaliwal, M.K. Effect of manures and fertilizers on soil physical properties, build-up of macro and micronutrients and uptake in soil under different cropping systems: A review. J. Plant Nutr. 2019, 42, 2873–2900. [Google Scholar] [CrossRef]
- Joris, H.A.W.; Caires, E.F.; Scharr, D.A.; Bini, A.R.; Haliski, A. Liming in the conversion from degraded pastureland to a no-till cropping system in Southern Brazil. Soil Tillage Res. 2016, 162, 68–77. [Google Scholar] [CrossRef]
- Enesi, R.O.; Dyck, M.; Chang, S.; Thilakarathna, M.S.; Fan, X.; Strelkov, S.; Gorim, L.Y. Liming remediates soil acidity and improves crop yield and profitability- a meta-analysis. Front. Agron. 2023, 5, 1194896. [Google Scholar] [CrossRef]
- Xu, Z.; Zhang, T.; Wang, S.; Wang, Z. Soil pH and C/N ratio determines spatial variations in soil microbial communities and enzymatic activities of the agricultural ecosystems in Northeast China: Jilin Province case. App. Soil Ecol. 2020, 155, 103629. [Google Scholar] [CrossRef]


| Fraction Diameter (mm) | Depth (cm) | |||||
|---|---|---|---|---|---|---|
| 0–20 | 21–40 | 41–60 | 0–20 | 21–40 | 41–60 | |
| Plants | ||||||
| Zea mays | Triticosecale | |||||
| % | ||||||
| 2.0–1.0 | 0.00 | 0.00 | 0.00 | 0.00 | 0.00 | 0.00 |
| 1.0–0.5 | 0.00 | 0.00 | 0.00 | 0.00 | 0.00 | 0.00 |
| 0.5–0.25 | 0.22 | 0.28 | 0.00 | 1.23 | 0.27 | 1.66 |
| 0.25–0.1 | 26.48 | 34.24 | 22.34 | 35.81 | 37.29 | 41.73 |
| 0.1–0.05 | 47.46 | 48.74 | 71.64 | 49.53 | 51.54 | 52.06 |
| 0.05–0.02 | 14.05 | 6.77 | 6.02 | 9.62 | 5.35 | 3.43 |
| 0.02–0.006 | 7.34 | 5.62 | 0.00 | 2.86 | 4.03 | 1.08 |
| 0.006–0.002 | 4.41 | 4.32 | 0.00 | 0.95 | 1.52 | 0.04 |
| <0.002 | 0.04 | 0.03 | 0.00 | 0.00 | 0.00 | 0.00 |
| Granulometric Subgroup | loamy sand | loamy sand | sand | sand | sand | sand |
| Symbol | LS | LS | S | S | S | S |
| Cultivated Plant Species | Fertilizer | Dose | Fertilization Date |
|---|---|---|---|
| Zea mays | Cattle manure | 30 tons ha−1 | pre-sowing |
| Polyphosphate 6 | 200 kg ha−1 | sowing fertilization | |
| Triticosecale | Cattle liquid manure | 26 thousand dm3 ha−1 | pre-sowing |
| Fertilizer | Chemical Composition, % |
|---|---|
| Cattle manure | N—0.50; P—0.13; K—0.57; Ca—0.11; Mg—0.36 |
| Cattle liquid manure | N—0.34; P—0.09; K—0.31; Ca—0.15; Mg—0.08 |
| Polyphosphate 6 | N—6.0; P—8.73; K—25.0; S—2.8 |
| Enzyme | Reaction Product | Wavelength (nm) | Unit | Literature |
|---|---|---|---|---|
| Dehydrogenases | triphenyl formazan (TFF) | 485 | µmol | [69] |
| Catalase | O2 | - | mol | [70] |
| Urease | N-NH4 | 410 | mmol | |
| Acid phosphatase | 4–nitrophenol (PN) | 410 | mmol | |
| Alkaline phosphatase | 4–nitrophenol (PN) | 410 | mmol | [71] |
| β-glucosidase | 4–nitrophenol (PN) | 400 | mmol | |
| Arylsulfatase | 4–nitrophenol (PN) | 420 | mmol |
| Depth | Properties | |||||||
|---|---|---|---|---|---|---|---|---|
| pH | HAC | EBC | CEC | BS | NTotal | Corg | C:N | |
| mM (+) kg−1 dm | % | g kg−1 dm | ||||||
| Zea mays | ||||||||
| 1 | 4.033 c | 40.125 d | 21.000 c | 61.125 d | 34.356 c | 1.490 b | 10.950 b | 7.349 b |
| 2 | 4.167 c | 25.125 e | 10.000 d | 35.125 e | 28.470 c | 0.640 c | 2.070 c | 3.235 c |
| 3 | 4.367 bc | 18.750 f | 8.000 d | 26.750 f | 29.907 c | 0.458 d | 0.957 d | 2.088 d |
| Triticosecale | ||||||||
| 1 | 4.733 b | 55.875 a | 94.00 a | 149.875 a | 62.719 a | 2.410 a | 21.370 a | 8.874 a |
| 2 | 5.283 a | 49.125 b | 35.00 b | 84.125 b | 41.605 b | 0.460 d | 0.630 de | 1.370 e |
| 3 | 5.483 a | 46.875 c | 24.00 c | 70.875 c | 33.862 c | 0.598 c | 0.359 e | 0.600 f |
| Variable | Depth | Org | CDOrg | EPOrg | Fun | CDFun | EPFun | Deh | Ure | AcP | AlP | Cat | Aryl | Glu | BA | pH | HAC | EBC | CEC | BS | NTotal | Corg |
|---|---|---|---|---|---|---|---|---|---|---|---|---|---|---|---|---|---|---|---|---|---|---|
| Depth | 1.000 | −0.856 | −0.898 | 0.452 | −0.652 | −0.504 | −0.281 | −0.881 | −0.703 | −0.815 | −0.778 | −0.898 | −0.743 | −0.851 | −0.839 | 0.405 | −0.468 | −0.581 | −0.575 | −0.585 | −0.807 | −0.814 |
| Org | −0.856 | 1.000 | 0.749 | −0.208 | 0.765 | 0.539 | 0.266 | 0.961 | 0.679 | 0.898 | 0.820 | 0.844 | 0.759 | 0.922 | 0.902 | −0.354 | 0.488 | 0.569 | 0.573 | 0.553 | 0.898 | 0.881 |
| CDOrg | −0.898 | 0.749 | 1.000 | −0.288 | 0.514 | 0.547 | 0.380 | 0.860 | 0.727 | 0.821 | 0.789 | 0.830 | 0.779 | 0.836 | 0.839 | −0.444 | 0.332 | 0.617 | 0.556 | 0.652 | 0.778 | 0.818 |
| EPOrg | 0.452 | −0.208 | −0.288 | 1.000 | 0.267 | 0.398 | −0.340 | −0.326 | −0.698 | −0.403 | −0.539 | −0.366 | −0.578 | −0.380 | −0.441 | −0.438 | −0.750 | −0.734 | −0.778 | −0.713 | −0.439 | −0.427 |
| Fun | −0.652 | 0.765 | 0.514 | 0.267 | 1.000 | 0.667 | −0.240 | 0.611 | 0.090 | 0.433 | 0.280 | 0.533 | 0.189 | 0.497 | 0.442 | −0.587 | 0.061 | −0.065 | −0.027 | −0.062 | 0.420 | 0.404 |
| CDFun | −0.504 | 0.539 | 0.547 | 0.398 | 0.667 | 1.000 | 0.364 | 0.473 | 0.038 | 0.440 | 0.299 | 0.677 | 0.242 | 0.501 | 0.395 | −0.971 | −0.452 | −0.088 | −0.212 | −0.096 | 0.421 | 0.445 |
| EPFun | −0.281 | 0.266 | 0.380 | −0.340 | −0.240 | 0.364 | 1.000 | 0.396 | 0.565 | 0.595 | 0.640 | 0.627 | 0.669 | 0.577 | 0.542 | −0.287 | −0.002 | 0.592 | 0.428 | 0.552 | 0.611 | 0.634 |
| Deh | −0.881 | 0.961 | 0.860 | −0.326 | 0.611 | 0.473 | 0.396 | 1.000 | 0.830 | 0.970 | 0.927 | 0.872 | 0.890 | 0.977 | 0.979 | −0.283 | 0.556 | 0.736 | 0.715 | 0.734 | 0.958 | 0.958 |
| Ure | −0.703 | 0.679 | 0.727 | −0.698 | 0.090 | 0.038 | 0.565 | 0.830 | 1.000 | 0.894 | 0.957 | 0.705 | 0.975 | 0.862 | 0.913 | 0.136 | 0.762 | 0.986 | 0.964 | 0.985 | 0.892 | 0.898 |
| AcP | −0.815 | 0.898 | 0.821 | −0.403 | 0.433 | 0.440 | 0.595 | 0.970 | 0.894 | 1.000 | 0.983 | 0.891 | 0.961 | 0.996 | 0.996 | −0.247 | 0.538 | 0.829 | 0.776 | 0.816 | 0.996 | 0.998 |
| AlP | −0.778 | 0.820 | 0.789 | −0.539 | 0.280 | 0.299 | 0.640 | 0.927 | 0.957 | 0.983 | 1.000 | 0.849 | 0.995 | 0.967 | 0.984 | −0.111 | 0.621 | 0.915 | 0.866 | 0.902 | 0.982 | 0.986 |
| Cat | −0.898 | 0.844 | 0.830 | −0.366 | 0.533 | 0.677 | 0.627 | 0.872 | 0.705 | 0.891 | 0.849 | 1.000 | 0.816 | 0.923 | 0.877 | −0.560 | 0.271 | 0.607 | 0.528 | 0.583 | 0.897 | 0.905 |
| Aryl | −0.743 | 0.759 | 0.779 | −0.578 | 0.189 | 0.242 | 0.669 | 0.890 | 0.975 | 0.961 | 0.995 | 0.816 | 1.000 | 0.939 | 0.964 | −0.061 | 0.627 | 0.944 | 0.889 | 0.935 | 0.958 | 0.967 |
| Glu | −0.851 | 0.922 | 0.836 | −0.380 | 0.497 | 0.501 | 0.577 | 0.977 | 0.862 | 0.996 | 0.967 | 0.923 | 0.939 | 1.000 | 0.991 | −0.315 | 0.501 | 0.784 | 0.732 | 0.770 | 0.993 | 0.995 |
| BA | −0.839 | 0.902 | 0.839 | −0.441 | 0.442 | 0.395 | 0.542 | 0.979 | 0.913 | 0.996 | 0.984 | 0.877 | 0.964 | 0.991 | 1.000 | −0.202 | 0.593 | 0.845 | 0.807 | 0.837 | 0.990 | 0.992 |
| pH | 0.405 | −0.354 | −0.444 | −0.438 | −0.587 | −0.971 | −0.287 | −0.283 | 0.136 | −0.247 | −0.111 | −0.560 | −0.061 | −0.315 | −0.202 | 1.000 | 0.600 | 0.258 | 0.384 | 0.262 | −0.227 | −0.257 |
| HAC | −0.468 | 0.488 | 0.332 | −0.750 | 0.061 | −0.452 | −0.002 | 0.556 | 0.762 | 0.538 | 0.621 | 0.271 | 0.627 | 0.501 | 0.593 | 0.600 | 1.000 | 0.774 | 0.889 | 0.772 | 0.554 | 0.523 |
| EBC | −0.581 | 0.569 | 0.617 | −0.734 | −0.065 | −0.088 | 0.592 | 0.736 | 0.986 | 0.829 | 0.915 | 0.607 | 0.944 | 0.784 | 0.845 | 0.258 | 0.774 | 1.000 | 0.978 | 0.995 | 0.831 | 0.835 |
| CEC | −0.575 | 0.573 | 0.556 | −0.778 | −0.027 | −0.212 | 0.428 | 0.715 | 0.964 | 0.776 | 0.866 | 0.528 | 0.889 | 0.732 | 0.807 | 0.384 | 0.889 | 0.978 | 1.000 | 0.974 | 0.784 | 0.776 |
| BS | −0.585 | 0.553 | 0.652 | −0.713 | −0.062 | −0.096 | 0.552 | 0.734 | 0.985 | 0.816 | 0.902 | 0.583 | 0.935 | 0.770 | 0.837 | 0.262 | 0.772 | 0.995 | 0.974 | 1.000 | 0.809 | 0.820 |
| NTotal | −0.807 | 0.898 | 0.778 | −0.439 | 0.420 | 0.421 | 0.611 | 0.958 | 0.892 | 0.996 | 0.982 | 0.897 | 0.958 | 0.993 | 0.990 | −0.227 | 0.554 | 0.831 | 0.784 | 0.809 | 1.000 | 0.996 |
| Corg | −0.814 | 0.881 | 0.818 | −0.427 | 0.404 | 0.445 | 0.634 | 0.958 | 0.898 | 0.998 | 0.986 | 0.905 | 0.967 | 0.995 | 0.992 | −0.257 | 0.523 | 0.835 | 0.776 | 0.820 | 0.996 | 1.000 |
Disclaimer/Publisher’s Note: The statements, opinions and data contained in all publications are solely those of the individual author(s) and contributor(s) and not of MDPI and/or the editor(s). MDPI and/or the editor(s) disclaim responsibility for any injury to people or property resulting from any ideas, methods, instructions or products referred to in the content. |
© 2024 by the authors. Licensee MDPI, Basel, Switzerland. This article is an open access article distributed under the terms and conditions of the Creative Commons Attribution (CC BY) license (https://creativecommons.org/licenses/by/4.0/).
Share and Cite
Komorek, D.; Wyszkowska, J.; Borowik, A.; Zaborowska, M. Microbial Activity and Diversity in Soil Sown with Zea mays and Triticosecale. Agriculture 2024, 14, 1070. https://doi.org/10.3390/agriculture14071070
Komorek D, Wyszkowska J, Borowik A, Zaborowska M. Microbial Activity and Diversity in Soil Sown with Zea mays and Triticosecale. Agriculture. 2024; 14(7):1070. https://doi.org/10.3390/agriculture14071070
Chicago/Turabian StyleKomorek, Dominika, Jadwiga Wyszkowska, Agata Borowik, and Magdalena Zaborowska. 2024. "Microbial Activity and Diversity in Soil Sown with Zea mays and Triticosecale" Agriculture 14, no. 7: 1070. https://doi.org/10.3390/agriculture14071070