Article

Insights into the Impact of Irrigation Agriculture on the Economy of the Limpopo Province, South Africa: A Social Accounting Matrix Multiplier Analysis

Department of Agricultural Economics, University of the Free State, Bloemfontein 9300, South Africa
*
Author to whom correspondence should be addressed.
Agriculture 2024, 14(7), 1086; https://doi.org/10.3390/agriculture14071086
Submission received: 10 April 2024 / Revised: 15 June 2024 / Accepted: 3 July 2024 / Published: 5 July 2024
(This article belongs to the Section Agricultural Economics, Policies and Rural Management)

Abstract

:
The development of irrigation systems is strategically used to improve food security and achieve the Sustainable Development Goals (SDGs 2) of ending hunger and poverty. The objective of this research was to evaluate the effect of irrigation agriculture on the economy of the Limpopo Province, South Africa. This study used the 2017 national social accounting matrix (SAM) as a database with detailed information on irrigation and rainfed agricultural activities and land accounts to compute the effect of exogenous shock on output, income, land, and value added using SAM multiplier analysis. The findings showed that output multiplier effects were more significant for rainfed agriculture compared to irrigation agriculture. However, irrigation agriculture had the highest institutional income, land return, and value-added multiplier compared to rainfed agriculture. The type of crop did not influence the findings, with irrigation consuming more input per unit of output. We conclude that investing in irrigation agriculture and increasing the efficiency and sustainability of existing irrigation agriculture in Limpopo is significant and profitable because dry land production is hazardous when there is insufficient rainfall or recurrent drought.

1. Introduction

The agricultural sector supports approximately 60–80% of the population in developing countries and is a major contributor to national income and economic growth [1]. In developing areas, approximately 183 million hectares of agricultural land are under some form of water management and storage infrastructure. Therefore, water storage infrastructure is essential for managing changes in rainfall [2]. In many regions, agricultural production is rainfed, which is often insufficient and unreliable. As water is crucial in agricultural production, the sector is a major user of water resources. Improving irrigation efficiency is crucial to ensure that food is produced with limited water.
In many countries, irrigation development is a primary strategy to achieve or improve food security and attain the Sustainable Development Goals (SDGs 2) of ending hunger and poverty [3,4]. Irrigation enhances agricultural production by increasing agricultural output (yields) and cropping intensities [4]. Rainfed agriculture is an important farming method that relies solely on rainfall for irrigation. It is practiced extensively in regions with little access to supplemental irrigation. Rainfed agriculture is practiced under a variety of soil types and agroclimatic and rainfall conditions. Rainfed agriculture leaves farmers exposed to ill-distributed and limited annual rainfall as well as the occurrence of climatic hazards such as drought and floods. Undulating soil surfaces, practices of extensive agriculture, relatively large field sizes, and low crop yields compound the issue. Irrigation, on the other hand, is the artificial application of water to the soil for crop production. Controlled amounts of water are applied to land to grow crops, landscape plants, and lawns [5,6]. There are different types of irrigation agriculture. Farmers are more resilient when using irrigation than when relying on rainfed practices. Irrigation increases the availability and quality of water in agricultural production compared to rainfed agriculture. Thus, agricultural sustainability and livelihoods for many households are improved [7].
In several regions of South Africa, the distribution of rainfall, which is the primary source of water for food production, is becoming more erratic and insufficient [8]. Therefore, irrigation plays a crucial role in raising productivity in the agricultural sector. According to Baloyi [8], irrigation can enhance agricultural productivity and income. Irrigation can generate jobs in marginalized communities, both directly and indirectly, through the multiplier effect (forward and backward linkages) [9]. Chipfupa [10], Mbusi [11], and Fanadzo et al. [12] reported that the South African government attempted to restore smallholder irrigation, stimulate productivity, and enhance food security and income for households. Despite these efforts, the return on the amount invested in irrigation infrastructure remains low. The irrigation sector continues to rely on the government for maintenance and operational costs for restoring or improving some of the irrigation infrastructure, such as water pumps, canals, pipes, and other agricultural machinery and equipment that are required for irrigation infrastructure. In addition, the government still helps some irrigation schemes with operational cost charges for using water (electricity and water) and the administration of irrigation schemes. This support is due to the limited implementation plans for cost recovery and maintenance and the need for the transfer of management and ownership.
Within agricultural sector policy analyses and strategies, social accounting matrix (SAM)-based models with computable general equilibrium (CGE) and SAM multipliers are applied for policy analyses and to influence policy decisions. Most local and international studies use these applications. Pauw et al. [13] studied agricultural efficiency and welfare in South Africa using a CGE model. The authors found that technological advances in agriculture should not be resisted because of their negative impact on agricultural employment. Pauw et al. [13] showed that the welfare gains from declining prices were too significant, while employment gains in other (growing) sectors were likely to outweigh the loss of agricultural employment. Ferreira et al. [14] used SAM multiplier analysis to examine the role of the agricultural sector in Ghana’s development. The authors highlighted the sectors that should be promoted because they generated the highest increases in output, employment, and economic value added, as well as those with a significant impact on household income generation. Maré and Bahta [15] used a partial equilibrium model to assess the export trade of live sheep in South Africa. They found that with a higher demand for live sheep exports, the prices and economic impact were also higher. Additionally, South Africa lost value-adding opportunities, such as output from abattoirs (hides and skin, offal, head, and consumable internal organs) and employment, when live lambs were exported and slaughtered in destination markets. Bahta et al. [16] used the CGE model to show the role of the agricultural sector in the dissemination of income and economic development in the Free State province. The authors found that the agricultural sector played a significant role in reducing poverty and improving income distribution. However, considering poverty, the results suggested that the manufacturing sector increased income more than other sectors. Taljaard [17] applied CGE and SAM multiplier analysis to study the macroeconomy and irrigation agriculture in the Northern Cape Province of South Africa. The author found that the significant economy-wide impacts resulted from market risks or other exogenous factors influencing local irrigation agriculture, especially in a region where irrigation agriculture played such an important role. Kirsten and Van Zyl [18] used an input–output (I/O) model to assess the economic impact of irrigation development and found that through forward and backward linkages, irrigation agriculture made an essential contribution to the regional economy in the Free State Province of South Africa. Doukkali and Lejar [19] studied the energy costs of the irrigation policy in Morocco and highlighted that the policy, which targeted water-saving techniques, increased the use of subsidized energy. Subsequently, the indirect effects through energy subsidies exceeded the direct impact of agricultural subsidies. Brown [20] used input–output models to evaluate the economic impact of irrigation development in Saskatchewan, Canada, and found that irrigation provided an impetus for economic growth.
Although Brown [20] and Kirsten and Van Zyl [18] studied the impact of irrigation on agriculture, the authors did not include data on irrigated versus rainfed agriculture. Furthermore, the technique applied to the I/O model included a single production account and excluded information on household incomes at the district level. This meant that industries produced different commodities, and some industries produced multiple commodities. Doukkali and Lejar [19] categorized agriculture according to irrigated and rainfed conditions, but did not include detailed disaggregation information for factors and household incomes. Taljaard’s [17] study did not include agricultural activities and land accounts. The study’s scope did not address whether the returns came from rainfed or irrigation agriculture, and the SAM did not consider the types of land and farms used for agricultural production/activities. Therefore, a new composition of the Northern Cape SAM is required to address the issues of agricultural activities. Additionally, a study at the district level is needed, which can be achieved by incorporating multiple production/industry accounts and incorporating land accounts (irrigated and rainfed).
Research generally uses multiplier analysis, input–output models, SAM-based input–output models, and CGE models to analyse the inter-sectoral linkages (multiplier effect) in any economic change in a specific sector, which will have a ripple effect in other sectors of the economy. However, empirical research in irrigated and rainfed agriculture is neglected, and models are limited to a single production account, which excludes detailed information on factors and household incomes at provincial and district levels. Therefore, an explicit understanding of the effect of irrigation agriculture on output, land return, institutional and household incomes, and value added is needed to develop a strategy for irrigation policies that contribute to economic development.
Limpopo is an exciting province to see the relationship between irrigation access and household incomes due to the fact that the government aimed to invest massively in irrigation infrastructure in the regions that are experiencing a shortage of water. Most farmers in the province still cultivate under challenging conditions of water shortages or insufficient irrigation. Taljaard [17] and Hassan [21] showed that many producers compete for limited water resources. Thus, water is not used for basic human needs. However, it is also utilized to support productive economic activities that generate employment and income for the province’s inhabitants. Given the significance of inter-sectoral linkages (multiplier effect) in any economy, changes in a specific sector will have a ripple effect in other sectors of the economy in Limpopo and the rest of South Africa. Therefore, it is imperative to have an explicit understanding of the effect of irrigation agriculture on output, land return, institutional income, and GDP to have a necessary strategy for prioritizing irrigation policies that will contribute to economic development. Questions on the regional and district components of irrigation in Limpopo Province, South Africa, include:
  • What are the economic impacts of irrigation in Limpopo, and how are these impacts diffused on a district/regional basis?
  • How will the future of irrigation development impact the districts/regions within the province?
  • What is the economic impact of irrigation and non-irrigation at the regional level?
Therefore, the study determined whether irrigated agriculture was significant in improving agricultural output and generating better land returns. The effect of irrigation agriculture on the economy of the Limpopo Province in South Africa was evaluated by constructing a 2017 national SAM with detailed information on irrigation and rain-fed agricultural activities and land accounts, and the effect of exogenous shock (irrigation development) on output, land return, institutional (household and enterprise) income, and value added/GDP was computed.
This study plays a role in examining the multiplier effect of irrigation agriculture within the districts of the Limpopo Province of South Africa. It addresses policies for irrigation that will alleviate risk, enhance the financial feasibility of farming, and establish a policy that is effective for water management in regions where irrigation plays a significant role in the economy.

2. Materials and Methods
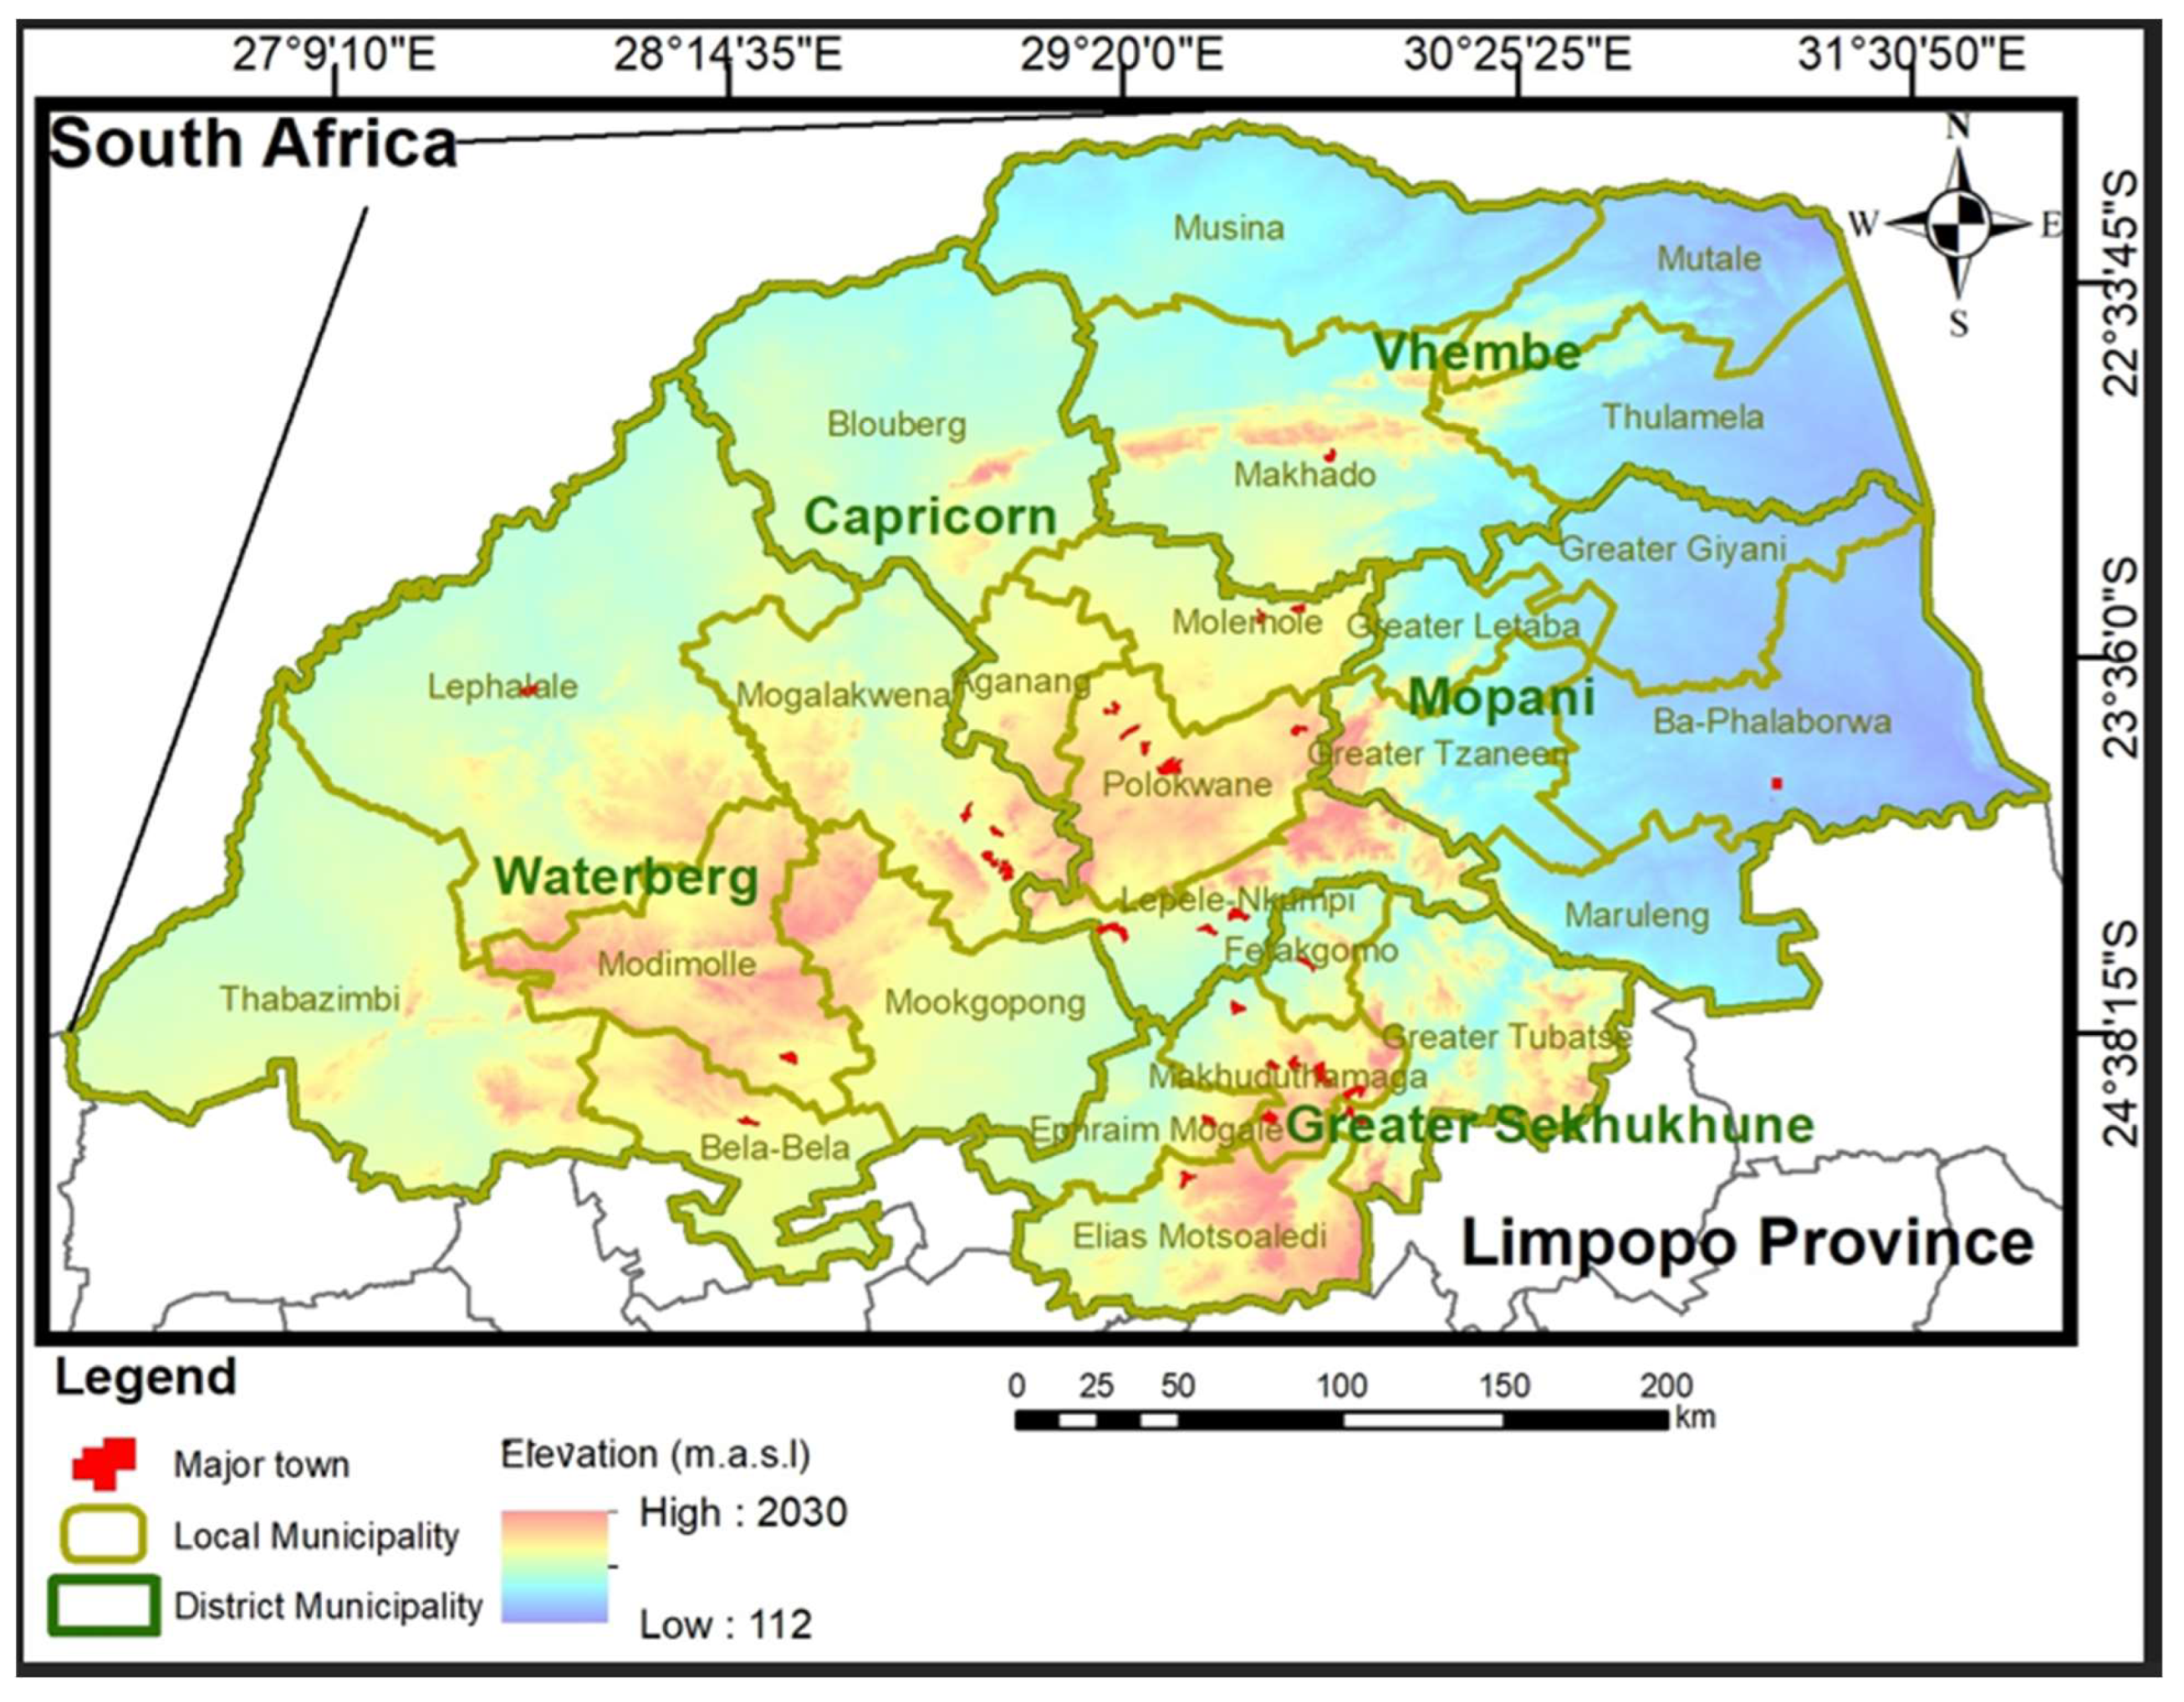
2.1. Study Area

The Limpopo Province of South Africa borders Botswana, Zimbabwe, and Mozambique. The Mopani District of the Limpopo Province is situated in the northeastern part of the province, with an area of 20,011 km2 and a population of 1.1 million (Figure 1). The Vhembe District is in the northern part of the province, with an area of 25,597 km2 and a population of about 1.4 million [22]. The Capricorn District includes the capital city, Polokwane, and has an area of 21,705 km2 and a population of about 1.38 million. The Waterberg District is found on the western side of the province and shares a border with the Sekhukhune and Capricorn districts. The district has the largest area in the province (about 44,913 km2) and the lowest population (estimated at 768 thousand). The last district is Sekhukhune, with the lowest total area (about 13,528 km2) and a population estimated at 1.2 million [22].

2.2. Data

This study used the 2017 national SAM for South Africa with details about regional accounts for agricultural activities and households, as constructed by Ramigo et al. [23] (see Appendix A, Table A1). Agricultural industries were identified by production activities within regions (provinces and districts), meaning each agricultural industry represented all farming activities in the regions, and each farming activity in the regions (provinces and districts) was assumed to be provided with fixed land for production. Two agricultural industries (irrigated and rainfed) were identified per province and district in South Africa. In the context of development, these agricultural industries were of substantial interest to policymakers, politicians, academia, and civil society. Agricultural commodities were identified by the choice of commodities obtained from Statistics South Africa [24]. These commodities were categorized according to the consistent availability of information. The SAM provided sufficient information for the agricultural sector to indicate the essential policies and strategies required for economic growth in South Africa. The agriculture, forestry, and fisheries accounts were then reported individually in a 2017 SAM to show the importance of these sectors in the economy. In addition, the commodities and industries in the economy of South Africa were reported according to Statistics South Africa [25]. The supply unit table (SUT) contained 104 commodities and 62 industries, as reported by Statistics South Africa. There was only a single agriculture, forestry, and fisheries commodities and industries account recorded in the SUT for 2017 (see Appendix A, Table A1).
Both households and labour (factor) categories were disaggregated according to provinces and districts: Eastern Cape, Northwest, Northern Cape, Mpumalanga, Western Cape, Free State, Gauteng, KwaZulu Natal, and Limpopo (Sekhukhune, Capricorn, Vhembe, Mopani, and Waterberg district municipalities). These factors incorporated about 13 labour accounts (Eastern Cape, Northwest, Northern Cape, Mpumalanga, Western Cape, Free State, Gauteng, Kwazulu-Natal, and Limpopo (Sekhukhune, Capricorn, Vhembe, Mopani, and Waterberg district municipalities)), a single capital account, and two land accounts. The land accounts were further disaggregated into irrigation land and dry land. These types of land accounts recorded land returns for each farming activity separately. The land income was captured and then distributed to various households (provinces and districts). Government tax accounts incorporated accounts such as activities (production) taxes, product taxes, direct household taxes, and corporate taxes. Within a SAM, there was an account of general government accounts that received tax revenue and transferred income from different sources of accounts and then transferred it to other accounts. The single international trade accounts represented transactions for exports and imports [25].
The different sources used to build the SAM showed that it may have been unbalanced. This occurred when constructing a database for SAM because of incomplete and inconsistent data sources. Therefore, different methods or techniques such as technique/procedure/algorithm (RAS), cross-entropy, and Excel manual estimation were employed to evaluate the missing data to balance SAM for policy analyses. Robinson et al. [26] and Lamonica et al. [27] stated that different approaches estimated the difference between estimated and prior values in various ways. The authors mentioned that not all approaches clearly estimated the difference; however, for methods that did not, there was always a way to reduce the difference in the estimates. Furthermore, they mentioned two problems found in balancing:
  • When balancing and adjusting the input–output (I/O) tables, certain constraints were known in the rows and columns.
  • Another problem occurred when the constraints for balancing the row and column total in a SAM were not found.
The RAS approach is used in I/O tables when constraints are known, but other approaches, such as cross entropy (CE) and generalised cross entropy (GCE), are applied when constraints are not found. Even though RAS is mostly used for balancing I/O tables, it still finds a place in balancing SAM [26,27]. This application helps in cases where a SAM for a prior period is used with the purpose of adjusting it for a later period, provided new information on row and column totals are used where there is inconsistent information within a SAM. Lamelin et al. [28] pointed out another limitation of the RAS approach: it cannot accommodate information other than those required for row and column totals. The CE is an extension of the RAS approach and provides a clear and robust approach for measuring SAM when working with scattered and inconsistent information.
The advantage of the CE approach is that it produces a reasonable estimate for column coefficients in a SAM and provides the availability of a general algebraic modelling (GAMs) code. This approach assumes the availability of information that is subject to different types of estimation errors, which are not specified for the information being estimated [29]. As part of the measurement process, this approach applies a prior for each piece of information used as well as the characteristics of the estimation errors used to differentiate the estimation errors against estimates.
The original SAMs always had accounts that were not equal in the row and column totals; therefore, manual balancing estimation in Excel was utilized to balance the SAM. To construct a SAM, the initial point was to ensure that all accounts in the macro-SAM were balanced. The next step was disaggregating the macro-SAM into different group classifications for the submatrices. The overall values of the disaggregated submatrices are always unequal to the overall values of the submatrices prior to disaggregation. This means that the accuracy of ensuring the disaggregation of a balanced SAM helps in the estimation of submatrix disaggregation. At this stage, the macro-SAM included households, taxes, agricultural commodities, and industries. The macro-SAM was then disaggregated according to household and taxes to contain complete information.
The next step was to disaggregate the agricultural commodities and industry accounts according to the SUT for 2017 and additional information obtained from the Census of Commercial Agriculture 2017 to ensure consistency within the SAM. Irrigation and rain-fed agriculture were disaggregated according to land returns from farming activities. The process of disaggregation was completed, and the SAM was balanced using an Excel manual. Maré and Bahta [15] and PROVIDE [30] defined a SAM as a transaction that transpired in the economy for one year. This transaction includes receipts and payments in the economy. In addition, a SAM is considered square if the column totals and row totals are equal.

2.3. Method (Multiplier Analysis)

A SAM-based model can use either open or closed models. Only production accounts were considered in the open models for computation of the total requirement matrix. In contrast, in closed models, other accounts, such as households and enterprises, were incorporated into the computation of the total requirement matrix [31]. Government, investment, and exports were considered exogenous accounts. The SAM-based model derived from closed models was larger than that found in open models because of additional consumption linkages (induced effect). The basic open SAM-based model can be derived whereby total output equates to the total demand (Equation (1)).
X = A x + f
where x represents a vector of total output, Ax denotes the sum of endogenous demands, and f represents exogenous demands. The matrix, A, is referred to as the direct requirement matrix. This matrix shows whether the model solution relies on a singular, square, or rectangular matrix. The basic open SAM-based model can be written in this form (Equation (2)):
X = ( I A ) 1 f = L f    
where L represents the total requirement matrix, or Leontief inverse matrix, of the basic open model, which plays a key role in connecting final demand to industry output. In a basic closed model, the model is expanded to incorporate factor and household accounts (Equation (3)):
x ¯ = ( I A ¯ ) 1 f ¯ = L ¯ f ¯
where x ¯ is an augmented output vector, whereas x is an output of industry. The matrix A ¯ is the augmented direct requirement matrix, whereas f ¯ report the augmented final demand, and L denotes the total requirement matrix or inverse matrix of the basic closed models.
In complex SAM-based models, the total activity output (x) and total product output (q) are included in the development of the product-by-activity-based model technique [31]. This technique is applied in two ways: when the number of product accounts exceeds the number of activity accounts, it is known as the non-square product-by-activity system technique. When the number of product accounts equals the number of activities accounts, it is referred to as the square product-by-activity system technique. The SAM dataset in this study had fewer activities than product accounts; therefore, the non-square product-by-activity technique was used in developing the complex SAM-based model.
To identify the relevant model technology assumption, there are two model technologies under the product-by-activity technique, which are known as product-based technology and activity-based technology. Product-based technology refers to products/commodities produced by more than a single industry. These commodities/products have similar input structures irrespective of the activities that produce them. Activity-based technology records all products/commodities produced by an activity assumed to have a similar input structure. The product/commodity-based technology model cannot create a technical coefficient matrix when the number of commodities is greater than the number of activities; however, activity-based technology can generate a technical coefficient matrix. Therefore, the activity-based technology assumption was used in this study as a suitable technology assumption over product-based technology.
Using the product-by-activity SAM-based multiplier model, it is also possible to compute the direct requirements matrix (technical coefficient matrix). Therefore, the product-by-activity submatrix of the direct requirement is (Equation (4)):
B = U x ^ 1                                                       ( t h u s   U = B x ^ )  
where matrix B denotes direct coefficients obtained in the use matrix U and x represents the output of the activity. x ^ 1 denotes the matrix inverse of the diagonal matrix of x. For this reason, matrix B contains the proportions of the product needed to produce a single unit of output per activity.
The information prepared in a make matrix V records all the products supplied by the activities. Equation (5) records total activity output x obtained through summing symbol V in row matrix (transposed to make matrix V   I n   t h e   c o l u m n   s u m ) .
x = V i                                                     ( o r   x = i V )
The total product output q records column sum in the make matrix V (or sum of V   i n   t h e   r o w   m a t r i x ) (Equation (6)):
q = ( V ) i                                                   ( o r   q = i V )
The total product output q is found by summing input uses of each product by all activities (adding row for use matrix U) and the demand for final product e (Equation (7)):
q = U i + e
By applying Equation (4) ( U = B x ^ ) and substituting into Equation (7), an accounting matrix can be extracted, which is equal to total product output q to input uses for Bx and final demand e (Equation (8)):
q = B x + e
Equation (8) has a problem of creating a total requirements matrix, which is similar to the inverse Leontief matrix for the ordinary input–output (I/O) model ( x = ( I A ) 1 f ) because Equation (5) capturing output (x) of the activity on the one side (right) and output (q) of the product on the other side (left). The only way to resolve the issue is to change the product dimension into the activity dimension. The information needed to change this dimension is found in the make matrix (V), which shows the activity-by-product matrix. The proportion of the product output in the matrix D records the overall product output q obtained by each activity (i.e., column proportions of the make matrix V) (Equation (9)):
D = V q ^ 1                                                 t h u s   ( D q ^ = V )   o r   ( D q = V i )  
For this reason, matrix D reports the activity sources of product outputs, which are represented by shares of the market matrix. Activity technology models are applied similarly to this paper. Replacing Equation (5) with Equation (9), we find the following (Equation (10)):
D q = x                                               t h u s   ( q = D 1 x )
It clearly shows a linear transformation from activity output x to product output q, x is substituted for Dq (according to Equation (10)) in Equation (8). Equation (11) reports the same matrix as Equation (8):
q = B D q + e
Equation (11) has production dimensions; therefore, it can be applied according to a matrix of the total requirements, which is similar to a matrix for a simple Leontief inverse in the I/O model. Thus, rearranging Equation (11) can drive Equation (12):
e = q B D q e = q ( I B D ) q = ( I B D ) 1 e
where ( I B D ) 1 represents the product-by-product total requirements matrix for the SAM model. Equation (12) translates product demand e to product output q through product-by-product (P-by-P) total requirements matrix ( I B D ) 1 .
Equation (12) can be changed from a product output q equation to an activity output x equation by substituting q for D 1 x (from Equation (10)) into Equation (12) and rearranging to get Equation (13):
D 1 x = ( I B D ) 1 e x = D ( 1 B D ) 1 e
where D ( I B D ) 1 is the activity-by-product total requirements matrix for the SAM model. Equation (13) translates product demand e into activity output x through the A-by-P total requirements matrix D ( 1 B D ) 1 .
The models in Equations (12) and (13) are known as product demand–driven models [31]. However, there is an activity demand–driven model. These models assume demand for activity output (as opposed to product output) expands as an initial shock.
For this reason, the role is to change the identity of a product dimension into that of an activity dimension. Starting again from the identity accounting in Equation (13) and pre-multiplying both sides by D and rearranging yields Equation (14):
D q = D ( B x + e ) D q = D B x + D e
Because D q = x , then substitute   D q for x and rearrange to obtain Equation (14), where Equation (15) is an identity for the activity dimensions, that is, equating total output activity output x to intermediate input use per industry DBx and final output demand De (Equation (15)):
x = D B x + D e
DB indicates the required inputs from activities per unit of activities output x. Its dimensions are activity-by-activity (A-by-A). Equation (15) comprises the activity dimension; hence, this equation is utilized to attain a total requirements matrix similar to the Leontief matrix for the simple I/O model. Therefore, by rearranging Equations (15) and (16) can be derived:
D e = x D B x D e = x ( 1 D B ) x = 1 D B 1 D e
where ( I D B ) 1 is an activity-by-activity total requirements matrix for the SAM model. Equation (16) translates activity final demand De into activity output x through the A-by-A total requirements matrix ( 1 D B ) 1 .
Miller and Blair [31] discussed that the simple I/O model includes a single total requirements matrix (the Leontief inverse matrix (I-A)−1); however, more than four total requirements matrices can be obtained from a product-by-activity SAM, as indicated in Table 1. Only three sub-matrices in the activity technology were presented in this study and were more significant than the eight submatrices shown in Table 1. The submatrices obtained in the product technology could not be presented for the results in this study because they generated negative results, and the only possible way was to convert them to a supply-driven model (Table 1). This negative result was caused by a number of different factors: some of the products were produced by different technologies, which caused the products’ technology assumption to be invalid; production classifications were different; and the use and supply data had discrepancies in measurements. Therefore, activity technology was selected for this study because it produced non-negative results. In addition, the activity-by-activity (A-by-A) total requirement matrix was used to compute the multiplier analysis. The activity-by-product (A-by-P) total requirements matrix was used to simulate a 20% increase in the demand for irrigation investment infrastructure on output, institutional incomes, and value added.

3. Results

3.1. SAM Multiplier Analysis

The SAM multiplier allows the quantification of the different ways in which the exogenous effect is shared across the economy. Therefore, multiplier analysis also reports the results of an exogenous shock on the dissemination of sectoral output, land, and institutional income. The SAM multiplier analysis records information on the impact of changes in final demand output, land, value added/GDP, and institutional (households and enterprises) incomes within the economy. These multipliers are significant in terms of evaluating the effect in the economy of changing the elements that are exogenous to the model of the economy, which can be obtained from the elements of the total requirement matrix. Therefore, the output, land, value-added, and income multipliers are computed using the SAM total requirement matrix based on the industry-by-industry (activity-by-activity) total requirement matrix (Leontief inverse matrix).

3.1.1. Output Multipliers

Table 2 shows that the output multiplier effects are most significant for rainfed agriculture (R0F (R- Rand (South African Currency- IUSD = 13.3055 ZAR), Average exchange rate in 2017: 13.3055 ZAR (South African Rand (ZAR)) 2.42 million) compared to irrigation agriculture (R 2.02 million) in the Limpopo Province. The Sekhukhune District of the Limpopo Province had the highest output multiplier effect for irrigation agriculture, followed by the Waterberg, Vhembe, Mopani, and Capricorn districts. This implies that an R1 million injection in the Sekhukhune irrigation agricultural industry leads to an R2.27 million output increase in the economy. In contrast, an R2.15 million output increase occurs when an injection occurs in the Waterberg irrigation agricultural industry. At the provincial level, the Northern Cape, Limpopo, and Mpumalanga provinces of South Africa had the most significant output multiplier effects for irrigation agriculture compared with other provinces (Western Cape, Eastern Cape, Free State, Kwazulu-Natal, Northwest, and Gauteng).

3.1.2. Value-Added Multipliers

Table 2 summarizes the value-added multipliers for the regional economy of South Africa. Irrigation agriculture had a higher value-added multiplier in all the districts of Limpopo compared to rainfed agriculture. This is reasonable irrespective of the type of crops that are produced in Limpopo, and irrigation consumes more inputs per unit of output. The findings can be interpreted as a R1 million increase in demand for output from irrigation agriculture in the Mopani District; the value added in the economy increases by R1.31 million. R1.29 million increases in value added to the economy when injection occurs in the Vhembe and Capricorn districts’ irrigation agriculture industry. The Waterberg District’s irrigation agriculture had the lowest value-added multiplier, with an increase of R1.23 million.

3.1.3. Institutional Income Multipliers

A summary of the results of the institutional income multiplier for the regional economy of South Africa is presented. Table 2 shows that irrigation agriculture has a higher institutional income than rainfed agriculture. A R1 million injection into the Capricorn District’s irrigation agricultural industry led to an R1.470 million income increase in the economy. Most of the institutional incomes in the Limpopo Province come from the Capricorn irrigation agricultural industry, followed by Mopani (an increase of R1.446 million), Vhembe (an increase of R1.444 million), Waterberg (an increase of R1.357 million), and Sekhukhune (an increase of R1.340 million).
The Mpumalanga irrigation agricultural industry had the most significant institutional income (R1.616 million) multiplier effect compared to other provinces. This was followed by KwaZulu-Natal (an increase of R1.460 million), Western Cape (an increase of R1.440 million), North West (an increase of R1.416 million), Eastern Cape (an increase of R1.427 million), Limpopo (an increase of R1.411 million), Free State and Gauteng (both increasing by R1.387 million), and, lastly, Northern Cape (an increase of R1.299 million).

3.1.4. Land Return/Multipliers

Land is one of the key assets in South Africa in both the agricultural and non-agricultural sectors. Land multipliers measure the value of returns from production activities in South Africa. Land multipliers indicate the value of land for every R1 million injected in production for a particular activity. The results in Table 3 show that for every R1 million injected in the Mopani District of the Limpopo Province of South Africa for irrigation agricultural production, the total return values of agricultural land were worth R6,580. Of this particular total return value of land, the highest returns went to irrigated land, with R5,820, followed by Capricorn irrigated land with a return value of R5,950. For every R1 million injected into the Vhembe and Waterberg irrigated lands, the return values of agricultural land were worth R5,140 and R4,720, respectively. In the case of the province, Northern Cape had the highest land return, worth R111,040 for every R1 million injected into the irrigation agricultural industry, followed by Eastern Cape (R58,000), Western Cape (R11,500), Free State (R6,750), Limpopo (R6,260), and Mpumalanga, which had the lowest land return (R2,420) generated in the economy. Regarding dry land, the Free State had the highest values of R14,900 in the economy, whereas the Limpopo Province had a land return worth about R6,800. The value of irrigated land is greater than that of dry land in all provinces.

3.1.5. Households’ Income Multipliers

This section presents the income earned by households in different districts of Limpopo in South Africa. Therefore, Table 4 shows that the income multiplier effect for irrigation agriculture was higher than that for rainfed agriculture. The Vhembe District had a high household income for the irrigation agriculture industry, with an increase of R352,100, followed by Sekhukhune (an increase of R322,400), Waterberg (an increase of R31,510), Capricorn (an increase of R300,300), and the Mopani District, which had the lowest incomes (an increase of R298,400). Capricorn has the highest household income earned from the agricultural irrigation industry in all provinces within the economy.
In the case of rainfed agriculture, Mopani households had the highest income increase (R191,700), followed by Waterberg (R180,500), Vhembe (R123,400), Capricorn (R89,100), and Sekhukhune household incomes (R73,900).
Capital household income increased by R0.0144 million in the economy when demand for commodities from the mining of coal and lignite increased by R1 million. While Sekhukhune household incomes increased by R0.0724 million in the economy, the demand for commodities from the metal ore mining industry increased by R1 million. On the other hand, the food, beverage, and tobacco industries were the most significant in Capricorn, with a household income of R0.0137 million, increasing the economy.

4. Discussion

The study determined whether irrigated agriculture was significant in improving agricultural output and generated better land returns. The effect of irrigation agriculture on the economy of district municipalities and provinces of South Africa showed mixed results for irrigated and rain-fed agriculture. Multiplier analysis included output, value added, institutional income, land, and household income. The output multipliers indicated that rainfed agriculture was higher than irrigation agriculture in the Limpopo Province. At the district level, Sekhukhune in the Limpopo Province had the highest output multiplier effect for irrigation agriculture compared to other districts. This implies that investment in irrigation agriculture can lead to the enhancement of output in the economy at provincial and district levels. This finding is in line with a study by Mapuso et al. [32], which found that access to irrigation enhances agricultural output (yield).
At the provincial level, the Northern Cape, Limpopo, and Mpumalanga provinces of South Africa had the largest output multiplier effect for irrigation agriculture compared with other provinces. As indicated by Ramigo [33], agricultural production is rainfed in Limpopo due to insufficient and unreliable rainfall in most regions, and water is the most crucial factor hindering agricultural production, which uses most of the water. To achieve development in most parts of Limpopo, more focus should be placed on the water and finance industries because of the large output multiplier. Investing in rainfed agriculture is as significant for profitability as investing in irrigation agriculture. Although irrigation plays an essential role in other provinces, agricultural policies should be balanced to incorporate rainfed agriculture. This finding is similar to research by Taljaard [17], who found irrigation to be significant in the economy of the Northern Cape because the province is mostly desert, and many farmers rely on irrigation to increase yield. A R1 million injection in the Northern Cape irrigation agricultural industry led to an R2.35 million output increase in the economy, followed by Mpumalanga and Limpopo, with output increases of R2.04 million and R2.03 million, respectively. The multiplier output in this study was higher for irrigation agriculture compared to the multiplier output obtained by Kirsten and Van Zyl [18], but lower than the results of Taljaard [17]. They found that irrigation agriculture plays a vital role in increasing yield because of the contribution generated by intermediate sectors and households in the regions.
The value-added multipliers of irrigation agriculture had the highest value-added multipliers in all districts of the Limpopo Province of South Africa compared with rainfed agriculture. At the provincial level, irrigation agriculture in the Mpumalanga Province had the most significant value added compared to other provinces of South Africa. The policy implication of this is that irrespective of the type of crop produced, irrigation consumes more inputs per unit of output. This finding contradicts that of Doukkali and Lejar [19], who found that rainfed agriculture had a higher value added than irrigation agriculture. Additionally, they explained that considering the multiplier effects of agriculture, investment in rainfed agriculture would be more profitable for the Moroccan economy. Moreover, irrigated agriculture increases the energy import bill and energy dependency in the country. This study’s findings are consistent with those of Taljaard [17], who found that the Northern Cape had a higher value added for irrigation agriculture compared to other provinces, but a lower value added than in this study.
Irrigation agriculture had higher institutional incomes than rainfed agriculture, ranging from R1.357 million to R1.470 million, as a result of a R1 million injection in Limpopo district municipalities. At the provincial level, the Mpumalanga irrigation agricultural industry had the most significant institutional income (R1.616 million) multiplier effect compared to other provinces, which ranged from R1.299 million (Northern Cape) to R1.460 million (KwaZulu-Natal). As pointed out by Baloyi [8], irrigation can increase income; it further preserves the national agricultural sector against changes in weather, stabilizes economic growth, and alleviates poverty. Brown [20] highlighted that irrigation agriculture plays a more significant role than rain-fed agriculture in the regional economy through income generation. These findings indicate the effect of income generated from irrigated agriculture and its potential to be significantly higher than that generated from rainfed agriculture. The results of this study were much higher than those obtained by Phoofolo [34].
Land multipliers measure the value of returns from production activities in South Africa. Land multipliers indicate the importance of land for every R1 million injected into production for a particular activity. At the Limpopo district municipality and provincial levels, the land multiplier/land return values of agricultural land vary from R2 420 to R14 900. This implies that the value of irrigated land is greater than that of dry land in all provinces of South Africa. As mentioned by Cousin [35], irrigation farming is a priority in South Africa, as dryland crop production is hazardous because of inadequate rainfall and recurrent agricultural droughts. Easing poverty and enhancing food security in marginalized areas are the main reasons for initiating irrigation in the country.
The household income multiplier effect for irrigation agriculture was higher than that for rain-fed agriculture. The Vhembe District had the highest share of household income for the irrigation agriculture industry, with an increase of R352 100, compared to other districts in the Limpopo Province. As mentioned by Brown [20], irrigation agriculture plays a more significant role than rain-fed agriculture in the regional economy through income generation. These findings indicate the effect of income generated from irrigated agriculture and its potential to be significantly higher than that generated from rainfed agriculture. Doukkali and Lejars [19] pointed out that even though irrigation is a crucial component in stimulating income for households, it is also beneficial for policy to be more balanced in favour of rainfed agriculture to create income for households. Even if irrigation can secure part of the agricultural production, rainfed agriculture also has a high potential to contribute to food security and poverty alleviation. However, in rainfed agriculture, the Mopani District’s households had the highest income increase (R191 700) compared to other districts in the Limpopo Province. As stated by Ramigo [33], agricultural production is rainfed in Limpopo because of insufficient and unreliable rainfall. Therefore, this sector is still significant in generating more household income for farmers who depend on rainfed agriculture, and investment in this sector could play a significant role in income generation.

5. Conclusions

This research evaluated the effect of irrigation agriculture on the economy of the Limpopo Province of South Africa. Empirical studies related to irrigated and rainfed agriculture are neglected, and models are limited to single production accounts and exclude detailed information on household income at provincial and district levels. Therefore, this empirical study assessed the effect of irrigation agriculture on output, land return, institutional and household incomes, and value added to have a necessary strategy for prioritizing irrigation policies, which contribute to economic development.
This study used a 2017 national social accounting matrix (SAM) with detailed information on irrigation and rainfed agricultural activities and land accounts to compute the effect of exogenous shock (irrigation development) on output, income, land, and value added. The findings showed that the output multiplier effects were more significant for rainfed agriculture (R2.42 million) than for irrigation agriculture (R 2.02 million) in the Limpopo Province of South Africa. Agricultural production is rainfed in Limpopo, with insufficient and unreliable rainfall in most of the municipalities of the provinces. Furthermore, farmers in the province rely on rain, surface water, and groundwater for agriculture, and water is the most crucial factor hindering production in a sector that uses most of the water. The Sekhukhune District of the Limpopo Province had the highest output multiplier effect for irrigation agriculture compared to the other districts.
Irrigation agriculture had the highest land return (R6580), value added (R1.31 million), and institutional income (R1.470 million) multiplier compared with rainfed agriculture in the regional economy of South Africa. This is reasonable irrespective of the type of crop that is produced, and irrigation consumes more input per unit of output. To achieve development in most regions in South Africa, more focus should be placed on the water and finance industries due to the significant contribution (the large multiplier).
The findings imply that innovative technology practices will improve water efficiency and increase the financial advantage of farmers while minimizing environmental burdens. Investing in irrigation agriculture and increasing the efficiency and sustainability of existing irrigation agriculture in the districts of Limpopo play a significant economic role and are profitable because dry land agricultural production is hazardous because of insufficient rainfall and recurrent drought. Investing in rainfed agriculture is important for profitability when investing in irrigation agriculture. Even though irrigation plays a massive role in other regions of the province, agricultural policies should incorporate rainfed agriculture. Therefore, the government should assist in educating farmers to implement different irrigation strategies, such as deficit irrigation, irrigation scheduling, crop water use, and mulching, as irrigation strategies improve food security.
The results of this study are limited to the range of irrigated and rainfed agricultural industries, income, land, output, and value added. Furthermore, the data did not display racial or gender group classifications for households. The data could not identify the types of irrigation systems used for agricultural production in the regions of South Africa. Detailed data on the agricultural sector at the regional level in South Africa are difficult to find and are often based on the period of agricultural surveys and the detailed information mentioned in the surveys. It is challenging to obtain all the information required to construct a SAM. Most datasets for SAMs are used by the public sector, private sector, researchers, academia, and policymakers for a period of five to ten years. Therefore, this study is relevant in the current period.
The findings may not be applicable to other South African provinces due to regional variations in climate, resources, and agricultural practices. The environmental impact of irrigation, particularly water scarcity, is not explicitly addressed in terms of sustainability concerns. The study emphasizes innovative technologies without acknowledging potential limitations in access or affordability for farmers lacking technology. The sole focus on profitability might overlook broader social or environmental considerations. Water scarcity was the most limiting factor due to climate change. However, an improvement in water availability is required through the implementation of technologies to improve water management for sustainable agricultural production.
Future research should consider disaggregating agriculture according to different crops to evaluate the economic impact of irrigation and rainfall at the regional level. The data should display racial and gender group classifications of households. The SAM did not include all districts in South Africa; therefore, researchers, academia, and stakeholders must consider focusing on other districts and possibly adding other accounts (sectors) from local municipalities. Further research is needed to compare the long-term economic, social, and environmental impacts of irrigation and rainfed agriculture in Limpopo by extending the SAM model to capture the environmental impact of irrigation on water resources and assessing the social equity implications of irrigation, including access to water and land for small scale farmers.

Author Contributions

All authors significantly contributed to the preparation of the present manuscript. R.P. was involved in the construction of the SAM, analysis, and writing the first draft. Y.T.B. was R.P.’s main supervisor and aided in the study’s design and conceptualization, review, and writing the final draft. H.J. was R.P.’s co-supervisor and assisted in the study’s design and conceptualization, review, and writing the final draft. All authors have read and agreed to the published version of the manuscript.

Funding

This research received no external funding.

Data Availability Statement

Detailed data will be available on request from the corresponding author (Y.T.B.).

Conflicts of Interest

The authors declare no conflicts of interest.

Appendix A

Table A1. A: Accounts in the national SAM for South Africa.
IndustriesCommoditiesTransactionCapitalLandEnterprisesHouseholds
Irrigation Agric WCAgriculture TransactionCapitalIrrigated landEnterprisesWestern Cape households
Rainfed Agric WCLive animal Dryland Eastern Cape households
Irrigation Agric ECForestry Northern Cape households
Rainfed Agric ECFishing Free State households
Irrigation Agric NCCoal and lignite Kwazulu-Natal households
Rainfed Agric NCMetal ores Northwest households
Irrigation Agric FSOther minerals Gauteng households
Rainfed Agric FSElectricity and gas Mpumalanga households
Irrigation Agric KZNNatural water Mopani households
Rainfed Agric KZNMeat Vhembe households
Irrigation Agric NWFish Capricorn households
Rainfed Agric NWVegetables Waterberg households
Irrigation Agric GPFruit and nuts Sekhukhune households
Rainfed Agric GPOils and fats
Irrigation Agric MPDairy products
Rainfed Agric MPGrain mill products
Irrigation Agric MopaniStarches products
Rainfed Agric MopaniAnimal feeding
Irrigation Agric VhembeBakery products
Rainfed Agric VhembeSugar
Irrigation Agric CapricornConfectionary products
Rainfed Agric CapricornPasta products
Irrigation Agric WaterbergFood n.e.c.
Rainfed Agric WaterbergAlcohol, beverages
Irrigation Agric SekhukhuneSoft drinks
Rainfed Agric SekhukhuneTobacco products
ForestryTextile fabrics
FishingMade-up textile, articles
Mining of coal and ligniteCarpets
Mining of gold and uranium oreTextile n.e.c.
Mining of metal oresKnitting fabrics
Other mining and quarryingWearing apparel
FoodLeather products
Beverages and tobaccoFootwear
Spinning, weaving, and finishing of textilesWood products
Knitted, crouched fabrics, wearing apparel, fur articlesPaper products
Tanning and dressing of leatherPrinting
FootwearPetroleum products
Sawmilling, planing of wood, cork, strawBasic chemicals
PaperFertilizers, pesticides
Publishing, printing, recorded mediaPaint, related products
Coke ovens, petroleum refineriesPharmaceutical products
Nuclear fuel, basic chemicalsSoap, cleaning, perfume
Other chemical products, man-made fibersChemical products, n.e.c.
RubberRubber tyres
PlasticOther rubber products
GlassPlastic products
Non-metallic mineralsGlass products
Basic iron and steel, casting of metalsNon-structural ceramic
Basic precious and non-ferrous metalsStructure non-refractory clay
Fabricated metal productsPlaster, cement
Machinery and equipmentArticles of concrete
Electrical machinery and apparatusNon-metallic products n.e.c.
Radio, television, communication equipment, and apparatusFurniture
Medical, precision, optical instruments, watches and clocksJewellery
Motor vehicles, trailers, partsManufactured products n.e.c.
Other transport equipmentWastes, scraps
FurnitureIron, steel products
Manufacturing n.e.c, recyclingNon-ferrous metals
Electricity, gas, steam, and hot water supplyStructural metal products
Collection, purification, and distribution of waterTanks, reservoirs
ConstructionOther fabricated metal
Wholesale trade, commission tradeEngines, turbines
Retail tradePumps, compressors
Sale, maintenance, repair of motor vehiclesBearings, gears
Hotels and restaurantsLifting equipment
Land transport, transport via pipelinesGeneral Machinery
Water transportSpecial machinery
Air transportDomestic appliances
Auxiliary transportOffice machinery
Post and telecommunicationElectrical machinery
Financial intermediationRadio, television
Insurance and pension fundingMedical appliances
Activities in financial intermediationMotor vehicles, parts
Real estate activitiesShips and boats
Renting of machinery and equipmentRailway and trams
Computer and related activitiesAircrafts
Research and experimental developmentOther transport equipment
Other business activitiesConstruction
GovernmentConstruction services
EducationTrade services
Health and social workAccommodation
Sewerage and refuse disposal.Catering services
Activities of membership organisationsPassenger transport
Recreational, cultural, and sporting activitiesFreight transport
Other activitiesSupporting transport services
Non-observed, informal, non-profit, households,Postal, courier services
Electricity distribution
Water distribution
Financial services
Insurance, pension
Other financial services
Real estate services
Leasing, Rental services
Research, development
Legal, accounting
Other business services
Telecommunications
Support services
Manufactured services n.e.c.
Public administration
Education services
Health, social services
Other services n.e.c.

References

  1. Hussain, I.; Turral, H.; Molden, D.; Ahmad, M. Measuring and enhancing the value of agricultural water in irrigated river basins. Irrigation Sci. 2007, 25, 263–282. [Google Scholar] [CrossRef]
  2. Peacock, T.; Ward, C.; Gambarelli, G. Investment in Agricultural Water for Poverty Reduction and Economic Growth in Sub-Saharan Africa: Synthesis Report; Collaborative Program of African Development Bank, Food and Agriculture Organization, International Fund for Agricultural Development, International Water Management Institute, and World Bank: Columbo, Sri Lanka, 2007. [Google Scholar]
  3. Turral, H.; Svendsen, M.; Faures, J.M. Investing in irrigation: Reviewing the past and looking to the future. Agri. Water Manag. 2010, 97, 551–560. [Google Scholar] [CrossRef]
  4. Abdullah, K.B. Use of water and land for food security and environmental sustainability. Irrig. Drain. 2006, 55, 219–222. [Google Scholar] [CrossRef]
  5. Singh, M.; Tiwari, N.K.; Kumar, N.; Dabur, K.R.; Dehinwal, A.K. Dry and Rainfed Agriculture- Characteristics and Issues to Enhance the Prosperity of Indian Farming Community. Bull. Env. Pharmacol. Life Sci. 2017, 6, 32–38. [Google Scholar]
  6. Venkatesan, G.; Selvam, M.T.; Swaminathan, G.; Krishnamoorthi, S. Effect of Water Stress on Yield of Rice Crop. Int. J. Ecol. Dev. 2005, 3, F05. [Google Scholar]
  7. Maru, H.; Haileslassie, A.; Zeleke, T. Impacts of small-scale irrigation on farmers’ livelihood: Evidence from the drought prone areas of upper Awash sub-basin, Ethiopia. Heliyon 2023, 9, e16354. [Google Scholar] [CrossRef] [PubMed]
  8. Baloyi, V.A. The Impact of Smallholder Irrigation Schemes on Poverty Reduction among Rural Households of Vhembe and Sekhukhune Districts in Limpopo Province, South Africa. Ph.D. Thesis, University of Limpopo, Limpopo, South Africa, 2021. [Google Scholar]
  9. Van Averbeke, W.; Denison, J.; Mnkeni, P.N. Smallholder irrigation schemes in South Africa: A review of knowledge generated by the Water Research Commission. Water SA 2021, 37, 797–808. [Google Scholar] [CrossRef]
  10. Chipfupa, U. Entrepreneurial Development Pathways for Smallholder Irrigation Farming in Kwazulu-Natal: Typologies Aspirations and Preferences. Ph.D. Thesis, University of KwaZulu-Natal, Pietermaritzburg, South Africa, 2017. [Google Scholar]
  11. Mbusi, N. Assessment of Sources of Livelihoods and Opportunities to Improve the Contribution of Farming within Available Food Chains. Master’s Thesis, University of Fort Hare, Eastern Cape, Alica, South Africa, 2013. [Google Scholar]
  12. Fanadzo, M.; Chiduza, C.; Mnkeni, P.S. Overview of smallholder irrigation schemes in South Africa: Relationship between farmer crop management practice and performance. Afr. J. Agr. Res. 2010, 5, 3514–3523. [Google Scholar]
  13. Pauw, K.; Mc Donald, S.; Punt, C. Agricultural efficiency and welfare in South Africa. Dev. S. Afr. 2007, 24, 309–333. [Google Scholar] [CrossRef]
  14. Ferreira, V.; Almazan_Gomez, M.A.; Nechitor, V.; Ferrari, E. The role of the agricultural sector in Ghana’s development. A multiregional SAM-based analysis. J. Econ. Struct. 2022, 11, 6. [Google Scholar] [CrossRef] [PubMed]
  15. Mare, F.A.; Bahta, Y.T. The impact of live sheep export trade on the South African economy. AIM-Agric. Food. 2022, 8, 25–47. [Google Scholar] [CrossRef]
  16. Bahta, Y.T.; Willemse, B.J.; Grove, B. The role of agriculture in welfare, income distribution and economic development of the Free State Province of South Africa: A CGE approach. Agrekon 2014, 53, 46–74. [Google Scholar] [CrossRef]
  17. Taljaard, P.R. The Macroeconomy and Irrigation Agriculture in the Northern Cape Province of South Africa. Ph.D. Thesis, University of the Free State, Bloemfontein, South Africa, 2007. [Google Scholar]
  18. Kirsten, J.F.; Van Zyl, J. The economic impact of irrigation agriculture: Methodological aspects and an empirical application. Dev. S. Afr. 1990, 7, 209–224. [Google Scholar] [CrossRef]
  19. Doukkali, M.R.; Lejars, C. Energy cost of irrigation policy in Morocco: A Social Accounting Matrix assessment. In. J. Water Resour. Dev. 2015, 31, 422–435. [Google Scholar] [CrossRef]
  20. Brown, J.R. Irrigation development as an Instrument for Economic Growth in Saskatchewan: An Economic Impact Analysis. Master’s Thesis, University of Saskatchewan, Saskatoon, SK, Canada, 2017. [Google Scholar]
  21. Hassan, R.M. Economic-wide benefits from water-intensive industries in South Africa: A quasi input-output analysis of the contribution of irrigation agriculture and cultivation plantations in the Crocodile River catchment Dev. S. Afr. 2003, 20, 171–195. [Google Scholar]
  22. Global Insight. South Africa Regional Eeplorer (Rex); Global Insight: Johannesburg, South Africa, 2022. [Google Scholar]
  23. Ramigo, P.; Bahta, Y.T.; Jordaan, H.; Joubert, C. Data on Economic Analysis: 2017 Social Accounting Matrices for South Africa. University of the Free State, Bloemfontein, South Africa. 2023. Available online: https://dataverse.harvard.edu/dataset.xhtml?persistentId=doi:10.7910/DVN/CVEC6I (accessed on 10 October 2023).
  24. Statistics South Africa (StatsSA). Census of Commercial Agriculture 2017; Statistics South Africa (StatsSA): Pretoria, South Africa, 2020. [Google Scholar]
  25. Statistics South Africa (StatsSA). Supply and Use Tables (SUT) for 2017; Statistics South Africa (StatsSA): Pretoria, South Africa, 2018. [Google Scholar]
  26. Robinson, S.; Cattaneo, A.; El-Said, M. Updating and Estimating a Social Accounting Matrix Using Cross Entropy Methods. Econ. Syst. Res. 2001, 13, 47–64. [Google Scholar] [CrossRef]
  27. Lamonica, G.R.; Recchioni, M.C.; Chelli, F.M.; Salvati, L. The efficiency of the cross-entropy method when estimating the technical coefficients of input-output tables. Spat. Econ. Anal. 2020, 15, 62–91. [Google Scholar] [CrossRef]
  28. Lamelin, A.; Fofana, I.; Cockburn, J. Balancing a Social Accounting Matrix: Theory and Application (A Revised Version); Partnership for Economic Policy (PEP): Quebec, QC, Canada, 2013. [Google Scholar]
  29. Punt, C. Modelling multi-product industries in computable general equilibrium (CGE) models. Ph.D. Thesis, University of Stellenbosch, Stellenbosch, South Africa, 2013. [Google Scholar]
  30. PROVIDE. Social Accounting Matrices and Economic Modelling; Background Paper 2003:4; Western Cape: Elsenburg, South Africa, 2003. [Google Scholar]
  31. Miller, R.; Blair, P. Input-Output Analysis: Foundations and Extensions, 2nd ed.; Cambridge University Press: Cambridge, UK, 2009. [Google Scholar]
  32. Mupaso, N.; Makombe, G.; Mugandani, R.; Mafongoya, P.L. Assessing the Contribution of Smallholder Irrigation to Household Food Security in Zimbabwe. Agriculture 2024, 14, 617. [Google Scholar] [CrossRef]
  33. Ramigo, P. Agriculture’s Contribution to Economic Growth and Development in Rural Limpopo Province: A SAM Multiplier Analysis. Master’s Thesis, University of Stellenbosch, Stellenbosch, South Africa, 2017. [Google Scholar]
  34. Phoofolo, M.L. Analysis of the economic impact of a disaggregated agricultural sector in South Africa: A social accounting matrix (SAM) multiplier approach. Master’s Thesis, University of Stellenbosch, Stellenbosch, South Africa, 2018. [Google Scholar]
  35. Cousins, B. Smallholder irrigation schemes, agrarian reform, and accumulation from below: Evidence from Tugela Ferry. Kwazulu-Natal. In Proceedings of the Conference on Strategies to Overcome Poverty and Inequality: Towards Carnegie III, Cape Town, South Africa, 3–7 September 2012. [Google Scholar]
Figure 1. Map of the Limpopo Province, South Africa. Sources: Authors with the assistance of a GIS expert.
Agriculture 14 01086 g001
Table 1. Total requirement matrices in the product-by-activity models.
Activity Technology Product Technology
Product-demand driven models
Product-by-product ( I B D ) 1 ( I B C ) 1 ) 1
Activity-by-product D ( 1 B D ) 1 C 1 ( I B C ) 1 ) 1
Activity-demand driven models
Activity-by-activity ( 1 D B ) 1 ( I C 1 B ) 1
Product-by-activity [ D 1 ( 1 D B ) 1 ][C ( I C 1 B ) 1 ]
Source: Adopted from Miller and Blair [31].
Table 2. Output, value-added, and institutional income multipliers.
Industries Output Ranks Value Added Ranks Incomes Ranks
R’Millions
Irrigation agriculture Western Cape (WC) Province1.924811.31351.4408
Rainfed agriculture WC2.359440.793710.87873
Irrigation agriculture Eastern Cape (EC) Province2.065731.28991.42711
Rainfed agriculture EC2.349470.792720.88172
Irrigation agriculture Northern Cape (NC) Province2.348491.161261.29925
Rainfed agriculture NC2.020761.171221.30623
Irrigation agriculture Free State (FS) Province1.721861.265141.38714
Rainfed agriculture FS2.130700.761770.84478
Irrigation agriculture KwaZulu-Natal (KZN) Province1.868821.32441.4605
Rainfed agriculture KZN2.295550.713800.79280
Irrigation agriculture North-West (NW) Province1.771851.29471.41612
Rainfed agriculture NW2.445350.848640.94364
Irrigation agriculture Gauteng (GP) Province1.786841.268131.38713
Rainfed agriculture GP2.500260.635850.70885
Irrigation agriculture Mpumalanga (MP) Province2.058741.42611.6161
Rainfed agriculture MP2.349480.635840.71284
Limpopo District municipalities
Irrigation agriculture Mopani1.945801.30761.4466
Rainfed agriculture Mopani2.241601.114301.23630
Irrigation agriculture Vhembe1.957791.287101.4447
Rainfed agriculture Vhembe2.399390.897561.00456
Irrigation agriculture Capricorn1.817831.29281.4704
Rainfed agriculture Capricorn2.501250.910521.02353
Irrigation agriculture Waterberg2.151681.238151.35715
Rainfed agriculture Waterberg2.337511.005411.10842
Irrigation agriculture Sekhukhune2.279571.217161.34017
Rainfed agriculture Sekhukhune2.608150.855630.95163
Forestry2.283560.932471.05047
Fishing2.090721.210171.33418
Mining of coal and lignite2.178671.165251.29626
Mining of gold and uranium ore2.480301.169241.31420
Mining of metal ores2.226641.129291.25828
Other mining and quarrying2.366421.102311.23331
Food2.397400.896570.99857
Beverages and tobacco2.454330.927481.03649
Spinning, weaving, and finishing of textiles2.412380.694820.78182
Knitted, crouched fabrics, wearing apparel, fur articles2.521220.756780.85477
Tanning and dressing of leather1.552870.448870.49987
Footwear2.129710.594860.66886
Sawmilling, planing of wood, cork, straw2.592181.055341.18133
Paper2.602170.861610.96561
Publishing, printing, recorded media2.647100.908531.02652
Coke ovens, petroleum refineries2.138690.778750.86376
Nuclear fuel, basic chemicals2.433360.736790.82779
Other chemical products, man-made fibres2.484290.794700.89569
Rubber2.425370.817670.91767
Plastic2.453340.902551.02054
Glass2.509240.943461.06745
Non-metallic minerals2.233610.782740.87375
Basic iron and steel, casting of metals2.95230.903541.01155
Basic precious and non-ferrous metals2.81740.947451.06146
Fabricated metal products3.06521.005421.13338
Machinery and equipment2.613130.927491.04348
Electrical machinery and apparatus2.71870.791730.89070
Radio, television, communication equipment, and apparatus2.316530.806690.90768
Medical, precision, optical instruments, watches and clocks2.354450.860620.96162
Motor vehicles, trailers, parts2.541200.700810.78881
Other transport equipment2.048750.774760.87574
Furniture2.001770.650830.73183
Manufacturing n.e.c, recycling2.342500.966441.07044
Electricity, gas, steam, and hot water supply2.265591.179201.30722
Collection, purification, and distribution of water2.612141.206181.34316
Construction2.395410.826660.92466
Wholesale trade, commission trade2.361431.059321.18432
Retail trade2.488271.147271.28127
Sale, maintenance, and repair of motor vehicles2.515231.179211.32019
Hotels and restaurants2.310540.925511.03151
Land transport, transport via pipelines2.228631.048361.16336
Water transport1.989780.807680.88771
Air transport2.266580.841650.93365
Auxiliary transport2.326521.007401.12340
Post and telecommunication2.354460.871580.97159
Financial intermediation2.66581.286111.4399
Insurance and pension funding2.78751.285121.43210
Activities in financial intermediation3.07011.34021.5063
Real estate activities2.209661.020381.12241
Renting of machinery and equipment2.72861.028371.14837
Computer and related activities2.576190.863590.97158
Research and experimental development2.230621.184191.31421
Other business activities2.65091.048351.17635
Government2.488281.32631.5072
Education2.455321.055331.18134
Health and social work2.471311.010391.13139
Sewerage and refuse disposal2.615121.170231.30024
Activities of membership organisations2.532210.991431.10743
Recreational, cultural, and sporting activities2.603160.862600.96560
Other activities2.619110.926501.03650
Non-observed, informal, non-profit, households2.212651.131281.25629
Average2.352 0.993 1.108
Source: Author’s Calculations based on 2017 SAM.
Table 3. Land return/multipliers.
Industries Land Returns
Irrigated LandRanksDrylandRanksTotalRanks
R’Millions
Irrigation agriculture Western Cape (WC) Province0.0115030.00066220.01225
Rainfed agriculture WC0.00013350.00247120.002625
Irrigation agriculture Eastern Cape (EC) Province0.0580720.00102170.05912
Rainfed agriculture EC0.00011560.0043390.004419
Irrigation agriculture Northern Cape (NC) Province0.1110410.00235130.11341
Rainfed agriculture NC0.00014330.0056960.005816
Irrigation agriculture Free State (FS) Province 0.0067540.00035290.00719
Rainfed agriculture FS0.00015280.0149120.01514
Irrigation agriculture KwaZulu-Natal (KZN) Province 0.00271120.00038270.003122
Rainfed agriculture KZN0.00014310.00358100.003721
Irrigation agriculture North-West (NW) Province 0.0063750.00032310.006710
Rainfed agriculture NW0.00021220.0268910.02713
Irrigation agriculture Gauteng (GP) Province 0.00403110.00036280.004420
Rainfed agriculture GP0.00009770.00075210.000828
Irrigation agriculture Mpumalanga (MP) Province 0.00242130.00039260.002824
Rainfed agriculture MP0.00014290.0075250.00778
Limpopo District municipalities
Irrigation agriculture Mopani0.0058270.00076190.006611
Rainfed agriculture Mopani0.00030170.0114030.01176
Irrigation agriculture Vhembe0.0051480.00076200.005915
Rainfed agriculture Vhembe0.00023210.0054670.005717
Irrigation agriculture Capricorn0.0059560.00043240.006412
Rainfed agriculture Capricorn0.00014300.0051480.005318
Irrigation agriculture Waterberg0.0047290.00146150.006214
Rainfed agriculture Waterberg0.00050150.0078840.00847
Irrigation agriculture Sekhukhune0.00428100.00190140.006213
Rainfed agriculture Sekhukhune0.00028190.00259110.002923
Forestry0.00019230.00034300.000531
Fishing0.00016260.00028340.000434
Mining of coal and lignite0.00011490.00020510.000351
Mining of gold and uranium ore0.00011610.00019620.000362
Mining of metal ores0.00011510.00020530.000353
Other mining and quarrying0.00011530.00019560.000355
Food0.00062140.00110160.001726
Beverages and tobacco0.00047160.00082180.001327
Spinning, weaving, and finishing of textiles0.00030180.00053230.000829
Knitted, crouched fabrics, wearing apparel, fur articles0.00016250.00029330.000433
Tanning and dressing of leather0.00005870.00008870.000187
Footwear0.00011600.00019610.000361
Sawmilling, planing of wood, cork, straw0.00012370.00022390.000339
Paper0.00011590.00019600.000360
Publishing, printing, recorded media0.00012430.00021450.000345
Coke ovens, petroleum refineries0.00007860.00013860.000286
Nuclear fuel, basic chemicals0.00008810.00015810.000281
Other chemical products, man-made fibres0.00010660.00018670.000367
Rubber0.00024200.00042250.000730
Plastic0.00010670.00018680.000368
Glass0.00011570.00019590.000358
Non-metallic minerals0.00008820.00015820.000282
Basic iron and steel, casting of metals0.00009730.00017740.000374
Basic precious and non-ferrous metals0.00010690.00018700.000370
Fabricated metal products0.00011580.00019580.000359
Machinery and equipment0.00011620.00019640.000364
Electrical machinery and apparatus0.00009740.00017750.000375
Radio, television, communication equipment, and apparatus0.00009760.00016770.000277
Medical, precision, optical instruments, watches, and clocks0.00009720.00017730.000373
Motor vehicles, trailers, parts0.00008830.00015830.000283
Other transport equipment0.00010700.00018710.000371
Furniture0.00008840.00014840.000284
Manufacturing n.e.c, recycling0.00013340.00023370.000437
Electricity, gas, steam, and hot water supply0.00011540.00019570.000357
Collection, purification, and distribution of water0.00012410.00021430.000343
Construction0.00009800.00016780.000278
Wholesale trade, commission trade0.00011500.00020520.000352
Retail trade0.00012420.00021440.000344
Sale, maintenance, and repair of motor vehicles0.00012390.00021410.000341
Hotels and restaurants0.00017240.00031320.000532
Land transport, transport via pipelines0.00010710.00018720.000372
Water transport0.00007850.00013850.000285
Air transport0.00009780.00015790.000279
Auxiliary transport0.00011630.00019630.000363
Post and telecommunication0.00009790.00015800.000280
Financial intermediation0.00013360.00023380.000438
Insurance and pension funding0.00012380.00022400.000340
Activities in financial intermediation0.00014320.00024360.000436
Real estate activities0.00009750.00016760.000276
Renting of machinery and equipment0.00011520.00020540.000354
Computer and related activities0.00011550.00019550.000356
Research and experimental development0.00012440.00020460.000346
Other business activities0.00011450.00020470.000347
Government0.00016270.00027350.000435
Education0.00011480.00020500.000350
Health and social work0.00011460.00020480.000348
Sewerage and refuse disposal0.00011470.00020490.000349
Activities of membership organisations0.00010640.00018650.000365
Recreational, cultural, and sporting activities0.00010680.00018690.000369
Other activities0.00010650.00018660.000366
Non-observed, informal, non-profit, households,0.00012400.00021420.000342
Average0.00275 0.00142 0.004
Source: Authors’ calculations from 2017 SAM.
Table 4. Household incomes.
Industries Household Income by Industries
MopaniVhembeCapricornWaterbergSekhukhuneTotalRanks
R’Million
Irrigation agriculture Western Cape (WC) Province0.01380.01040.01560.00930.00690.056142
Rainfed agriculture WC 0.00920.00770.01080.00620.00570.039574
Irrigation agriculture Eastern Cape (EC) Province0.01320.01060.01540.00930.00730.055743
Rainfed agriculture EC 0.00910.00760.01060.00610.00580.039276
Irrigation agriculture Northern Cape (NC) Province0.01300.01110.01520.00970.00810.057039
Rainfed agriculture NC 0.01280.00980.01450.00880.00730.053246
Irrigation agriculture Free State (FS) Province0.01330.00980.01500.00900.00640.053545
Rainfed agriculture FS 0.00890.00710.01010.00620.00560.037879
Irrigation agriculture KwaZulu-Natal (KZN) Province0.01400.01040.01590.00940.00690.056641
Rainfed agriculture KZN 0.00850.00700.00980.00590.00560.036881
Irrigation agriculture North-West (NW) Province0.01430.01050.01620.00960.00690.057436
Rainfed agriculture NW 0.01070.00880.01220.00730.00710.046063
Irrigation agriculture Gauteng (GP) Province0.01430.01050.01620.00960.00690.057635
Rainfed agriculture GP 0.00790.00690.00930.00550.00580.035482
Irrigation agriculture Mpumalanga (MP) Province0.01230.00950.01400.00810.00650.050454
Rainfed agriculture MP 0.00790.00660.00880.00580.00620.035383
Limpopo District municipalities
Irrigation agriculture Mopani0.29840.00990.01480.00890.00670.33874
Rainfed agriculture Mopani0.19170.00980.01390.00850.00750.23146
Irrigation agriculture Vhembe0.01240.35210.01390.00830.00630.39301
Rainfed agriculture Vhembe0.01050.12340.01200.00720.00700.16019
Irrigation agriculture Capricorn0.01310.00980.30030.00880.00650.33865
Rainfed agriculture Capricorn0.01090.00930.08910.00730.00710.123710
Irrigation agriculture Waterberg0.01220.00950.01350.31510.00670.35693
Rainfed agriculture Waterberg0.01150.00930.01260.18050.00790.22187
Irrigation agriculture Sekhukhune0.01200.00950.01310.00830.32240.36542
Rainfed agriculture Sekhukhune0.01150.00980.01260.00870.07390.116511
Forestry0.01940.01770.01450.00730.00710.066021
Fishing0.01400.01030.01840.00870.01020.061532
Mining of coal and lignite0.01370.01030.01440.01320.01050.061931
Mining of gold and uranium ore0.02820.01290.01540.01000.01140.077918
Mining of metal ores0.03750.01450.02670.05990.07240.21108
Other mining and quarrying0.02000.02330.01860.01600.02440.102313
Food0.01100.00950.01320.00710.00640.047162
Beverages and tobacco0.01120.01000.01370.00700.00650.048560
Spinning, weaving, and finishing of textiles0.00840.00770.01050.00530.00540.037380
Knitted, crouched fabrics, wearing apparel, fur articles0.00880.00840.01150.00530.00540.039375
Tanning and dressing of leather0.00530.00460.00660.00330.00300.022987
Footwear0.00690.00650.00890.00430.00430.030986
Sawmilling, planing of wood, cork, straw0.01320.01110.01400.00750.00700.052850
Paper0.01090.00930.01170.00640.00610.044365
Publishing, printing, recorded media0.01020.00900.01170.00590.00600.042768
Coke ovens, petroleum refineries0.01210.00950.01170.01130.01270.057437
Nuclear fuel, basic chemicals0.00870.00750.01000.00670.00730.040372
Other chemical products, man-made fibres0.00840.00750.01030.00600.00620.038478
Rubber0.00870.00740.01050.00630.00610.039177
Plastic0.00860.00780.01100.00630.00630.040073
Glass0.01010.00890.01200.00800.00880.047861
Non-metallic minerals0.01090.00880.01170.00930.01040.051153
Basic iron and steel, casting of metals0.01650.00970.01440.01770.02080.079217
Basic precious and non-ferrous metals0.01580.00970.01430.01600.01900.074919
Fabricated metal products0.01340.00960.01330.01170.01440.062430
Machinery and equipment0.01100.00950.01270.00920.00980.052251
Electrical machinery and apparatus0.01080.00850.01150.00970.01100.051552
Radio, television, communication equipment, and apparatus0.00940.00830.01100.00770.00810.044564
Medical, precision, optical instruments, watches, and clocks0.00940.00860.01170.00650.00610.042470
Motor vehicles, trailers, parts0.00860.00720.00970.00730.00790.040871
Other transport equipment0.00720.00630.00870.00550.00570.033484
Furniture0.00780.00670.00870.00490.00510.033285
Manufacturing n.e.c, recycling0.01150.00900.01260.00840.00790.049457
Electricity, gas, steam, and hot water supply0.01900.01240.02060.01320.01480.080016
Collection, purification, and distribution of water0.02200.02020.02690.01090.01560.095414
Construction0.01120.01040.01270.00770.00810.050155
Wholesale trade, commission trade0.01320.01360.01740.00790.00870.060834
Retail trade0.01440.01450.01880.00860.00930.065622
Sale, maintenance, and repair of motor vehicles0.01450.01310.01900.00890.00940.064924
Hotels and restaurants0.01110.00960.01370.00710.00740.049059
Land transport, transport via pipelines0.01230.01040.01480.00800.00750.053048
Water transport0.01010.00790.01140.00700.00610.042469
Air transport0.01030.00880.01140.00680.00630.043766
Auxiliary transport0.01170.01050.01300.00710.00670.049158
Post and telecommunication0.00990.00900.01240.00640.00590.043667
Financial intermediation0.01380.01310.01940.00800.00850.062829
Insurance and pension funding0.01400.01300.01920.00840.00830.063028
Activities in financial intermediation0.01370.01350.02020.00770.00870.063826
Real estate activities0.01300.01060.01510.00810.00740.054144
Renting of machinery and equipment0.01420.01290.01630.00790.01000.061333
Computer and related activities0.01320.01240.01440.00670.01030.057038
Research and experimental development0.01750.01520.01900.00920.01200.073020
Other business activities0.01190.01140.01540.00720.00730.053247
Government0.02480.03460.03230.00990.01300.114512
Education0.01940.02160.02430.00930.01350.088115
Health and social work0.01460.01520.01750.00780.00890.064125
Sewerage and refuse disposal0.01450.01460.01850.00930.00860.065523
Activities of membership organisations0.01220.01320.01620.00760.00750.056740
Recreational, cultural, and sporting activities0.01070.01140.01400.00680.00700.049856
Other activities0.01140.01210.01500.00720.00720.052949
Non-observed, informal, non-profit, households,0.01390.01440.01810.00900.00820.063627
Average0.01800.01600.01850.01430.01340.0802
Source: Author’s calculations from 2017 SAM.
Disclaimer/Publisher’s Note: The statements, opinions and data contained in all publications are solely those of the individual author(s) and contributor(s) and not of MDPI and/or the editor(s). MDPI and/or the editor(s) disclaim responsibility for any injury to people or property resulting from any ideas, methods, instructions or products referred to in the content.

