
Identification of High Erucic Acid Brassica carinata Genotypes through Multi-Trait Stability Index

 , ,
, ,  , and
, and
Abstract
1. Introduction
2. Materials and Methods
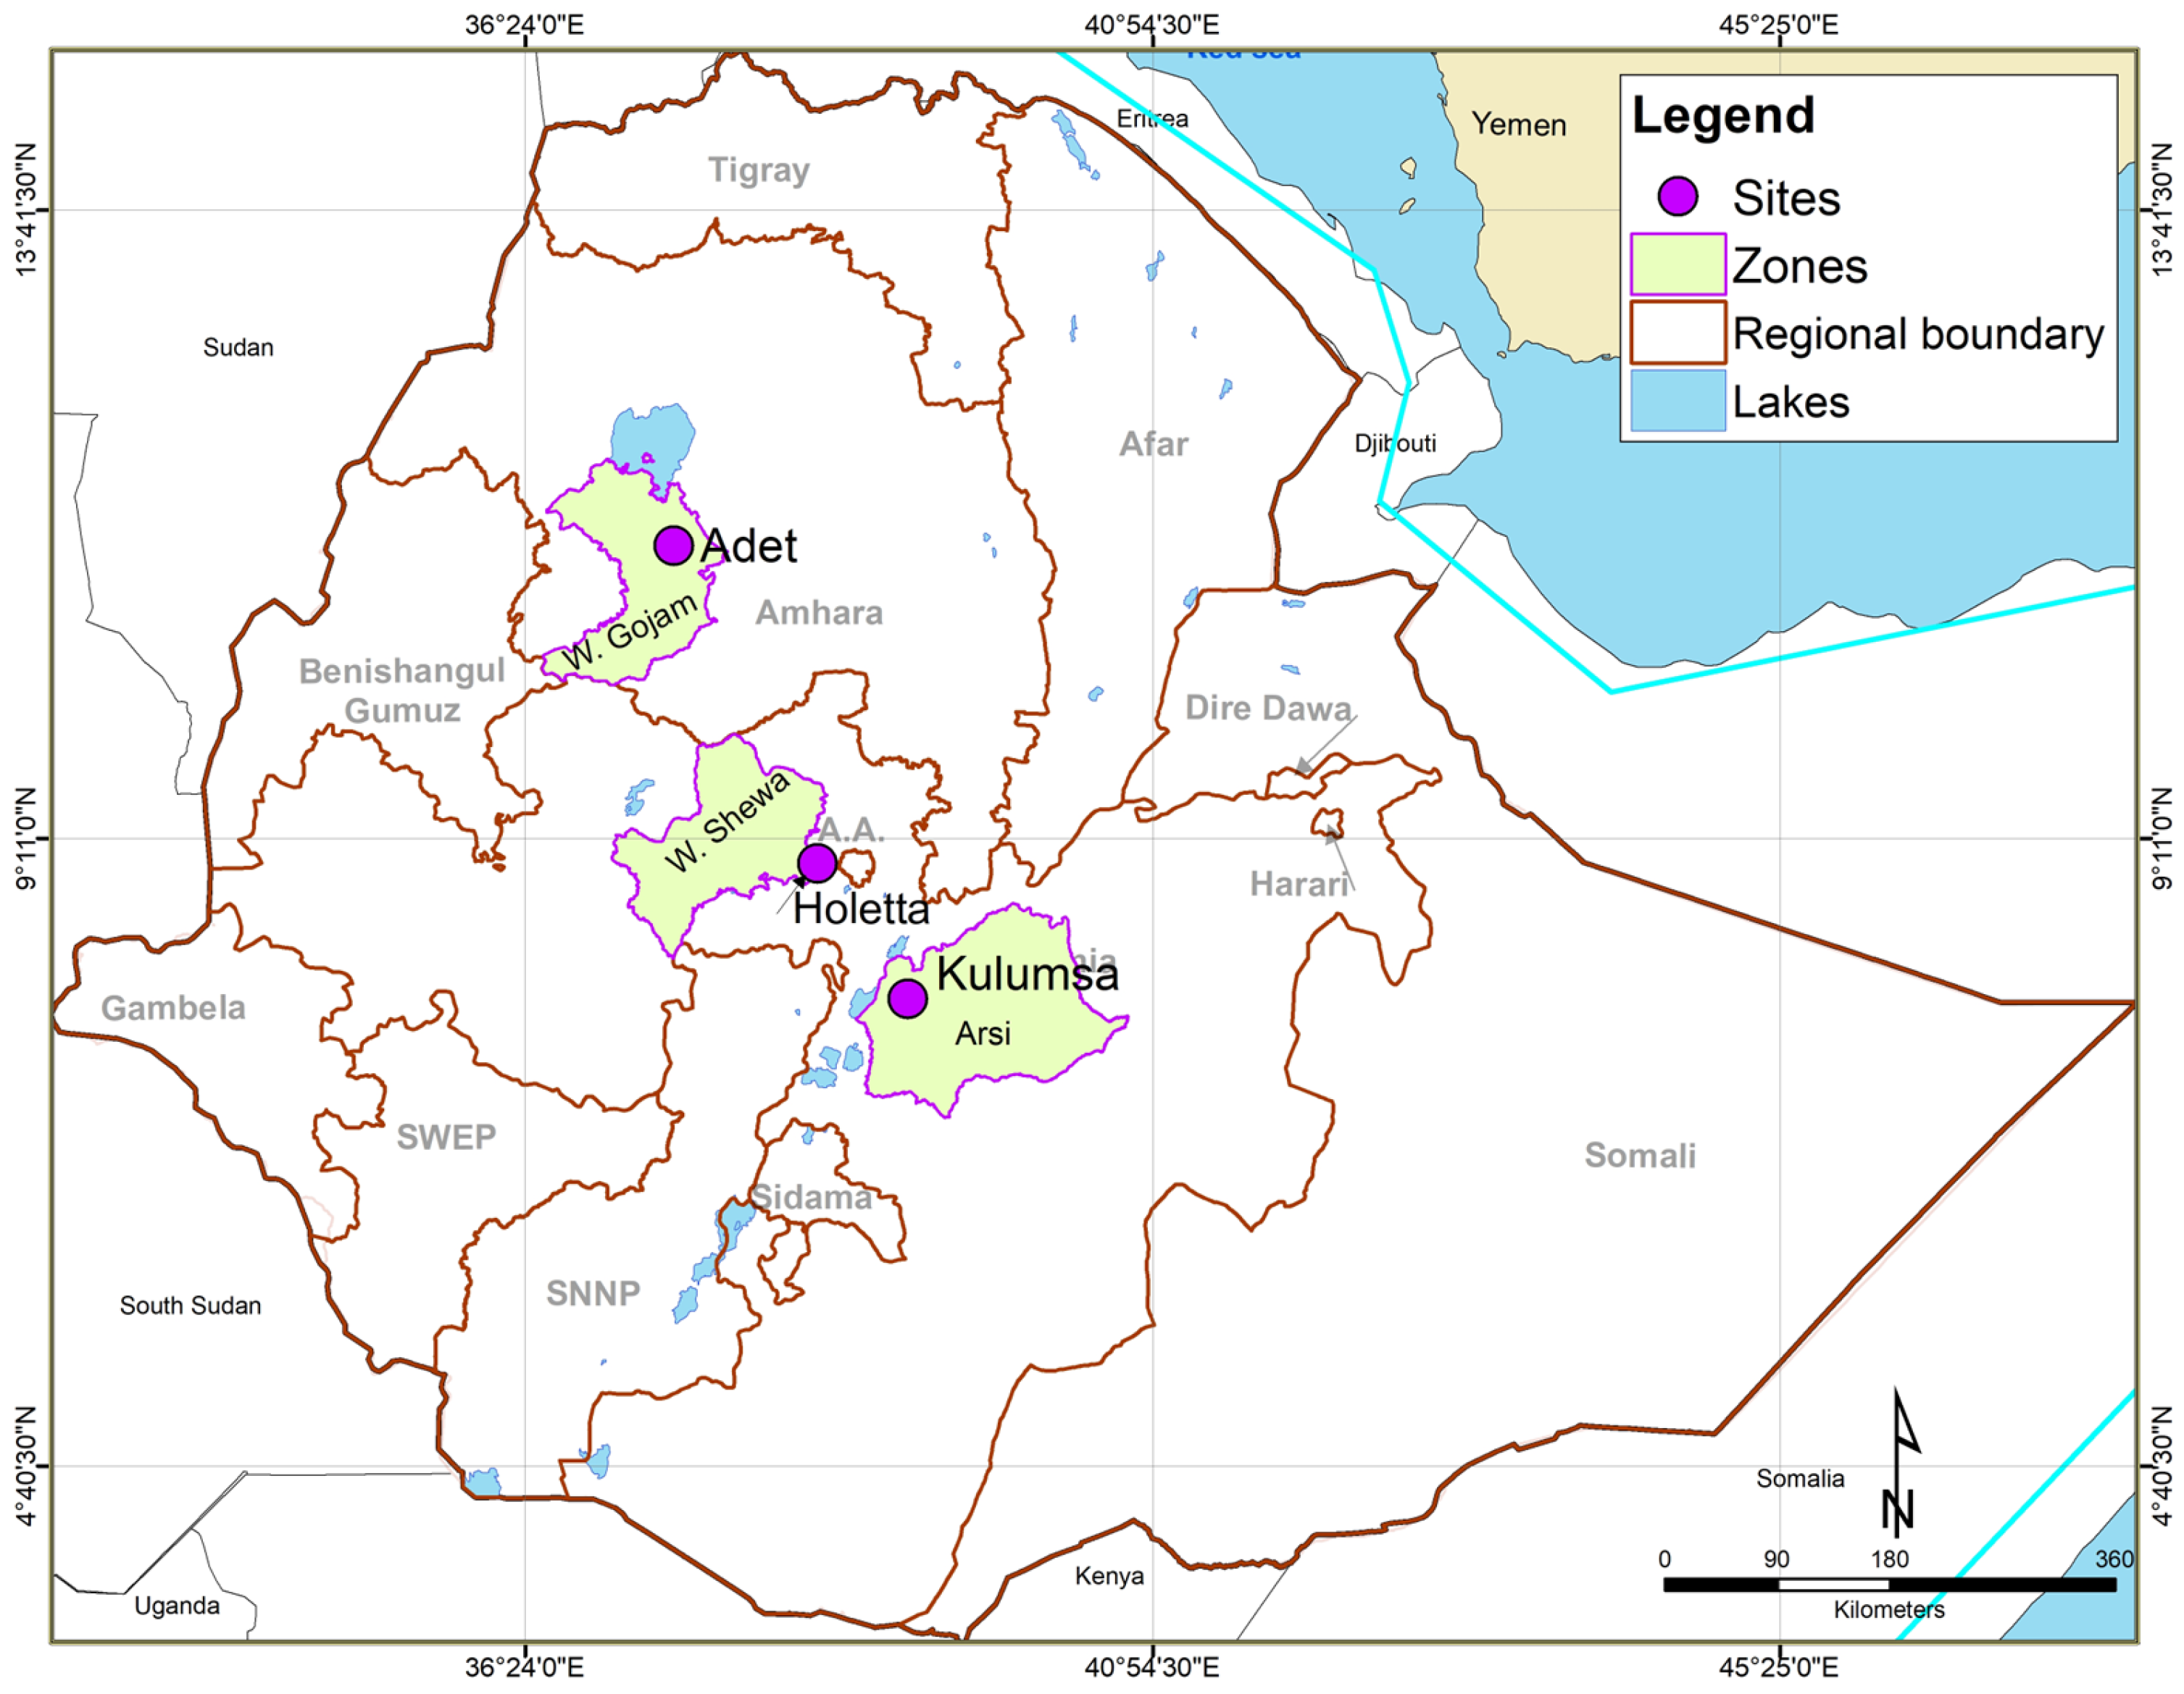
2.1. Plant Materials and Field Experiment
2.2. Determination of Oil Content and Erucic Acid
2.3. Statistical Analysis
2.3.1. Variance Component Analysis
2.3.2. Genotypic Stability Index
2.3.3. Simultaneous Selection for Performance and Stability
2.3.4. Multi-Trait Stability Index and Genotype Selection
2.3.5. Determination of Selection Differential
3. Results
3.1. Mean Performance and Likelihood Test
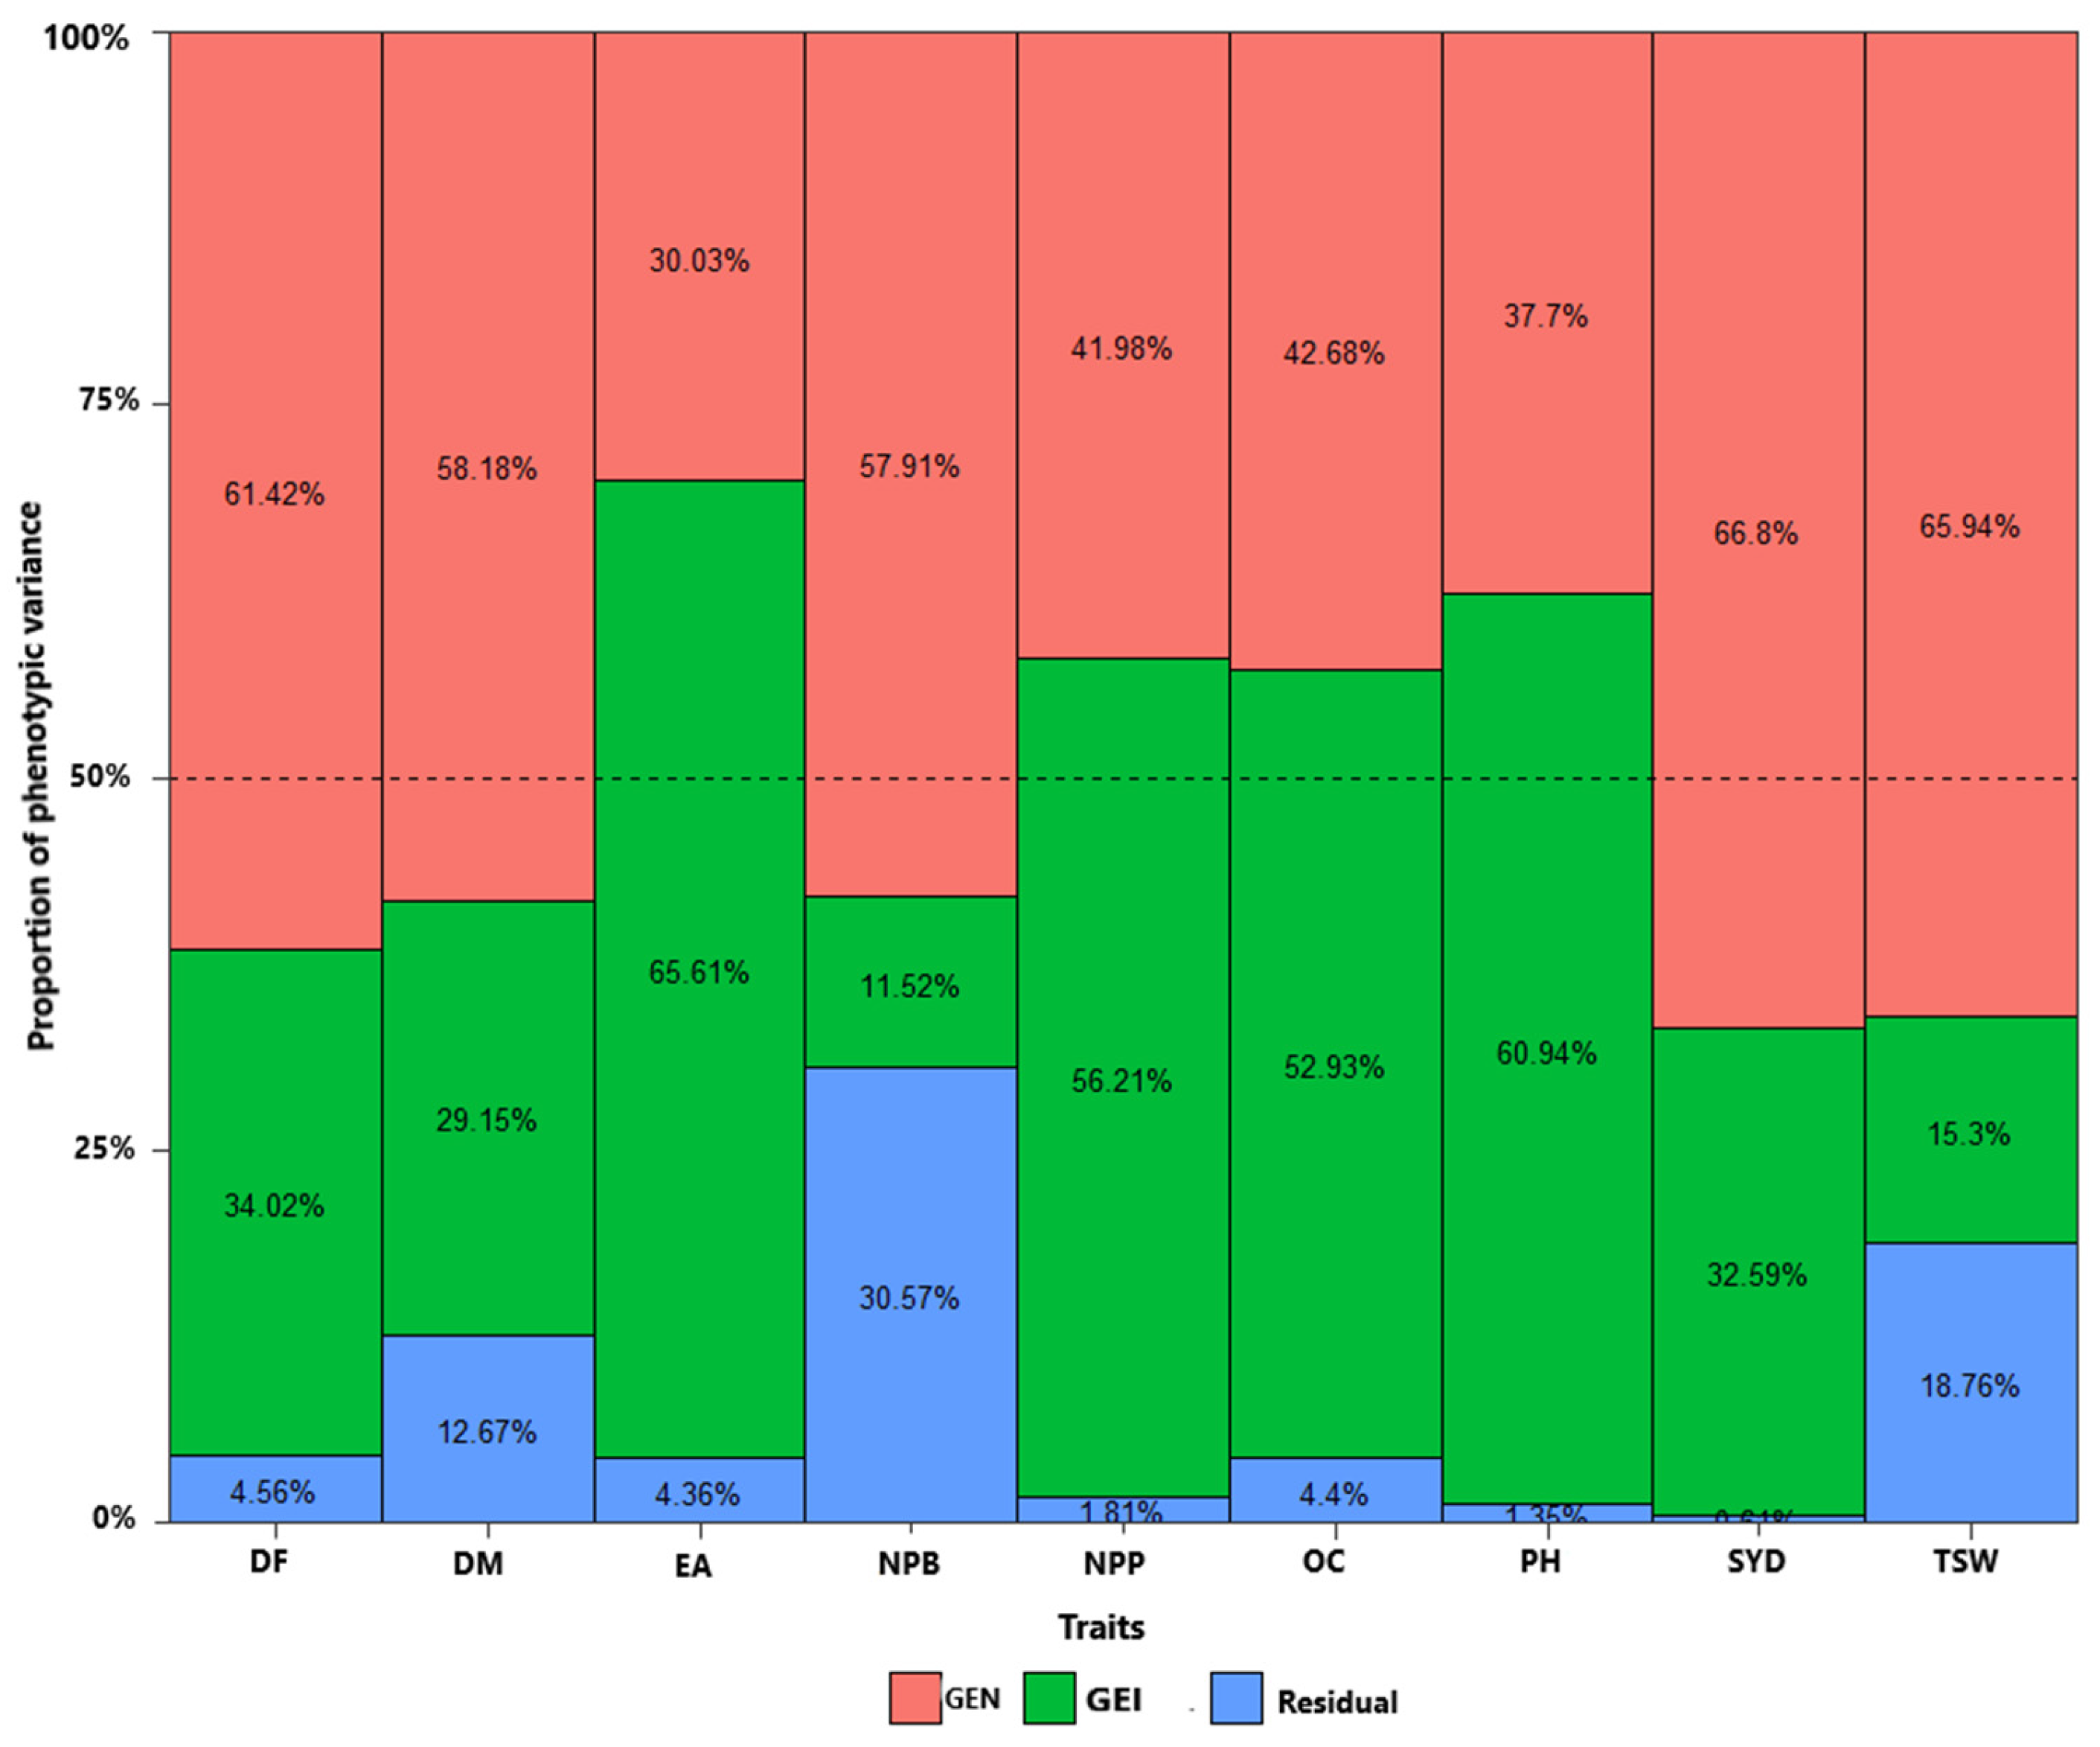
3.2. Variance Component
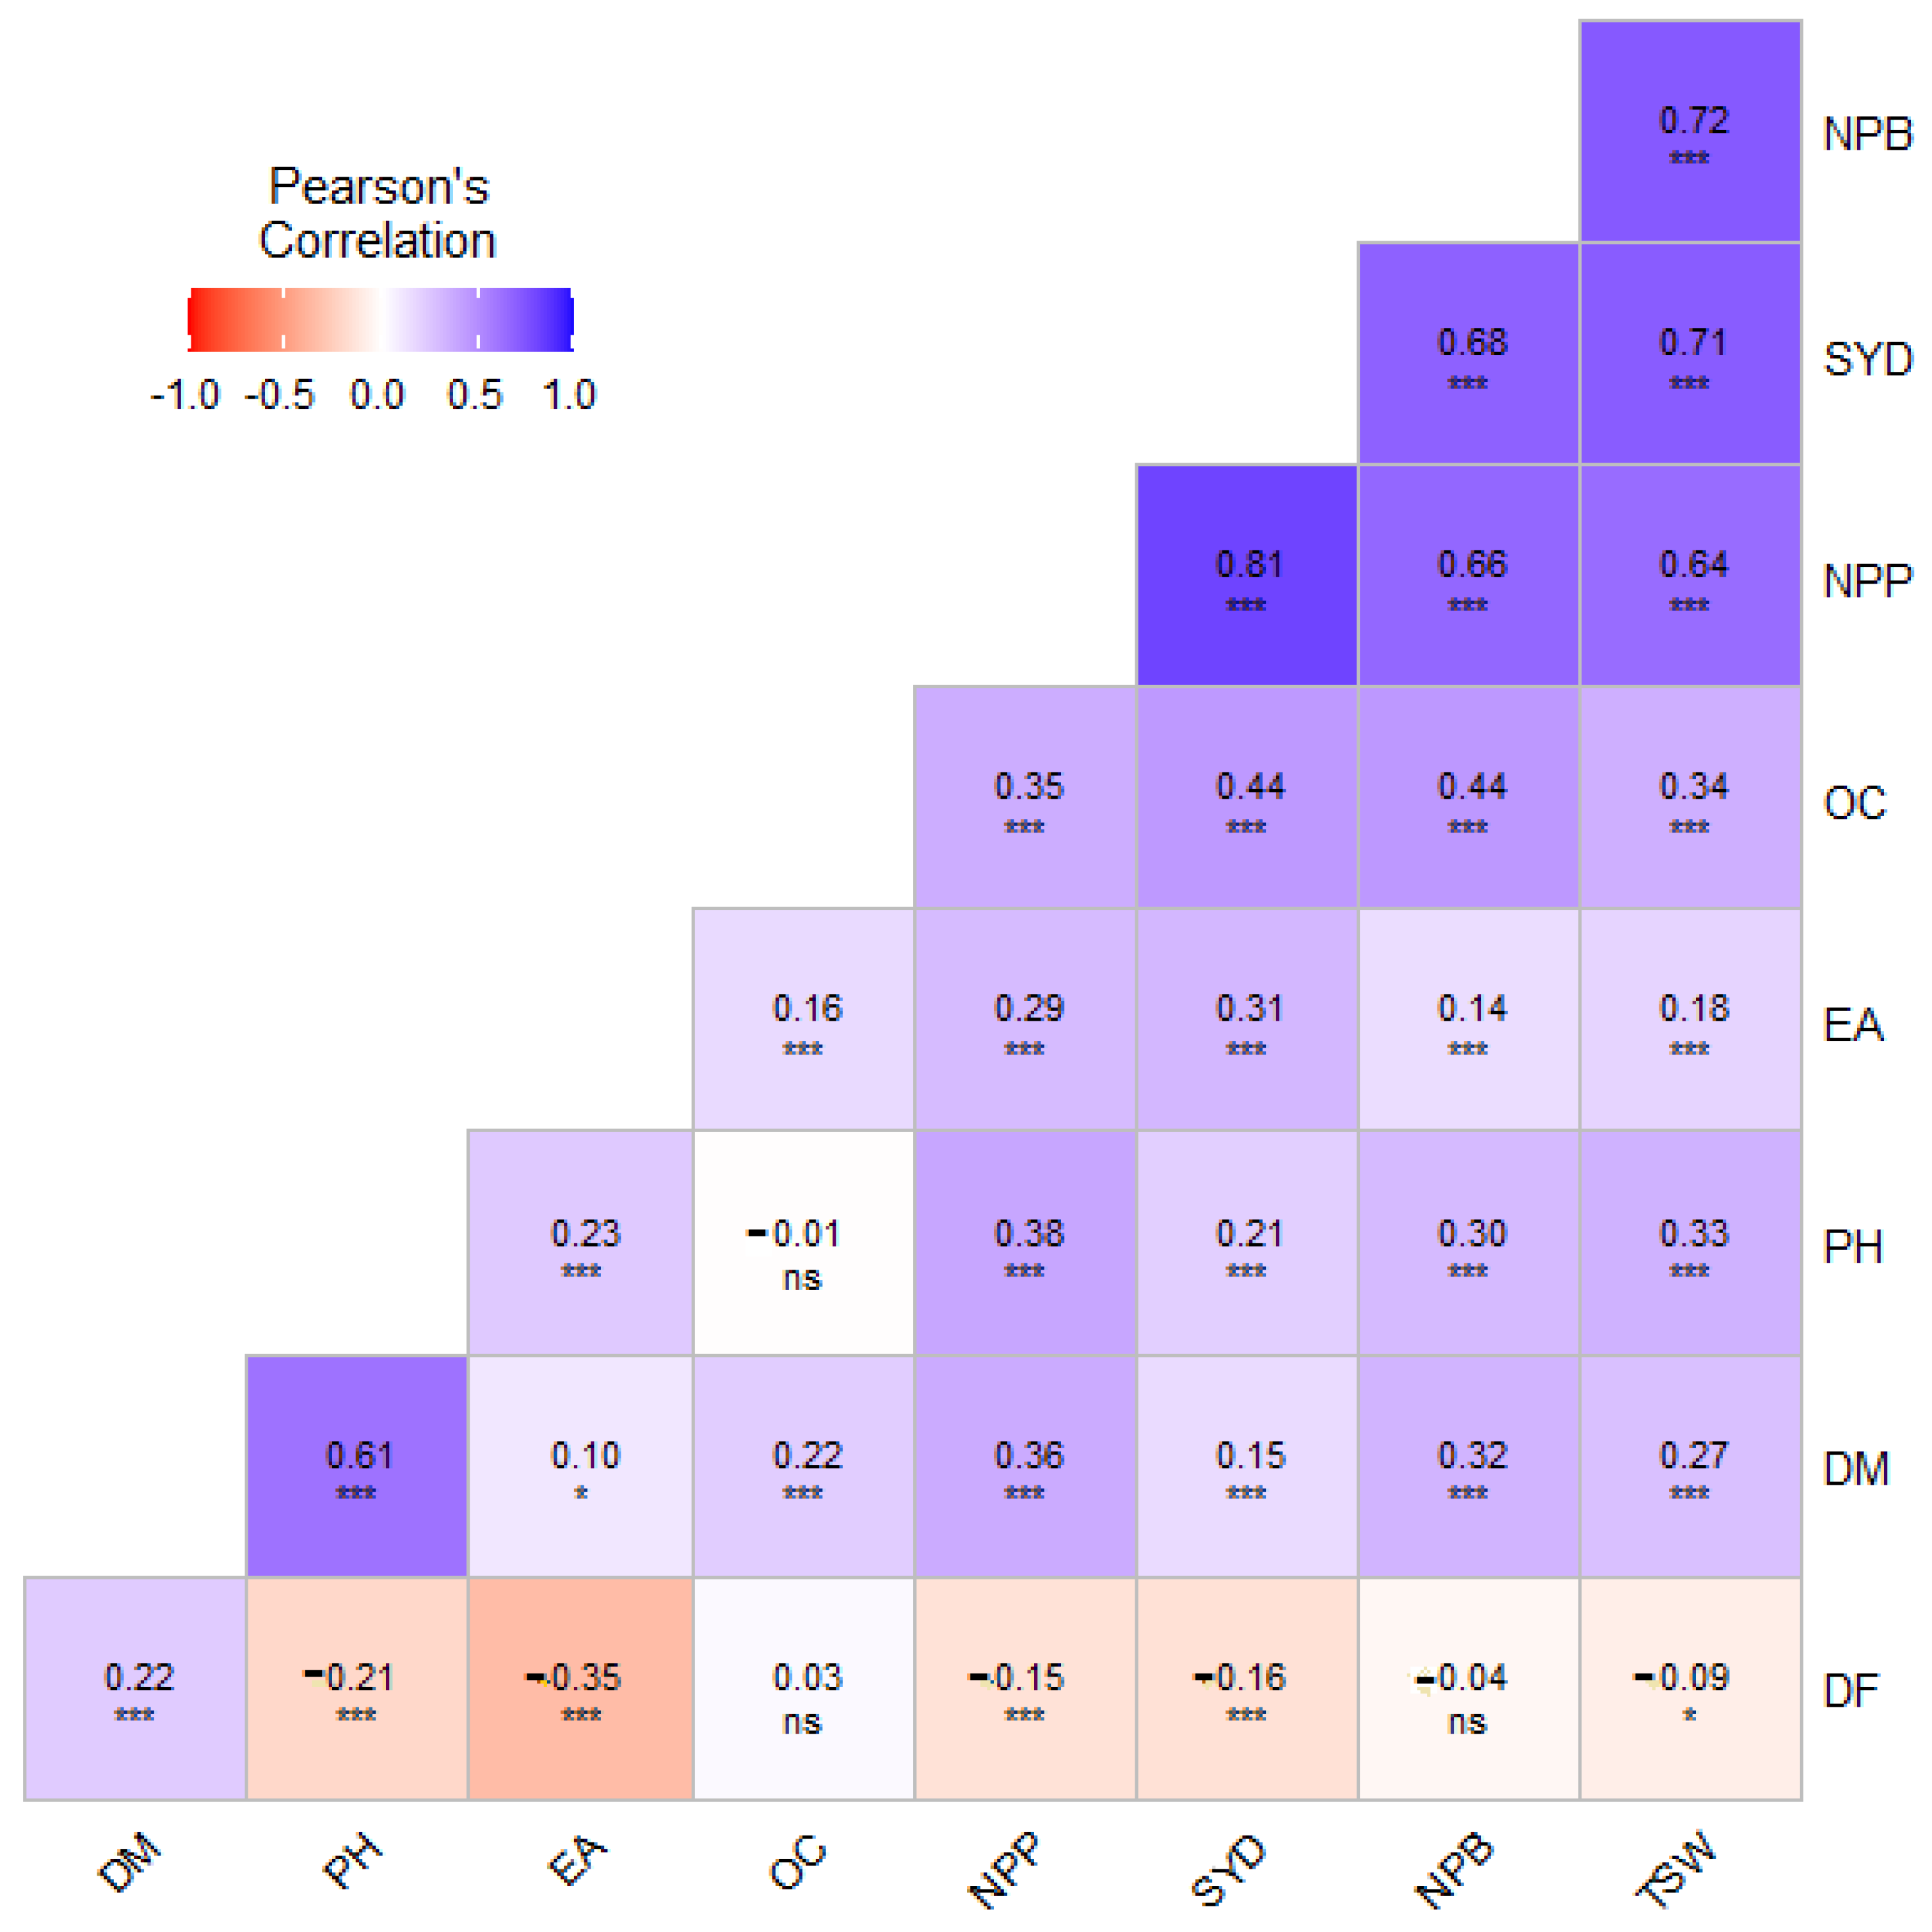
3.3. Correlation and Factor Analysis
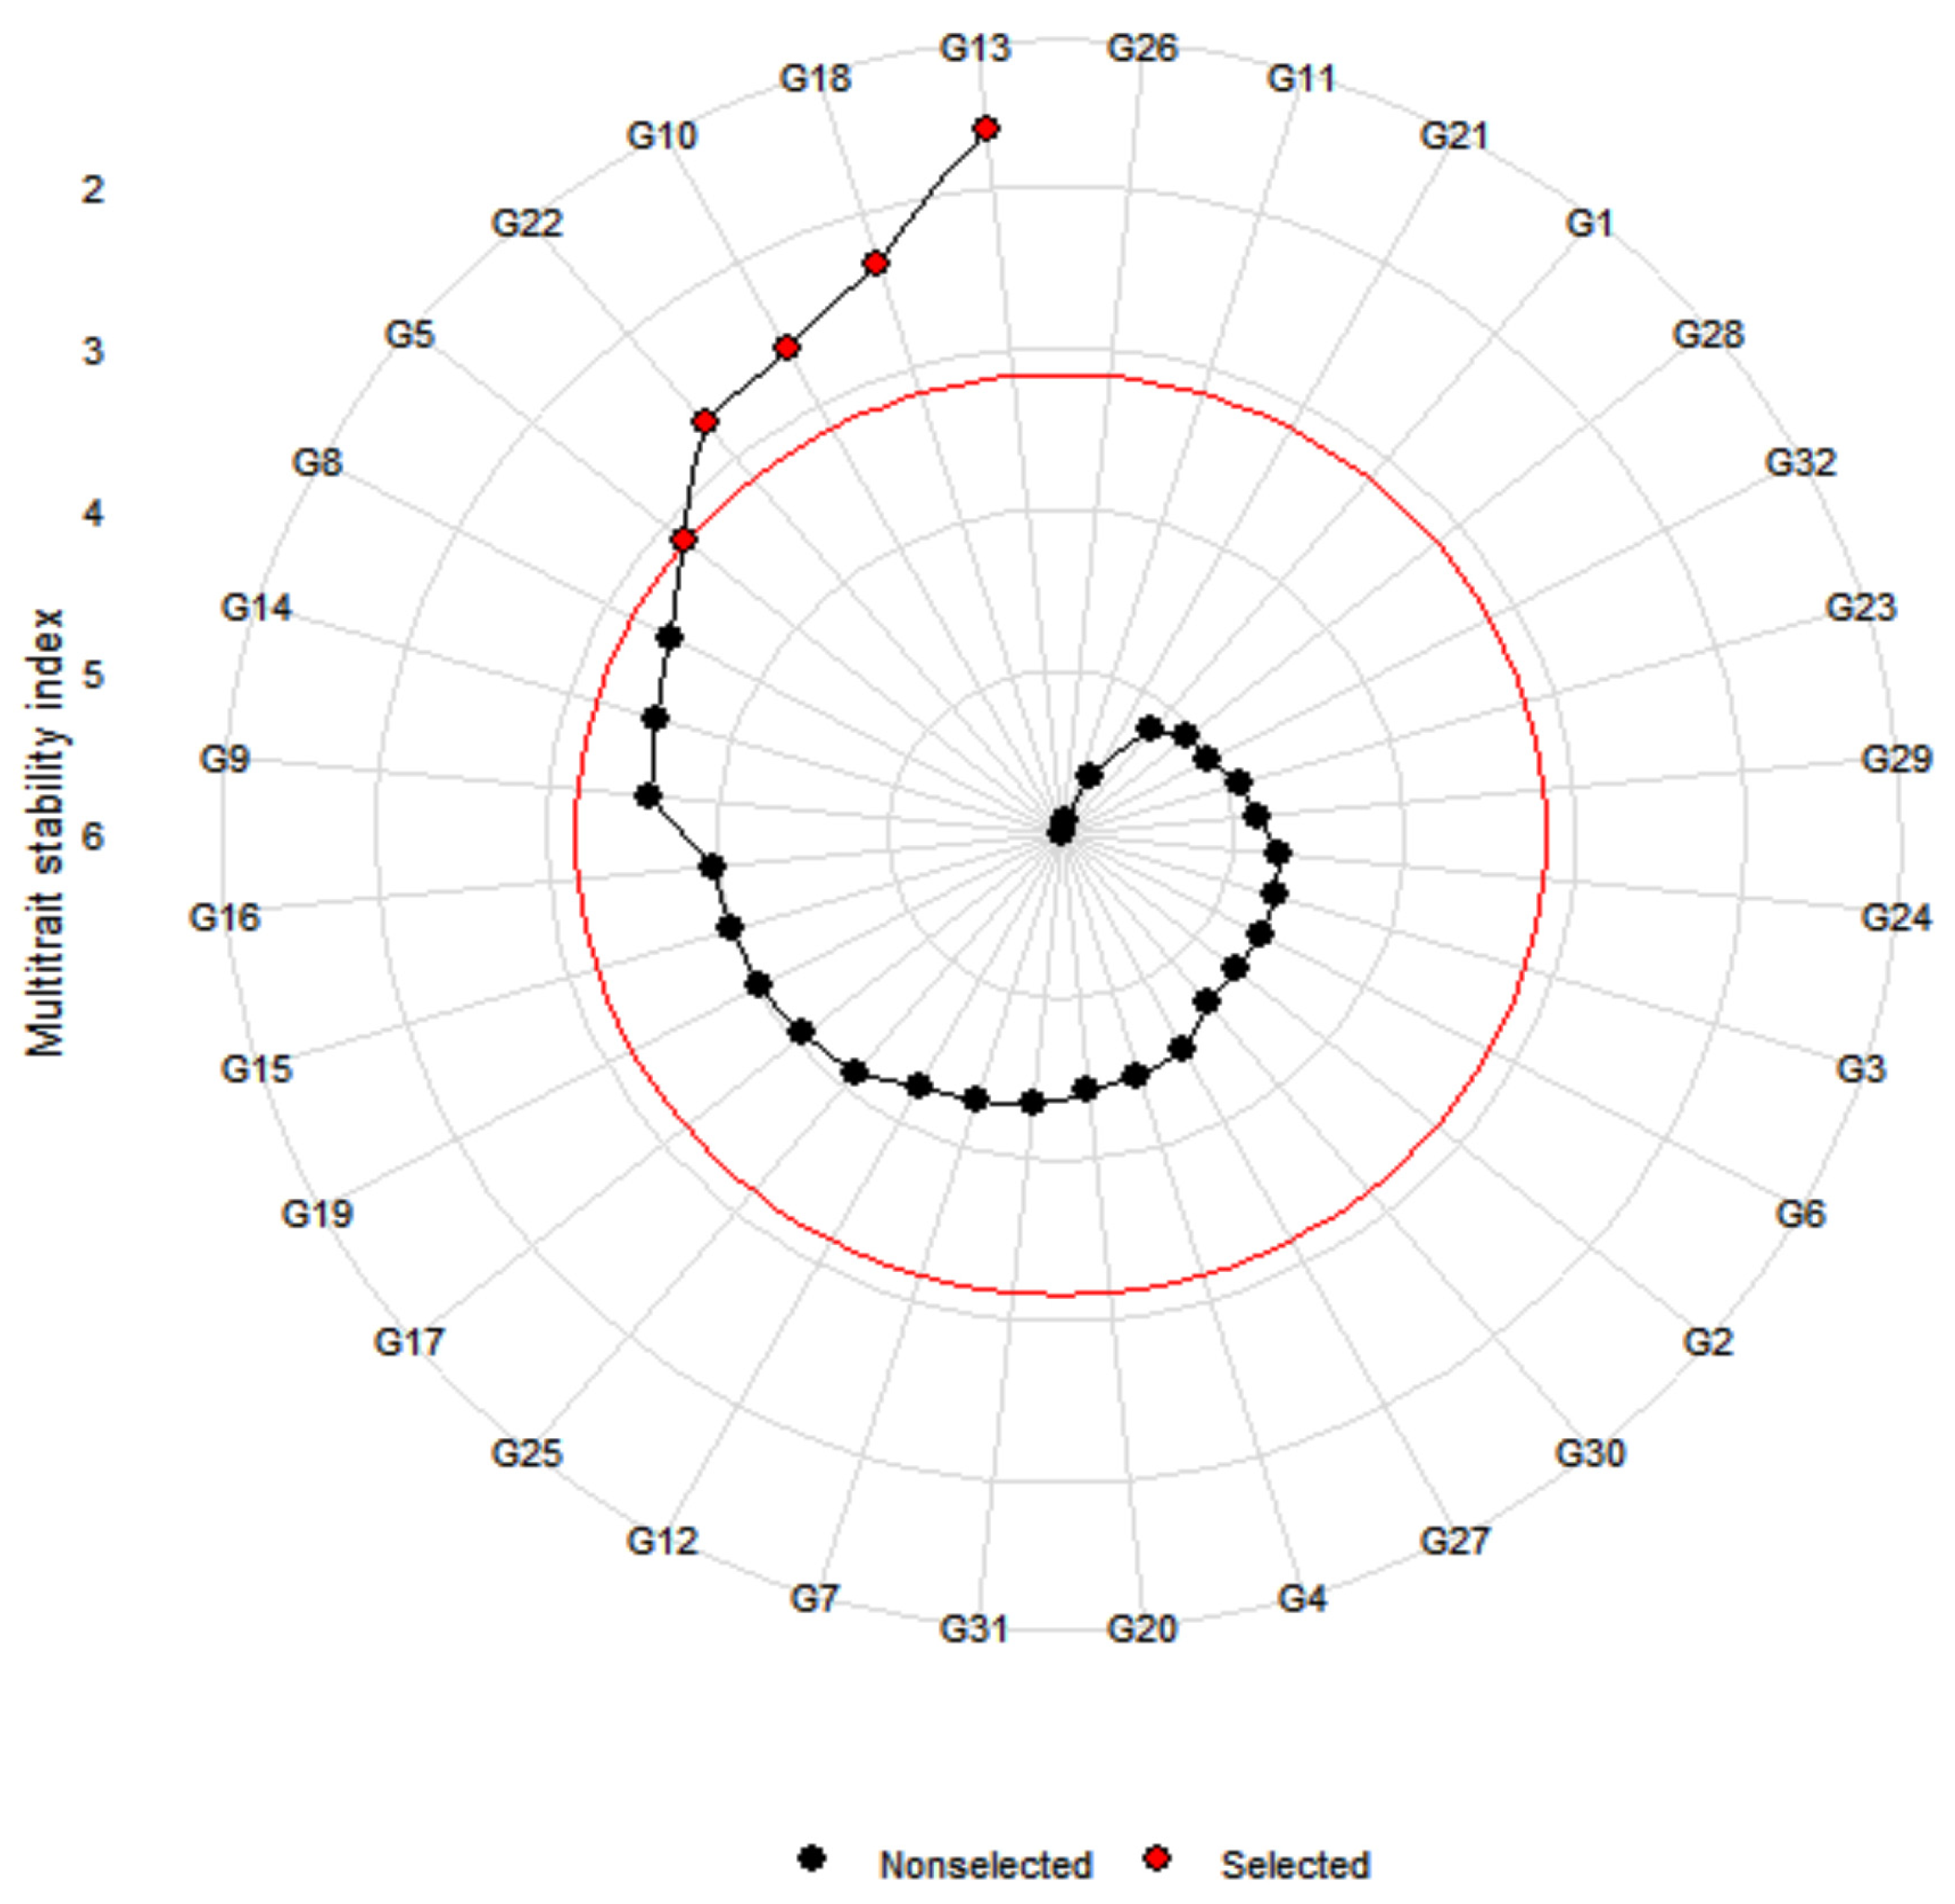
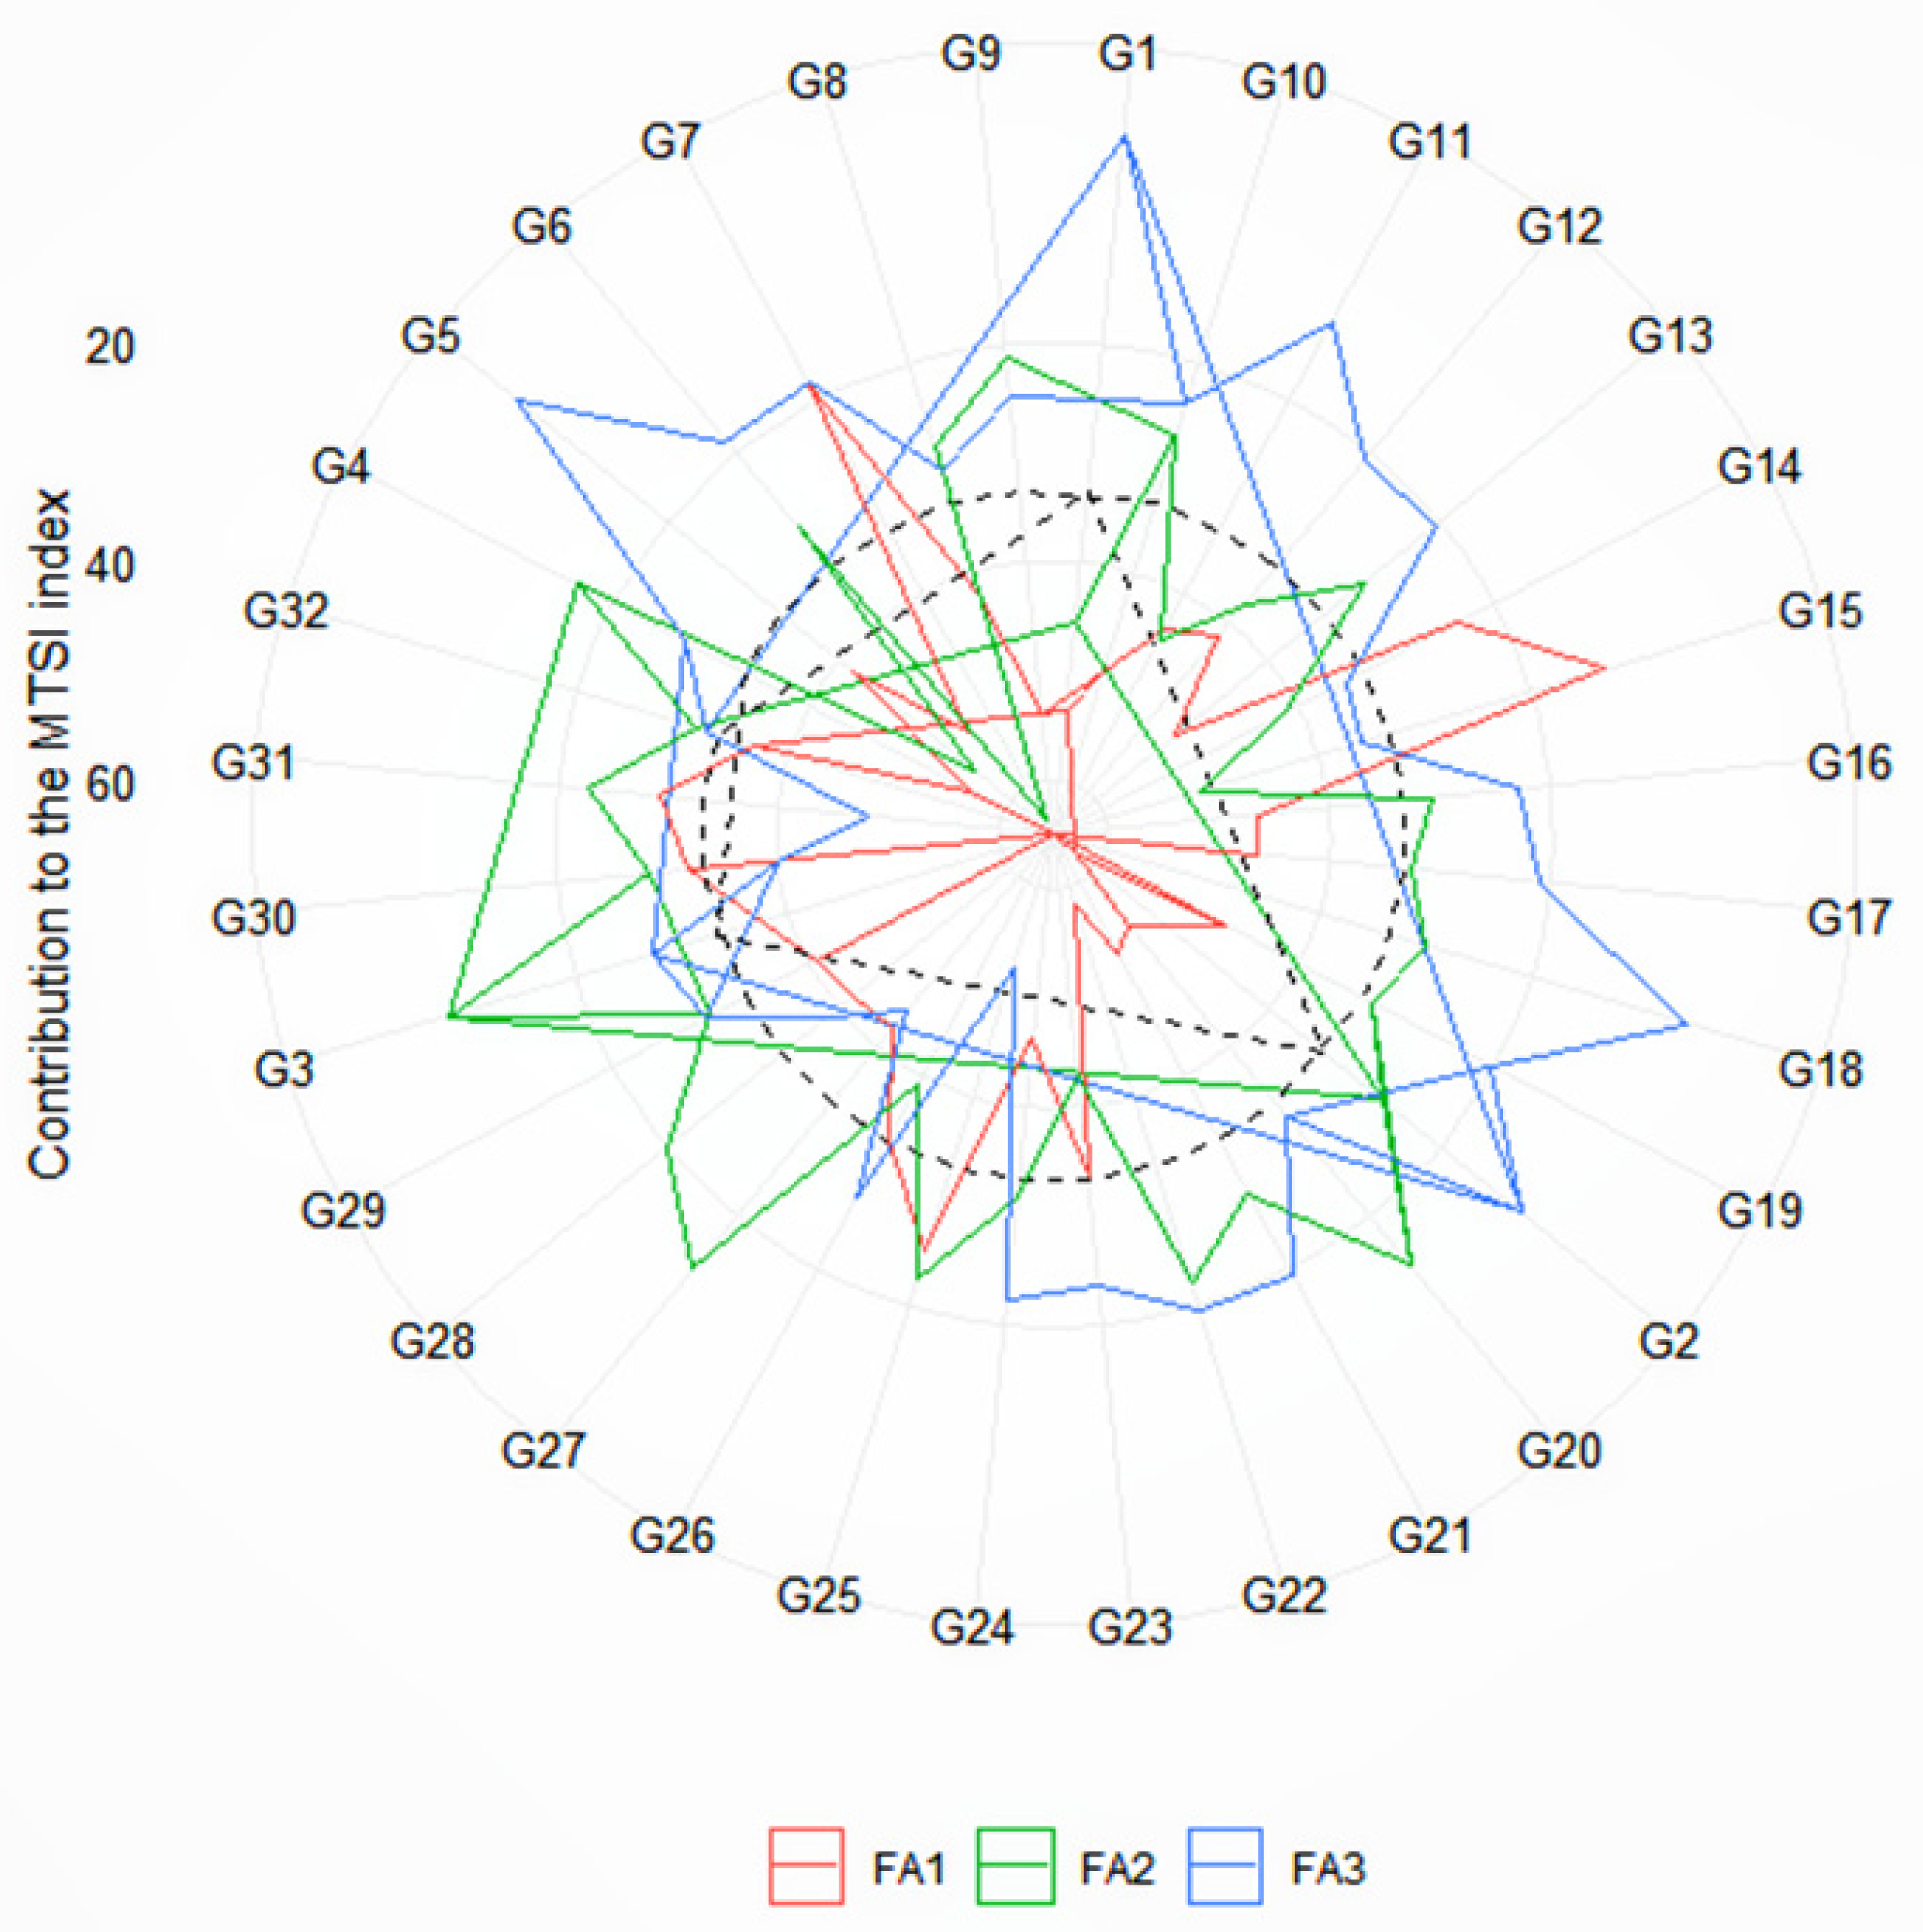
3.4. Multi-Trait Stability Index and Genotype Selection
3.5. The Strengths and Weakness View of the Selected Genotypes
4. Discussion
5. Conclusions
Supplementary Materials
Author Contributions
Funding
Institutional Review Board Statement
Data Availability Statement
Acknowledgments
Conflicts of Interest
References
- Simmonds, N.W. Principles of crop improvement. In Principles of Crop Improvement; Longman: London, UK, 1979. [Google Scholar]
- Taylor, D.C.; Falk, K.C.; Palmer, C.D.; Hammerlindl, J.; Babic, V.; Mietkiewska, E.; Jadhav, A.; Marillia, E.; Francis, T.; Hoffman, T.; et al. Brassica carinata—A new molecular farming platform for delivering bio-industrial oil feedstocks: Case studies of genetic modifications to improve very long-chain fatty acid and oil content in seeds. Biofuels Bioprod. Biorefining 2010, 4, 538–561. [Google Scholar] [CrossRef]
- Leonard, E.C. High-erucic vegetable oils. Ind. Crops Prod. 1992, 1, 119–123. [Google Scholar] [CrossRef]
- McVetty, P.B.; Scarth, R. Breeding for improved oil quality in Brassica oilseed species. J. Crop Prod. 2002, 5, 345–369. [Google Scholar] [CrossRef]
- George, S.; Seepaul, R.; Geller, D.; Dwivedi, P.; DiLorenzo, N.; Altman, R.; Coppola, E.; Miller, S.A.; Bennett, R.; Johnston, G.; et al. A regional inter-disciplinary partnership focusing on the development of a carinata-centered bioeconomy. GCB Bioenergy 2021, 13, 1018–1029. [Google Scholar] [CrossRef]
- Alemayehu, N.; Becker, H. Genotypic diversity and patterns of variation in a germplasm material of Ethiopian mustard (Brassica carinata A. Braun). Genet. Resour. Crop Evol. 2002, 49, 573–582. [Google Scholar] [CrossRef]
- Tesfaye, M.; Feyissa, T.; Hailesilassie, T.; Wang, E.S.; Kanagarajan, S.; Zhu, L.-H. Rapid and Non-Destructive Determination of Fatty Acid Profile and Oil Content in Diverse Brassica carinata Germplasm Using Fourier-Transform Near-Infrared Spectroscopy. Processes 2024, 12, 244. [Google Scholar] [CrossRef]
- Fernandez-Escobar, J.; Dominguez, J.; Martin, A.; Fernandez-Martinez, J. Genetics of the erucic acid content in interspecific hybrids of Ethiopian mustard (Brassies carinata Braun) and rapeseed (B. napus L.). Plant Breed. 1988, 100, 310–315. [Google Scholar] [CrossRef]
- Alemayehu, A. Germplasm Diversity and Genetics of Quality and Agronomic Traits in Ethiopian Mustard (Brassica carinata A. Braun); Cuvillier: Göttingen, Germany, 2001. [Google Scholar]
- Alonso, L.; Fernandez-Serrano, O.; Fernandez-Escobar, J. The outset of a new oilseed crop: Brassica carinata with low erucic acid content. In Proceedings of the 8th International Rapeseed Congress, Saskatoon, SK, Canada, 9–11 July 1991; pp. 659–664. [Google Scholar]
- Getinet, A.; Rakow, G.; Raney, J.; Downey, R. Development of zero erucic acid Ethiopian mustard through an interspecific cross with zero erucic acid Oriental mustard. Can. J. Plant Sci. 1994, 74, 793–795. [Google Scholar] [CrossRef]
- Roslinsky, V.; Falk, K.C.; Gaebelein, R.; Mason, A.S.; Eynck, C. Development of B. carinata with super-high erucic acid content through interspecific hybridization. Theor. Appl. Genet. 2021, 134, 3167–3181. [Google Scholar] [CrossRef]
- Agahi, K.; Ahmadi, J.; Oghan, H.A.; Fotokian, M.H.; Orang, S.F. Analysis of genotype× environment interaction for seed yield in spring oilseed rape using the AMMI model. Crop Breed. Appl. Biotechnol. 2020, 20, e26502012. [Google Scholar] [CrossRef]
- Bocianowski, J.; Niemann, J.; Nowosad, K. Genotype-by-environment interaction for seed quality traits in interspecific cross-derived Brassica lines using additive main effects and multiplicative interaction model. Euphytica 2019, 215, 7. [Google Scholar] [CrossRef]
- Campbell, B.T.; Seepaul, R.; Iboyi, J.E.; Anderson, W.F.; Baldwin, B.S.; Bennett, R.; Crozier, C.R.; George, S.; Hagan, A.K.; Lee, D.; et al. Agronomic performance and the effect of genotype-by-environment interaction for Brassica carinata in the southeastern US. Ind. Crops Prod. 2023, 203, 117196. [Google Scholar] [CrossRef]
- Kirkegaard, J.; Lilley, J.; Berry, P.; Rondanini, D. Crop Physiology Case Histories for Major Crops; Sadras, V., Calderini, D., Eds.; Elsevier: Amsterdam, The Netherlands, 2021; pp. 518–549. [Google Scholar]
- Liersch, A.; Bocianowski, J.; Nowosad, K.; Mikołajczyk, K.; Spasibionek, S.; Wielebski, F.; Matuszczak, M.; Szała, L.; Cegielska-Taras, T.; Sosnowska, K.; et al. Effect of genotype× environment interaction for seed traits in winter oilseed rape (Brassica napus L.). Agriculture 2020, 10, 607. [Google Scholar] [CrossRef]
- Liu, N.; Tang, T.; Fan, Q.; Meng, D.; Li, Z.; Chen, J. Effects of site, sowing date and nitrogen application amount on economical characters, quality traits of high erucic acid rapeseed. J. Gansu Agric. Univ. 2015, 3, 68–72. [Google Scholar]
- Shi, C.; Zhang, H.; Wu, J.; Li, C.; Ren, Y. Genetic and genotype× environment interaction effects analysis for erucic acid content in rapeseed (Brassica napus L.). Euphytica 2003, 130, 249–254. [Google Scholar] [CrossRef]
- Uğur, A.; Süntar, I.; Aslan, S.; Orhan, İ.E.; Kartal, M.; Şekeroğlu, N.; Eşiyok, D.; Şener, B. Variations in fatty acid compositions of the seed oil of Eruca sativa Mill. caused by different sowing periods and nitrogen forms. Pharmacogn. Mag. 2010, 6, 305. [Google Scholar]
- Yan, W.; Hunt, L. Genotype by environment interaction and crop yield. Plant Breed. Rev. 2010, 16, 135–178. [Google Scholar]
- Becker, H.; Leon, J. Stability analysis in plant breeding. Plant Breed. 1988, 101, 1–23. [Google Scholar] [CrossRef]
- Lin, C.-S.; Binns, M.R.; Lefkovitch, L.P. Stability analysis: Where do we stand? Crop Sci. 1986, 26, 894–900. [Google Scholar] [CrossRef]
- Olivoto, T.; Lúcio, A.D.; da Silva, J.A.; Sari, B.G.; Diel, M.I. Mean performance and stability in multi-environment trials II: Selection based on multiple traits. Agron. J. 2019, 111, 2961–2969. [Google Scholar] [CrossRef]
- Van Eeuwijk, F.A.; Bustos-Korts, D.V.; Malosetti, M. What should students in plant breeding know about the statistical aspects of genotype× environment interactions? Crop Sci. 2016, 56, 2119–2140. [Google Scholar] [CrossRef]
- Olivoto, T.; Lúcio, A.D.; da Silva, J.A.; Marchioro, V.S.; de Souza, V.Q.; Jost, E. Mean performance and stability in multi-environment trials I: Combining features of AMMI and BLUP techniques. Agron. J. 2019, 111, 2949–2960. [Google Scholar] [CrossRef]
- Taklewold, A.; Woyessa, B.; Tesfaye, M.; Wakjira, A.; Samali, S.; Ojiewo, C. Good Agricultural Practices for Production of Ethiopian Mustard (Brassica carinata A. Braun) in Sub-Saharan Africa; ISHS: Leuven, Belgium, 2012. [Google Scholar]
- Madson, E. Nuclear magnetic resonance spectrometry: A method of determination of oil content in rapeseed oil. J. Am. Oil Chem. Soc. 1976, 53, 467–469. [Google Scholar] [CrossRef]
- Olivoto, T.; Lúcio, A.D.C. metan: An R package for multi-environment trial analysis. Methods Ecol. Evol. 2020, 11, 783–789. [Google Scholar] [CrossRef]
- Yang, R.C. Mixed-model analysis of crossover genotype–environment interactions. Crop Sci. 2007, 47, 1051–1062. [Google Scholar] [CrossRef]
- Dempster, A.P.; Laird, N.M.; Rubin, D.B. Maximum likelihood from incomplete data via the EM algorithm. J. R. Stat. Soc. Ser. B (Methodol.) 1977, 39, 1–22. [Google Scholar] [CrossRef]
- Shafii, B.; Price, W.J. Analysis of genotype-by-environment interaction using the additive main effects and multiplicative interaction model and stability estimates. J. Agric. Biol. Environ. Stat. 1998, 3, 335–345. [Google Scholar] [CrossRef]
- Kumar, S.; Seepaul, R.; Mulvaney, M.J.; Colvin, B.; George, S.; Marois, J.J.; Bennett, R.; Leon, R.; Wright, D.L.; Small, I.M. Brassica carinata genotypes demonstrate potential as a winter biofuel crop in South East United States. Ind. Crops Prod. 2020, 150, 112353. [Google Scholar] [CrossRef]
- Bernardo, R. Breeding for Quantitative Traits in Plants; Stemma Press: Woodbury, NY, USA, 2002. [Google Scholar]
- Kang, M. Understanding and Utilization of Genotype-by-Environment Interaction in Plant Breeding; Genotype-by-Environment Interaction and Plant Breeding, Louisiana St. University, Agricultural Center: Baton Rouge, LA, USA, 1990; pp. 52–68. [Google Scholar]
- Redda, Z.T.; Laß-Seyoum, A.; Yimam, A.; Barz, M.; Jabasingh, S.A. Solvent extraction and characterization of Brassica carinata oils as promising alternative feedstock for bio-jet fuel production. Biomass Convers. Biorefinery 2022, 14, 1–20. [Google Scholar] [CrossRef]

| Traits | Mean ± SD | Max. | Min | LRTg | LRTgxe |
|---|---|---|---|---|---|
| DF | 70.88 ± 7.43 | 96 | 53 | 111.33 *** | 579.31 *** |
| DM | 149.95 ± 5.52 | 166 | 129 | 112.09 *** | 263.76 *** |
| PH | 150.54 ± 19.14 | 194 | 97 | 41.18 *** | 1191.90 *** |
| NPB | 8.3 ± 1.69 | 13 | 5 | 153.87 *** | 34.03 *** |
| NPP | 246.74 ± 44.17 | 370 | 110 | 50.44 *** | 1058.15 *** |
| TSW | 4.13 ± 0.54 | 6.0 | 3.0 | 168.72 *** | 93.94 *** |
| SYD | 2490.63 ± 580.52 | 3986.35 | 1403.47 | 126.6 *** | 1254.8 *** |
| OC | 41.63 ± 3.69 | 50.65 | 30.9 | 53.74 *** | 732.59 *** |
| EA | 43.12 ± 2.62 | 49.78 | 35.51 | 28.39 *** | 807.51 *** |
| Genetic Parameters | Traits | ||||||||
|---|---|---|---|---|---|---|---|---|---|
| DF | DM | PH | NPB | NPP | TSW | SYD | OC | EA | |
| PV | 52.43 | 17.58 | 318.9 | 2.09 | 1347 | 0.26 | 30,289 | 10.90 | 6.85 |
| Heritability | 0.61 | 0.58 | 0.38 | 0.58 | 0.42 | 0.66 | 0.67 | 0.43 | 0.30 |
| GEIr2 | 0.34 | 0.29 | 0.61 | 0.12 | 0.56 | 0.15 | 0.33 | 0.53 | 0.66 |
| h2mg | 0.91 | 0.91 | 0.79 | 0.94 | 0.82 | 0.95 | 0.92 | 0.83 | 0.73 |
| AS | 0.96 | 0.96 | 0.89 | 0.97 | 0.90 | 0.97 | 0.96 | 0.90 | 0.85 |
| rge | 0.88 | 0.68 | 0.98 | 0.27 | 0.97 | 0.45 | 0.98 | 0.92 | 0.94 |
| cvg | 8.01 | 2.13 | 7.28 | 13.24 | 9.64 | 10.02 | 18.06 | 5.18 | 3.32 |
| cvr | 2.18 | 0.99 | 1.38 | 9.62 | 2.00 | 5.35 | 1.72 | 1.66 | 1.27 |
| cv ratio | 3.67 | 2.14 | 5.28 | 1.38 | 4.82 | 1.88 | 10.48 | 3.12 | 2.63 |
| Traits | FA1 | FA2 | FA3 | Communality | Uniqueness |
|---|---|---|---|---|---|
| DF | −0.086 | −0.412 | −0.688 | 0.650 | 0.350 |
| DM | 0.077 | −0.921 | 0.083 | 0.861 | 0.139 |
| PH | 0.091 | −0.724 | −0.388 | 0.684 | 0.316 |
| NPB | 0.925 | −0.132 | 0.178 | 0.904 | 0.096 |
| NPP | 0.633 | −0.508 | −0.208 | 0.702 | 0.298 |
| TSW | 0.912 | 0.095 | −0.096 | 0.850 | 0.150 |
| SYD | 0.738 | −0.305 | −0.319 | 0.740 | 0.260 |
| OC | 0.557 | 0.165 | −0.555 | 0.645 | 0.355 |
| EA | 0.141 | −0.046 | −0.868 | 0.775 | 0.255 |
| Eigenvalues | 3.694 | 1.821 | 1.297 | ||
| Variance | 41.04 | 20.23 | 14.41 | ||
| Accumulated, % | 41.04 | 61.27 | 75.69 |
| Factor | Traits | Xo | Xs | SD | SD (%) |
|---|---|---|---|---|---|
| FA 1 | NPB | 8.230 | 8.9 | 0.60 | 7.26 |
| FA 1 | NPP | 246.7 | 281.7 | 35 | 14.18 |
| FA 1 | TSW | 4.13 | 4.41 | 0.28 | 6.77 |
| FA 1 | SYD | 2491 | 3185 | 694.2 | 27.87 |
| FA 1 | OC | 41.63 | 45.10 | 3.48 | 8.36 |
| FA 2 | DM | 150 | 147.2 | −2.73 | −1.82 |
| FA 2 | PH | 150.5 | 141.1 | −9.44 | −6.27 |
| FA 3 | DF | 70.88 | 65.86 | −5.03 | −7.09 |
| FA 3 | EA | 43.12 | 45.68 | 2.56 | 5.94 |
| Factor | Traits | h2 | SG | SG% | Sense | Goal |
|---|---|---|---|---|---|---|
| FA 1 | NPB | 0.94 | 0.57 | 6.83 | Increase | 100 |
| FA 1 | NPP | 0.82 | 28.56 | 11.57 | Increase | 100 |
| FA 1 | TSW | 0.95 | 0.27 | 6.42 | Increase | 100 |
| FA 1 | SYD | 0.92 | 641.7 | 25.77 | Increase | 100 |
| FA 1 | OC | 0.83 | 2.87 | 6.89 | Increase | 100 |
| FA 2 | DM | 0.91 | −2.494 | −1.66 | Decrease | 100 |
| FA 2 | PH | 0.79 | −7.43 | −4.93 | Decrease | 100 |
| FA 3 | DF | 0.91 | −4.58 | −6.47 | Decrease | 100 |
| FA 3 | EA | 0.73 | 1.87 | 4.33 | Increase | 100 |
Disclaimer/Publisher’s Note: The statements, opinions and data contained in all publications are solely those of the individual author(s) and contributor(s) and not of MDPI and/or the editor(s). MDPI and/or the editor(s) disclaim responsibility for any injury to people or property resulting from any ideas, methods, instructions or products referred to in the content. |
© 2024 by the authors. Licensee MDPI, Basel, Switzerland. This article is an open access article distributed under the terms and conditions of the Creative Commons Attribution (CC BY) license (https://creativecommons.org/licenses/by/4.0/).
Share and Cite
Tesfaye, M.; Feyissa, T.; Hailesilassie, T.; Mengistu, B.; Kanagarajan, S.; Zhu, L.-H. Identification of High Erucic Acid Brassica carinata Genotypes through Multi-Trait Stability Index. Agriculture 2024, 14, 1100. https://doi.org/10.3390/agriculture14071100
Tesfaye M, Feyissa T, Hailesilassie T, Mengistu B, Kanagarajan S, Zhu L-H. Identification of High Erucic Acid Brassica carinata Genotypes through Multi-Trait Stability Index. Agriculture. 2024; 14(7):1100. https://doi.org/10.3390/agriculture14071100
Chicago/Turabian StyleTesfaye, Misteru, Tileye Feyissa, Teklehaimanot Hailesilassie, Birhanu Mengistu, Selvaraju Kanagarajan, and Li-Hua Zhu. 2024. "Identification of High Erucic Acid Brassica carinata Genotypes through Multi-Trait Stability Index" Agriculture 14, no. 7: 1100. https://doi.org/10.3390/agriculture14071100
APA StyleTesfaye, M., Feyissa, T., Hailesilassie, T., Mengistu, B., Kanagarajan, S., & Zhu, L.-H. (2024). Identification of High Erucic Acid Brassica carinata Genotypes through Multi-Trait Stability Index. Agriculture, 14(7), 1100. https://doi.org/10.3390/agriculture14071100