
Study on the Drying Characteristics and Physicochemical Properties of Alfalfa under High-Voltage Discharge Plasma

 , ,
, ,
Abstract
1. Introduction
2. Materials and Methods
2.1. Experimental Materials
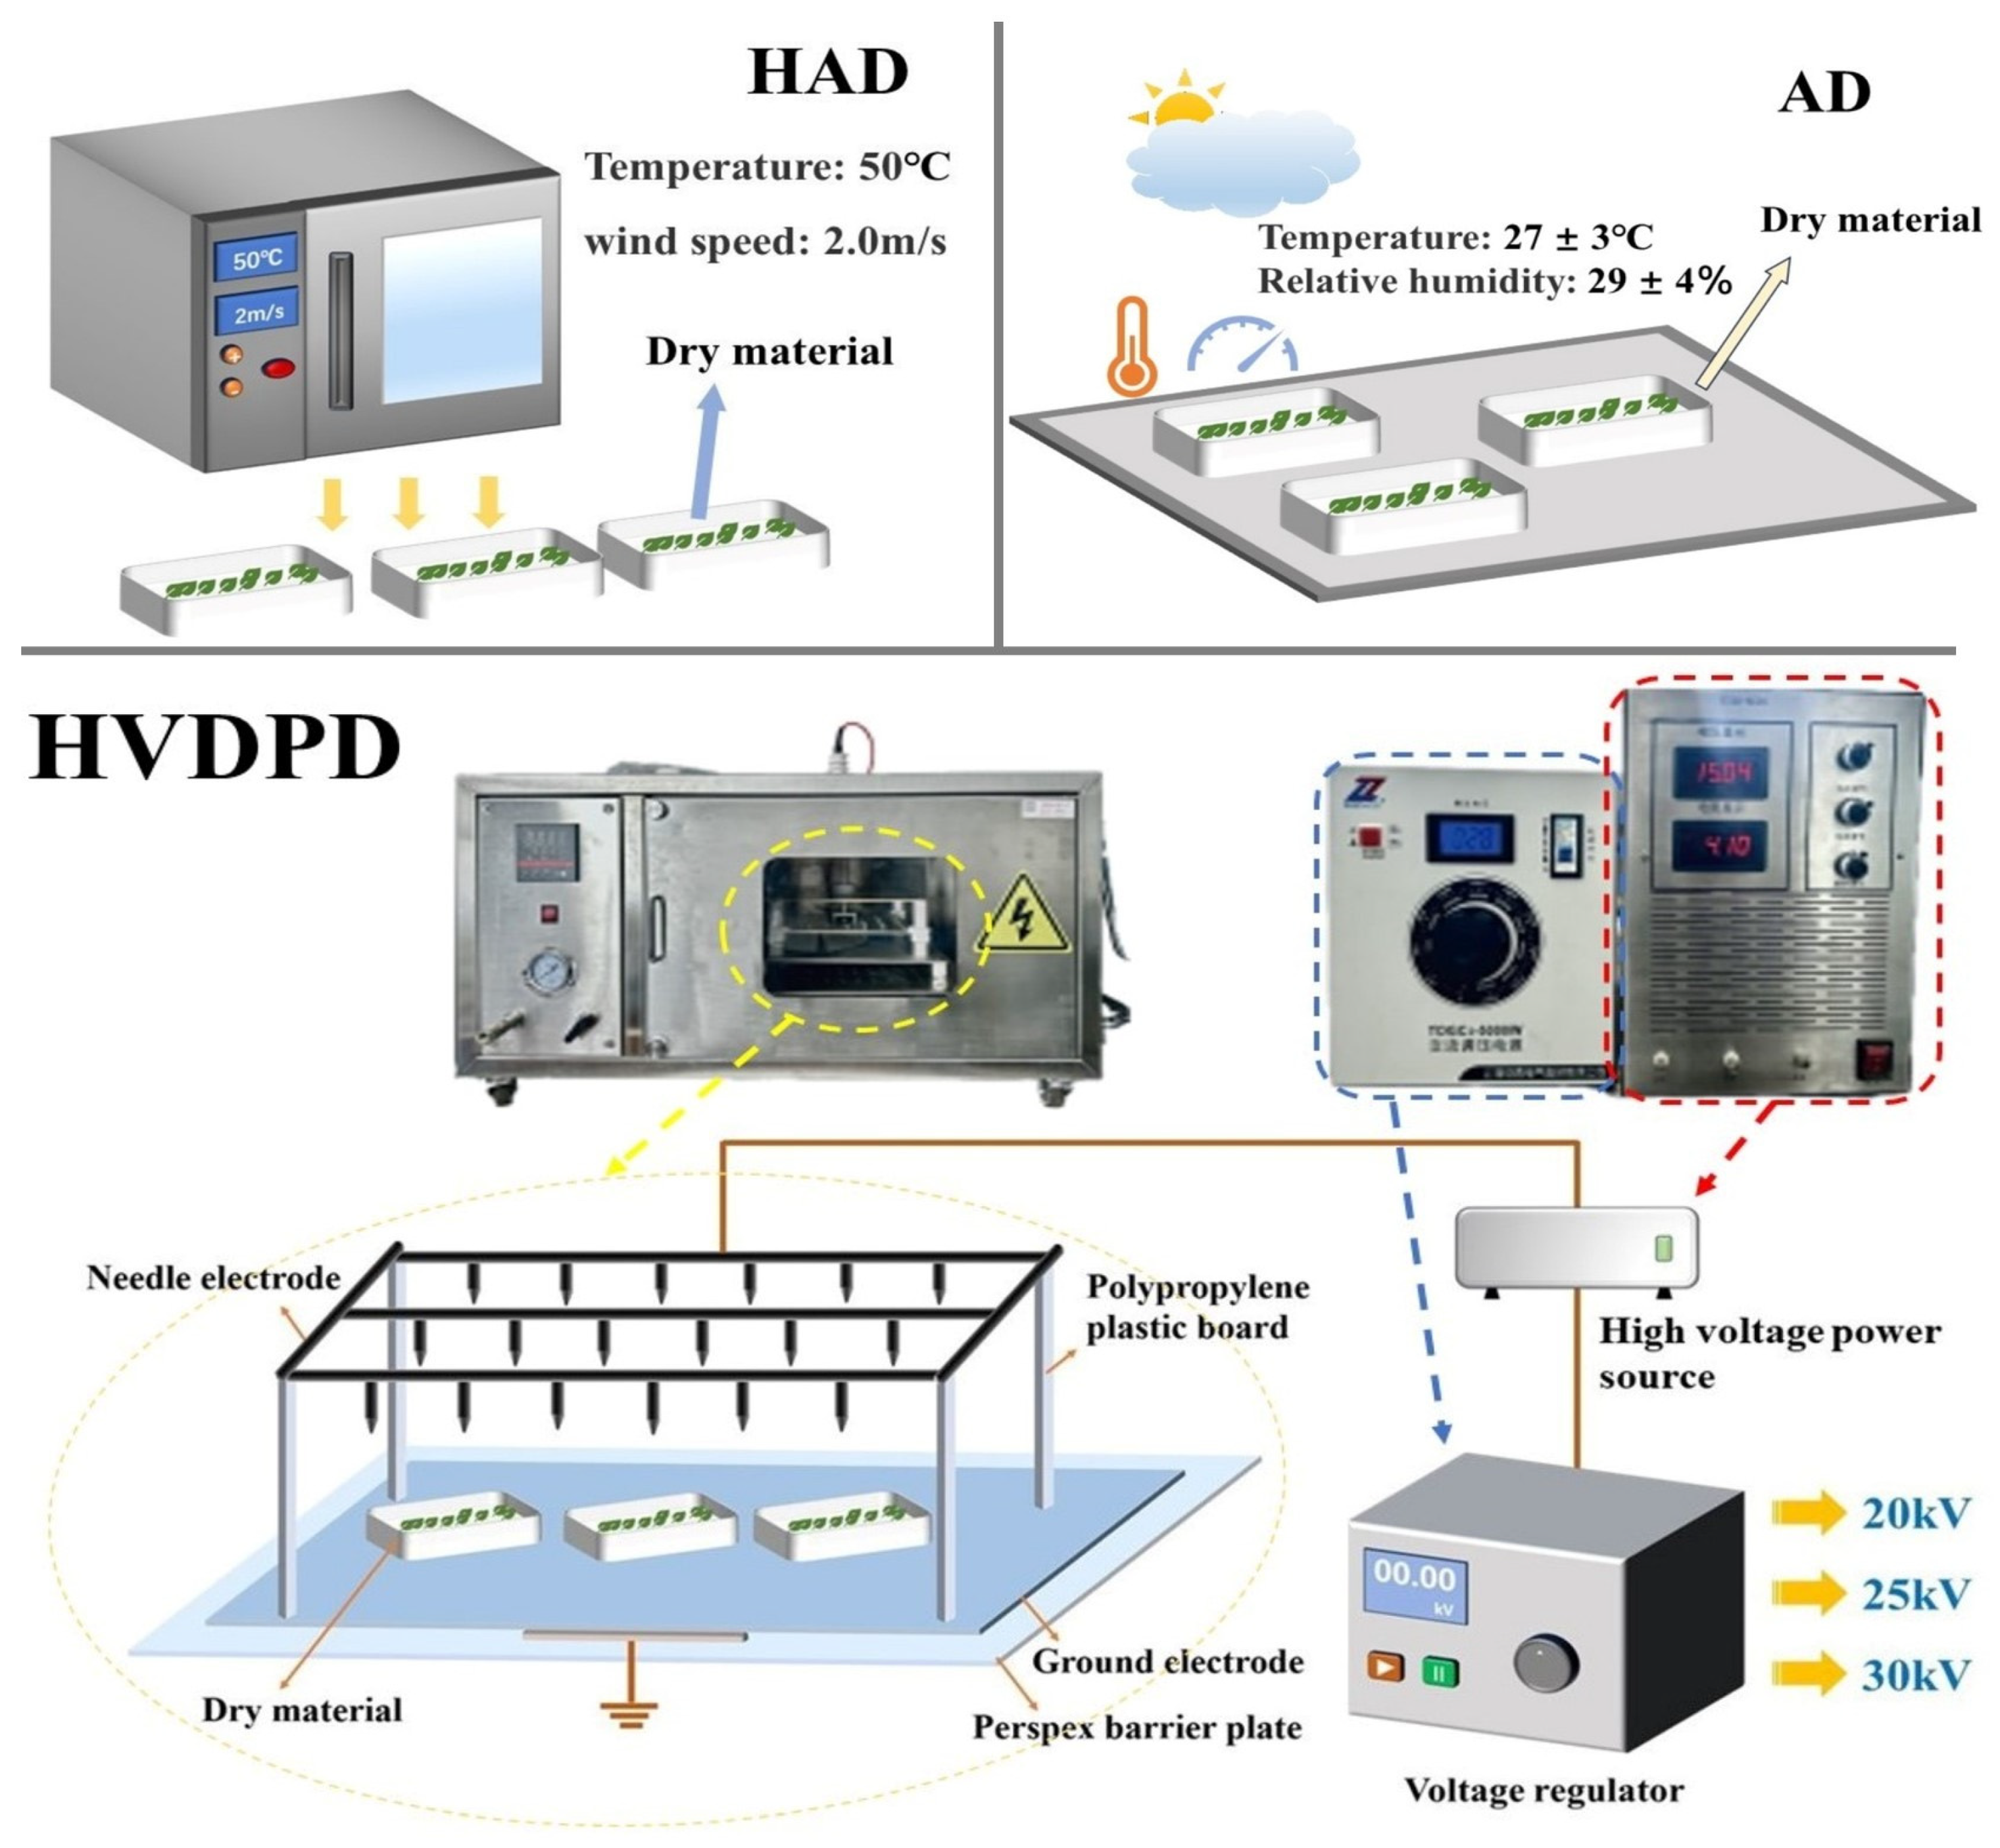
2.2. Instruments and Equipment
2.3. Empirical Method
2.4. Voltage, Current, and Power Parameter Diagnosis
2.5. Analysis of Drying Characteristics
2.5.1. Determination of Moisture Content
2.5.2. Drying Rate
2.6. Analysis of Rehydration Characteristics
2.7. Scanning Electron Microscopy (SEM)
2.8. Color Analysis
2.9. Infrared Spectroscopic Analysis
2.10. Determination of Nutritional Components
2.11. Statistical Analysis
3. Results
3.1. HVDPD Parameters
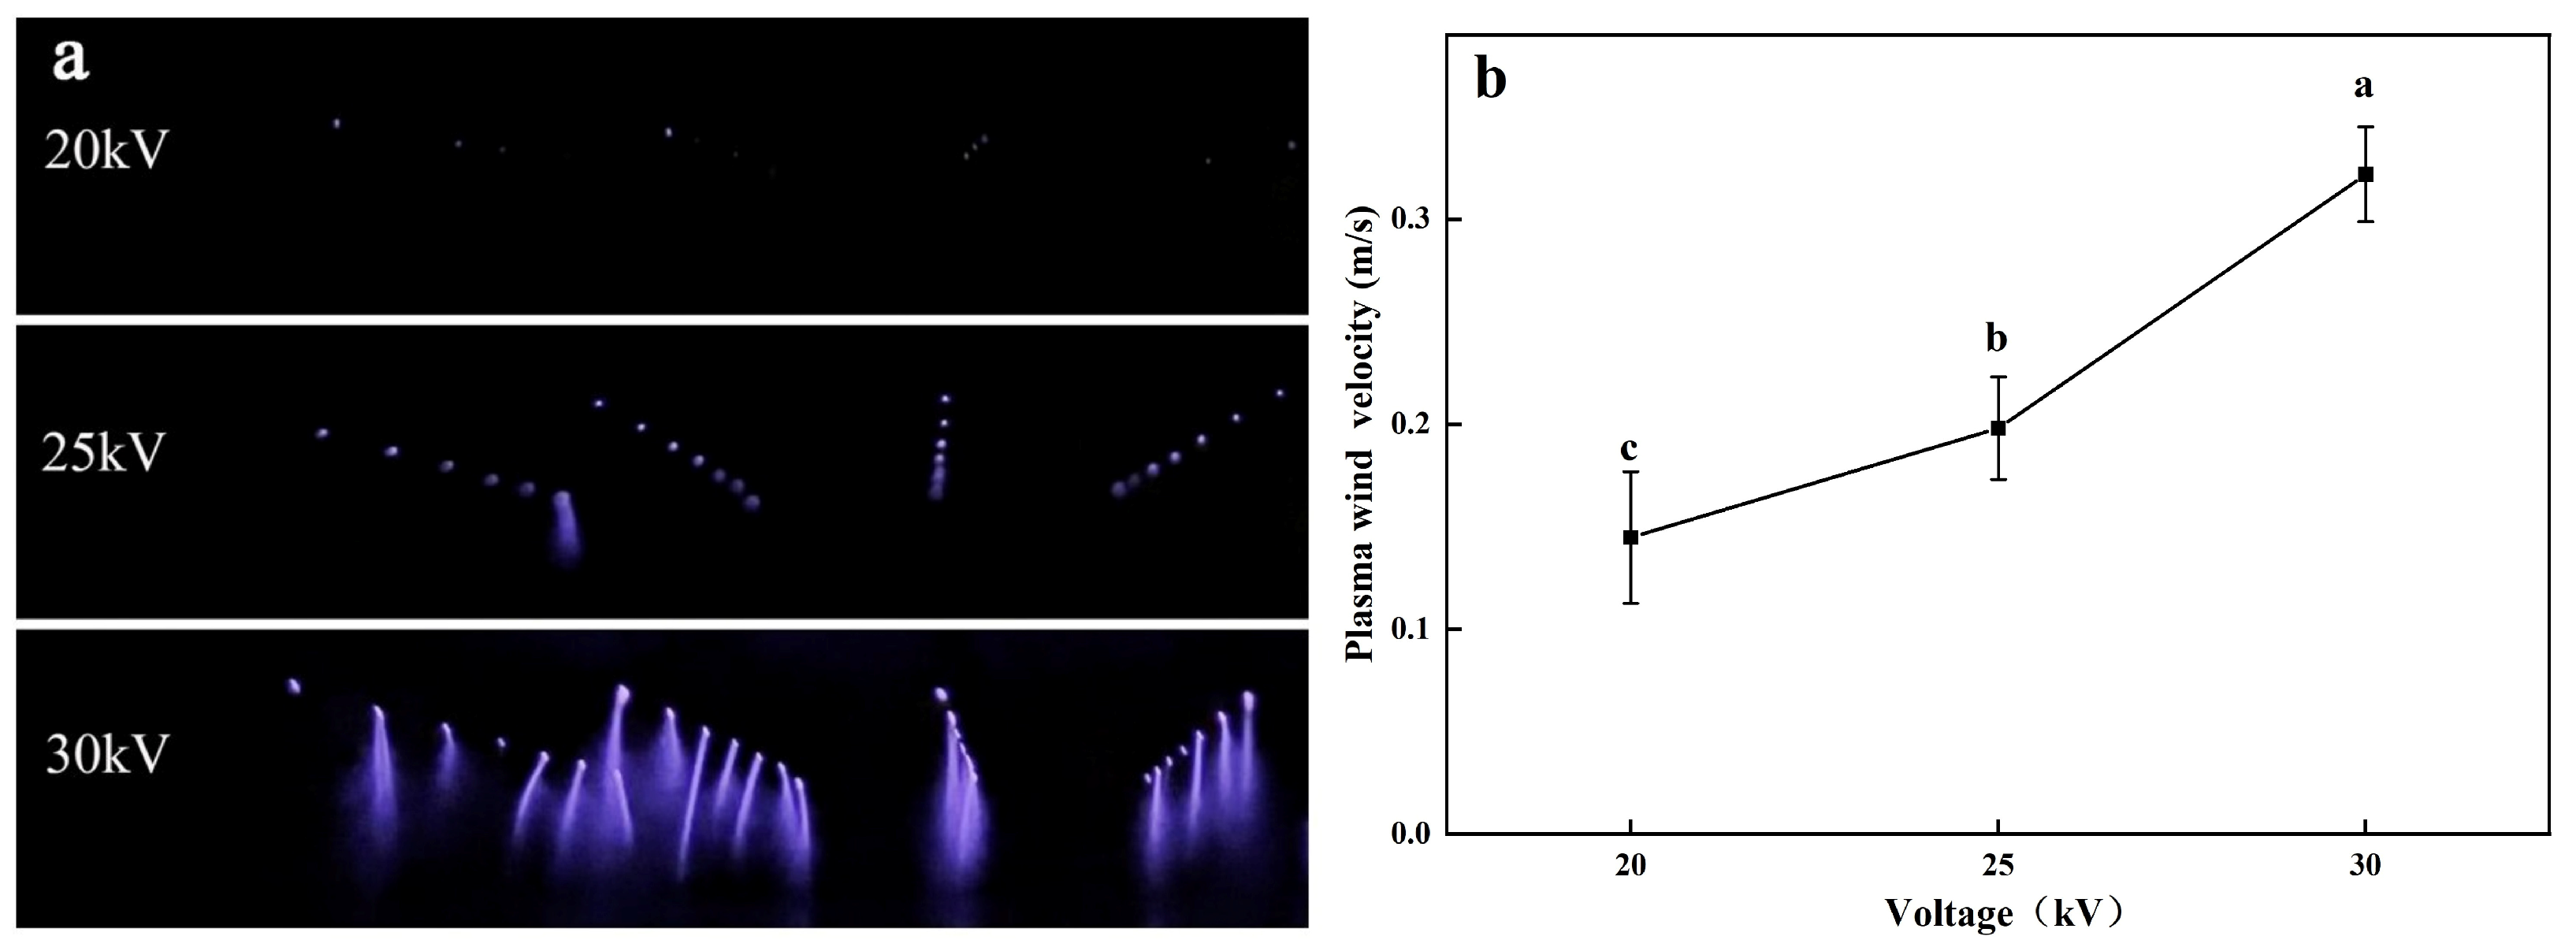
3.1.1. Discharge Morphology and Plasma Wind
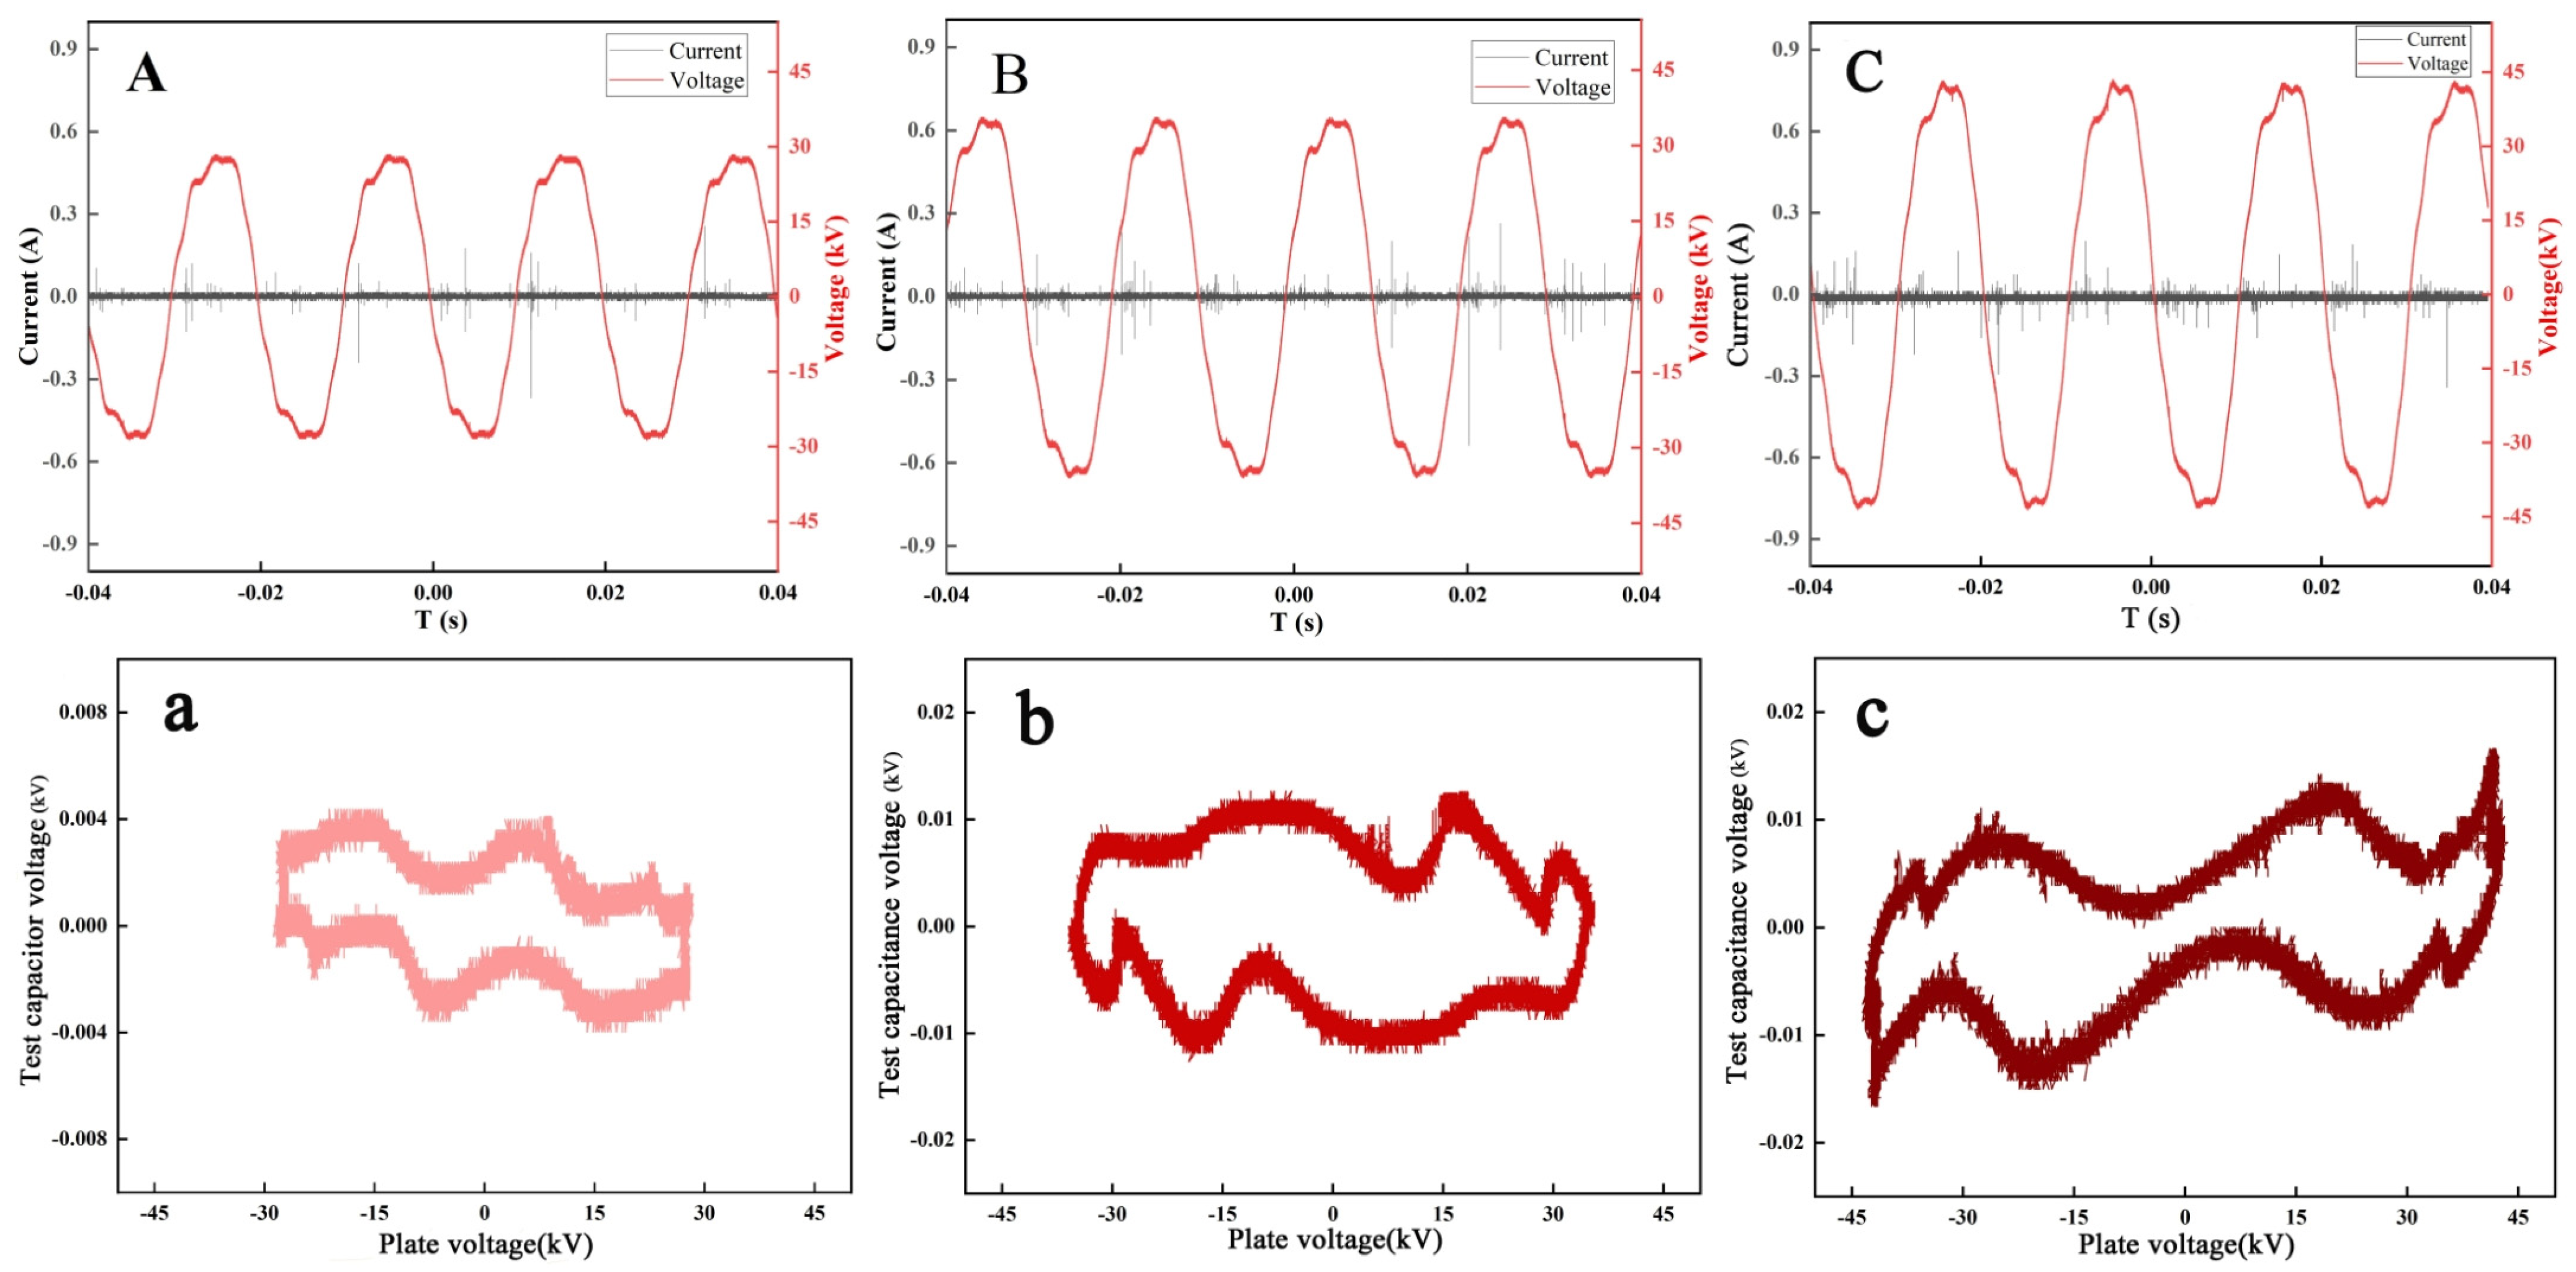
3.1.2. Discharge Power
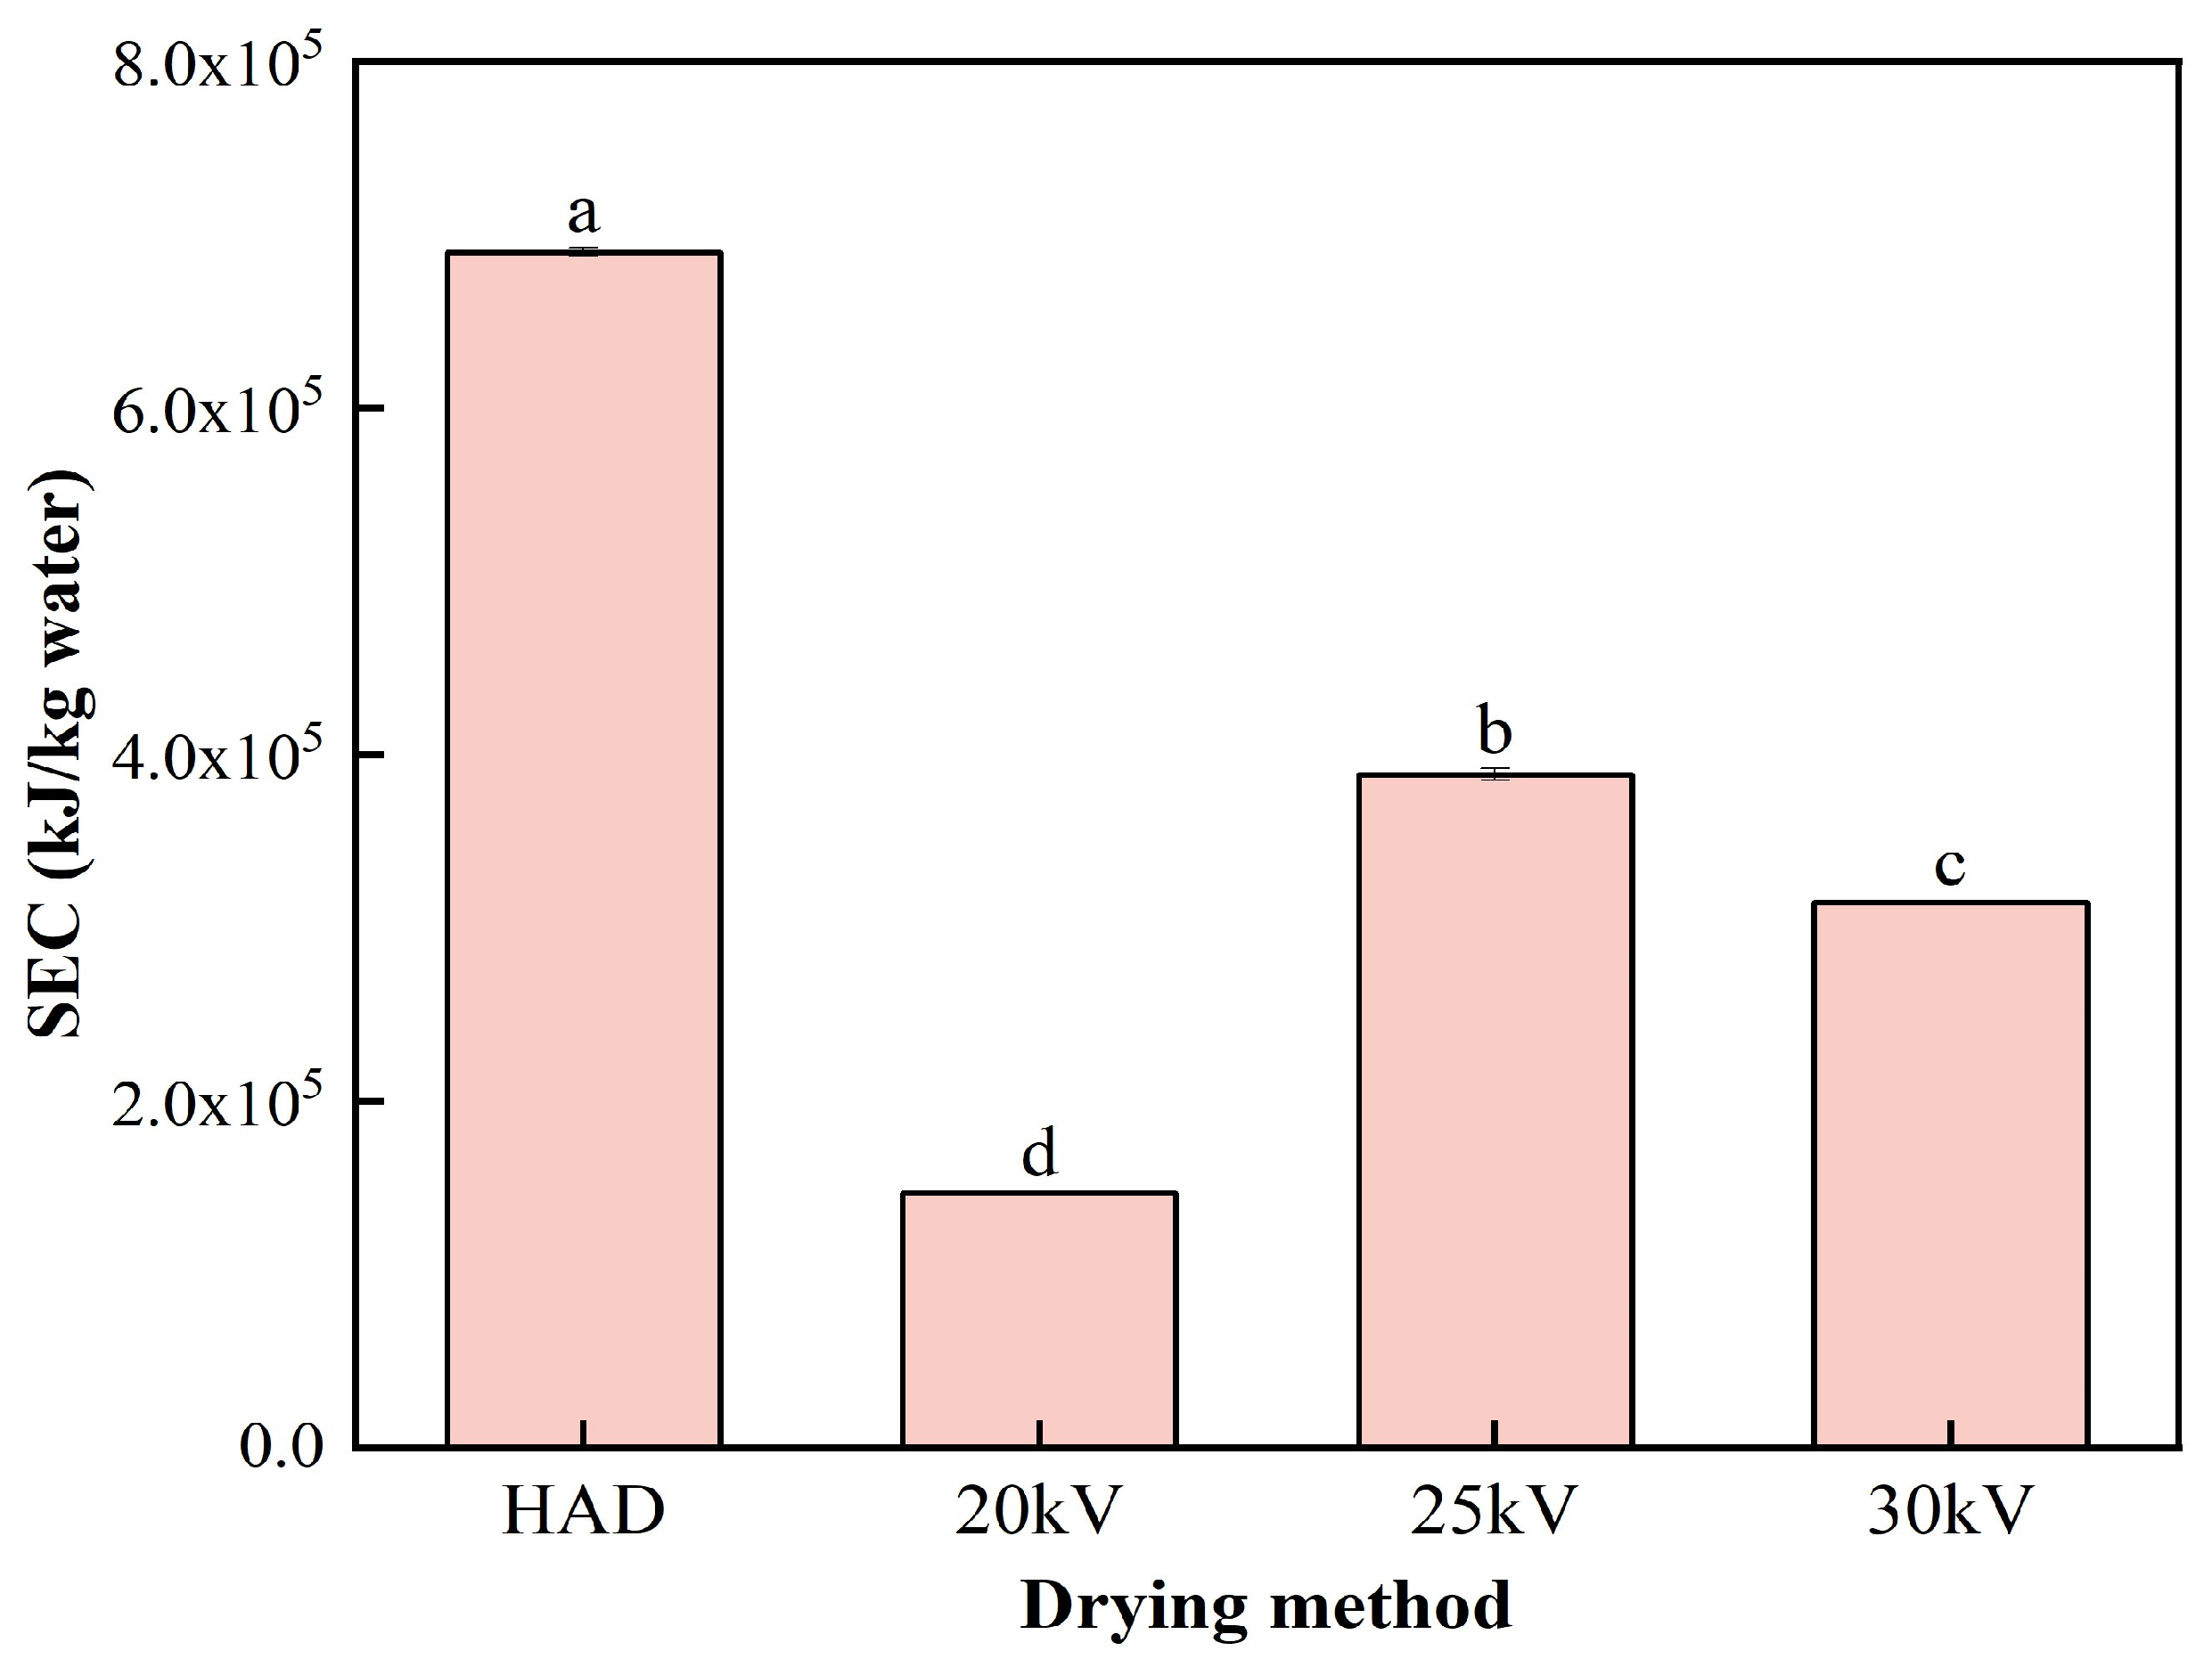
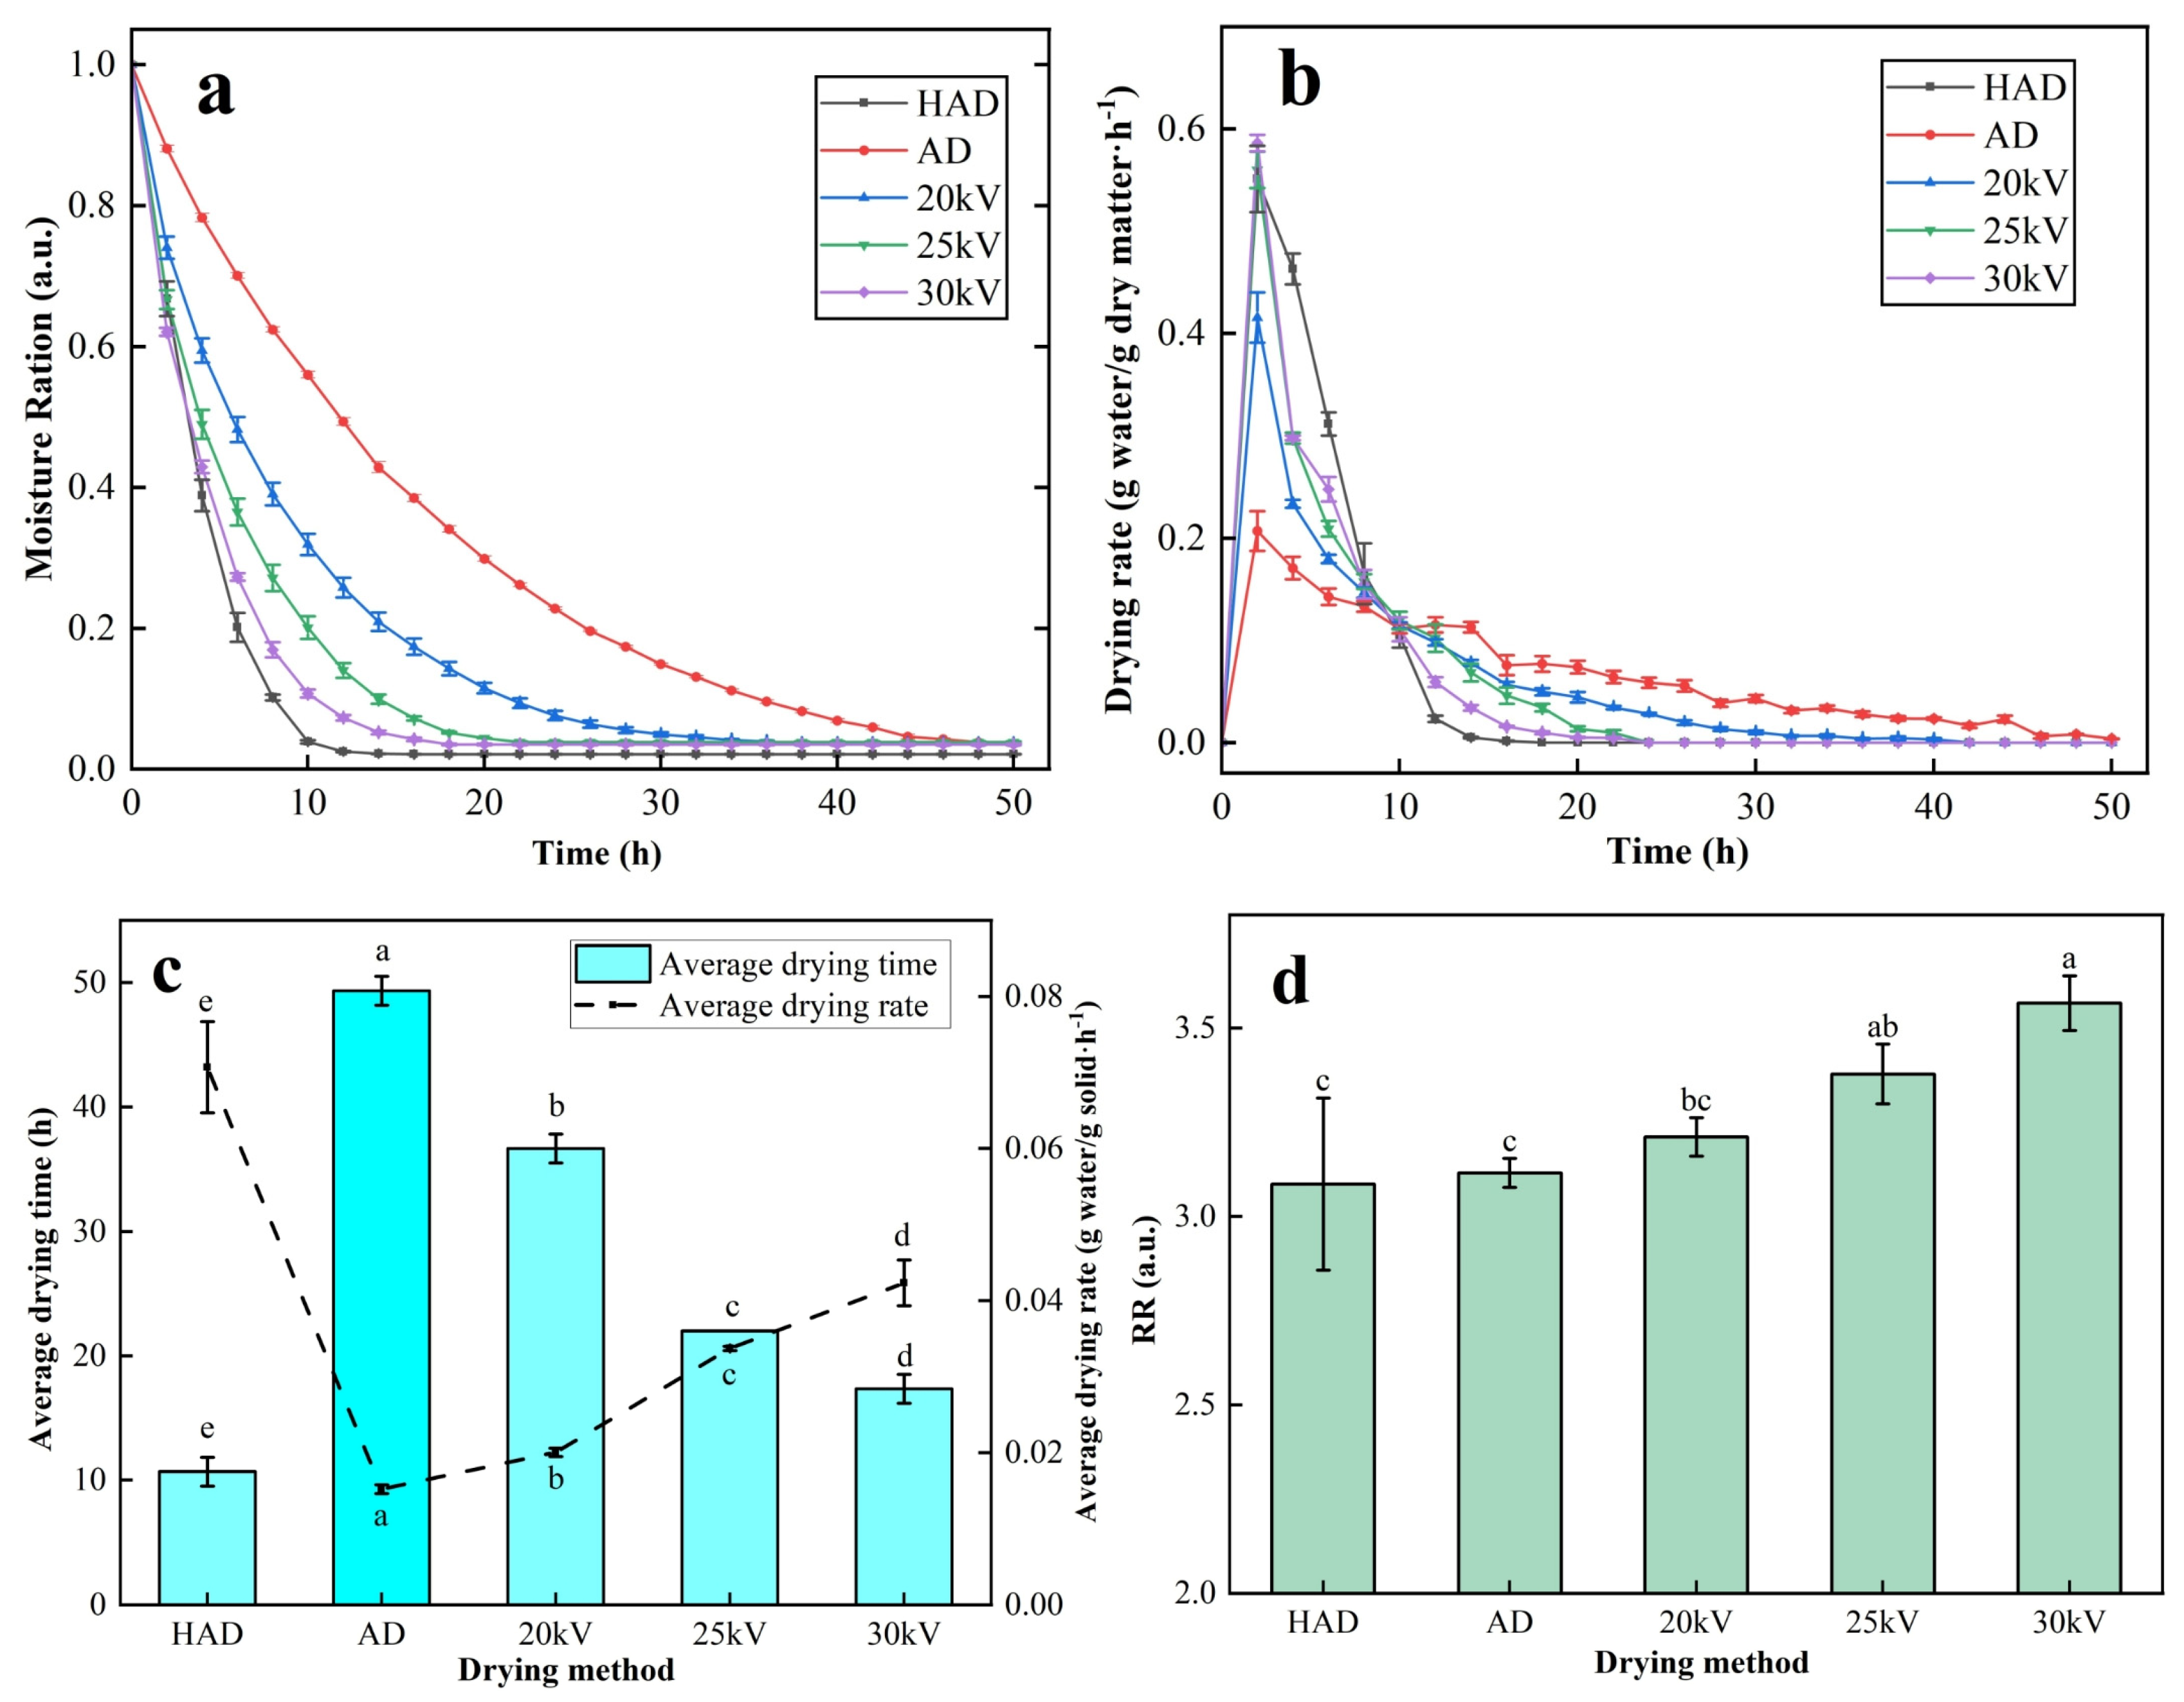
3.2. Analysis of Drying Characteristics
3.3. Analysis of Rehydration Characteristics
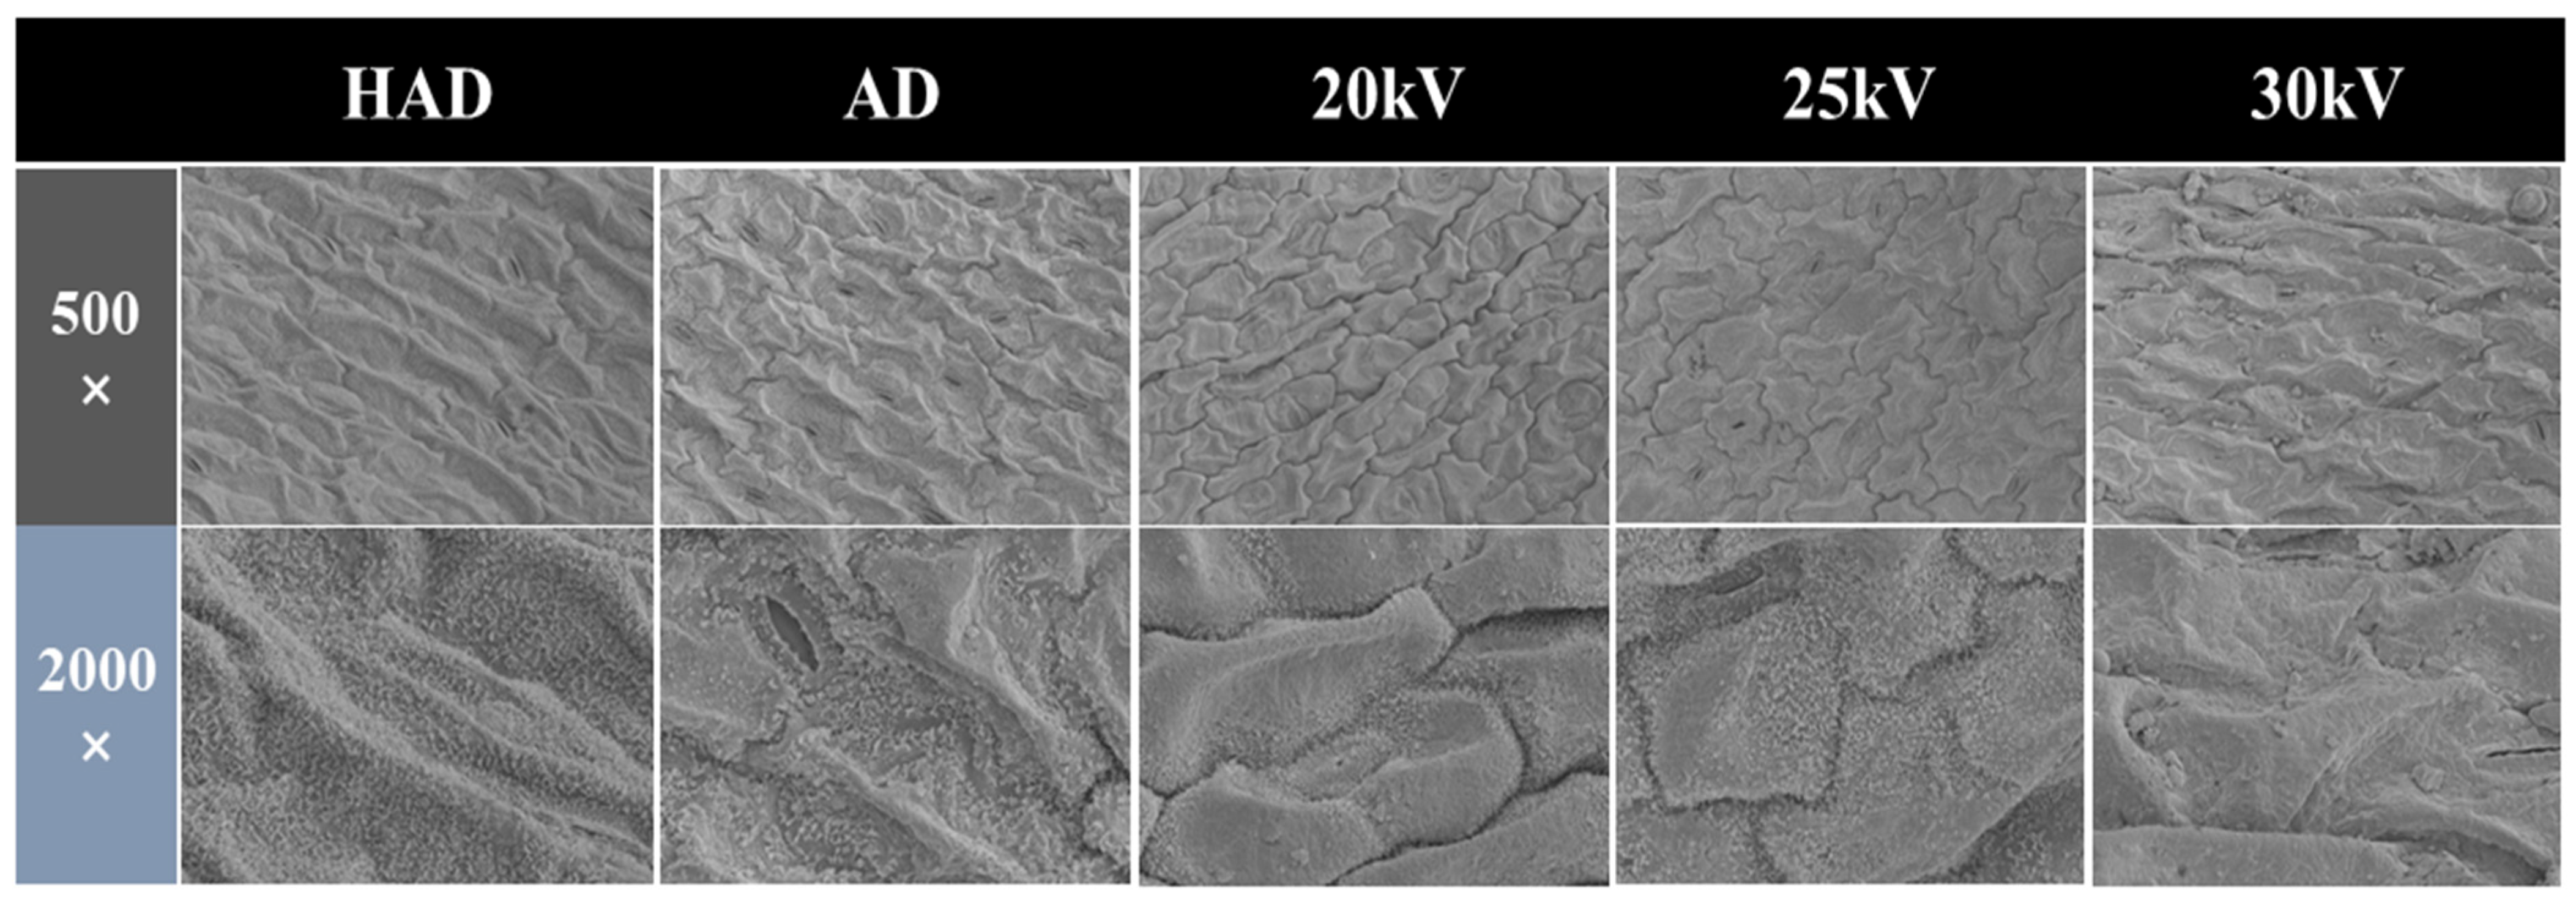
3.4. SEM
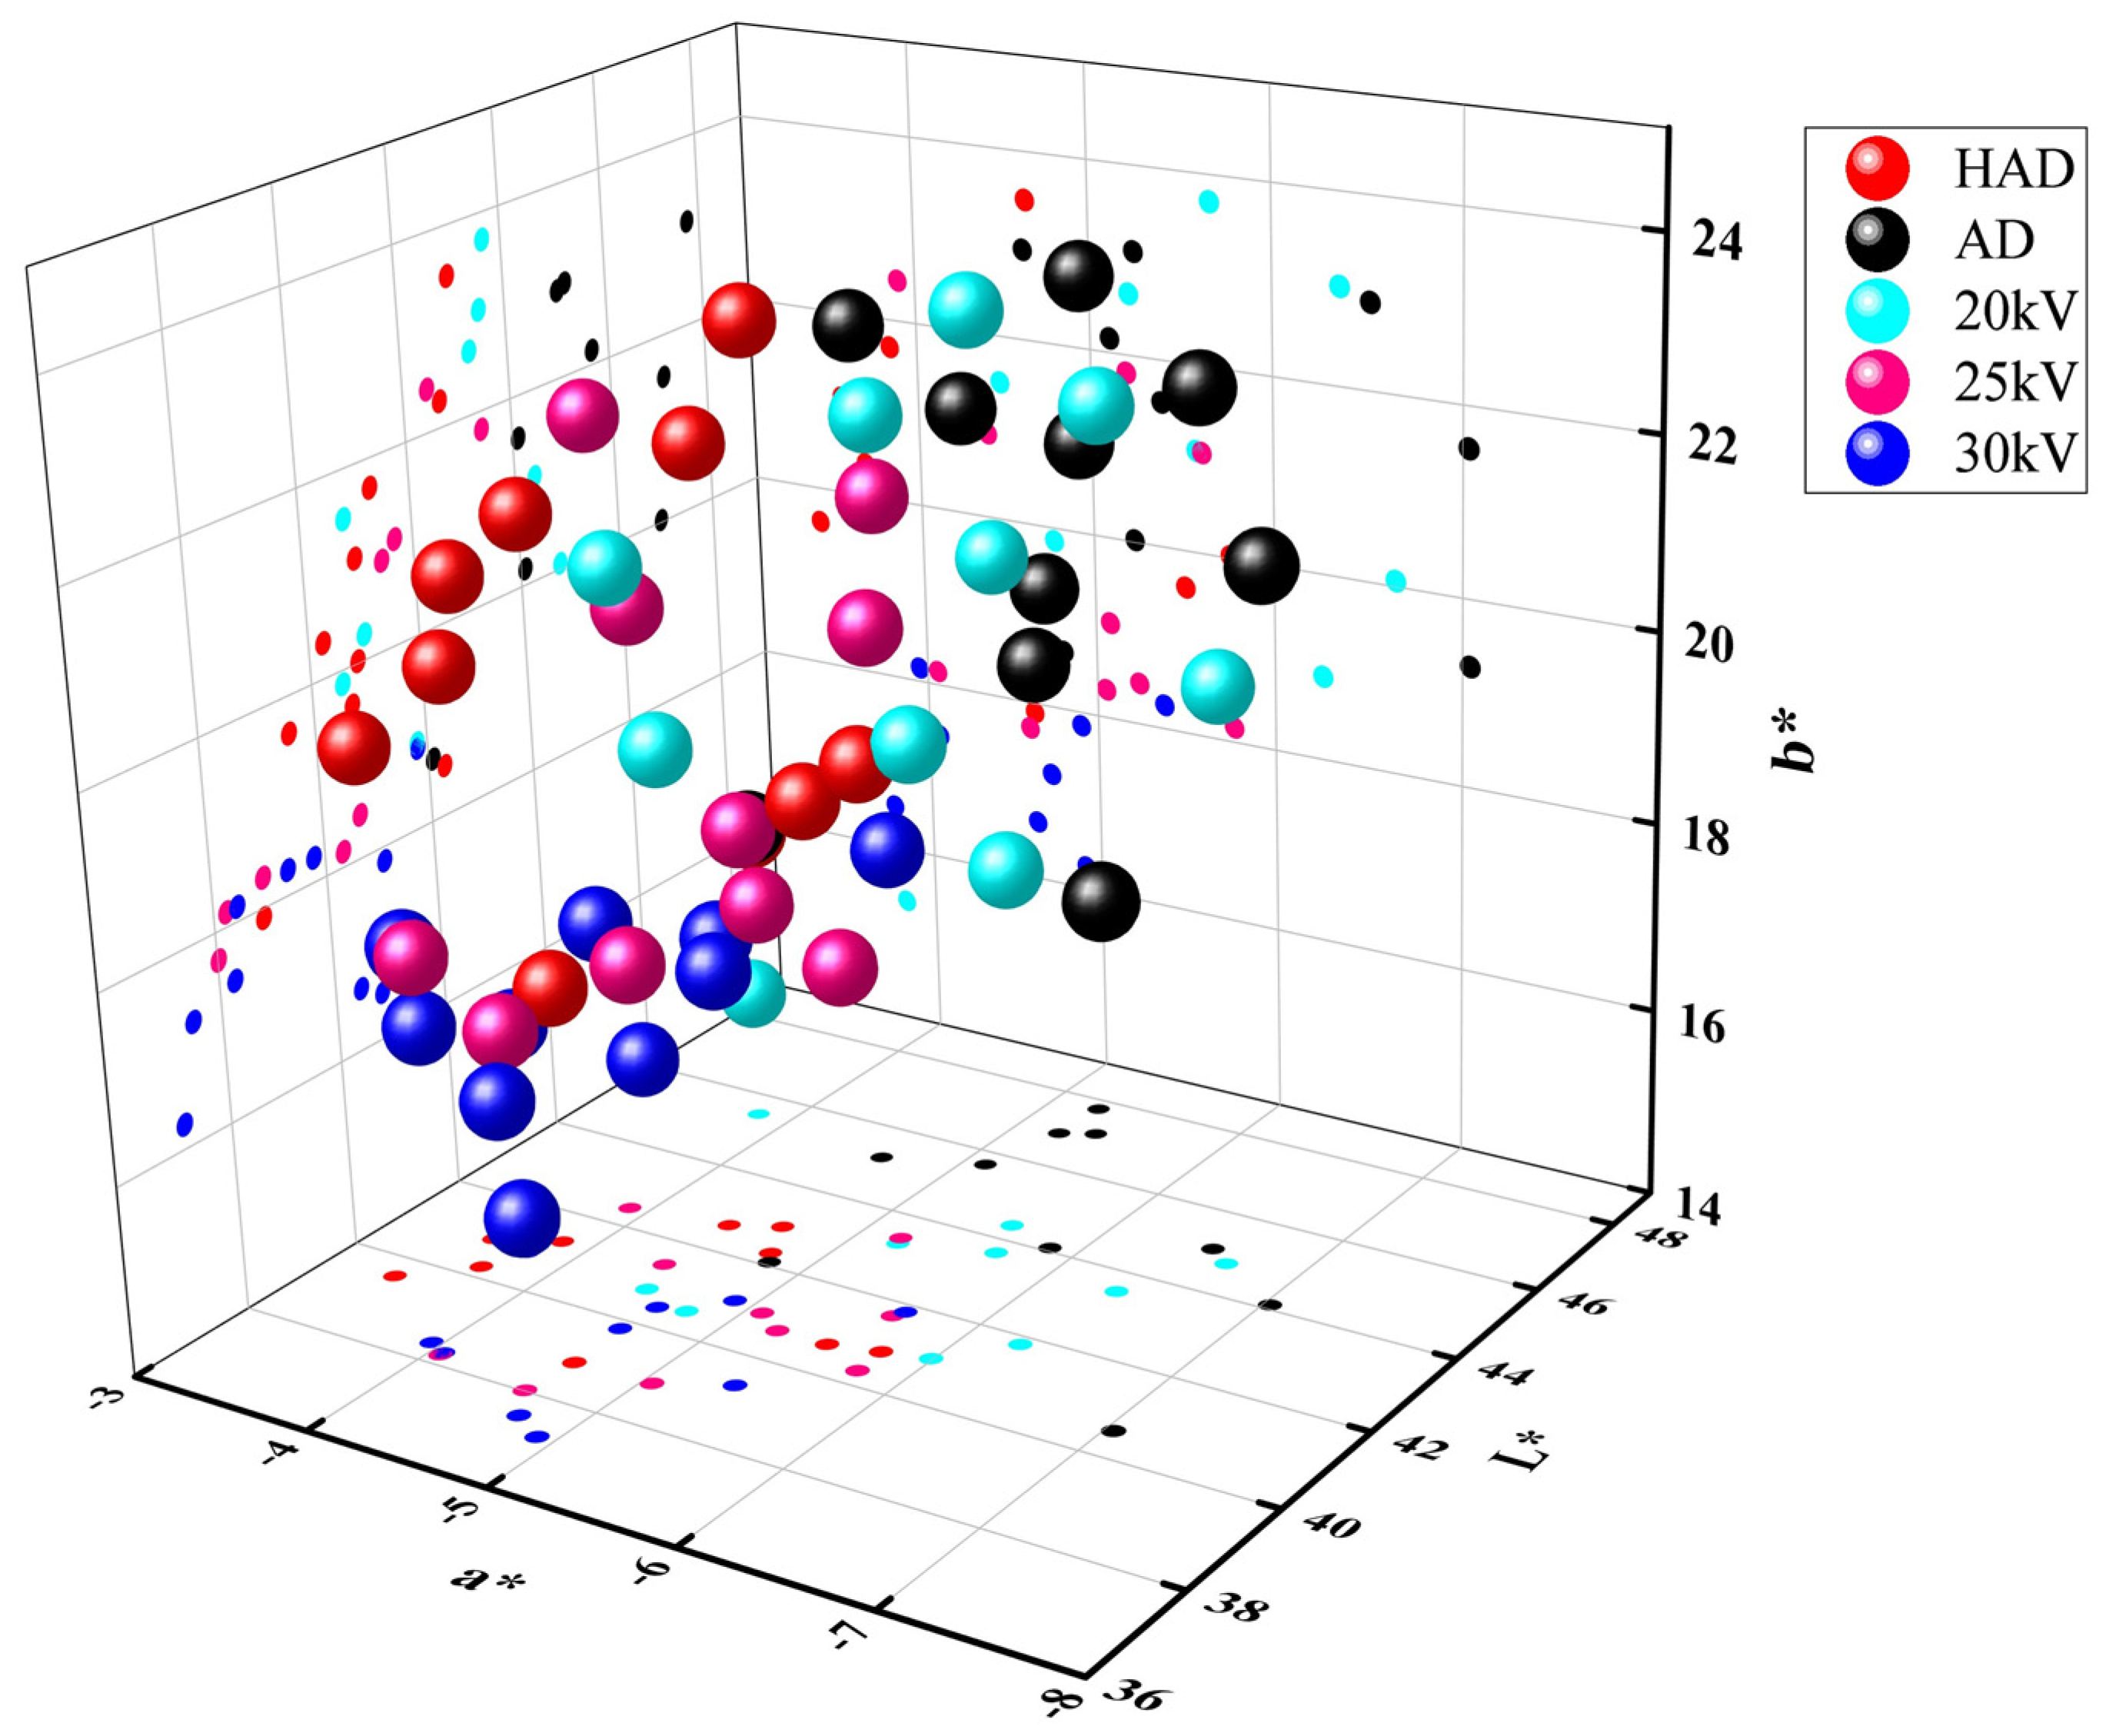
3.5. Color Analysis
3.6. Infrared Spectroscopic Analysis
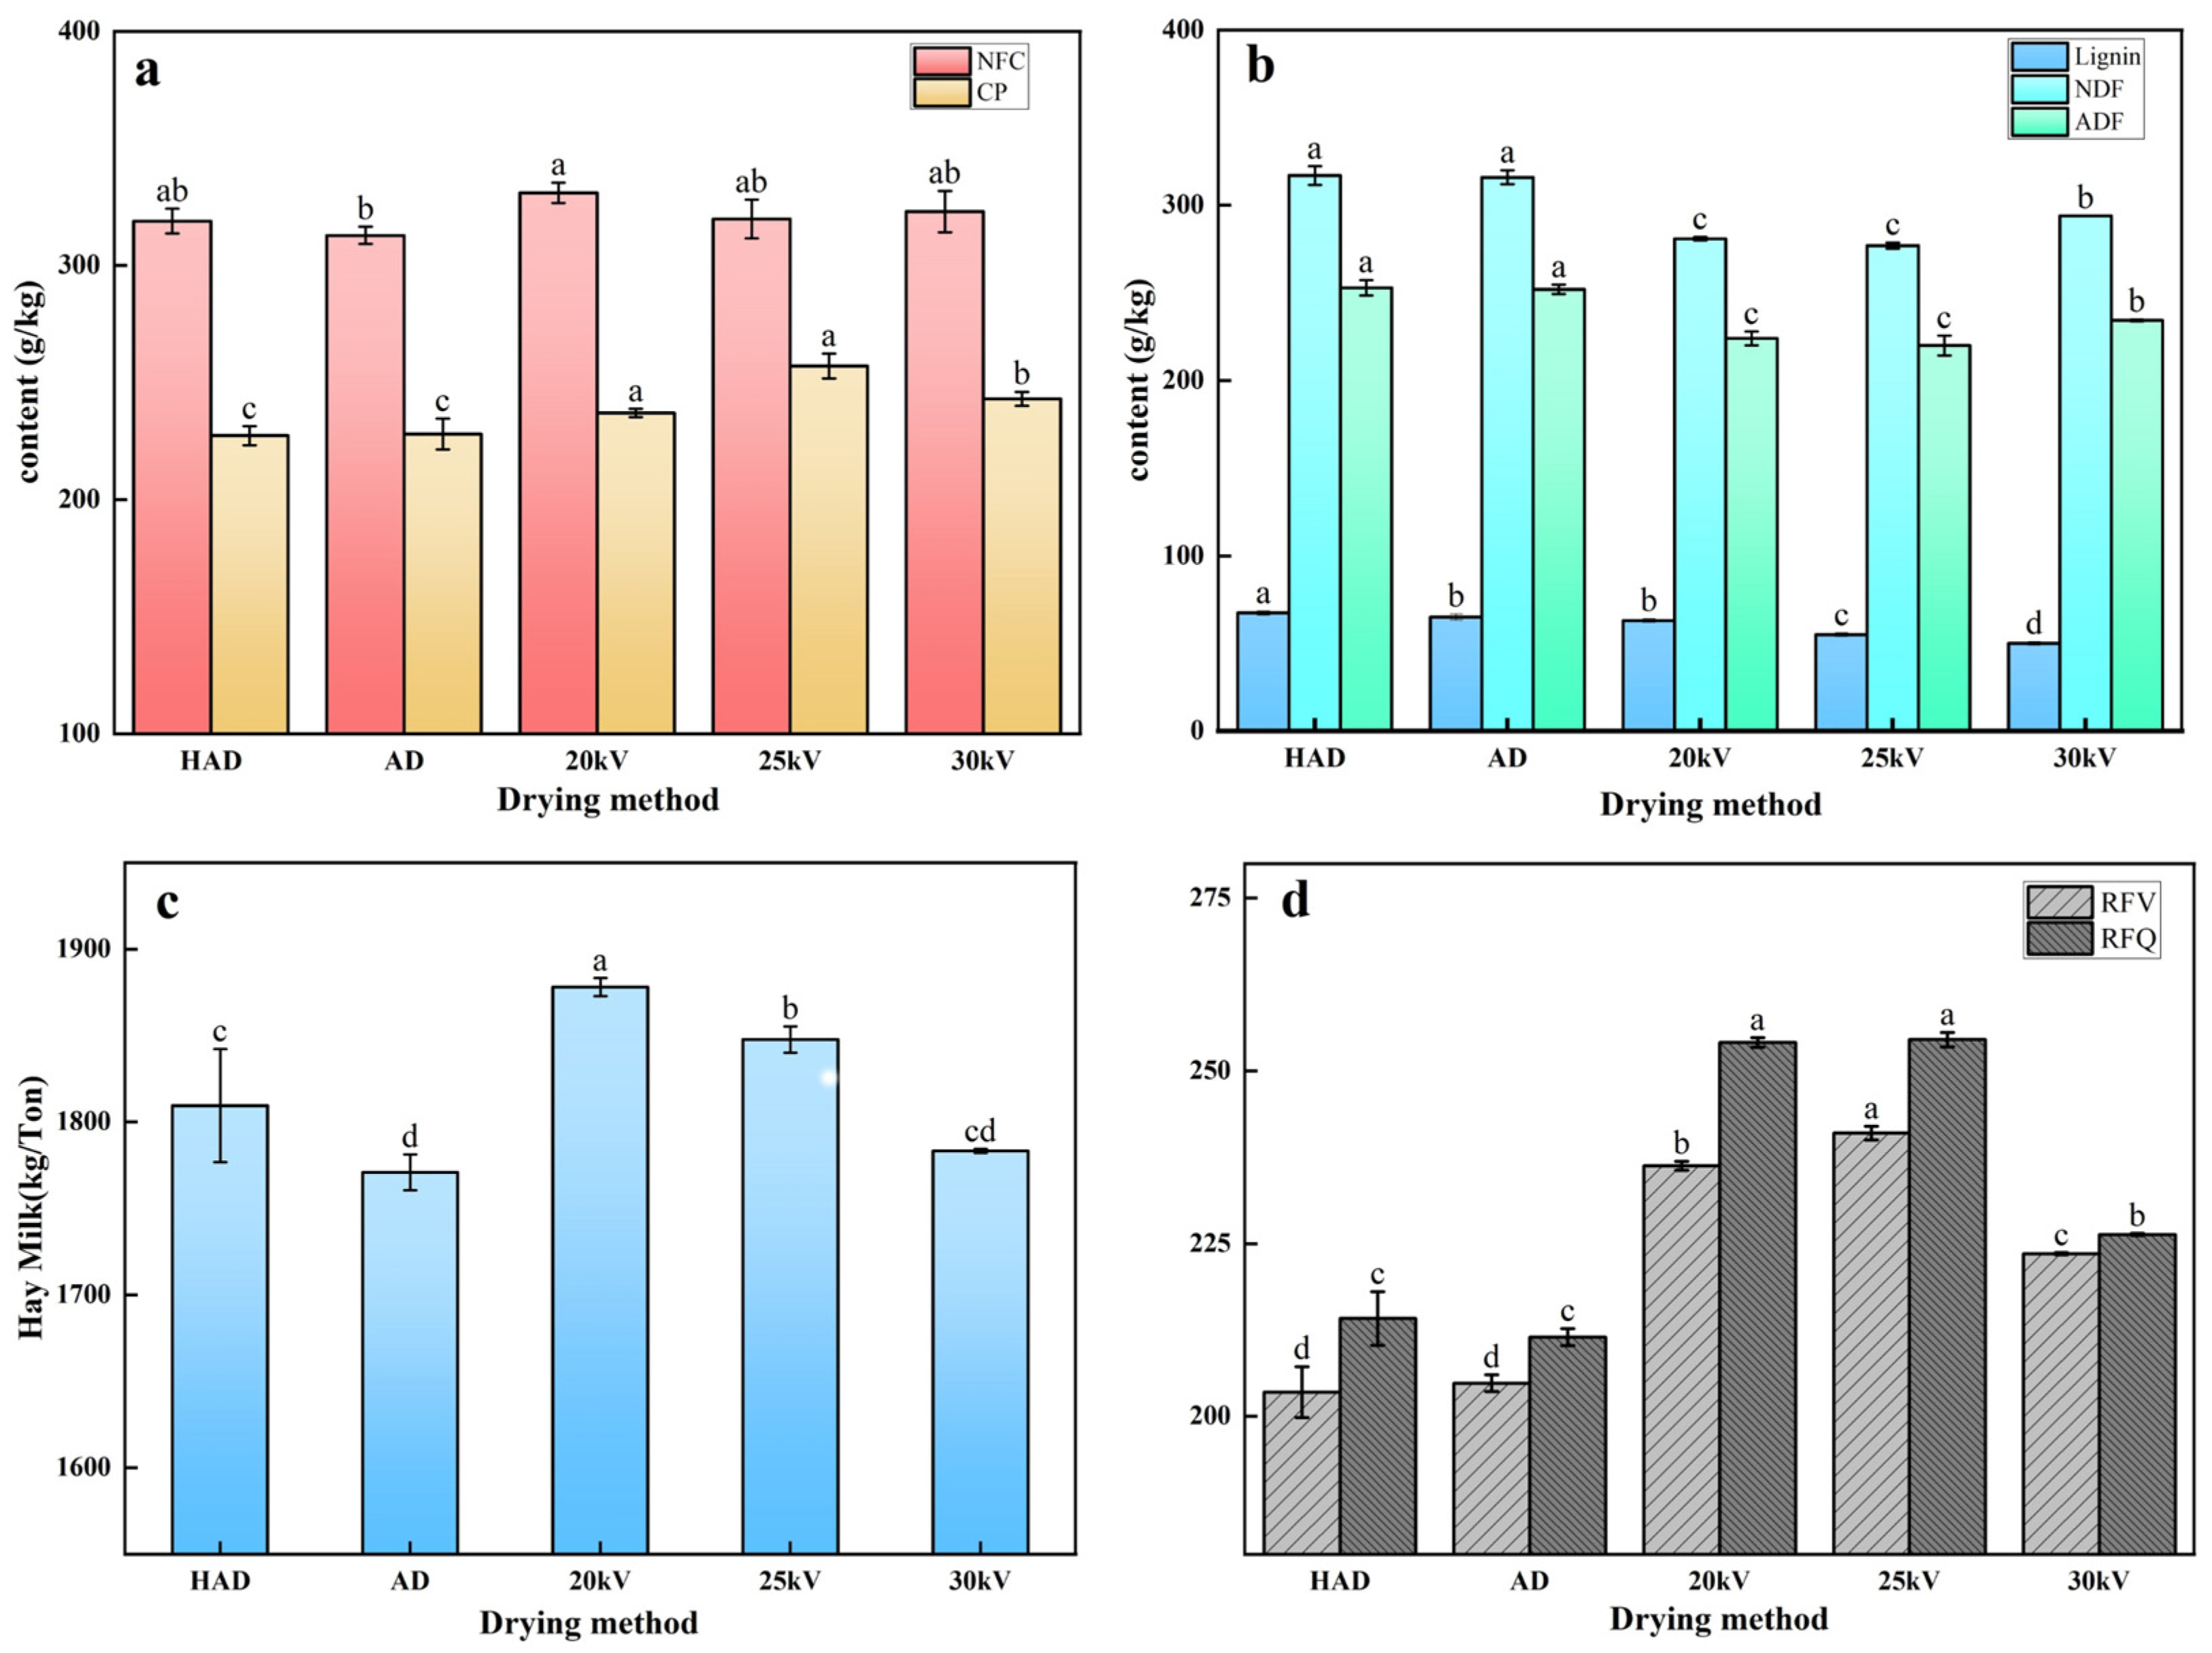
3.7. Nutritional Analysis
3.8. Correlation Analysis
4. Conclusions
Author Contributions
Funding
Data Availability Statement
Conflicts of Interest
References
- Almuhayawi, M.S.; Hassan, A.H.A.; Al Jaouni, S.K.; Alkhalifah, D.H.M.; Hozzein, W.N.; Selim, S.; AbdElgawad, H.; Khamis, G. Influence of elevated CO(2) on nutritive value and health-promoting prospective of three genotypes of Alfalfa sprouts (Medicago sativa). Food Chem. 2021, 340, 128147. [Google Scholar] [CrossRef]
- Djordjević, M.; Djordjević, M.; Maravić, N.; Teofilović, V.; Šoronja-Simović, D.; Šereš, Z. Processing of alfalfa seeds by convective hot air drying, vacuum drying and germination: Proximate composition, techno-functional, thermal and structural properties evaluation. Food Chem. 2023, 402, 134300. [Google Scholar] [CrossRef]
- Shang, H.; Cao, Z.; Zhang, H.; Guo, Y.; Zhao, J.; Wu, H. Physicochemical characterization and in vitro biological activities of polysaccharides from alfalfa (Medicago sativa L.) as affected by different drying methods. Process Biochem. 2021, 103, 39–49. [Google Scholar] [CrossRef]
- Hadidi, M.; Orellana Palacios, J.C.; McClements, D.J.; Mahfouzi, M.; Moreno, A. Alfalfa as a sustainable source of plant-based food proteins. Trends Food Sci. Technol. 2023, 135, 202–214. [Google Scholar] [CrossRef]
- Feng, Y.; Shi, Y.; Zhao, M.; Shen, H.; Xu, L.; Luo, Y.; Liu, Y.; Xing, A.; Kang, J.; Jing, H.; et al. Yield and quality properties of alfalfa (Medicago sativa L.) and their influencing factors in China. Eur. J. Agron. 2022, 141, 126637. [Google Scholar] [CrossRef]
- Wang, T.; Zhang, W.-H. Priorities for the development of alfalfa pasture in northern China. Fundam. Res. 2023, 3, 225–228. [Google Scholar] [CrossRef]
- Li, A.; Qiao, S.; Xia, M.; Lin, Y.; Wang, L.; Xie, Y.; Li, J.; Li, X. Medium and short-wave infrared drying: Principles, applications, and future trends. Dry. Technol. 2023, 41, 1569–1582. [Google Scholar] [CrossRef]
- Ihediwa, V.E.; Akpan, G.E.; Akuwueke, L.; Oriaku, L.; Ndubuisi, C.O.; Mbanasor, J.; Ndukwu, M.C. Thermal dehydration of some forage grasses for livestock feeding: Effect of different methods on moisture diffusivity and the quality of dried leaves. Energy Nexus 2022, 8, 100156. [Google Scholar] [CrossRef]
- Mattioli, S.; Dal Bosco, A.; Castellini, C.; Falcinelli, B.; Sileoni, V.; Marconi, O.; Mancinelli, A.C.; Cotozzolo, E.; Benincasa, P. Effect of heat- and freeze-drying treatments on phytochemical content and fatty acid profile of alfalfa and flax sprouts. J. Sci. Food Agric. 2019, 99, 4029–4035. [Google Scholar] [CrossRef]
- Zhang, A.A.; Ni, J.B.; Martynenko, A.; Chen, C.; Fang, X.M.; Ding, C.J.; Chen, J.; Zhang, J.W.; Xiao, H.W. Electrohydrodynamic drying of citrus (Citrus sinensis L.) peel: Comparative evaluation on the physiochemical quality and volatile profiles. Food Chem. 2023, 429, 136832. [Google Scholar] [CrossRef]
- Ni, J.; Ding, C.; Zhang, Y.; Song, Z.; Hu, X.; Hao, T. Electrohydrodynamic Drying of Chinese Wolfberry in a Multiple Needle-to-Plate Electrode System. Foods 2019, 8, 152. [Google Scholar] [CrossRef]
- Han, B.; Ding, C.; Jia, Y.; Wang, H.; Bao, Y.; Zhang, J.; Duan, S.; Song, Z.; Chen, H.; Lu, J. Influence of electrohydrodynamics on the drying characteristics and physicochemical properties of garlic. Food Chem. X 2023, 19, 100818. [Google Scholar] [CrossRef]
- Misra, N.N.; Martynenko, A. Multipin dielectric barrier discharge for drying of foods and biomaterials. Innov. Food Sci. Emerg. Technol. 2021, 70, 102672. [Google Scholar] [CrossRef]
- Xiao, A.; Ding, C. Effect of Electrohydrodynamic (EHD) on Drying Kinetics and Quality Characteristics of Shiitake Mushroom. Foods 2022, 11, 1303. [Google Scholar] [CrossRef]
- Chen, Y.; Martynenko, A. Combination of hydrothermodynamic (HTD) processing and different drying methods for natural blueberry leather. LWT 2018, 87, 470–477. [Google Scholar] [CrossRef]
- Anukiruthika, T.; Moses, J.A.; Anandharamakrishnan, C. Electrohydrodynamic drying of foods: Principle, applications, and prospects. J. Food Eng. 2021, 295, 110449. [Google Scholar] [CrossRef]
- Bai, A.; Li, R.; Wang, X.; Yang, X.; Yu, H. Biological effects of high voltage electrostatic field on E. coli. Gaodianya Jishu/High Volt. Eng. 2016, 42, 2450–2455. [Google Scholar] [CrossRef]
- Bajgai, T.R.; Hashinaga, F.; Isobe, S.; Vijaya Raghavan, G.S.; Ngadi, M.O. Application of high electric field (HEF) on the shelf-life extension of emblic fruit (Phyllanthus emblica L.). J. Food Eng. 2006, 74, 308–313. [Google Scholar] [CrossRef]
- Ni, J.; Ding, C.; Zhang, Y.; Song, Z. Impact of different pretreatment methods on drying characteristics and microstructure of goji berry under electrohydrodynamic (EHD) drying process. Innov. Food Sci. Emerg. Technol. 2020, 61, 102318. [Google Scholar] [CrossRef]
- Luan, X.; Song, Z.; Xu, W.; Li, Y.; Ding, C.; Chen, H. Spectral characteristics on increasing hydrophilicity of Alfalfa seeds treated with alternating current corona discharge field. Spectrochim. Acta Part A Mol. Biomol. Spectrosc. 2020, 236, 118350. [Google Scholar] [CrossRef]
- Martynenko, A.; Zheng, W. Electrohydrodynamic drying of apple slices: Energy and quality aspects. J. Food Eng. 2016, 168, 215–222. [Google Scholar] [CrossRef]
- Esehaghbeygi, A.; Basiry, M. Electrohydrodynamic (EHD) drying of tomato slices (Lycopersicon esculentum). J. Food Eng. 2011, 104, 628–631. [Google Scholar] [CrossRef]
- Yuan, H.; Wang, W.; Yang, D.; Zhao, Z.; Zhang, L.; Wang, S. Atmospheric air dielectric barrier discharge excited by nanosecond pulse and AC used for improving the hydrophilicity of aramid fibers. Plasma Sci. Technol. 2017, 19, 125401. [Google Scholar] [CrossRef]
- Ju, H.; Zou, Y.; Xiao, H.; Zhang, W.; Yu, X.; Gao, Z. Effects of relative humidity on water diffusion and evaporation during hot air drying of carrot. Nongye Gongcheng Xuebao/Trans. Chin. Soc. Agric. Eng. 2023, 39, 232–240. [Google Scholar] [CrossRef]
- Chauhan, A.; Singh, S.; Dhar, A.; Powar, S. Optimization of pineapple drying based on energy consumption, nutrient retention, and drying time through multi-criteria decision-making. J. Clean. Prod. 2021, 292, 125913. [Google Scholar] [CrossRef]
- Zhang, J.; Ding, C.; Lu, J.; Wang, H.; Bao, Y.; Han, B.; Duan, S.; Song, Z.; Chen, H. Influence of electrohydrodynamics on the drying characteristics and volatile components of iron stick yam. Food Chem. X 2023, 20, 101026. [Google Scholar] [CrossRef]
- Kamal, M.M.; Ali, M.R.; Shishir, M.R.I.; Mondal, S.C. Thin-layer drying kinetics of yam slices, physicochemical, and functional attributes of yam flour. J. Food Process Eng. 2020, 43, e13448. [Google Scholar] [CrossRef]
- Guo, X.S.; Shang, Z.H.; Fang, X.W.; Long, R.J. Progress in Application of Near Infrared Reflectance Spectroscopy to the Study of Ruminant Nutrition. Spectrosc. Spectr. Anal. 2009, 29, 641–646. [Google Scholar] [CrossRef]
- Yuan, N.; Sun, L.; Du, S.; Ge, G.; Wang, Z.; Li, Y.; Bao, J.; Zhao, M.; Si, Q.; Hao, J.; et al. Effects of Harvesting Period and Storage Duration on Volatile Organic Compounds and Nutritive Qualities of Alfalfa. Agriculture 2022, 12, 1115. [Google Scholar] [CrossRef]
- Wang, L.; Tian, Y.; Wang, K.; Qin, Y.; Chang, Z.; Wang, J. Effects of corona discharge plasma pretreatment on the drying kinetics and quality attributes of lily (Lilium davidii var. unicolor) bulbs. LWT 2024, 200, 116192. [Google Scholar] [CrossRef]
- Alemrajabi, A.A.; Rezaee, F.; Mirhosseini, M.; Esehaghbeygi, A. Comparative Evaluation of the Effects of Electrohydrodynamic, Oven, and Ambient Air on Carrot Cylindrical Slices during Drying Process. Dry. Technol. 2012, 30, 88–96. [Google Scholar] [CrossRef]
- Bai, Y.; Qu, M.; Luan, Z.; Li, X.; Yang, Y. Electrohydrodynamic drying of sea cucumber (Stichopus japonicus). LWT-Food Sci. Technol. 2013, 54, 570–576. [Google Scholar] [CrossRef]
- Martynenko, A.; Kudra, T. Electrically-induced transport phenomena in EHD drying—A review. Trends Food Sci. Technol. 2016, 54, 63–73. [Google Scholar] [CrossRef]
- Wang, Y.; Ding, C. Effect of Electrohydrodynamic Drying on Drying Characteristics and Physicochemical Properties of Carrot. Foods 2023, 12, 4228. [Google Scholar] [CrossRef]
- Marques, L.G.; Prado, M.M.; Freire, J.T. Rehydration characteristics of freeze-dried tropical fruits. LWT-Food Sci. Technol. 2009, 42, 1232–1237. [Google Scholar] [CrossRef]
- Hu, L.; Bi, J.; Jin, X.; van der Sman, R. Microstructure evolution affecting the rehydration of dried mushrooms during instant controlled pressure drop combined hot air drying (DIC-HA). Innov. Food Sci. Emerg. Technol. 2022, 79, 103056. [Google Scholar] [CrossRef]
- Wang, X.-Q.; Zhou, R.-W.; Groot, G.d.; Bazaka, K.; Murphy, A.B.; Ostrikov, K. Spectral characteristics of cotton seeds treated by a dielectric barrier discharge plasma. Sci. Rep. 2017, 7, 5601. [Google Scholar] [CrossRef]
- Esehaghbeygi, A.; Pirnazari, K.; Sadeghi, M. Quality assessment of electrohydrodynamic and microwave dehydrated banana slices. LWT-Food Sci. Technol. 2014, 55, 565–571. [Google Scholar] [CrossRef]
- Ni, Y.; Guo, Y.J.; Guo, Y.J.; Han, L.; Tang, H.; Conyers, M. Leaf cuticular waxes and physiological parameters in alfalfa leaves as influenced by drought. Photosynthetica 2012, 50, 458–466. [Google Scholar] [CrossRef]
- Thamkaew, G.; Wadsö, L.; Rasmusson, A.G.; Gómez Galindo, F. The effect of reversible permeabilization and post-electroporation resting on the survival of Thai basil (O. Basilicum cv. thyrsiflora) leaves during drying. Bioelectrochemistry 2021, 142, 107912. [Google Scholar] [CrossRef]
- Janhom, N.; Whangchai, K. Ozone fumigation promotes antioxidant activities to retard chlorophyll degradation and cell death in ‘Jinda’ chili during storage. Postharvest Biol. Technol. 2023, 202, 112375. [Google Scholar] [CrossRef]
- Iranshahi, K.; Rubinetti, D.; Onwude, D.I.; Psarianos, M.; Schlüter, O.K.; Defraeye, T. Electrohydrodynamic drying versus conventional drying methods: A comparison of key performance indicators. Energy Convers. Manag. 2023, 279, 116661. [Google Scholar] [CrossRef]
- Soraiyay Zafar, H.; Asefi, N.; Siahpoush, V.; Roufegarinejad, L.; Alizadeh, A. Preparation of egg white powder using electrohydrodynamic drying method and its effect on quality characteristics and functional properties. Food Chem. 2023, 426, 136567. [Google Scholar] [CrossRef]
- Chen, J.; Yu, T.; Cherney, J.H.; Zhang, Z. Optimal Integration of Optical and SAR Data for Improving Alfalfa Yield and Quality Traits Prediction: New Insights into Satellite-Based Forage Crop Monitoring. Remote Sens. 2024, 16, 734. [Google Scholar] [CrossRef]
- Yang, C.; Zhang, F.; Jiang, X.; Yang, X.; He, F.; Wang, Z.; Long, R.; Chen, L.; Yang, T.; Wang, C.; et al. Identification of Genetic Loci Associated With Crude Protein Content and Fiber Composition in Alfalfa (Medicago sativa L.) Using QTL Mapping. Front. Plant Sci. 2021, 12, 608940. [Google Scholar] [CrossRef]
- Kamran, M.; Yan, Z.; Jia, Q.; Chang, S.; Ahmad, I.; Ghani, M.U.; Hou, F. Irrigation and nitrogen fertilization influence on alfalfa yield, nutritive value, and resource use efficiency in an arid environment. Field Crops Res. 2022, 284, 108587. [Google Scholar] [CrossRef]
- Babu, A.K.; Kumaresan, G.; Raj, V.A.A.; Velraj, R. Review of leaf drying: Mechanism and influencing parameters, drying methods, nutrient preservation, and mathematical models. Renew. Sustain. Energy Rev. 2018, 90, 536–556. [Google Scholar] [CrossRef]
- Zhang, S.; Zhu, H.; Cen, H.; Qian, W.; Wang, Y.; Ren, M.; Cheng, Y. Effects of various forms of selenium biofortification on photosynthesis, secondary metabolites, quality, and lignin deposition in alfalfa (Medicago sativa L.). Field Crops Res. 2023, 292, 108801. [Google Scholar] [CrossRef]
- Tharangani, R.M.H.; Yakun, C.; Zhao, L.S.; Shen, Y.F.; Ma, L.; Bu, D.P. Proposal and validation of integrated alfalfa silage quality index (ASQI) method for the quality assessment of alfalfa silage for lactating dairy cows. Anim. Feed Sci. Technol. 2022, 289, 115339. [Google Scholar] [CrossRef]


| Method | L* | a* | b* | ΔE |
|---|---|---|---|---|
| Fresh | 23.04 ± 1.22 | −8.98 ± 2.18 | 12.89 ± 1.30 | / |
| HAD | 41.03 ± 1.33 c | −4.42 ± 0.81 a | 20.45 ± 1.71 a | 20.10 ± 1.70 bc |
| AD | 44.85 ± 2.25 a | −5.69 ± 0.89 c | 21.24 ± 1.61 a | 23.62 ± 2.53 a |
| 20 kV | 42.92 ± 1.77 b | −5.48 ± 0.91 bc | 20.65 ± 2.40 a | 21.76 ± 1.74 b |
| 25 kV | 40.61 ± 1.78 c | −4.89 ± 0.63 ab | 19.61 ± 1.76 a | 19.29 ± 2.19 cd |
| 30 kV | 39.47 ± 1.58 c | −4.66 ± 0.60 a | 17.54 ± 0.87 b | 17.64 ± 1.55 d |
Disclaimer/Publisher’s Note: The statements, opinions and data contained in all publications are solely those of the individual author(s) and contributor(s) and not of MDPI and/or the editor(s). MDPI and/or the editor(s) disclaim responsibility for any injury to people or property resulting from any ideas, methods, instructions or products referred to in the content. |
© 2024 by the authors. Licensee MDPI, Basel, Switzerland. This article is an open access article distributed under the terms and conditions of the Creative Commons Attribution (CC BY) license (https://creativecommons.org/licenses/by/4.0/).
Share and Cite
Hu, W.; Song, Z.; Ma, Q.; Li, B.; Zhang, M.; Ding, C.; Chen, H.; Zhao, S. Study on the Drying Characteristics and Physicochemical Properties of Alfalfa under High-Voltage Discharge Plasma. Agriculture 2024, 14, 1134. https://doi.org/10.3390/agriculture14071134
Hu W, Song Z, Ma Q, Li B, Zhang M, Ding C, Chen H, Zhao S. Study on the Drying Characteristics and Physicochemical Properties of Alfalfa under High-Voltage Discharge Plasma. Agriculture. 2024; 14(7):1134. https://doi.org/10.3390/agriculture14071134
Chicago/Turabian StyleHu, Wenhao, Zhiqing Song, Qingjie Ma, Bufan Li, Mingjie Zhang, Changjiang Ding, Hao Chen, and Shenghou Zhao. 2024. "Study on the Drying Characteristics and Physicochemical Properties of Alfalfa under High-Voltage Discharge Plasma" Agriculture 14, no. 7: 1134. https://doi.org/10.3390/agriculture14071134
APA StyleHu, W., Song, Z., Ma, Q., Li, B., Zhang, M., Ding, C., Chen, H., & Zhao, S. (2024). Study on the Drying Characteristics and Physicochemical Properties of Alfalfa under High-Voltage Discharge Plasma. Agriculture, 14(7), 1134. https://doi.org/10.3390/agriculture14071134