Article

Design and Experiment of Ordinary Tea Profiling Harvesting Device Based on Light Detection and Ranging Perception

1
School of Mechanical Engineering, Zhejiang Sci-Tech University, Hangzhou 310018, China
2
Key Laboratory of Zhejiang Transplanting Equipment Technology, Hangzhou 310018, China
3
School of Transportation, Zhejiang Industry Polytechnic College, Shaoxing 312000, China
4
Department of Agricultural and Biological Engineering, The Pennsylvania State University, Biglerville, PA 16802, USA
*
Author to whom correspondence should be addressed.
Agriculture 2024, 14(7), 1147; https://doi.org/10.3390/agriculture14071147
Submission received: 21 June 2024 / Revised: 9 July 2024 / Accepted: 11 July 2024 / Published: 15 July 2024
(This article belongs to the Special Issue Sensor-Based Precision Agriculture)

Abstract

:
Due to the complex shape of the tea tree canopy and the large undulation of a tea garden terrain, the quality of fresh tea leaves harvested by existing tea harvesting machines is poor. This study proposed a tea canopy surface profiling method based on 2D LiDAR perception and investigated the extraction and fitting methods of canopy point clouds. Meanwhile, a tea profiling harvester prototype was developed and field tests were conducted. The tea profiling harvesting device adopted a scheme of sectional arrangement of multiple groups of profiling tea harvesting units, and each unit sensed the height information of its own bottom canopy area through 2D LiDAR. A cross-platform communication network was established, enabling point cloud fitting of tea plant surfaces and accurate estimation of cutter profiling height through the RANSAC algorithm. Additionally, a sensing control system with multiple execution units was developed using rapid control prototype technology. The results of field tests showed that the bud leaf integrity rate was 84.64%, the impurity rate was 5.94%, the missing collection rate was 0.30%, and the missing harvesting rate was 0.68%. Furthermore, 89.57% of the harvested tea could be processed into commercial tea, with 88.34% consisting of young tea shoots with one bud and three leaves or fewer. All of these results demonstrated that the proposed device effectively meets the technical standards for machine-harvested tea and the requirements of standard tea processing techniques. Moreover, compared to other commercial tea harvesters, the proposed tea profiling harvesting device demonstrated improved performance in harvesting fresh tea leaves.

1. Introduction

As an important economic crop with Chinese agricultural characteristics and a cultural heritage, tea has great social value and economic significance [1]. Based on the varying criteria for the raw materials of fresh tea leaves, it can be categorized into ordinary tea and famous tea. The production of ordinary tea generally surpasses that of famous tea. Generally, the harvesting of fresh ordinary tea leaves requires large labor input and high operation intensity [2]. In recent years, the aging trend of the agricultural labor force is obvious. And the contradiction between the small harvest window period and the shortage of labor has become a bottleneck restricting the development of the tea industry. Therefore, there is an urgent need for tea harvesting equipment that can not only ensure the harvest quality but also achieve large-scale harvesting operations across the diverse terrains of China’s tea-producing region. For the ordinary tea harvest, single- or double-person handheld tea harvesting machines are widely used in China, which both use a reciprocating cutter as the harvesting methods, but the personnel are subject to the weight of the machines themselves, resulting in high operation intensity and low efficiency [3]. To improve work efficiency, self-propelled tea harvesting machines have gradually been applied, increasing the automation of tea machine picking to a certain extent [4]. However, their cutter height is fixed and cannot be adjusted adaptively according to the canopy and terrain characteristics during traveling, causing a lower completeness rate of harvest of tea buds and leaves, as well as a higher content of impurity.
Profiling harvesting, which means that the cutter can adjust its height according to the undulation of the canopy, is an ideal way of tea harvesting. The key component of such equipment is the profiling device, designed to accurately match or follow the shape of the tea canopy, enabling precise cutting. Tang et al. [5,6] have designed an intelligent riding tea picker, presenting a novel approach for achieving automated profiling harvesting. Nevertheless, the picker’s reliance on a single arc cutter for its profiling operation struggles to meet the varied requirements of tea canopies with different arc shapes. Research has begun to incorporate sensing technology into automated tea harvesting. For instance, Yan [7] applied an angle sensor to the tea harvester, controlling the lifting of the cutter by detecting the angle of the baffle and tea canopy. However, due to the unstable support force of the tea canopy on the baffle, it is necessary to further suppress the pulsation error of the cutter control. Zhao et al. [8] developed a tea picker with a distributed control that utilizes ultrasonic sensors for measuring distances between the cutter and the tea canopy. This system allows for precise profiling through a screw rod mechanism. While achieving its design goals, the picker’s ultrasonic sensor covers only a narrow sector, limiting data variety. This poses challenges in adapting to sudden canopy shape changes and sparse growth.
The prerequisite for achieving tea active profiling harvest is to obtain the height of the tea canopy. The measurement of plant canopy height is an extensive research topic in the field of agricultural engineering [9,10]. LiDAR (light detection and ranging) sensors are one of the primary methods being used [11]. A LiDAR system generates position and shape information of target objects by measuring the emitted laser pulses and the time and direction of return. It is characterized by high resolution, good concealment and strong anti-interference ability [12]. LiDAR technology offers significant advantages over ultrasonic sensors, providing high-quality data characterized by a uniform density, structured dispersion, and rich semantic information. LiDAR technology has been employed in agriculture to determine the geometric properties of crop canopies for various purposes, e.g., growth assessment and precision spraying [13,14,15,16]. Additionally, it has found applications in automated harvesting machines and robots. For instance, Blanquart et al. [17] applied LiDAR to grain combine harvesters and studied the effects of LiDAR installation angle and height on the estimation of wheat and barley crop height and density. Eizentals and Oka [18] used LiDAR to study the positioning method for picking green pepper stalks when the available visual cues do not provide sufficient information in greenhouse environments, providing data support for green pepper picking robots. Gangadharan et al. [19] studied the perception accuracy of LiDAR on the contour shape of citrus trees in indoor and outdoor environments to guide the design of a vibrating citrus harvester. Liu et al. [20] applied LiDAR to apple picking robots to obtain depth information about apples.
The above research on LiDAR in harvesting machinery provides a reference for the design of the profiling device in this study. The complex shape of the tea canopy, alongside the variable growth density of young shoots, unpredictable leaf gap sizes, and diverse terrain in the tea-producing regions, collectively poses challenges for profiling in automated tea harvesting. To address this problem, it was hypothesized in this study that the integration of LiDAR sensing into a tea profiling harvesting device could enhance the perception of tea canopy height, facilitate accurate profiling process, and improve the harvesting performance.
Aiming at correcting the problems existing in the current tea harvester, this paper proposed a tea canopy height sensing method for 2D LiDAR ranging based on a scheme of sectional arrangement of multiple groups of profiling tea picker units, and this cross-platform communication network was built. Meanwhile, the point clouds extraction of tea canopy surface and the effective estimation of cutter profiling height were realized through RANSAC. Finally, the agronomic parameters such as the integrity rate of bud and leaf, the impurity rate, the missing collection rate, and the missing picking rate were all obtained through field tests, which verified the operational effectiveness of the prototype.
Specifically, the following were the novel contributions of this study:
(1)
This study proposed integrating LiDAR sensing into a tea profiling harvesting device, addressing the challenges of profiling processes due to a complex tea canopy and diverse terrains.
(2)
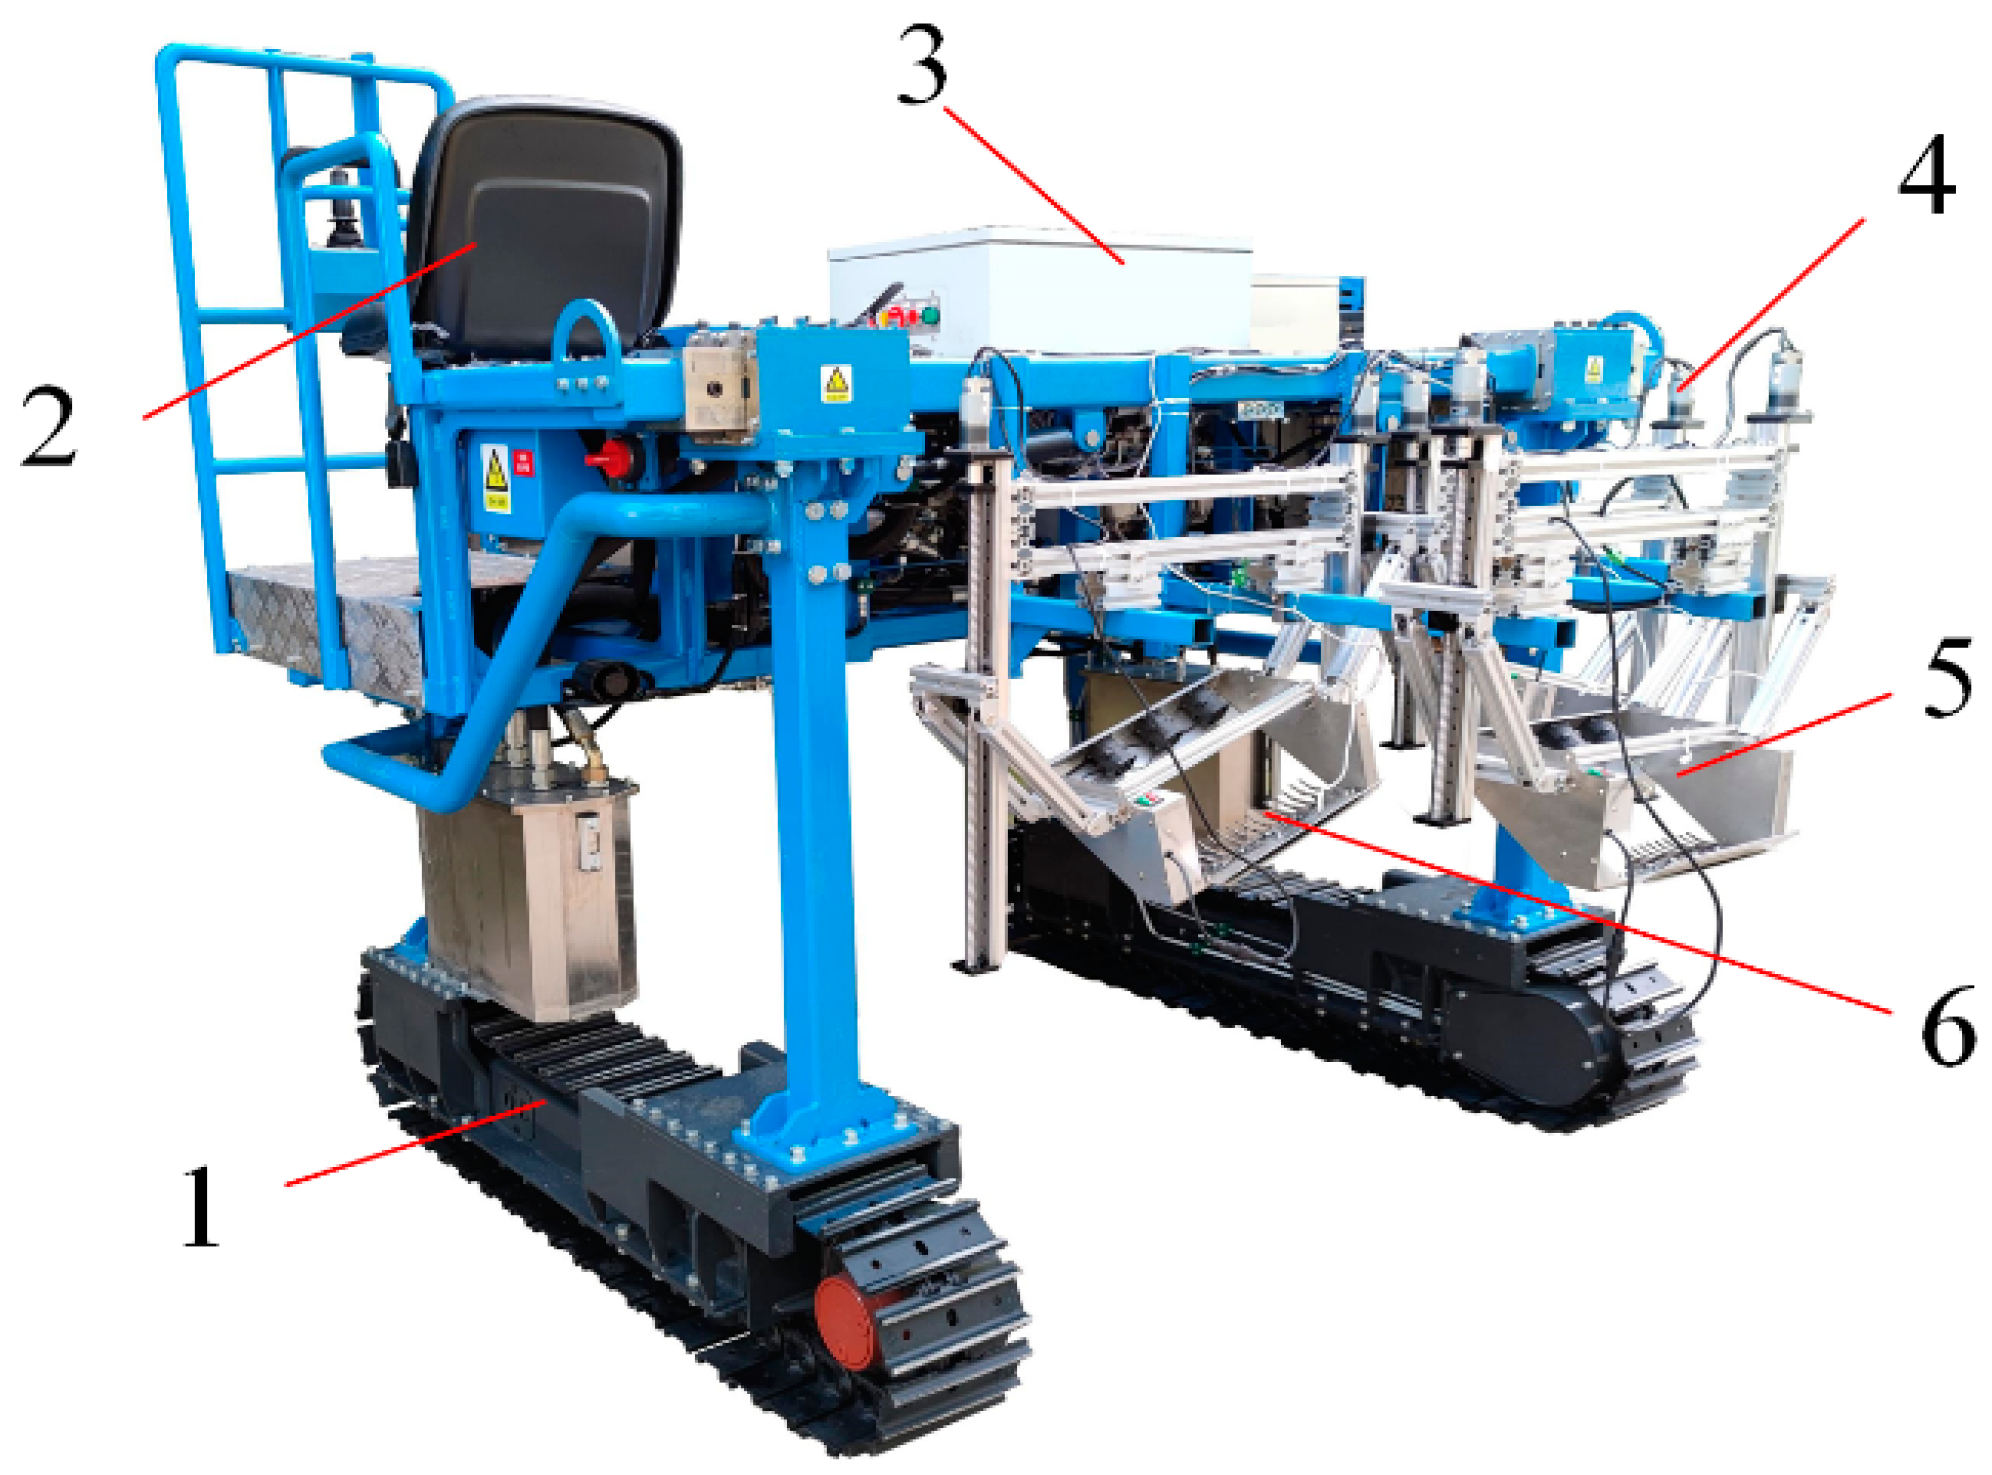
This study developed a tea harvester prototype equipped with LiDAR sensing for real-time canopy surface extraction, a profiling tea harvesting unit (PTHU), and a cross-platform communication network, showcasing enhanced tea harvesting performance through the incorporation of LiDAR technology.

2. Materials and Methods

2.1. Design and Development of the Tea Profiling Harvesting Device

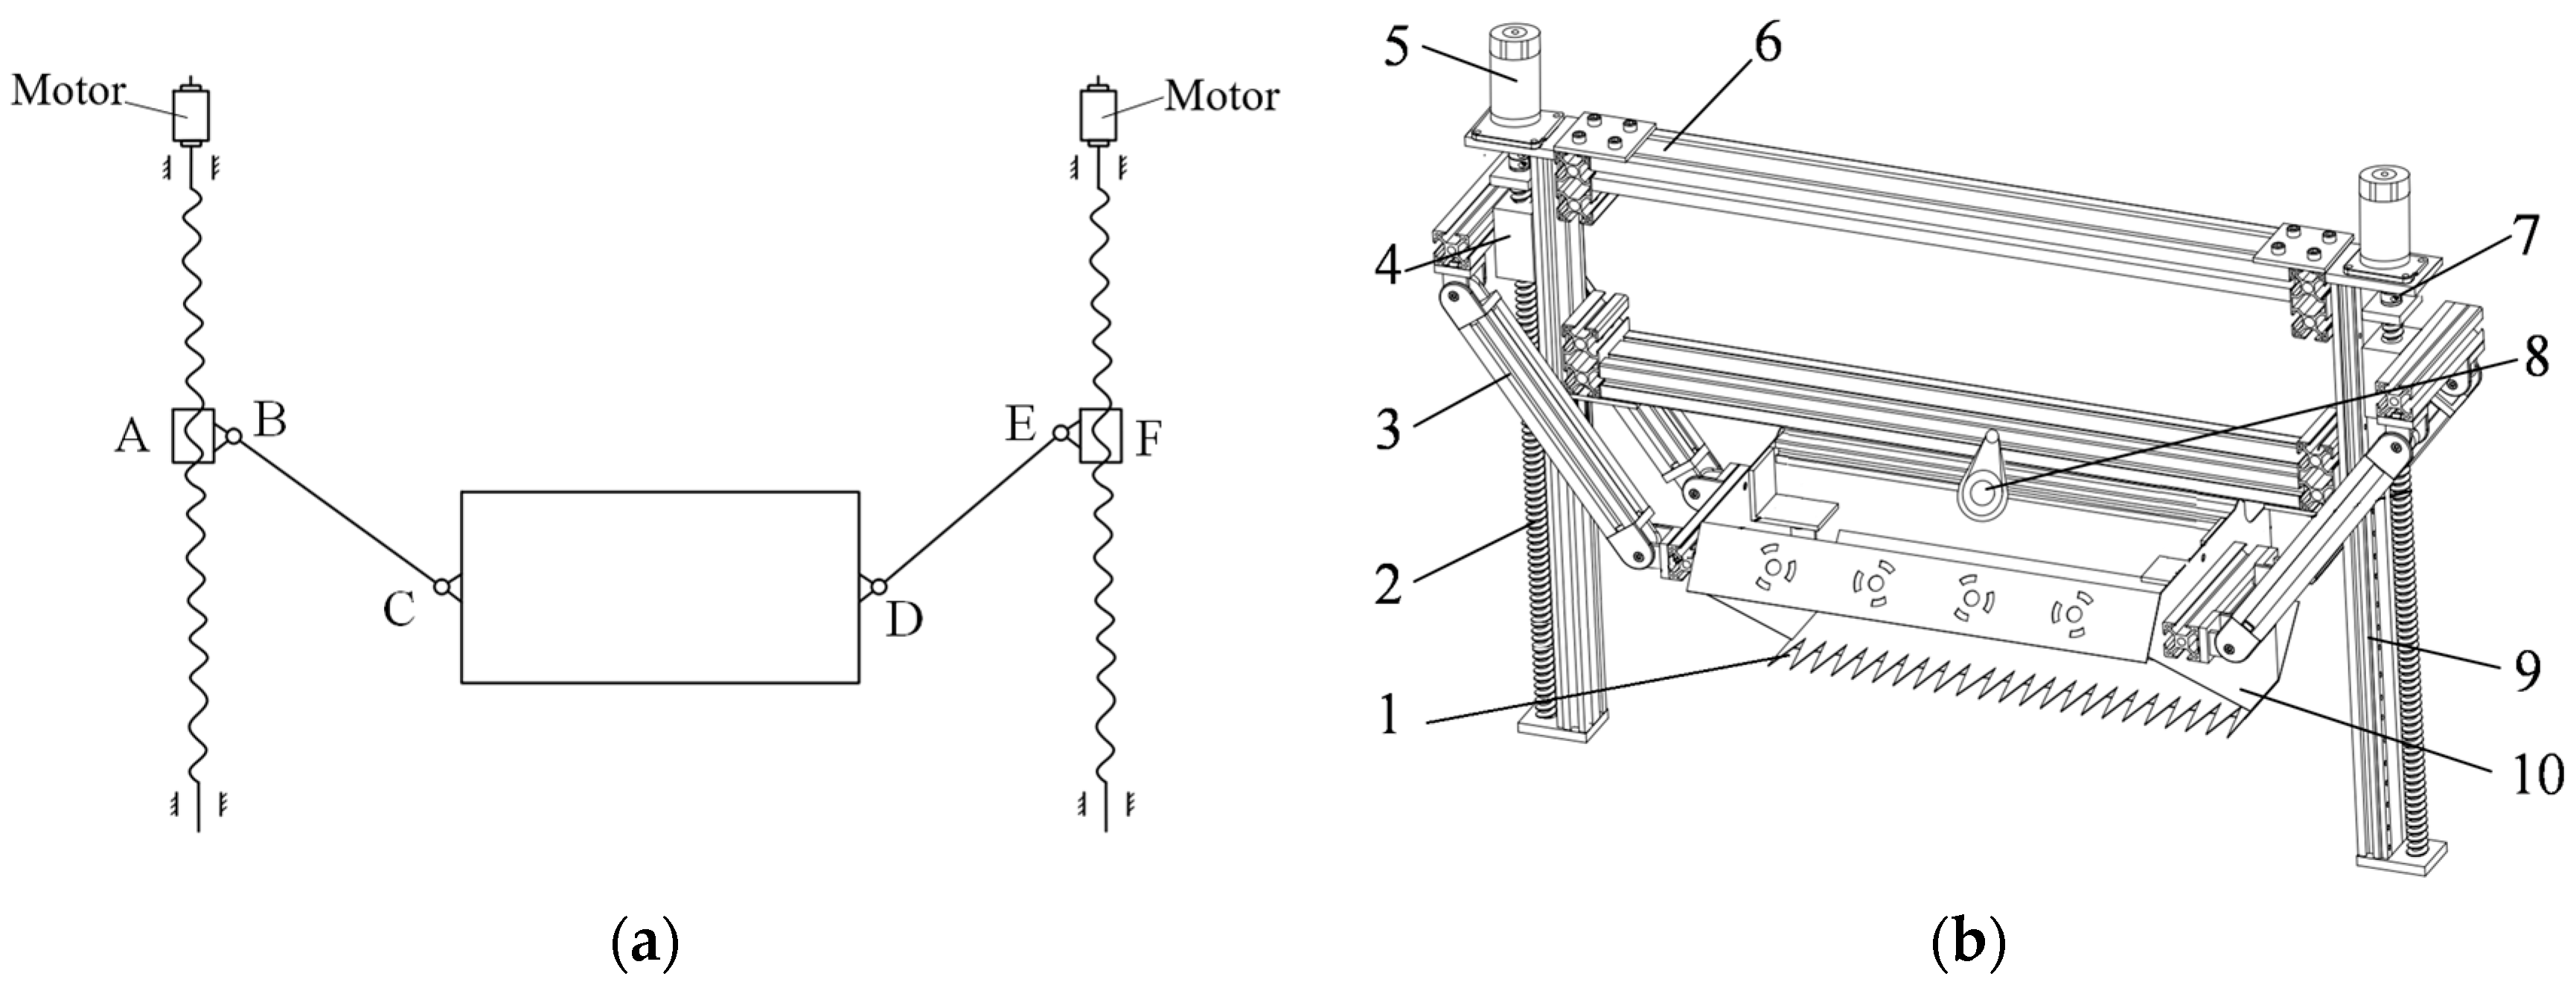
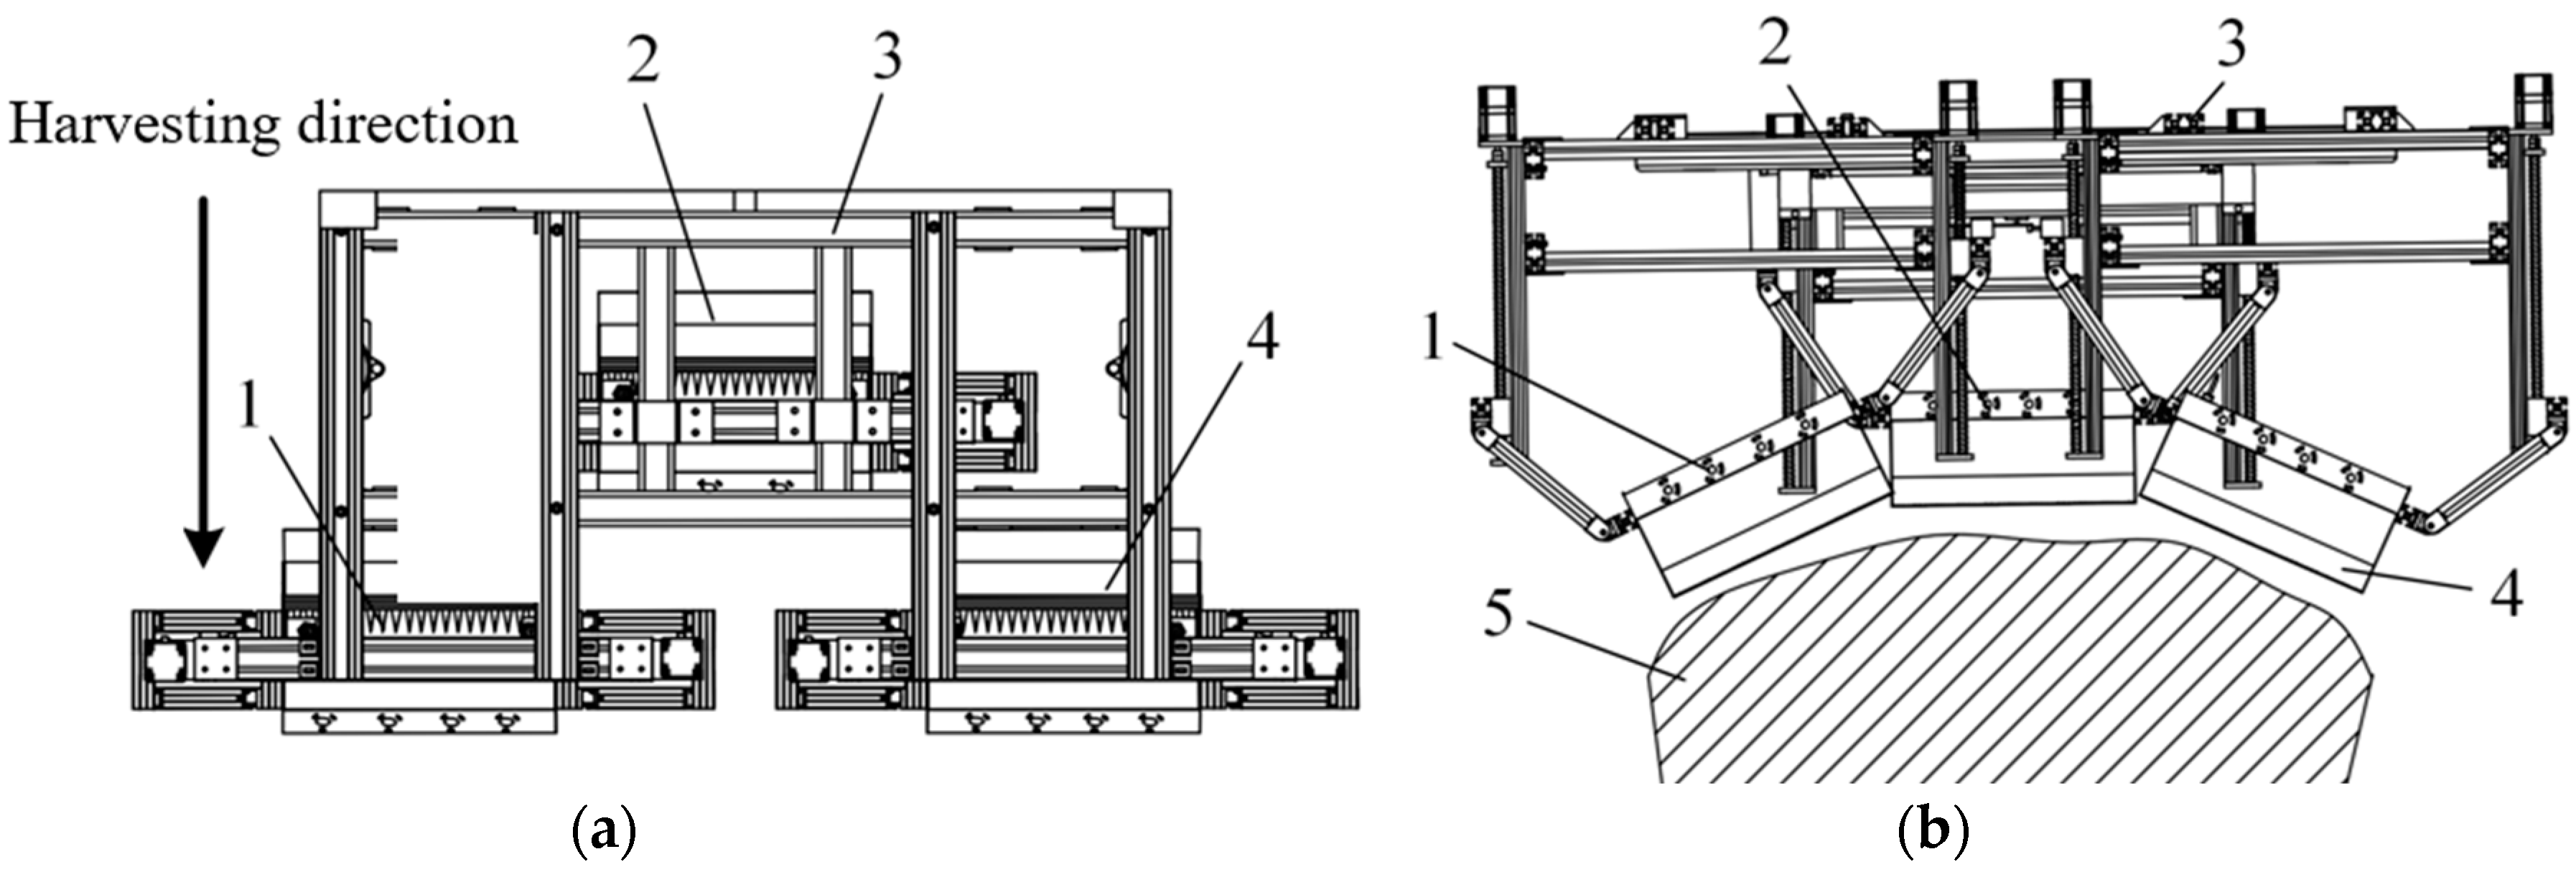
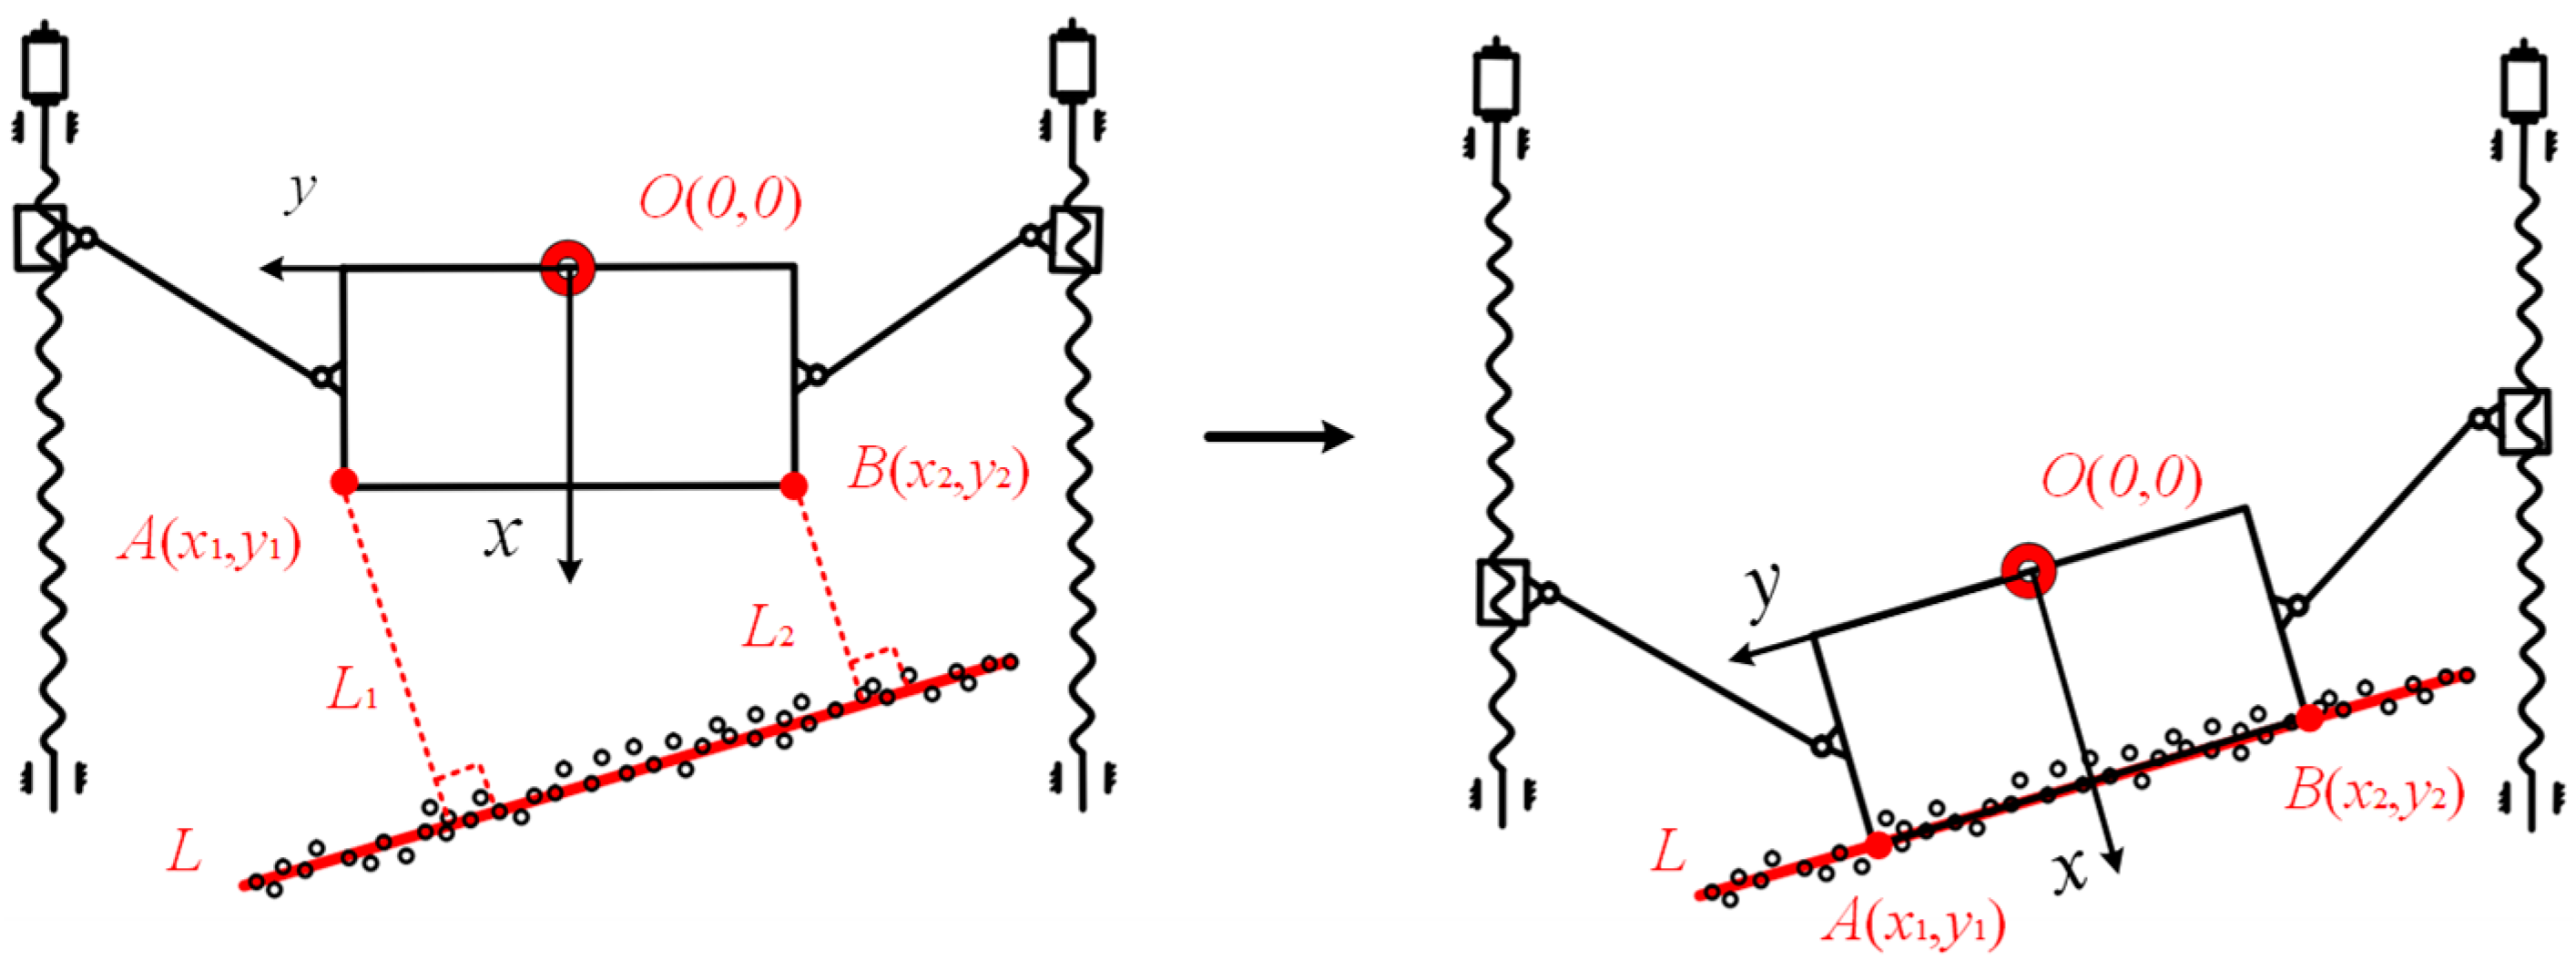
2.1.1. Cutter Profiling Mechanism

Considering the complex physical characteristics of the tea canopy, the profiling tea harvesting device employs a segmented arrangement of multiple tea harvesting units for enhanced efficiency in profiling and harvesting. Each PTHU includes a set of end actuators for harvesting fresh tea leaves, and the profiling movement of the actuators was realized by the cutter profiling mechanism. To achieve fast profiling of the end actuator, a cutter profiling mechanism driven independently by dual power sources was designed, and its mechanism diagram is shown in Figure 1. The ball screw was selected as the lifting component and arranged on both sides of the actuator. The slider in the lifting component slides up and down through the motor drive on both sides. Concurrently, each slider is linked to both ends of the cutter via a connecting rod. This configuration transforms the vertical motion of the slider into adjustments in both the height and orientation of the cutter.

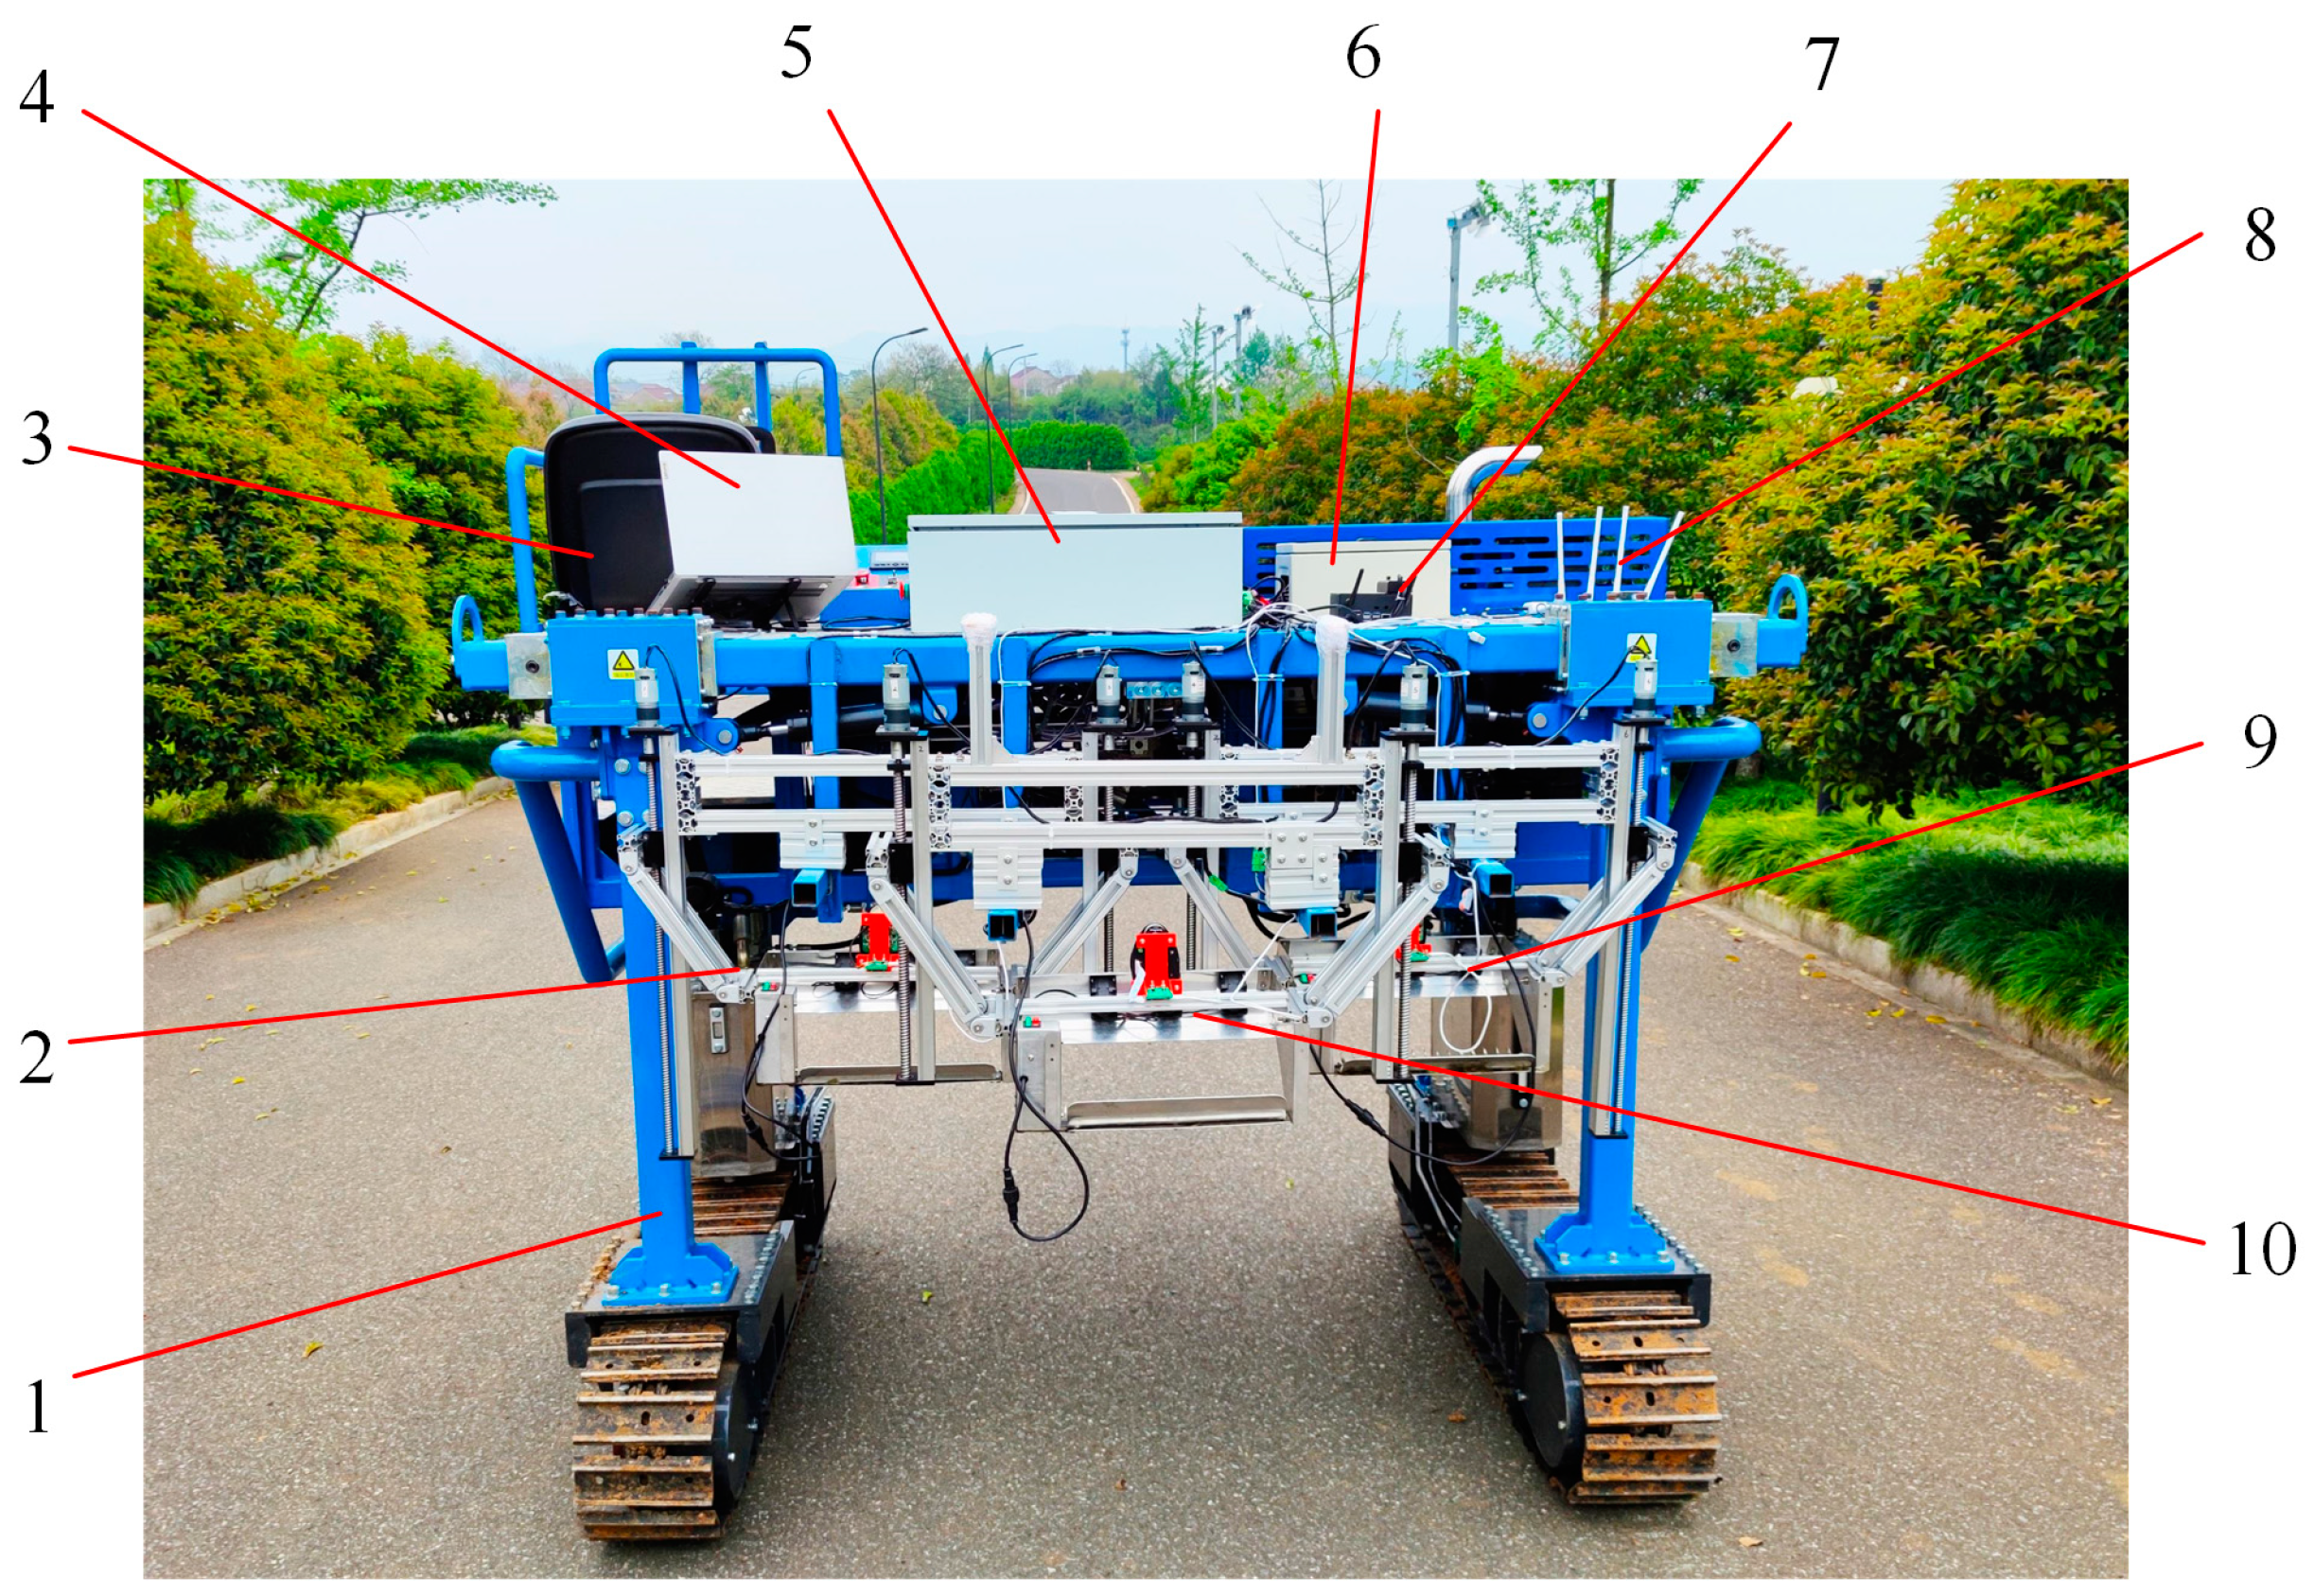
2.1.2. Overall Structure Scheme

The profiling device needs to be designed according to the characteristics of the canopy shape and be able to achieve one-time harvesting of the target fresh leaves on the entire canopy. Based on the characteristics of the end effector, three sets of identical PTHUs, “left, center, and right”, were arranged in segments on the chassis to adapt to the fresh leaf harvesting of curved tea canopy. Figure 2 shows the layout diagram of three groups of PTHUs. The end actuator in each PTHU corresponds to the top and both sides of the tea canopy, respectively, and were arranged in an isosceles triangle shape in the same horizontal plane. Meanwhile, to avoid any movement interference during the profiling tea harvesting operation of each unit, the left PTHU and the right PTHU were arranged at the front end of the rack side by side, and the middle PTHU was located at the rear side of the middle position between the units above.
In order to better adapt to operation in mountainous tea plantations, the chassis of the device adopts a crawler type high clearance platform, which brings strong climbing ability and field driving ability to the equipment. On this basis, the completed structure of the prototype is shown in Figure 3.

2.2. Tea Canopy Surface Perception System through LiDAR

2.2.1. Perception Scheme of Tea Canopy Height

LiDAR can quickly obtain the depth information of surrounding objects, and its non-contact measurement features high detection accuracy, portability and reliability [14,21,22]. According to the motion characteristics of the cutter profiling mechanism and the layout of the whole machine, in combination with the actual application scenario of profiling harvest of fresh tea leaves, 2D LiDAR was selected in this study to sense the tea canopy height. This choice was based on its relatively simple structure, low weight, minimal power consumption, and cost-effectiveness. A 2D LiDAR was installed in the middle of the end actuator of each PTHU. Figure 4 illustrates a schematic diagram of canopy height perception based on 2D LiDAR.
When the LiDAR is scanning 360 degrees in all directions, a plane direct coordinate system is established with the LiDAR ranging core as the coordinate origin. The scan information of LiDAR within the scanning angle range β can be captured by compiling the specific internal signal processing algorithm (the range of β shall be controlled within the maximum range of canopy that can be scanned by the LiDAR during the mechanism’s movement). Point clouds extraction and profiling ranging signal processing could be carried out according to the acquired LiDAR data to realize the profiling movement of each cutter profiling mechanism. This would ensure that each tea harvesting cutter was at the preset height.
Figure 5 illustrates the establishment of the moving rectangular coordinate system with the LiDAR ranging core O as the origin. After collecting the LiDAR information, the main controller processed this data to obtain the 2D point cloud information of the canopy. Subsequently, it derived the optimal linear equation, L, representing the canopy’s profile through the application of a linear fitting algorithm. Under the established moving rectangular coordinate system, the coordinates of points A and B at both ends of the cutter were determined. The shortest distance from A and B to line L (L1 and L2) could be calculated in real time. Then, the L1 and L2 were used as the initial input of the control system and the real-time feedback of the current spatial position of the end harvesting actuator to realize the motion control of the motor on both sides. Based on these, the cutter surface of the ETPA could be kept close to the fitted tea tree canopy surface and within the predetermined height range to achieve the expected profiling action.

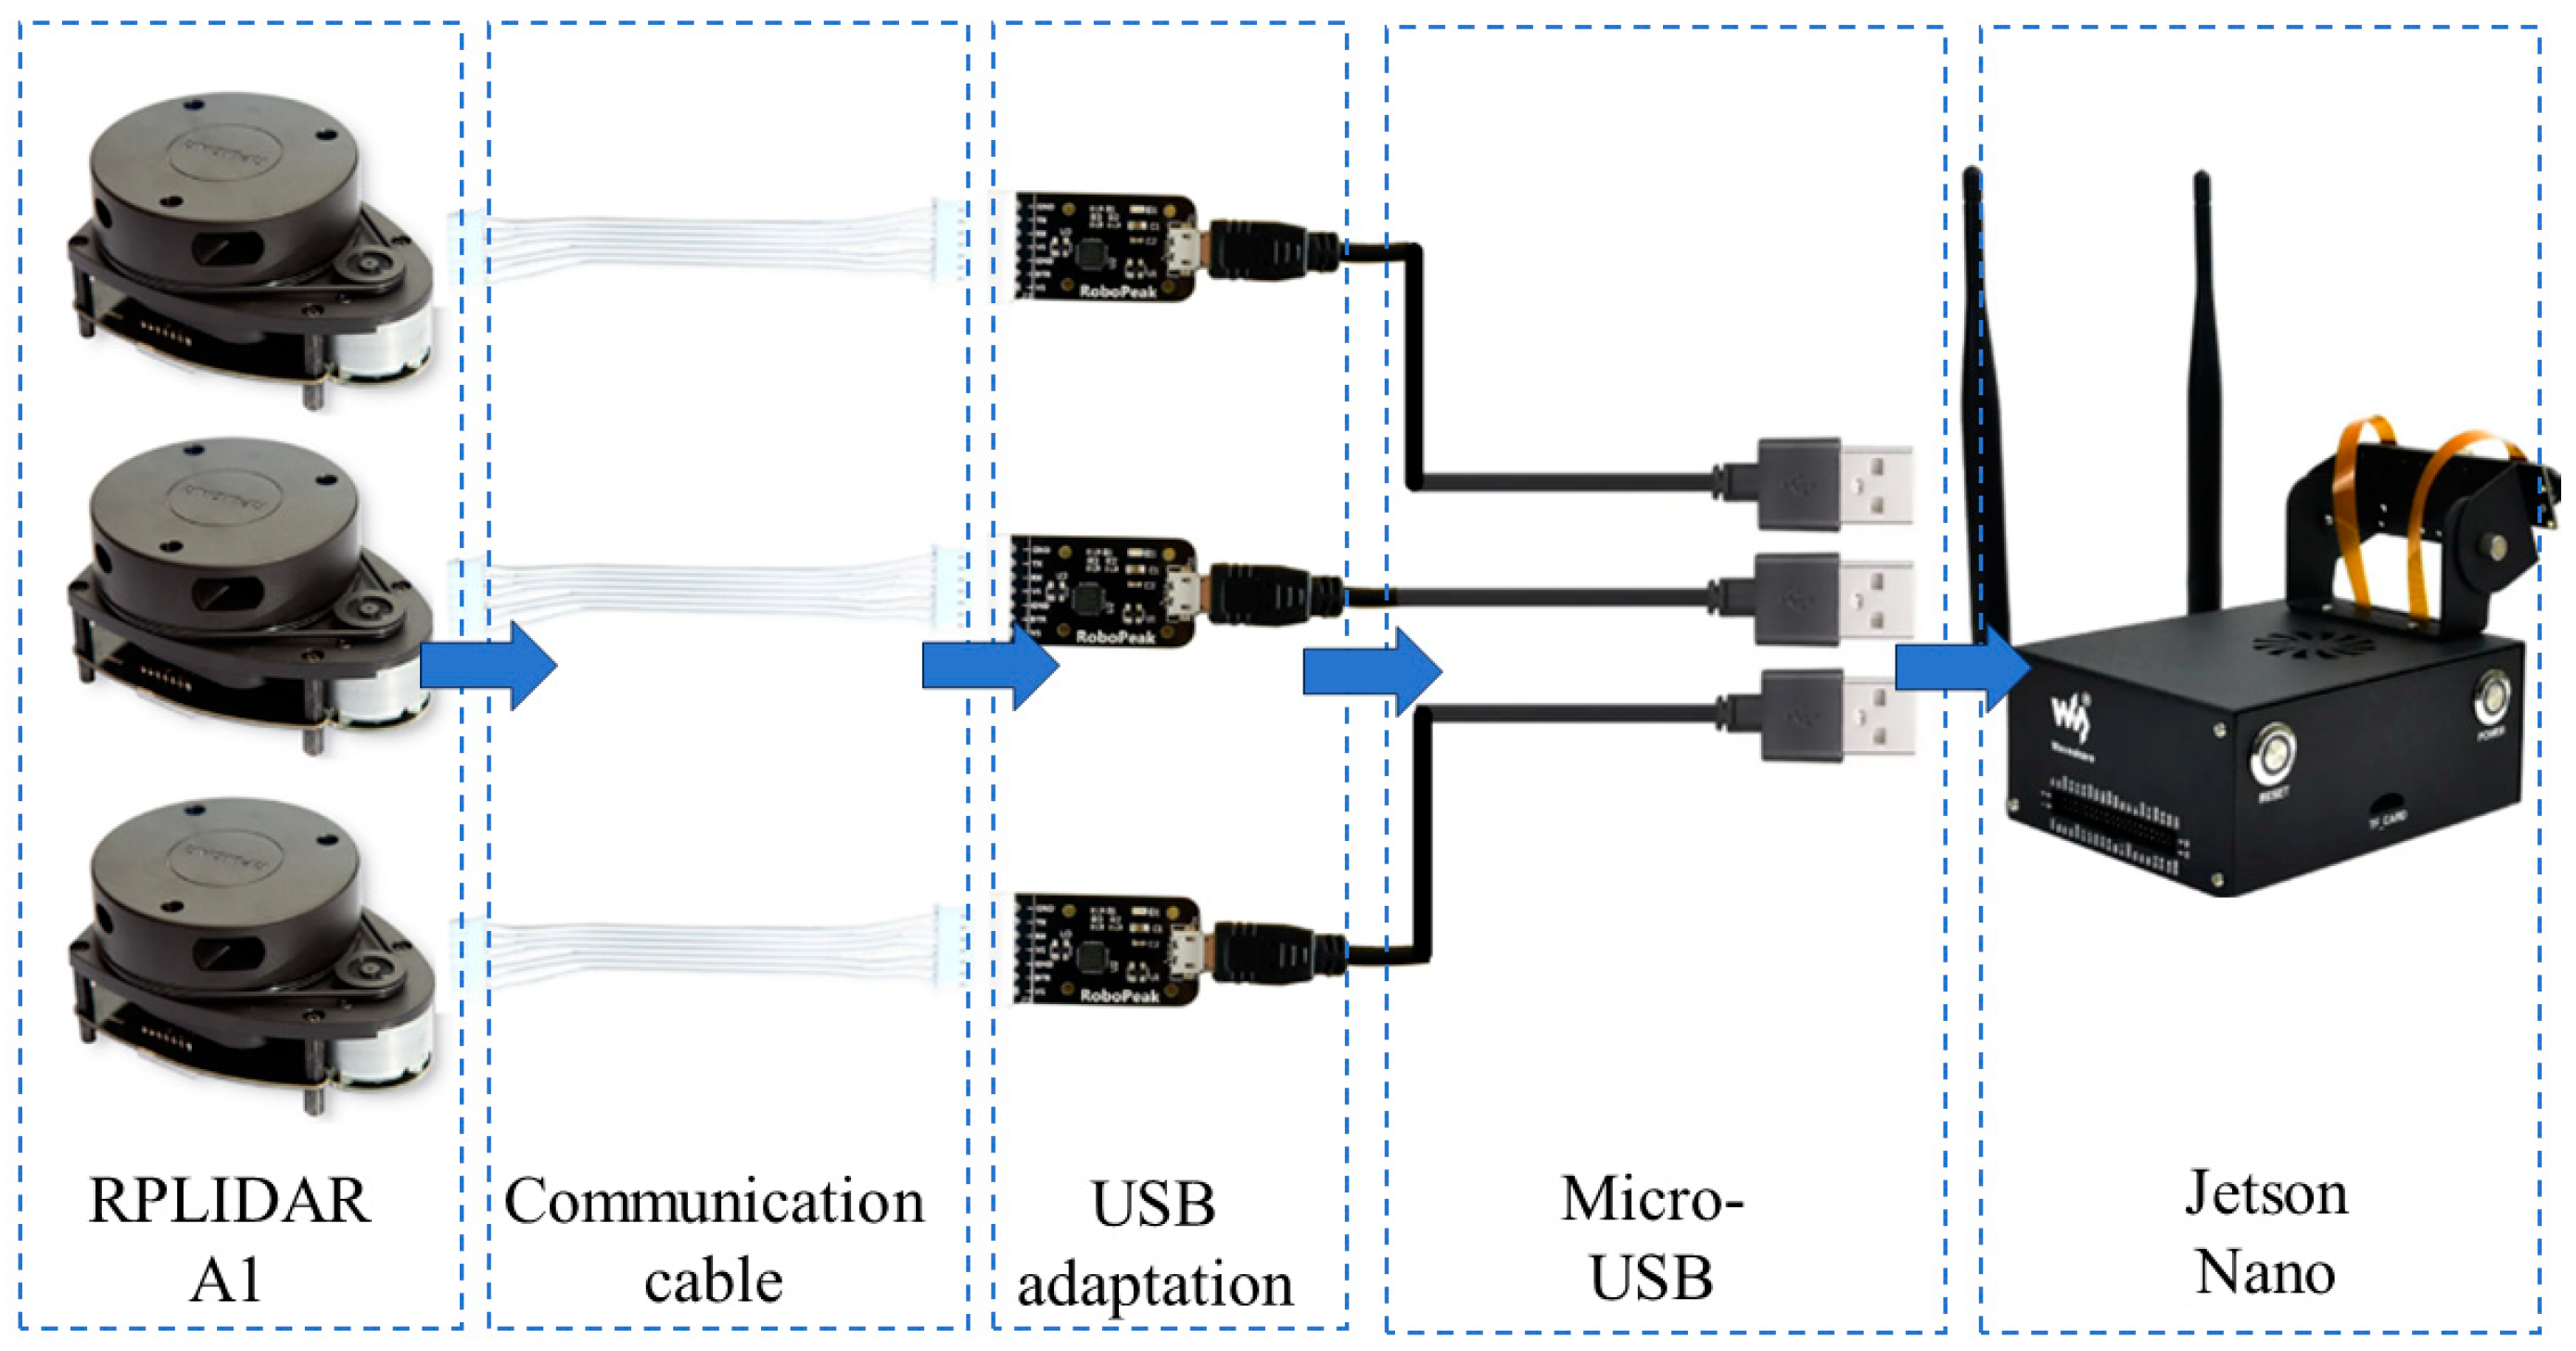
2.2.2. Acquisition of LiDAR Point Cloud

(1)
General plan for point cloud acquisition
In this study, a 2D LiDAR (RPLIDAR A1M8, SLAMTEC, Shanghai, China) was selected for scanning and ranging. The angular resolution of the sensor was ≤1°, and the sensor enabled 360° laser perception on a two-dimensional plane within a radius of 12 m [23]. The upper computer can realize the power supply drive and scanning data acquisition of the LiDAR through Micro USB.
The perception of tea canopy height mainly depends on the 2D LiDAR installed on the end tea harvesting actuator. The LiDAR sends a detection laser to the tea canopy at a certain scanning angle. When encountering the occlusion of tea shoots, the reflection signal is generated. After receiving and numerical processing by the ranging core receiver, the distances from the target point to the ranging core and other information are output. Similarly, if the position of the end actuator and the tea canopy changes, the LiDAR data will change accordingly. Due to the large amount of data output from LiDAR perception, it is necessary to collect and process a large amount of LiDAR data in real time to calculate the profiling height of each end tea harvesting actuator. To sum up, in order to further reduce the impact of data transmission delay on various operations, realize the independent transmission of the sensing signal and profiling motion control signal, and achieve measurement and control separation, this study used a ROS (Robot Operating System) to obtain, process and send the point clouds information of each LiDAR online. A ROS is a robot software platform that integrates many open-source tools and algorithms. Developers can modify and use these resources for various functions, including data processing, mapping, and path planning [24,25]. NVIDIA Jetson Nano (Cortex-A57 CPU, 4 × USB 3.0, China Electronics Satellite Navigation System Co., Ltd., Beijing, China) was used as the system hardware for reading LiDAR data. It operated under a Linux system environment and used a ROS to facilitate the parallel processing of multi-sensor data.
(2)
ROS communication network
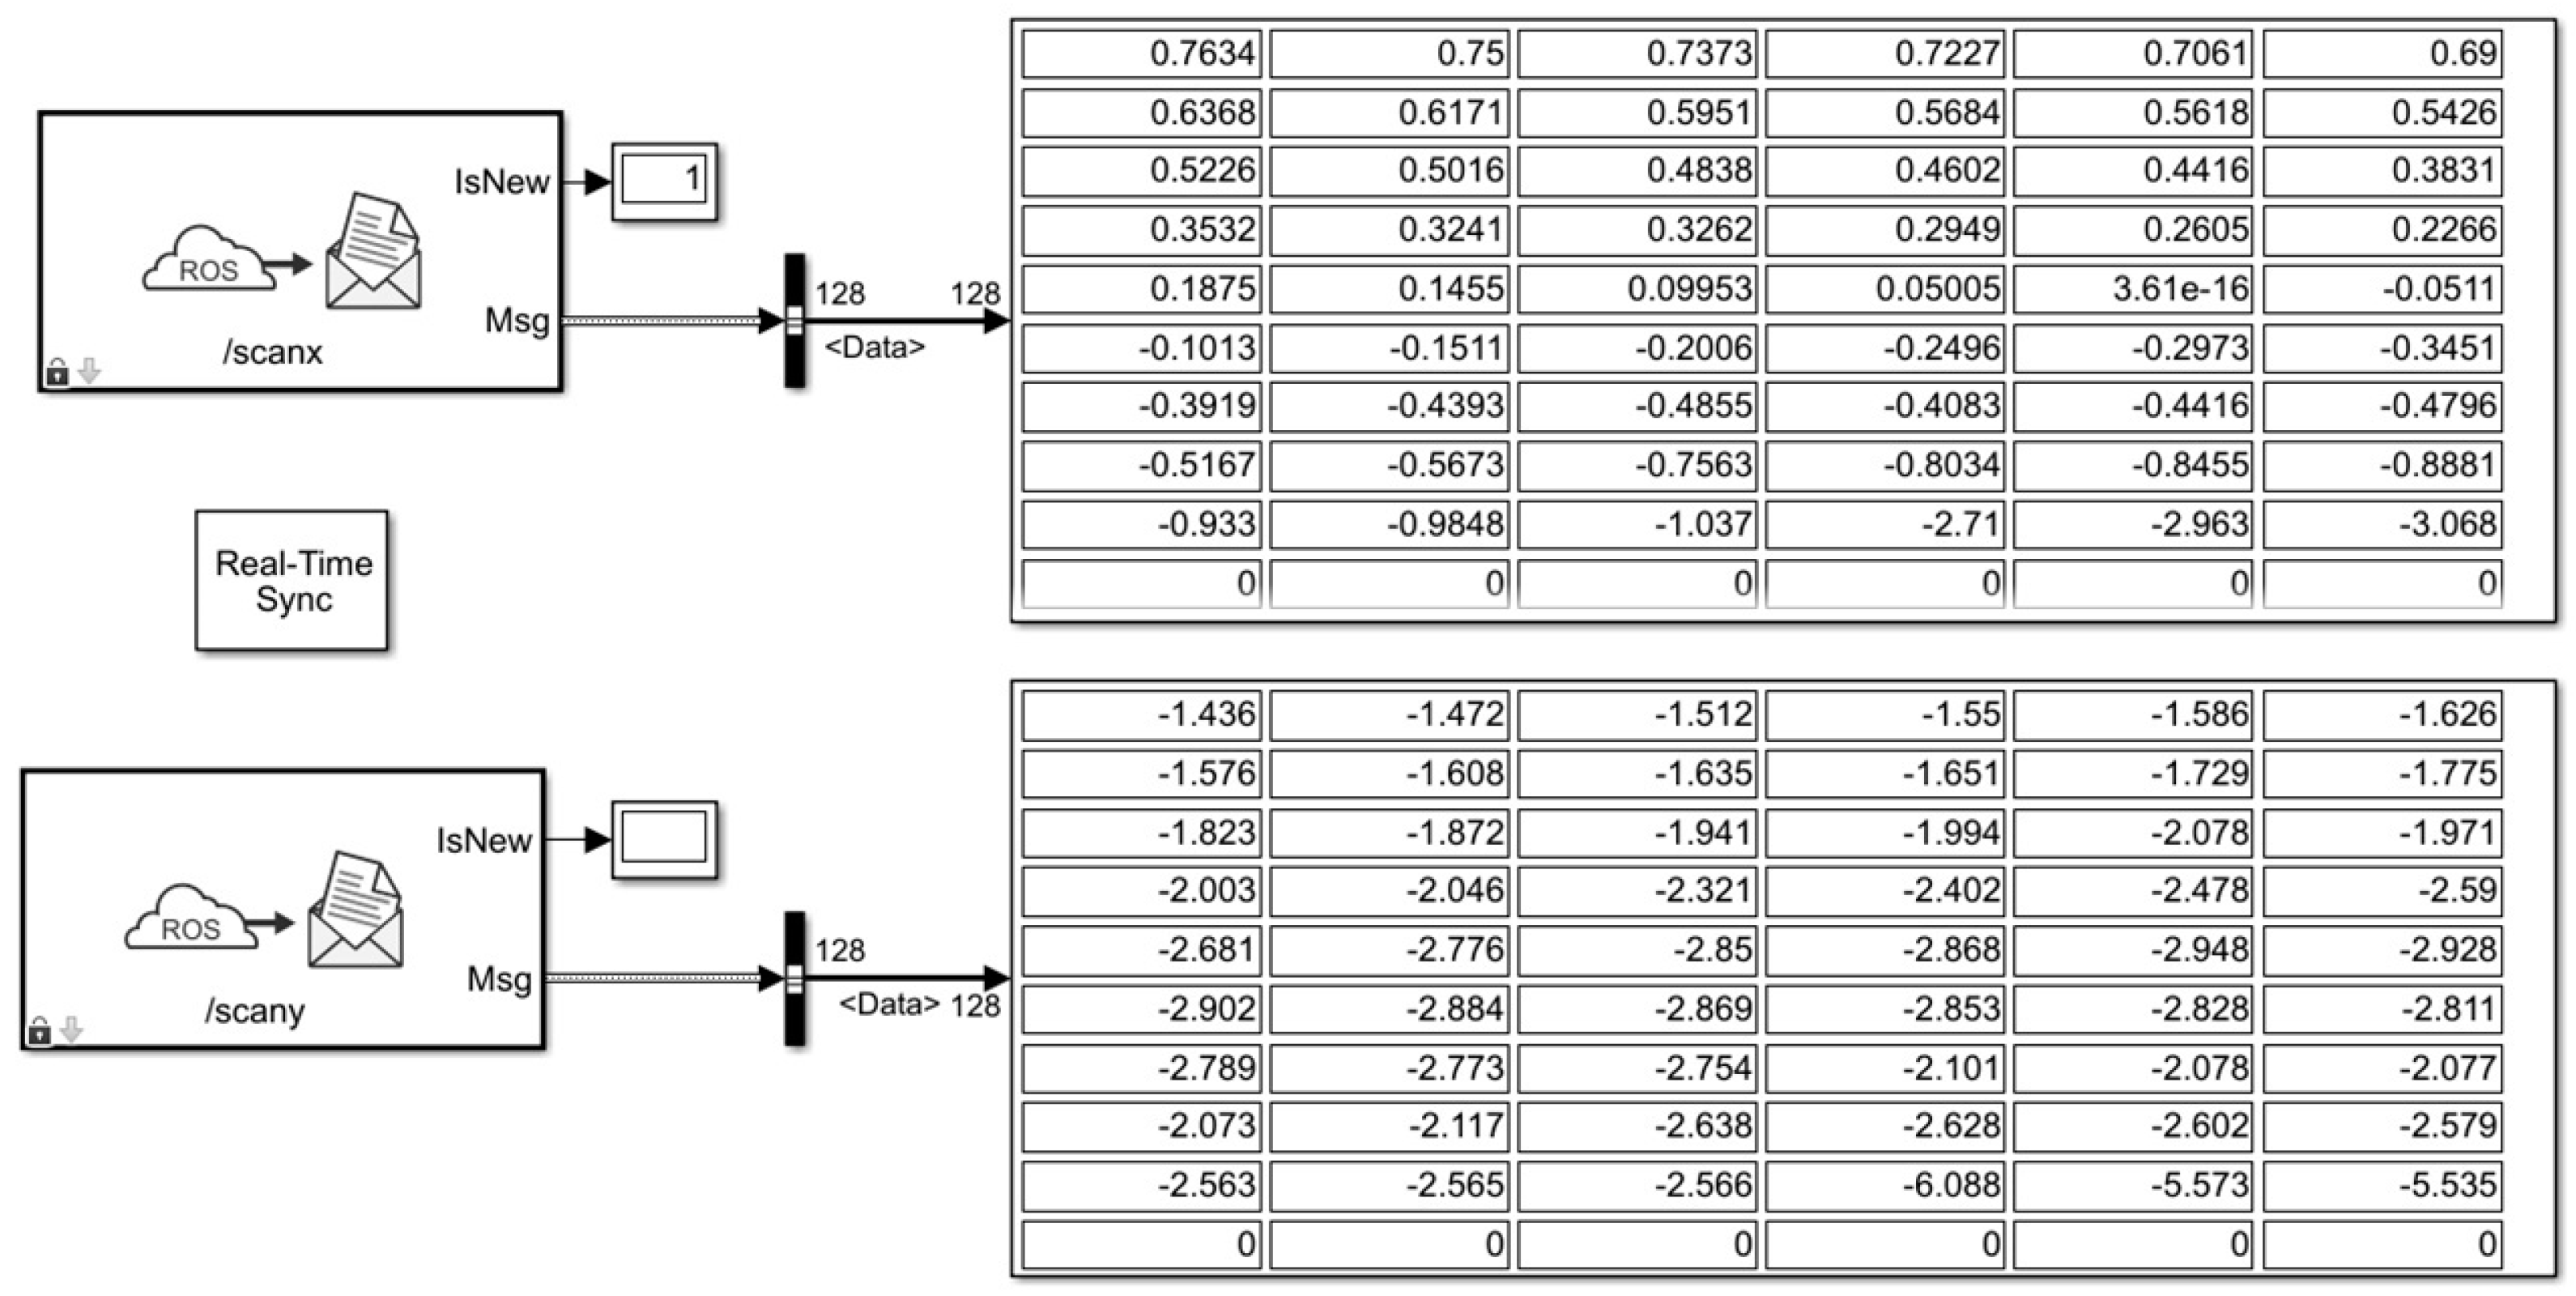
The LiDAR running environment configuration in Nano was completed in advance. This study used a method of topic communication, involving the development of publisher and subscriber modules, to facilitate the real-time acquisition, preprocessing, and cross-platform dissemination of the initial LiDAR data. The initial LiDAR perception information in the issuer includes the distance information from the ranging core to the target obstacle and the included angle information under the current LiDAR coordinate system. Therefore, it is necessary to conduct polar–rectangular coordinate conversion of the publisher’s LiDAR data so as to obtain the specific coordinates of each obstacle scanned point in the LiDAR rectangular coordinate system. The distance information of the obstacle could be displayed in the form of a 2D point cloud. Figure 6 is a schematic diagram of RPLIDAR A1 ranging information coordinate conversion:
In the subscriber’s implementation, the specific program of polar–rectangular coordinate conversion was completed, the polar diameter was converted into the x-coordinate and y-coordinate information of the measured point in the LiDAR coordinate system, and the program was compiled and executed after all related operations were performed. Following the completion of all of the above communication environment deployments, a RPLIDAR A1 was connected to the Jetson Nano, and the ROS command was executed. The topic of x-coordinate and y-coordinate values of each measured point currently being released could be viewed.
According to the structure scheme of the tea harvesting device in Section 2.1, three RPLIDAR A1s were connected to the Jetson Nano, and the data transmission method is shown in Figure 7. The same synonymous file was created according to the previous steps. The corresponding publisher’s object name was modified, followed by the subscriber’s object name and ROS node name, and the corresponding content modifications were made to the launch files of each RPLIDAR A1.
(3)
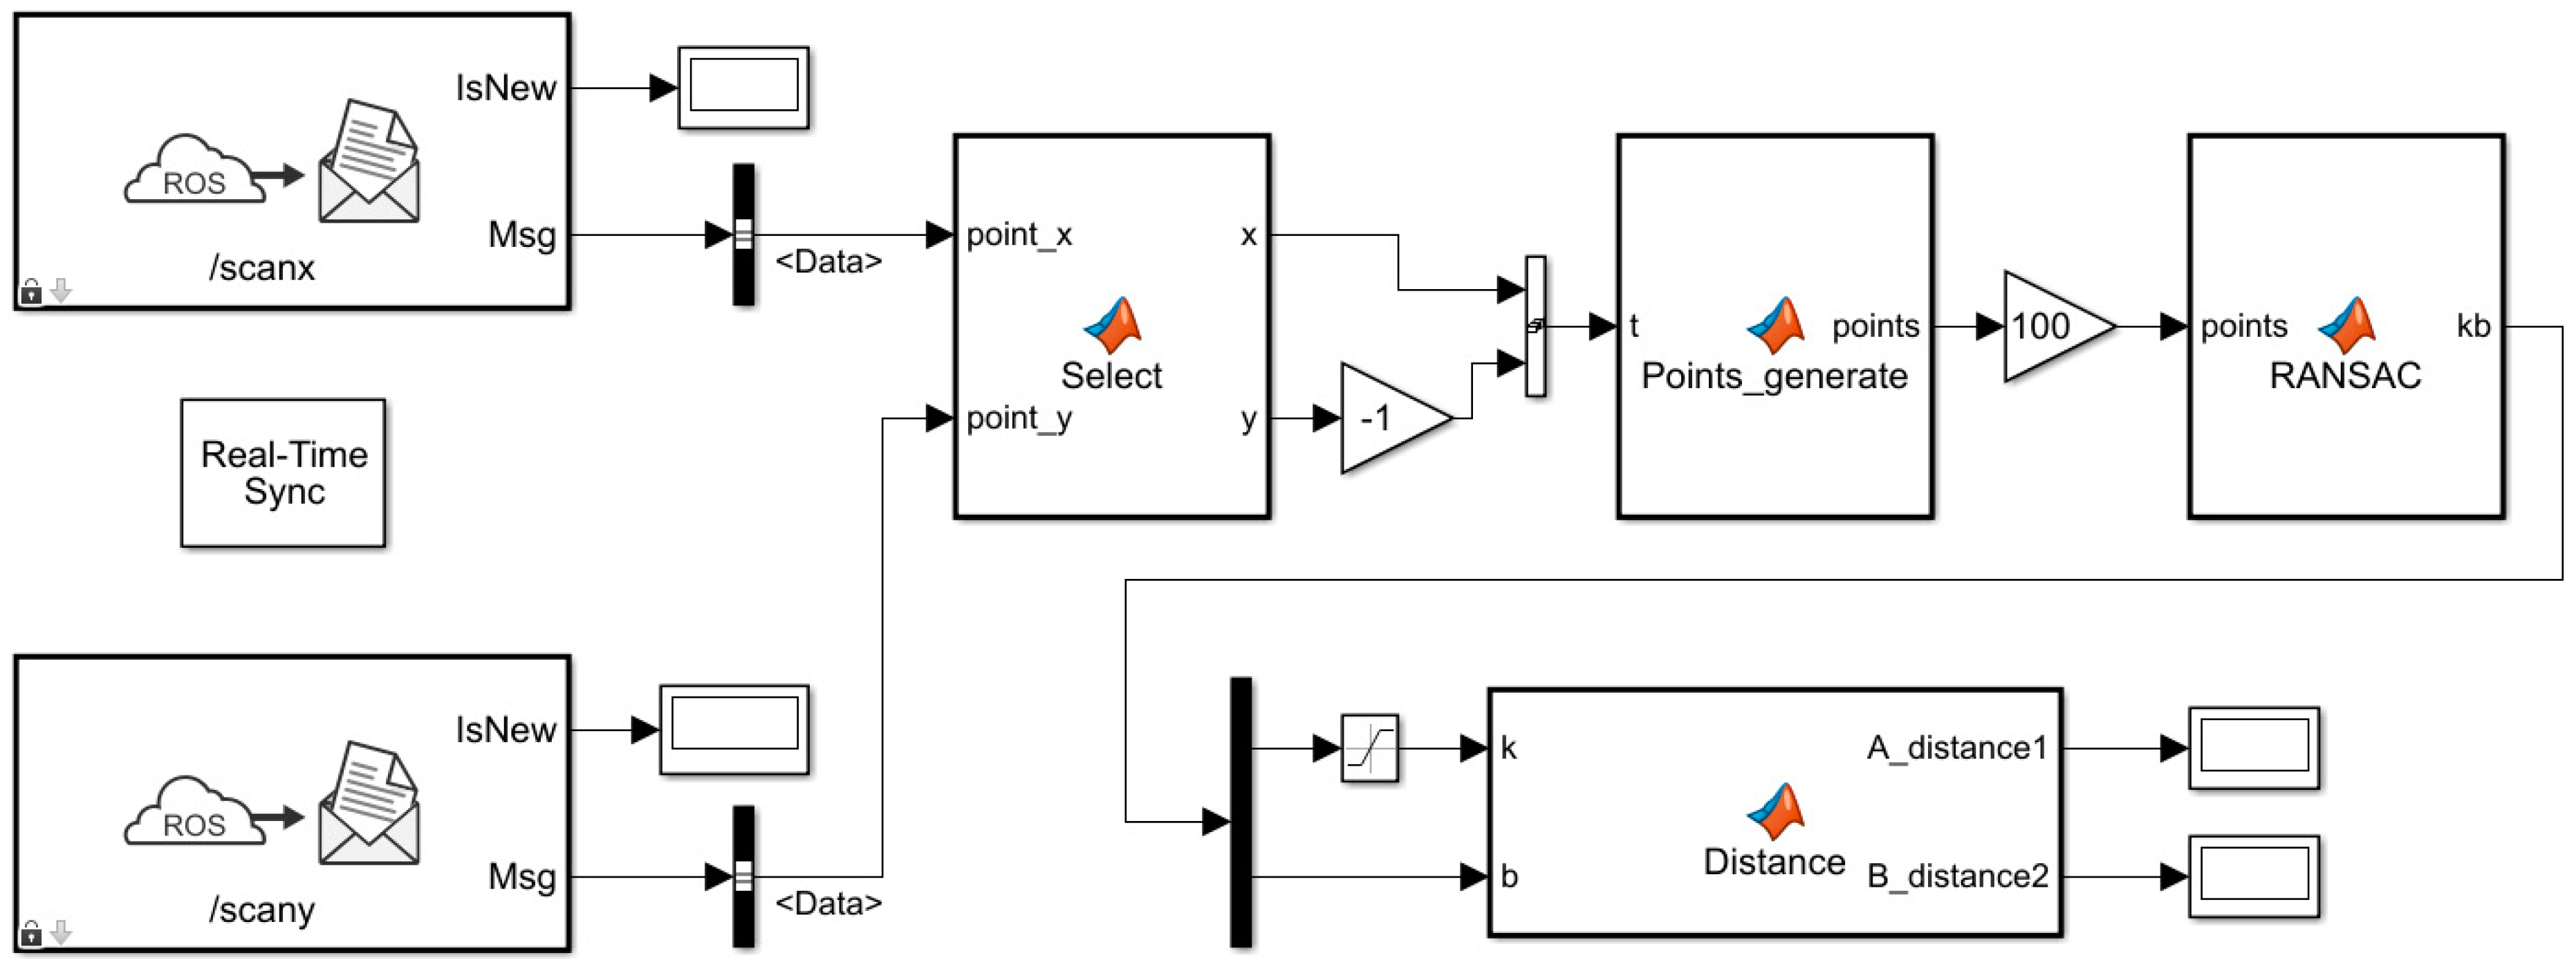
LiDAR point cloud information reception in Simulink environment
The LiDAR senses the surroundings within a scanning angle β and the perception information within the range is the valid canopy information. In this study, according to the actual canopy object and the structure of the profiling tea picker, the value of β came to 60°, which corresponds to an angle range from 330° to 30° (based on 360° a week) in the LiDAR coordinate system. In this range, the tea awning surface that can be scanned by the LiDAR on each PTHU is located in the cutter harvesting space. According to β, the angle limit value in each LiDAR SDK file was modified to output only scanning data within the target angle range.
This study used a ROS system (ROS1) and MATLAB 2020a Simulink to realize the communication between Linux (Ubuntu 18.04) and Windows (Win10) based on WLAN. As a visual simulation tool, Simulink’s environment characteristics and programming language can better meet the real-time processing of LiDAR point cloud information and the subsequent development of a motion controller [26]. This study needed to obtain the complete point cloud information of each 2D LiDAR, including the x-coordinate data and y-coordinate data of the measured point. At the same time, the scanning angle resolution was set to 1°, and the final output of the scanning coordinates within the target angle range was 60. The Simulink program was compiled and executed for online simulation, as shown in Figure 8. And the Simulink could receive the x-coordinate data and y-coordinate data of the points measured by the LiDAR after the scanning angle range was limited to one scanning cycle.

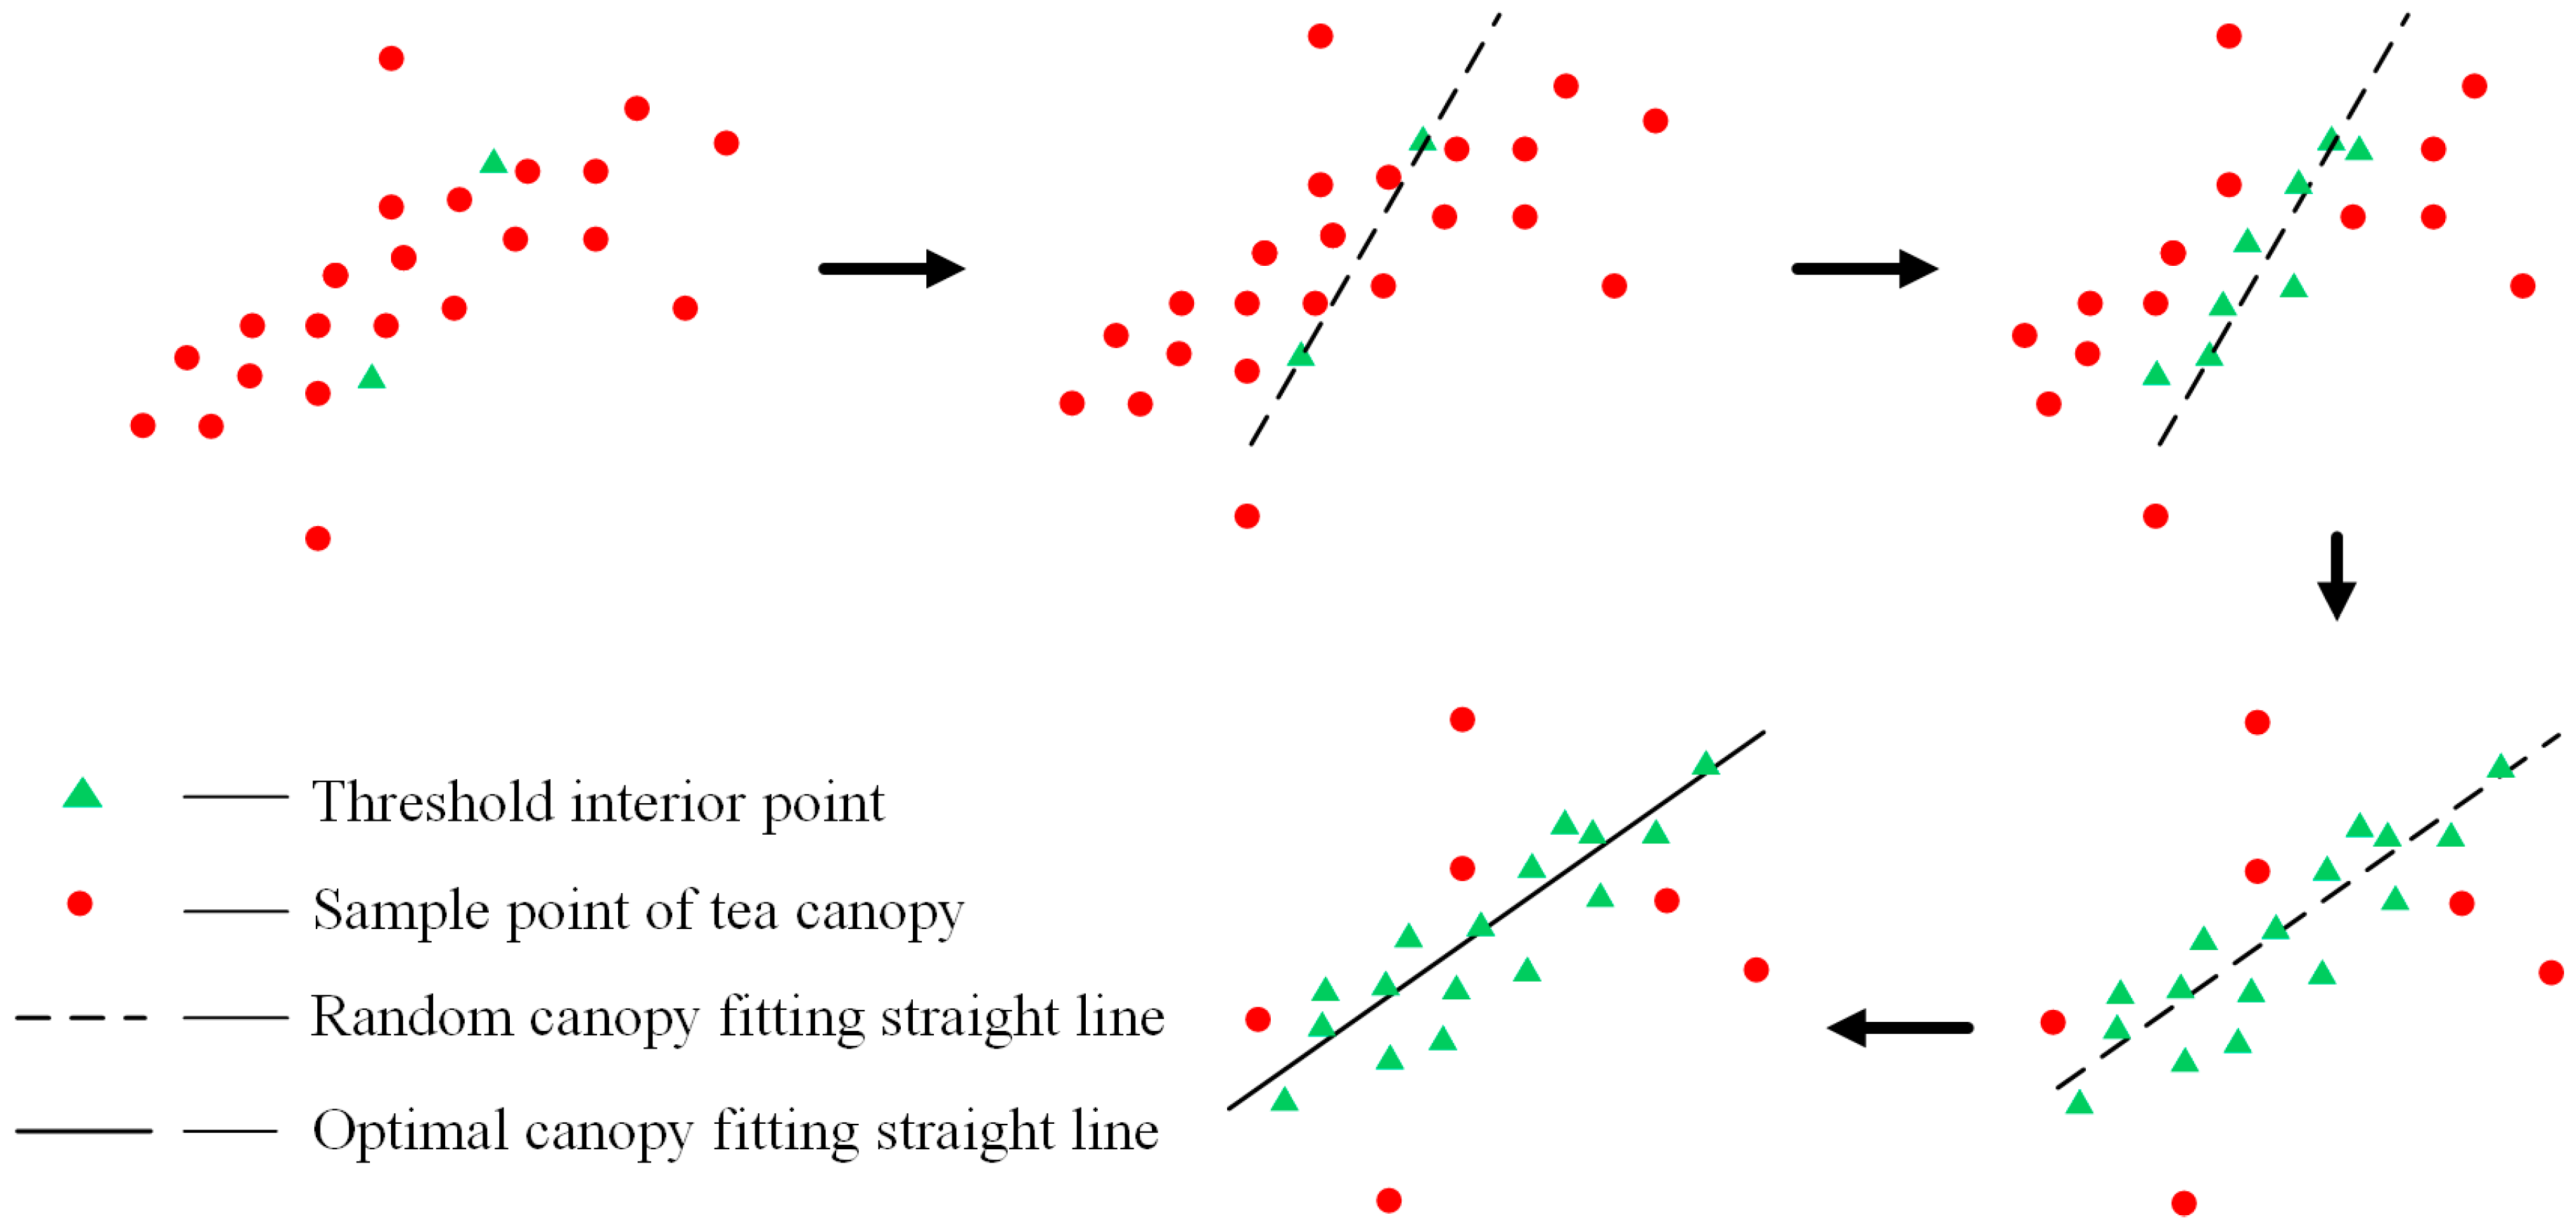
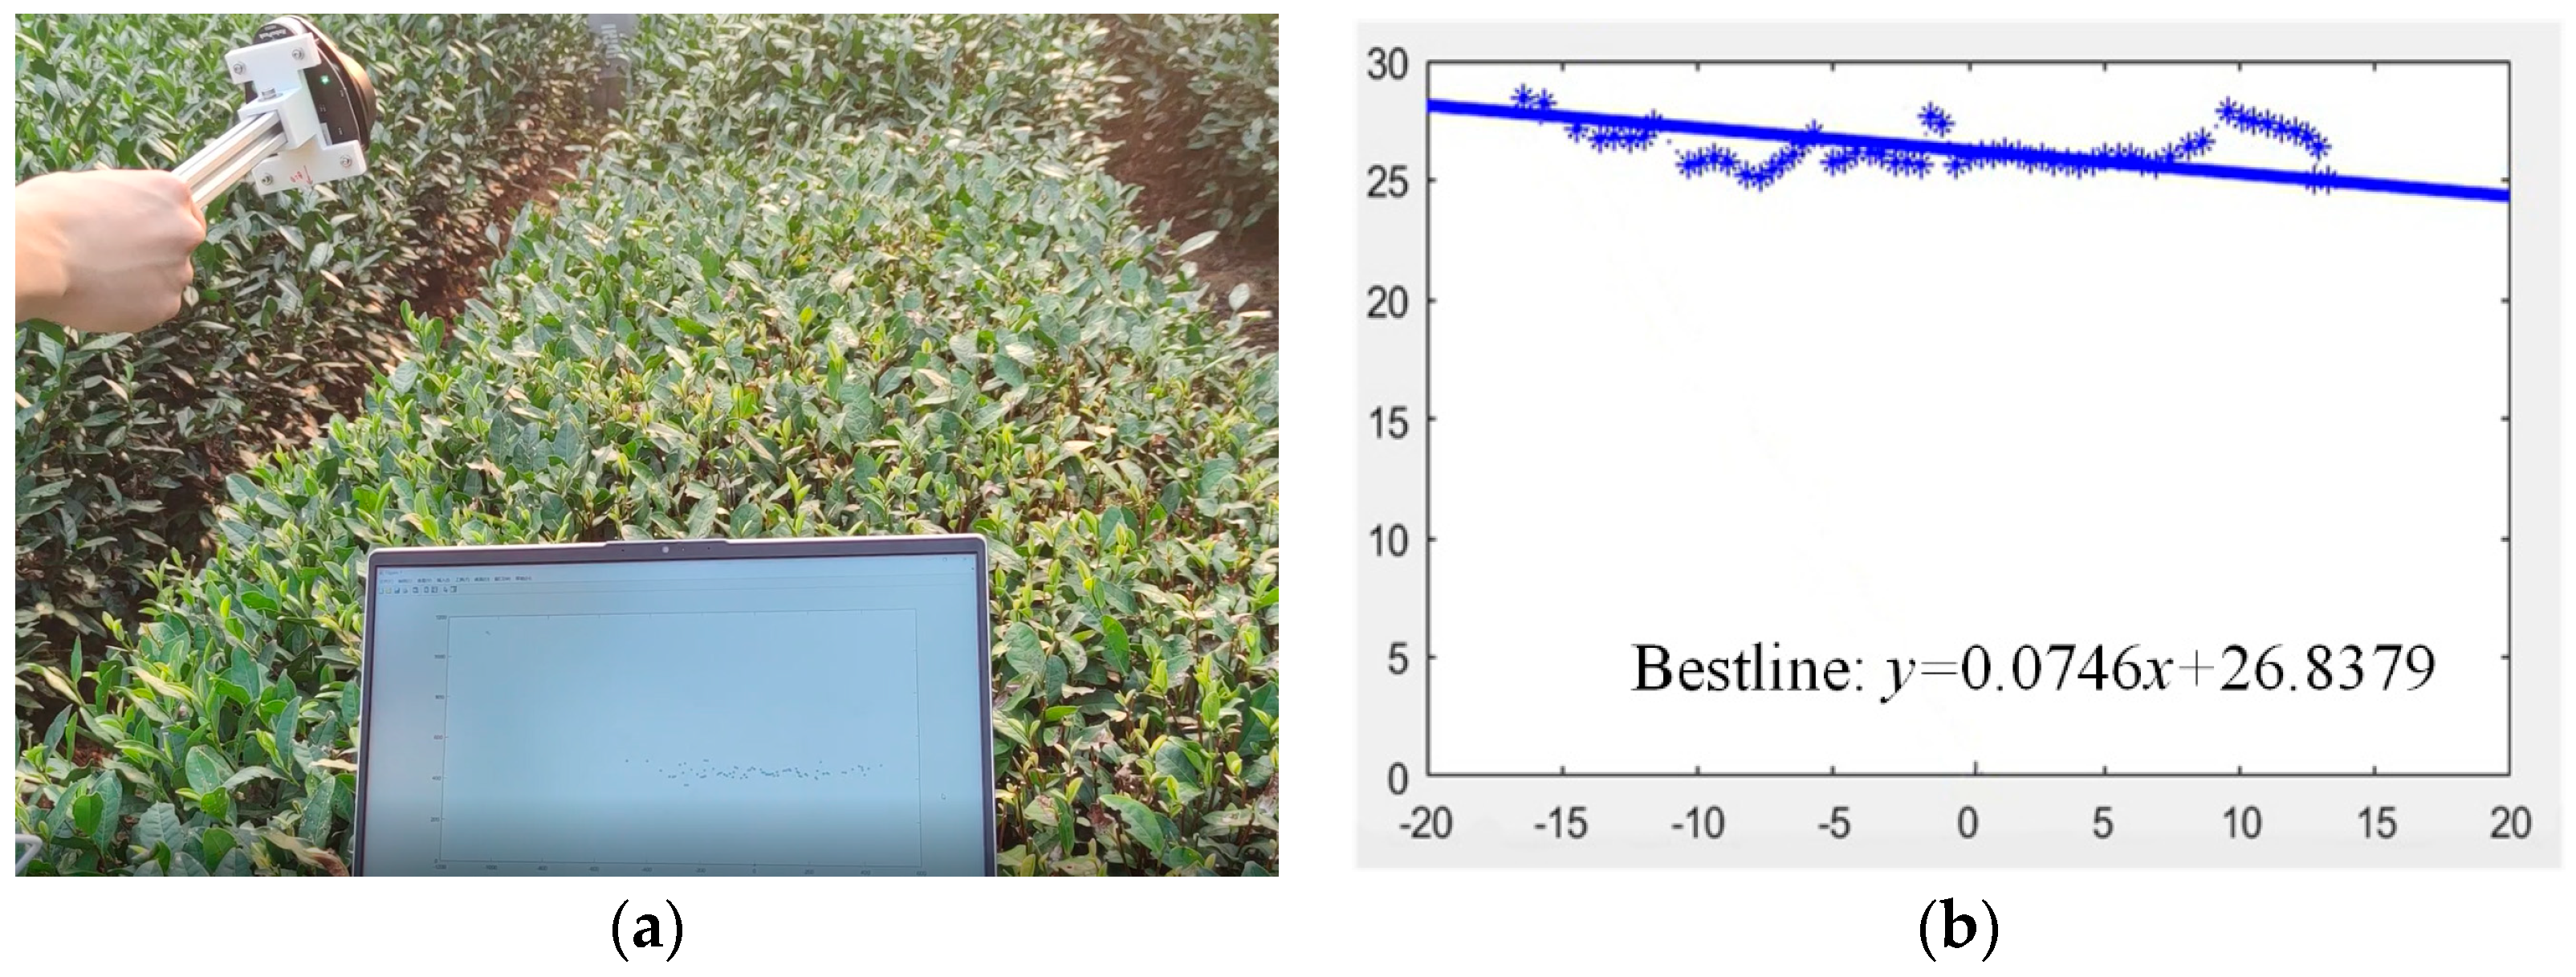
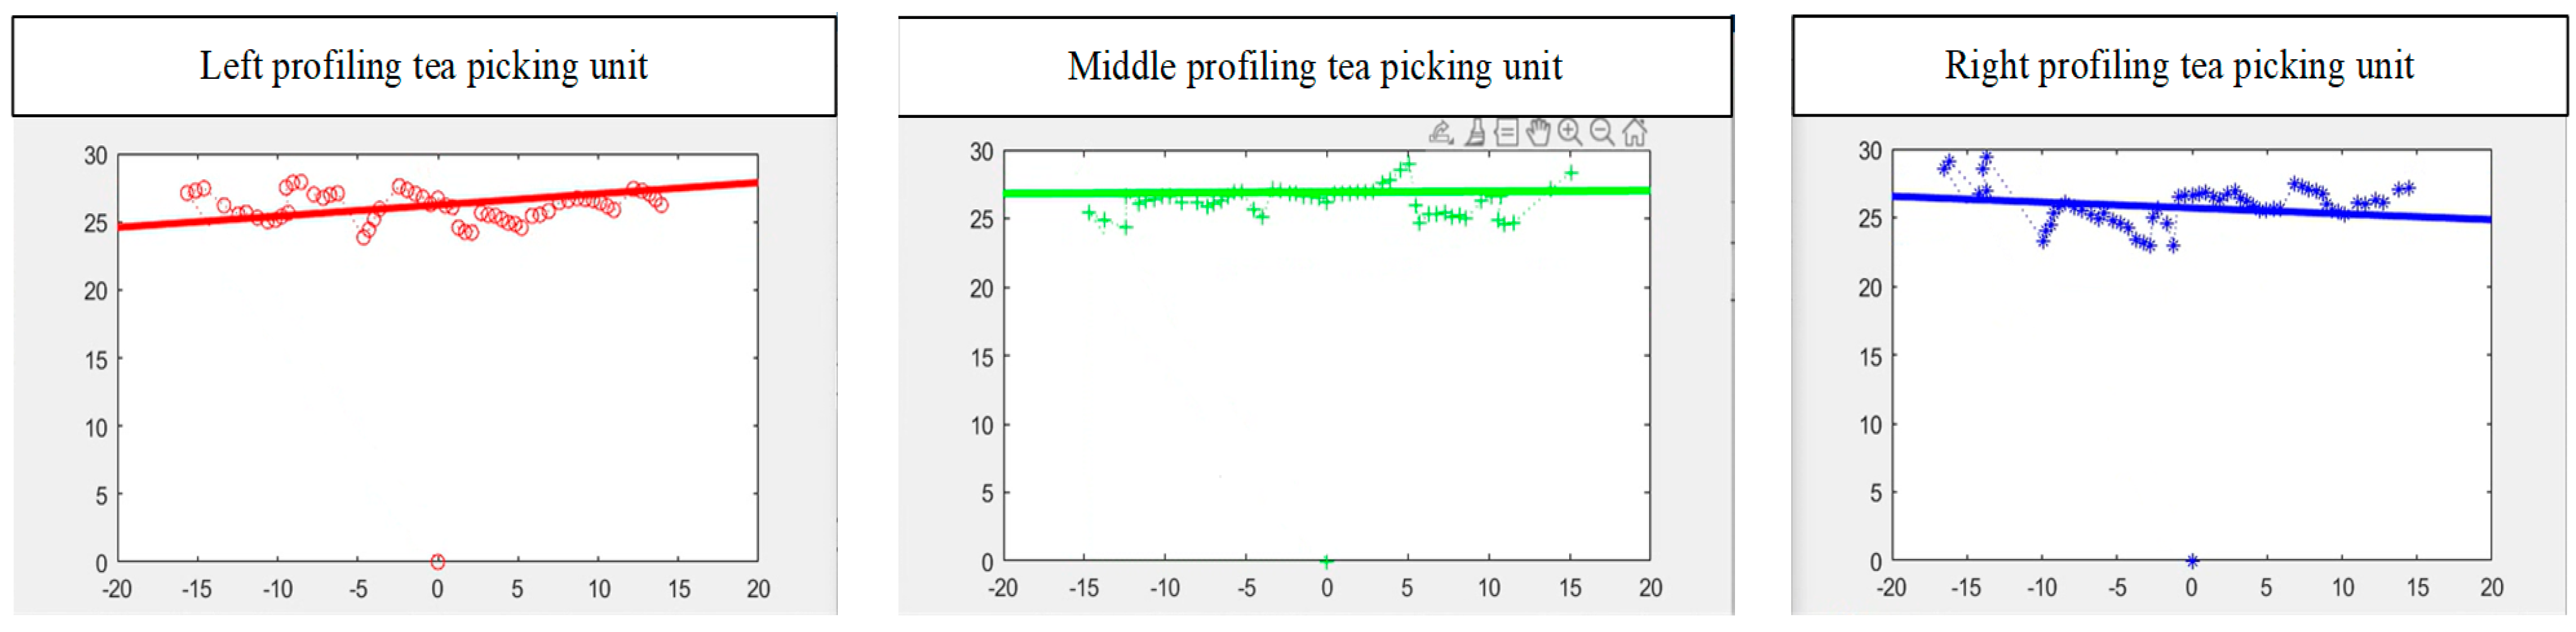
2.2.3. Profiling Height Estimation Based on RANSAC

As the reciprocating straight cutter was used to harvest fresh leaves, to ensure a good coincidence between the cutting surface and most of the tender shoots on the tea canopy, the point cloud fitting predefined model equation was used to realize the prediction of the ideal roof cutting line. Random Sample Consistency (RANSAC) is an algorithm to obtain valid sample data by solving the mathematical model parameters of data based on a group of data sets containing outliers. This algorithm has high robustness to noise and outliers. Compared with the Hough transform, the RANSAC algorithm can obtain relatively better segmentation results [27,28]. In the iterative solution of the algorithm, it is necessary to determine the allowable error threshold σ and the minimum number of iterations u, where the threshold σ is generally selected by experience. Assume that P represents the probability that the points randomly selected from the dataset during iteration are all interior points and r is the data accuracy, which is the proportion of interior points in point clouds and n is the minimum amount of data required for the calculation. The formula is expressed as:
r = n i n l i e r s n i n l i e r s + n o u t l i e r s
Assume that the estimation model must select n points, and the probability that n points are local points in an iteration is r n , then the probability that at least one of the n points is an outlier is 1 r n . That is, if a bad model is estimated from the data set, the probability of failure of u iterations can be expressed as:
1 P = ( 1 r n ) u
Too few iterations would lead to an unsatisfactory fitting of the straight line model, resulting in incomplete and low accuracy of the extracted straight line of the tea tent surface. Therefore, the logarithm of the two sides of Equation (2) can be used to obtain the minimum iteration number u that meets the requirements, and the objective formula constructed can be written as:
u = lg ( 1 P ) lg ( 1 r n )
In the hardware implementation of the equipment, LiDAR was installed on the ETPA through the mounting frame (3D printing manufacturing) as shown in Figure 9a. The installation position should ensure that there was no blade shielding under the scanning surface. For the collected point cloud information within the specified scanning interval of the LiDAR, the RANSAC algorithm was used to solve the problem in real time to obtain the best canopy cutting fitting line. As shown in Figure 9b, with the LiDAR ranging core as the coordinate origin, the coordinates of the two end points of the cutter could be expressed as A (x1, y1) and B (x2, y2), and both were fixed coordinate points in the LiDAR coordinate system. And the measured values were A (200, 190) and B (−200, 190), in mm. According to the above real-time fitting results of the best fitting line and the known coordinate points and other conditions, the shortest distance between the points A and B to the current fitting line could be calculated in real time. Meanwhile, the distance obtained from both sides were used as the position feedback of the current end effector and the required profiling height estimation, which was used as the initial input of the motion control system of each PTHU in the subsequent solution.
After receiving the LiDAR point cloud information within the target range in the Simulink environment, vector interception and the 2 × n matrix conversion program were written first. Then, the profiling height estimation program based on RANSAC was developed, in which the threshold σ was set by empirical method at 3, the iteration number u was the length of yjr LiDAR data received for a single time (set sy 60 in this paper) [27,28]. During each iteration of fitting, the coordinates of any two points P and Q to form a 2 × 2 matrix were selected randomly, which can be expressed as:
x P i x Q i y P i y Q i           i = 1 , 2 , 3 n
where xPi and xQi are, respectively, the x coordinates of P and Q randomly selected; yPi and yQi are, respectively, the y coordinates of P and Q; and i is the number of iterations.
The model parameters of the current combined line were solved through the following Equations (5) and (6):
k = ( y Q i y P i ) ( x Q i x P i )
b = y P i k × x P i
According to the obtained model parameters, the shortest distance between the current points and the linear model was solved by the following formula:
d = ( k × x j y j + b ) k 2 + 1           j = 1 , 2 , 3 n
where xj is the x coordinate of the jth point and yj is the y coordinate of the jth point.
After the iterative solution of the point cloud was completed for each round of scanning data, the model parameters of the best canopy fitting straight line were obtained. Moreover, by solving Equation (8), it obtained two groups of shortest distance values from the points A and B at both ends of the cutter of this group of PTHU to the best fitting line of the canopy surface in this round of scanning. The D-value between the distance value and the preset cutter target height in the subsequent control system was the profiling height estimation for this group of PTHUs, which is the final required solution of this algorithm:
d A = ( k best × x 1 y 1 + b best ) k best 2 + 1 d B = ( k best × x 2 y 2 + b best ) k best 2 + 1
where dA is the shortest distance from the end point A to the fitting line of the optimal canopy surface, dB is the shortest distance from the end point B to that line, kbest is th slope of that line, and bbest is the intercept of that line.
Figure 10 shows the iterative process of curved point cloud line fitting based on RANSAC. The main method steps include: (1) Treating all sample points as selected objects. (2) Randomly selecting 2 points from the sample points to fit a straight line. (3) Counting the number of points within a certain threshold range for the straight-line model obtained from 2. (4) Repeating the process 2 and 3 multiple times until the model with the highest number of points within the threshold is found. (5) Using all threshold points to re-estimate the model. (6) Choosing the most supported model as the solution. Specifically, through multiple random sampling and fitting, the sample points of the tea canopy surface in a certain direction were obtained by LiDAR scanning. The number of sampling points that met the threshold condition were counted in each fitting result. Finally, the result with the highest number of points within the threshold was used as the optimal fitting line. The fitting programming was accomplished using MATLAB language and a MATLAB Function block within Simulink. Furthermore, a modular program interface for estimating the profiling height, based on the RANSAC algorithm for single LiDAR ranging, was developed, as depicted in Figure 11. The shortest distance value from the two ends A and B of the cutting blade was taken as the best fitting straight line for the roof cutting in this round of scanning as the output.
The field experiment of the point cloud processing method is shown in Figure 12. The detected LiDAR data is sent to Simulink through the aforementioned ROS system, and the height estimation program is run with the addition of scanning points and visualization operations of fitting lines. The measured points and best fit line of the tea tree canopy obtained from a certain scan were captured as shown in Figure 12b, and the feasibility of the constructed contour height estimation program was verified by comparing it with the actual canopy situation.

2.3. Development of Overall Control System

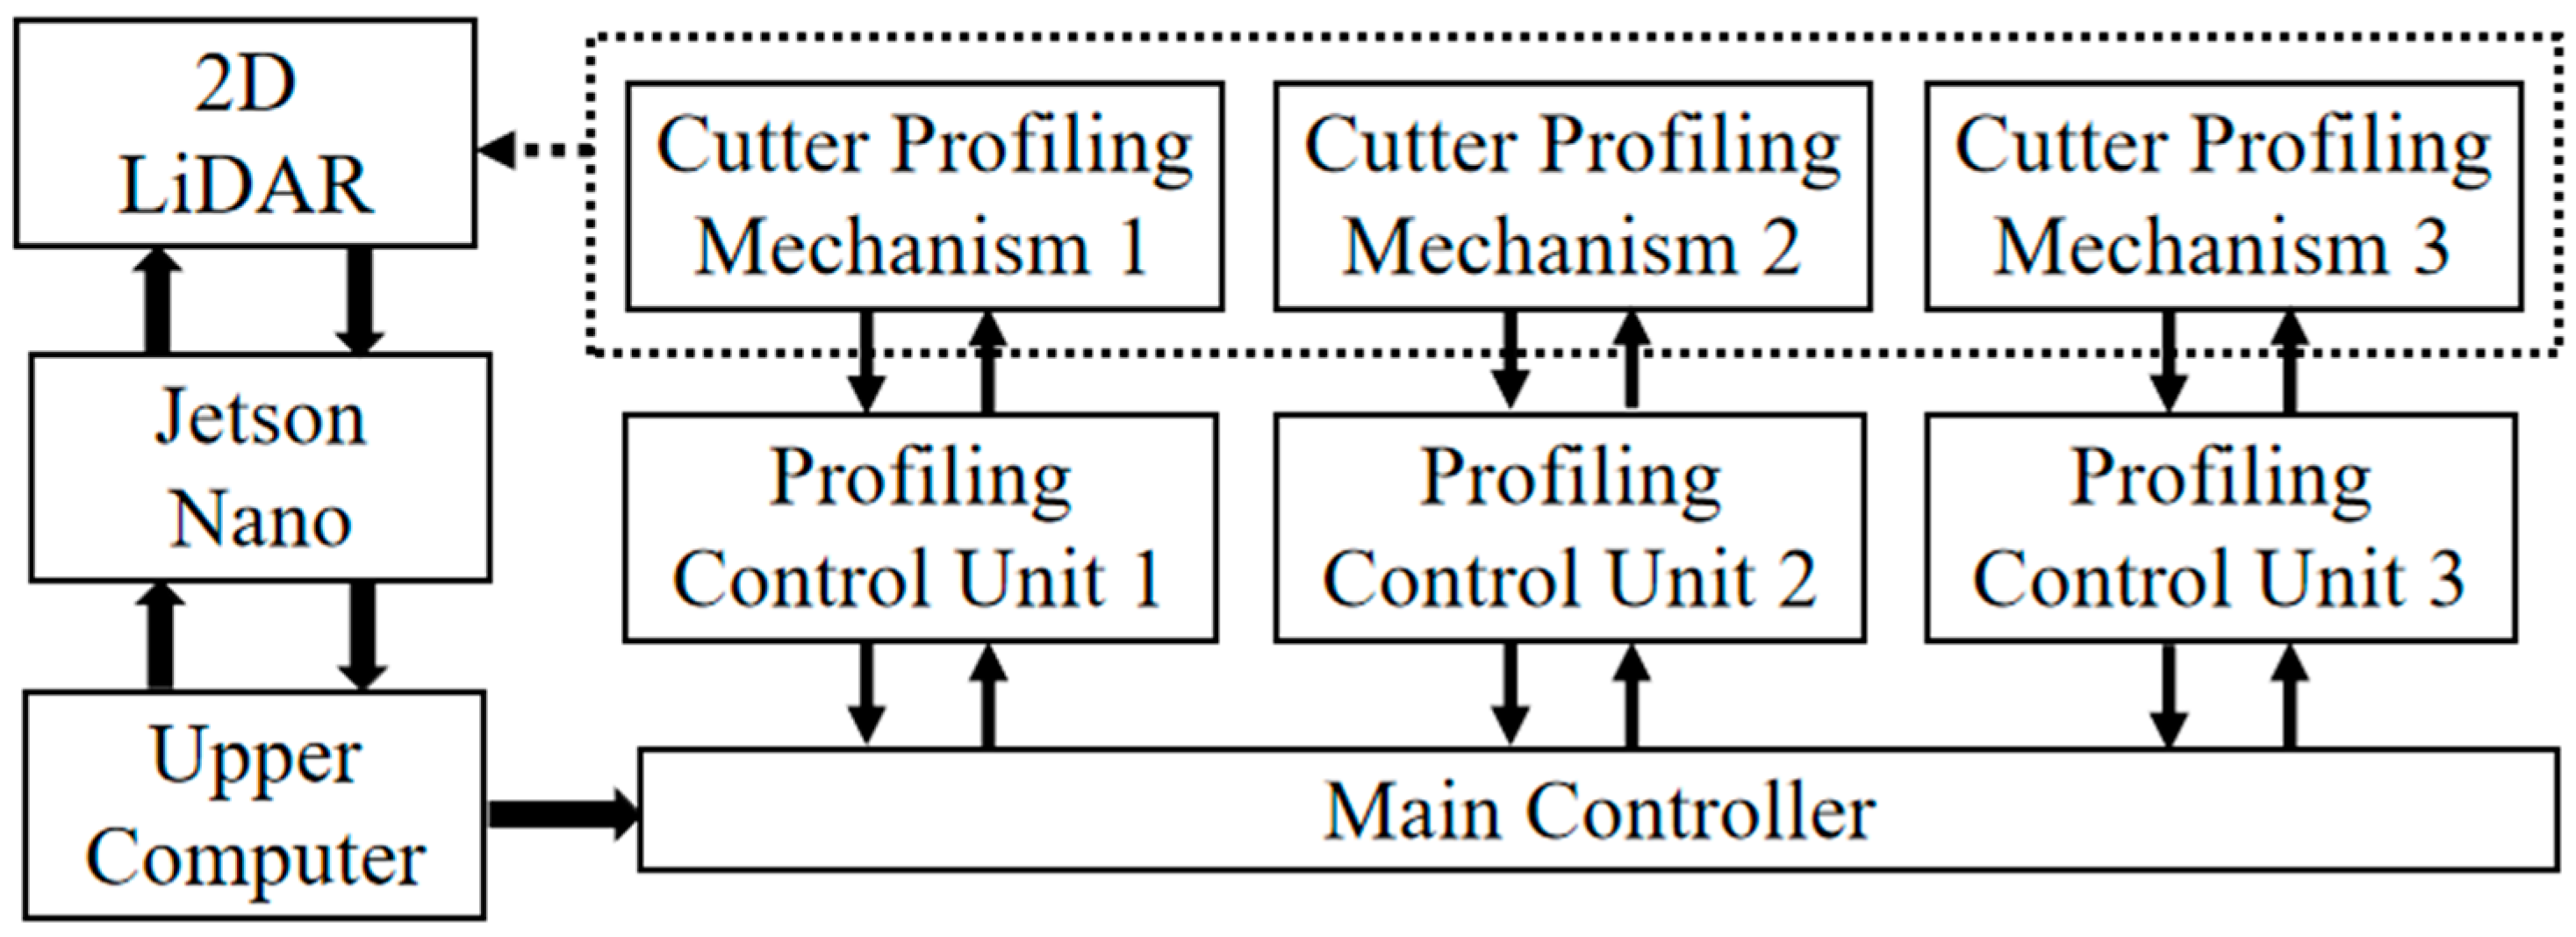
2.3.1. Electric Control System Scheme of the Harvesting Device

According to the field operation requirements of the profiling tea harvester, it was ensured that each PTHU could complete the expected tasks such as canopy height detection, cutter profiling motion execution, and end current position feedback. It should be able to achieve real-time processing of multi-source data. The electronic control system of the whole machine adopted a segmented architecture design with a simple structure, as shown in Figure 13. The system model was composed of a 2D LiDAR, Jetson Nano, upper computer, main controller (MCU) and profiling control unit nodes. The 2D LiDAR scanned and output the distance information from the current ETPA to the canopy in real time. The Jetson Nano acquired the data and realized data interchange with the upper computer. The upper computer and the main controller were responsible for the online processing of the distance information detected by each laser LiDAR. The corresponding profiling control decisions were made according to the current spatial position of the end tea harvesting actuator. Among them, the real-time scanning data from the 2D LiDAR installed on the tea harvesting actuators at each end was used as both the distance information of the current canopy surface and the real-time feedback of the position and attitude status of the current actuator. In this study, according to the actual width of the tea harvesting canopy, there were 3 groups of profiling control unit nodes, which correspond to the left, middle and right groups of PTHUs in turn.

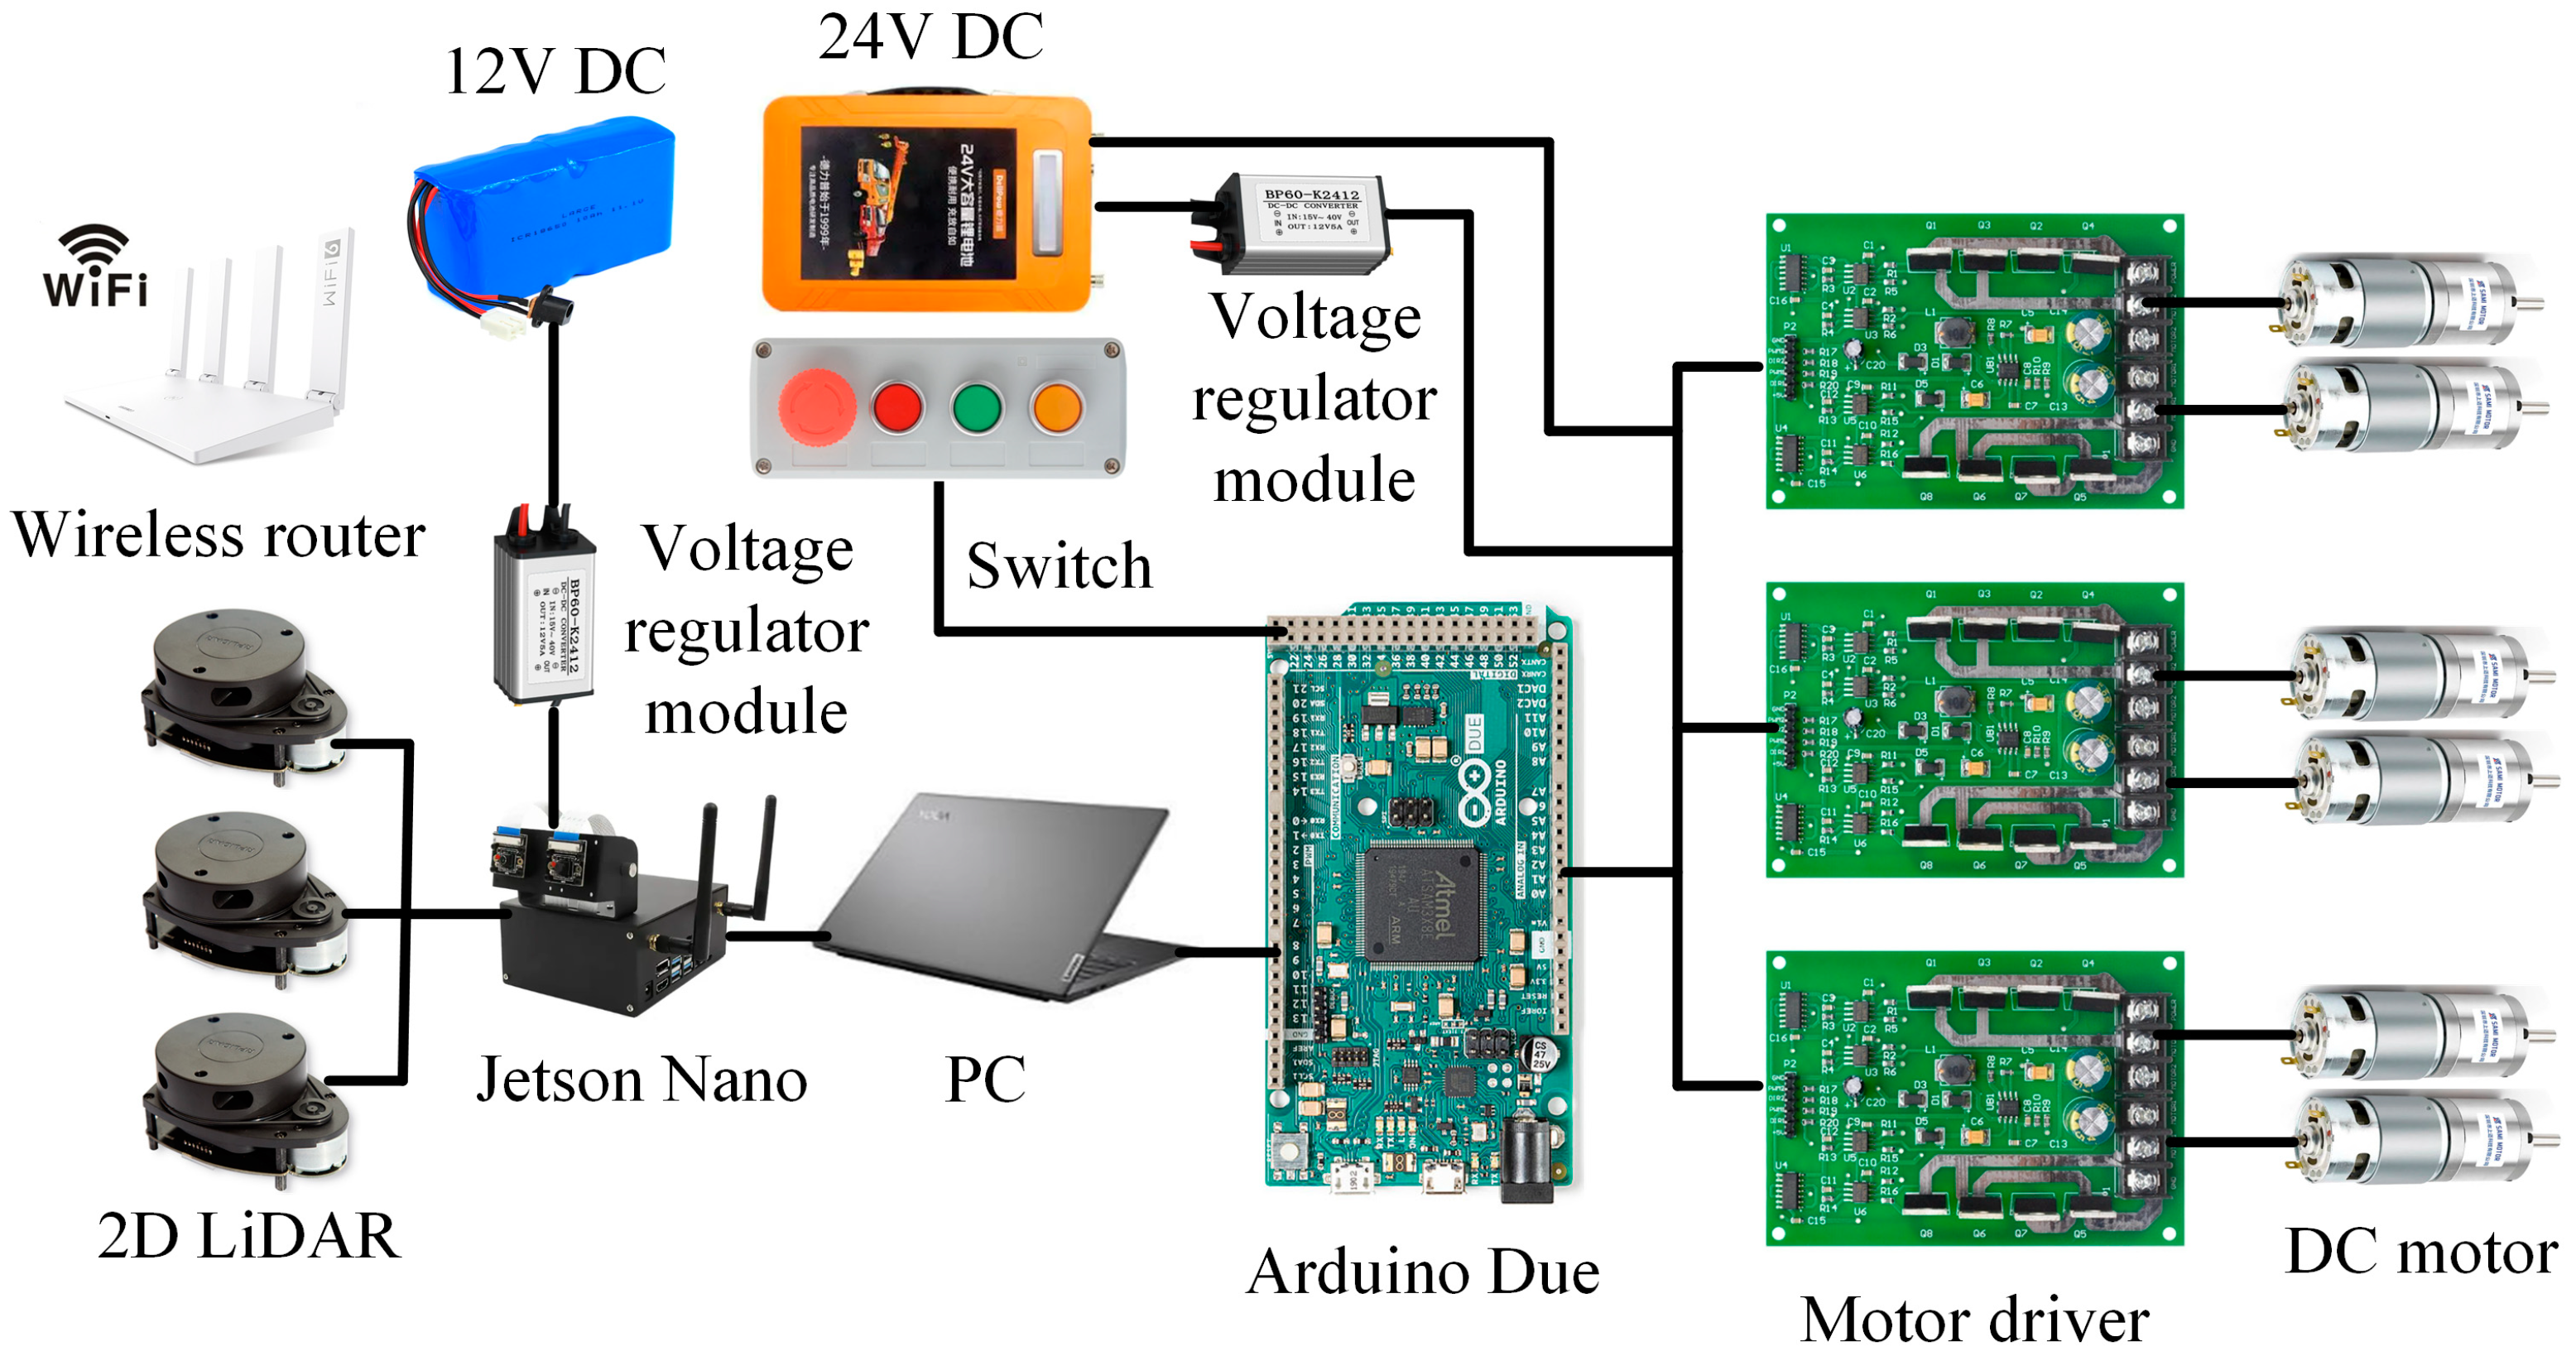
2.3.2. Hardware Composition of Electric Control System

The hardware of the electric control system of the harvesting device designed in this study included a 2D LiDAR, Jetson Nano, PC, MCU, DC power supply, voltage transformation module, DC motor, DC motor driver, control switch, wireless router, serial port device for communication with an industrial control computer and an upper computer. Figure 14 is the schematic diagram of the hardware composition of the electronic control system of the whole machine. The MCU used an Arduino Due development board (32-bit ARM Cortex-M3 chip), with 54 digital input/output interfaces (12 of which can be used as PWM output) and 12 analog input interfaces. Meanwhile, the DC motor control scheme based on PWM technology was adopted for the research on the profiling motion control of the cutter profiling mechanism.

2.3.3. Design of the Control System

The measured signals of the research object in this study belonged to discontinuous signals with random ambient noise under outdoor conditions. The use of a nonlinear tracking differentiator (NTD) could realize the reasonable extraction of continuous signals and differential signals [29]. Through preliminary research, a new PNTD controller based on NTD in view of the shortcomings of a traditional PD control and the actual situation of field operation of tea pickers was built, and the feasibility of the system design was verified through experiments [8]. MATLAB Simulink was used to modify the corresponding algorithm and readjust the parameters based on the PNTD controller. The distance deviation of the corresponding PTHU processed by each profiling control unit node was taken as the input of the controller. The profiling motion control quantity of the corresponding controlled object was obtained through the solution operation of the post control system.

2.3.4. Rapid Control Prototype of the Whole Machine

Each PTHU realized the adjustment of the height and inclination of the ETPA through two motors on both sides. To facilitate the motion control of each motor, the two motors of the left PTHU were named motor 1 and motor 2 from left to right in the view direction in combination with Figure 3. The points on both sides of the cutter corresponding to each motor were named as point 1 and point 2. Similarly, the middle PTHU had motor 3, motor 4, cutter point 3 and point 4. The right PTHU had motor 5, motor 6, cutter point 5 and point 6. The control system flow of the whole machine was finally drawn as shown in Figure 15.
This study adopted Rapid Control Prototype (RCP), based on Arduino and Simulink, to realize the development, code generation and download the sensor control algorithm of the whole machine [30,31]. In the Simulink environment, the data receiving unit based on ROS, a point cloud fitting unit based on the RANSAC algorithm and a cutter profiling height estimation unit were successively built to form a signal processing module. In addition, the multi motor control unit based on the PNTD control law was built as the motion control module. On this basis, the rapid control prototype system of the whole machine was developed through hardware in the loop simulation and online tuning of the control parameters.

2.4. Field Test

2.4.1. Experiment Site

In order to assess the adaptability of the prototype to the current tea growing conditions and the terrain of the tea plantations, a field harvest experiment was carried out in Shengzhou (Zhejiang Province, China), at the Experimental Base of the Tea Research Institute of the Chinese Academy of Agricultural Sciences in mid-April. The region is characterized by the humid climate of the northern subtropical zone, featuring four distinct seasons and a mild, moist and rainy climate. The tea trees were planted in single rows. As shown in Figure 16, the tea tree canopy was managed by a machine harvested tea garden and maintained by fertilizer. Due to the growth characteristics of tea trees, the overall shape of the tea canopy is curved. The height of the canopy also varies to a certain extent.
In order to test the applicability of the prototype in complex terrain, the harvest object of this test was Longjing 43 machine-harvested green tea, which was planted in single rows on a slope of about 15°. The experiment was conducted in the spring harvest period. The maximum width of the canopy surface was about 120 cm; the height range of the canopy was 70~100 cm; the planting row spacing was 150 cm; and there were about 40 cm operation paths between the tea rows. Figure 16b shows the physical parameters of the test tea plantation, in which the quadrilateral ABDE was a rectangle denoted by lines. Among these lines, AE was the connection line of the widest canopy surface; AC was the maximum distance from the ground on the left side of the canopy surface; ED was the maximum distance from the ground on the right side of the canopy surface; CD was the ground connection line on both sides of the canopy surface (with a slope of 15°); and BD was the schematic line of the horizontal plane. When making the actual measurements, the actual height drop BC of the highest point of the canopy on the left and right sides of the single-row tea tree was about 30 cm. In addition, due to the use of intercropping operations, the road for the tea harvesting machine in the tea rows is uneven.

2.4.2. Test Equipment

On the basis of the assembly of the whole structure of the aforementioned tea profiling harvesting device (Section 2.1.2), the installation of three 2D LiDAR and the integration and testing of the electric control system were carried out. The final prototype built is shown in Figure 17.

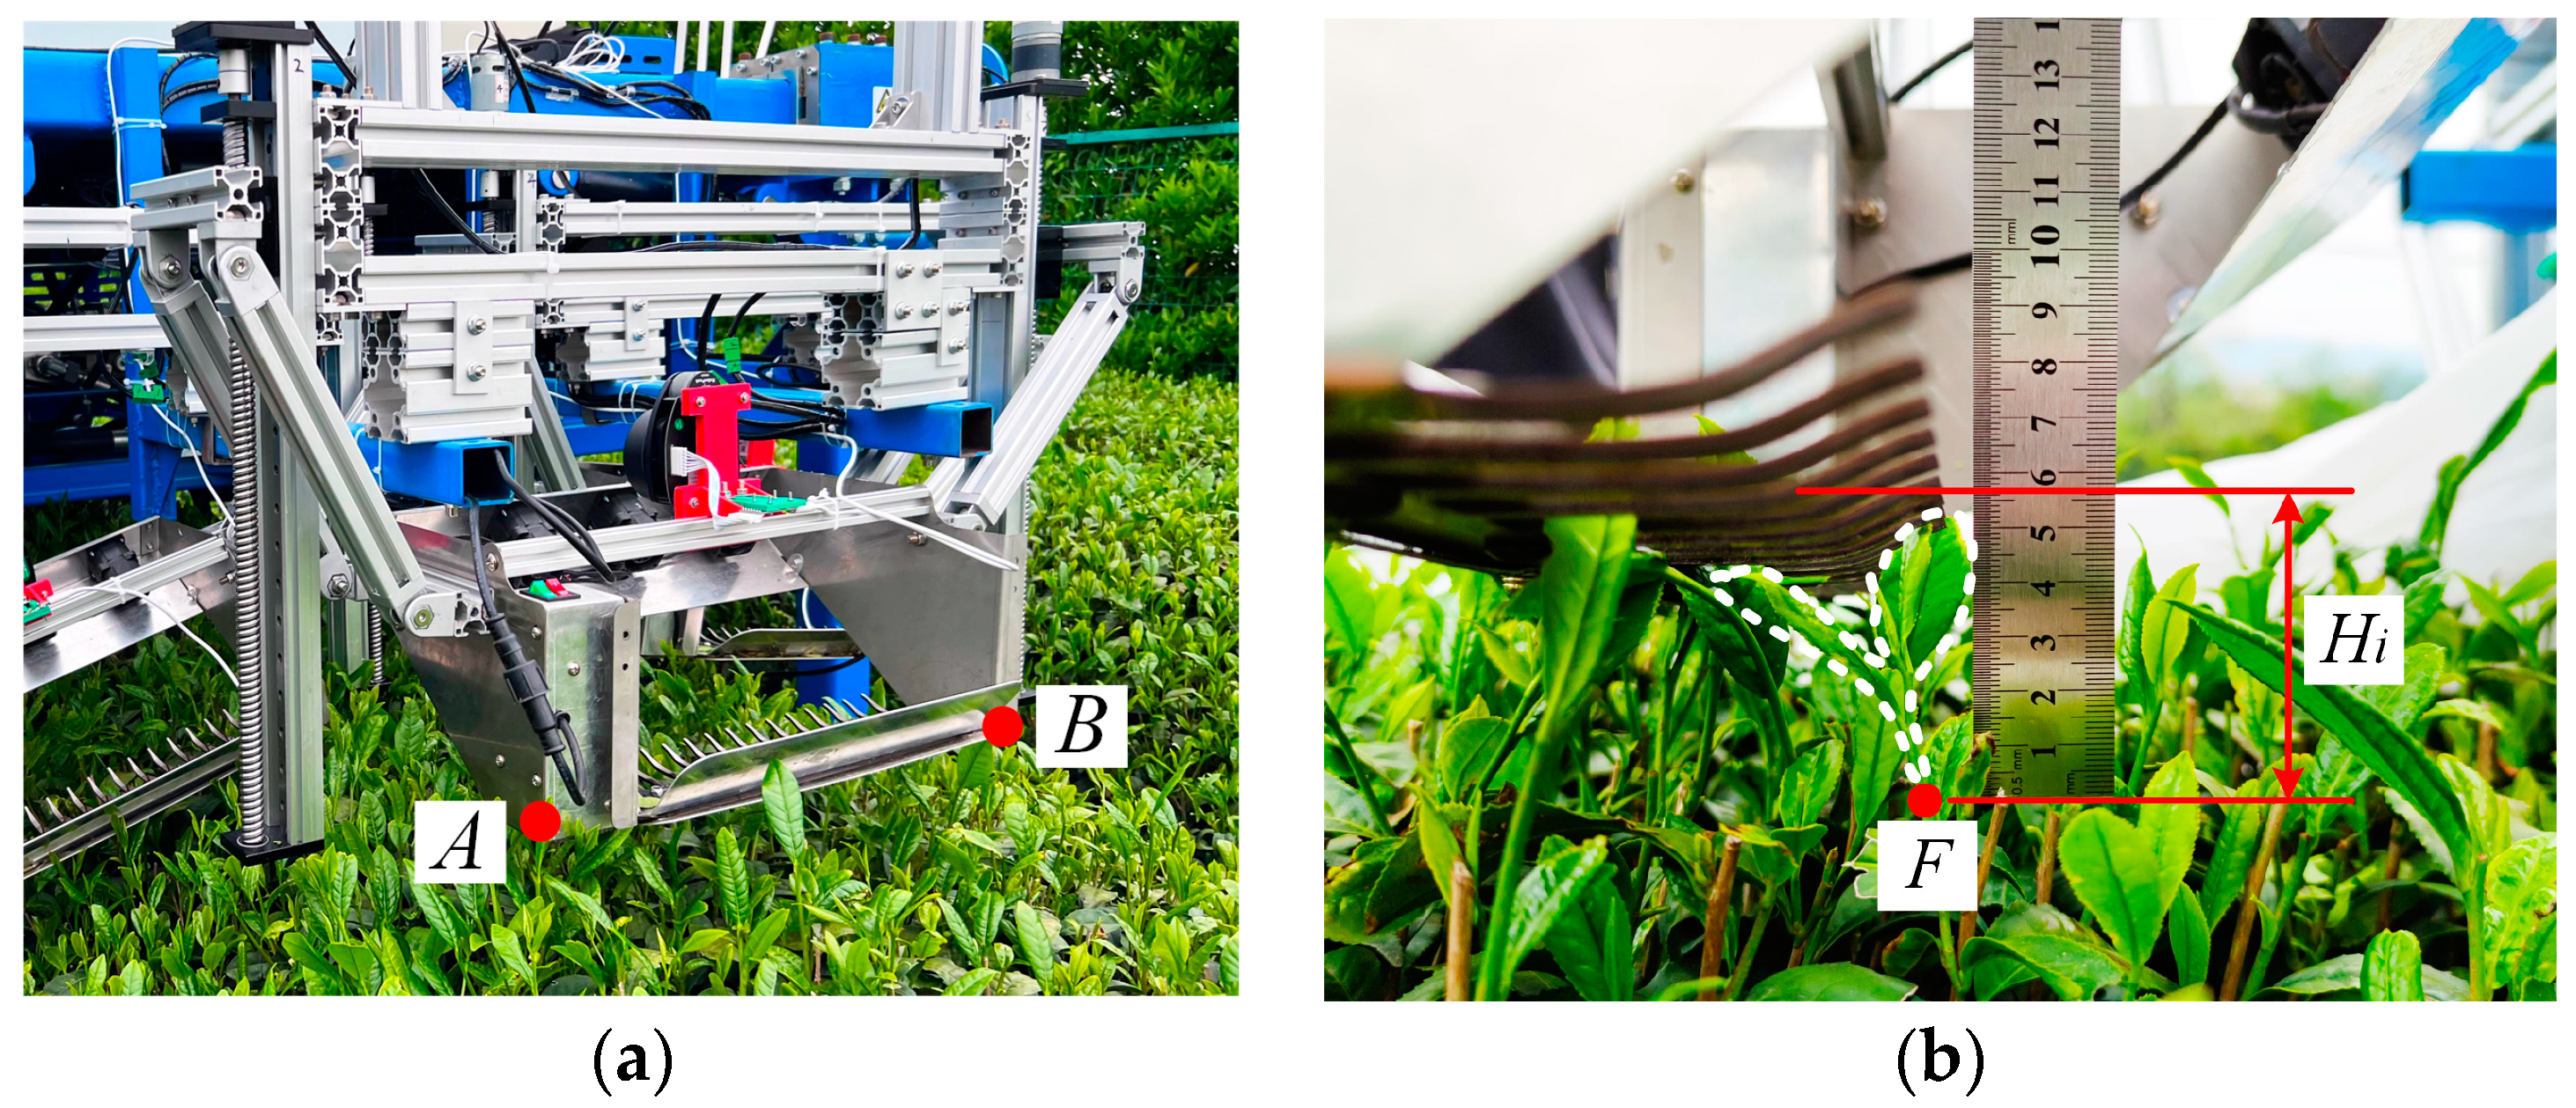
2.4.3. Determination Test of Cutter Height Control
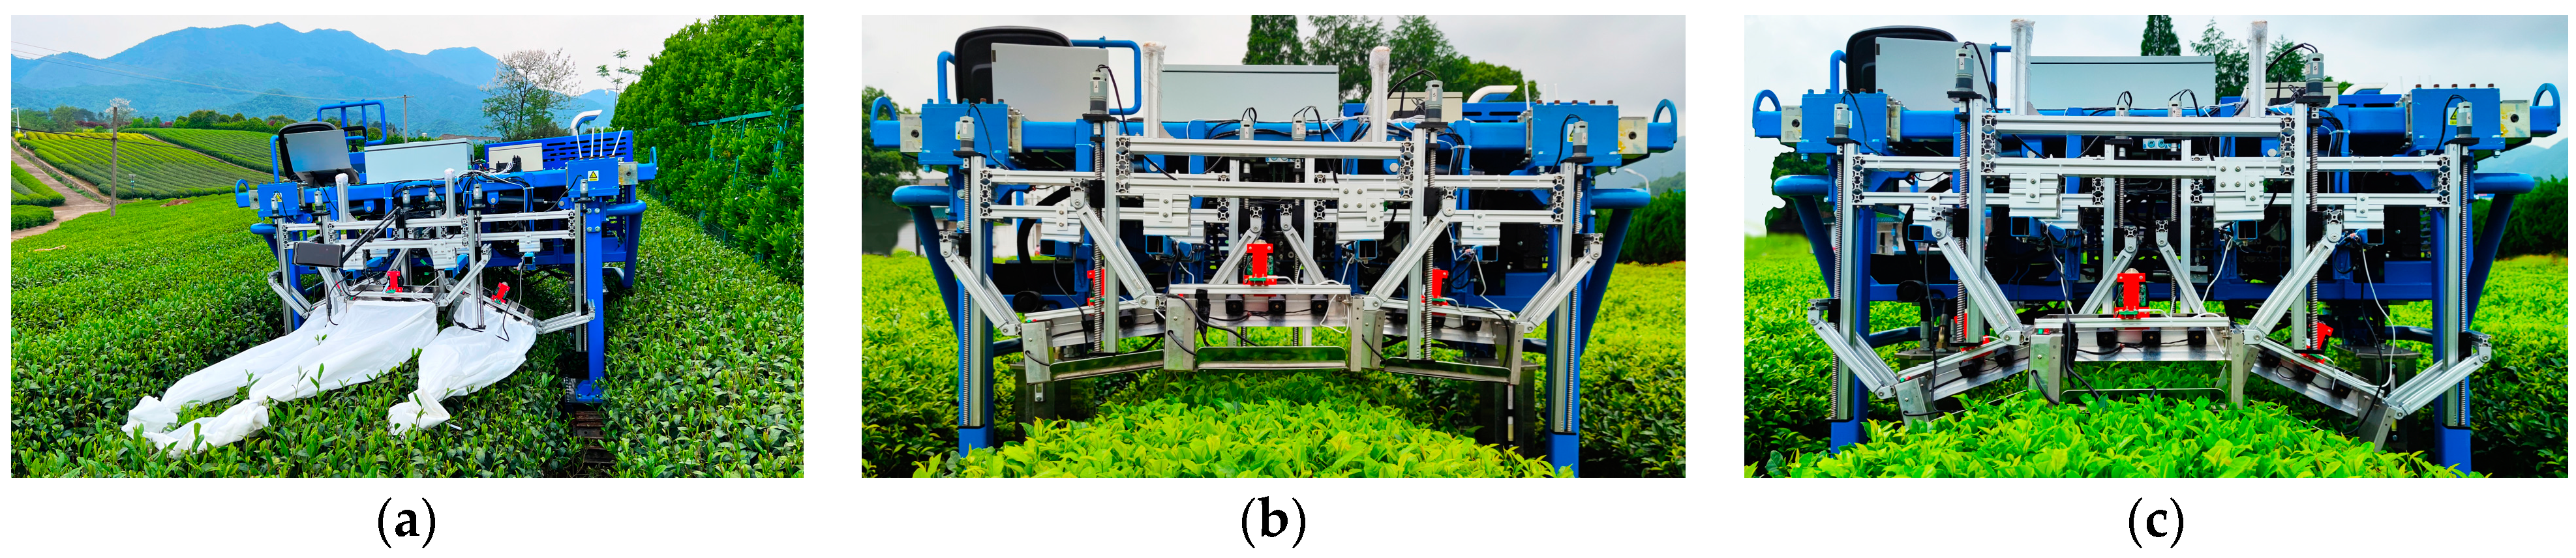
In this study, the RANSAC algorithm was used to realize the extraction of ideal cutting lines of young tea shoots in the bottom area of each PTHU, but the extract result was only the best one predicted by the algorithm, and it was not a reliable cutting line of tender tip vertices. In view of this, aiming at achieving an ideal cutting depth of fresh tea leaves, it is necessary to collect the actual cutter position and the ideal cutting line position extracted by the algorithm under the current cutter position, and carry out a statistical comparison to preset the height control of cutter more reasonably.
Initially, the machine was driven to the apex of the test site. Subsequently, the horizontal plane of the cutter in the middle PTHU was adjusted to align evenly with the uppermost surface of the lower canopy’s young shoots. It was ensured that, in the vertical orientation, the cutter surface came into contact with the peak of the young shoots located directly beneath it, as depicted in Figure 18a. Secondly, the sensing control system was opened, and the shortest distances TA and TB from the cutter’s two end points A and B to the ideal fitting straight line of the canopy surface were calculated by the built-in algorithm. Meanwhile, the distance H from the ideal cutting point F of the target tea shoots in the white dotted area located in the LiDAR scanning plane to the cutter surface was measure by using a steel ruler, as shown in Figure 18b. The position of point F was determined by visual inspection according to the ideal young shoot length l1 (5 cm). Afterwards, the positions of the machine above the tea shop were changed randomly and the tests were repeated 10 times according to the above steps. Eventually, the distance TA, TB and H of each test group were statistically analyzed, including the mean value T ¯ of TA and TB. The detailed information is listed in Table 1.
The average value of the D-value Δx between the two groups of distance values after 10 statistics was 30.2 mm, which can be obtained by the following equation:
Δ x = i = 1 10 ( H i T i ¯ ) 10
On the basis of the statistical results and the tea canopy of this harvest test, the height of the cutter control distance of each ETPA was set to 30 mm below the ideal fitting line of the canopy from the points A and B at both ends of each cutter. And the control dead zone ±ΔL was set at ±10 mm to ensure the fresh leaf length of the current fresh ordinary tea leaves harvest was in line with the allowable error range.

2.4.4. Harvest Test

The field harvest test of the whole machine was carried out in 5 groups. In each test, the prototype was manually driven to travel along the long direction of the tea tree and to harvest the tea for a distance about 10 m, during which the average moving speed was about 0.5 m/s. Besides, the collection bag was set at the tail of the tea picker at each end, and the fresh leaves were blown and collected by the wind force at the air blast mouth. Figure 19a shows the photos of the prototype field test site. Figure 19b,c show the state comparison before and after the profiling of the PTHU group.
After the completion of each group of tests, we manually collected the fresh leaves that had been cut but not collected (scattered new tea shoots and single leaves that can be made into commercial tea) on the canopies collected in this group of tests, and artificial secondary auxiliary mining of the uncut shoots on the canopies. Moreover, all fresh leaves harvested by the machine for the first time, fresh leaves that could be prepared by throwing, and the fresh leaves harvested by manual secondary harvesting were collected and stored by cold storage technology.
After the machine operations were completed, the test results were organized and calculated. First, all of the machine harvested fresh leaves, manually collected scattered fresh leaves and secondary auxiliary harvested fresh leaves in the collection bags of each test group was weighed and recorded in turn. Then, the diagonal quartering method was used to extract at least 300 g of analytical samples from each test group. The analysis samples were classified and weighed according to the morphology of the sample to obtain the total weight of fresh leaves in the sample m2, the weight of intact fresh leaves m3, the weight of lightly injured fresh leaves m4, the weight of severely injured fresh leaves m5, the weight of old stalks m6 and the weight of debris impurities m7 in this group of analysis samples. Among them, the judgment standard of slight injury to the shoots was that the fresh leaves were damaged single buds or single leaves under naked eye observation. The criterion for severe injury of shoots was that two or more fresh leaves were injured under naked eye observation.
With reference to the national quality standard in China for tea picker operation [31], we calculated the bud leaf integrity rate (BLIR), impurity rate (IR) and machinable rate (the rate that can be machined into commercial tea, MR) of each test group from Formula (10) to (12):
BLIR = m 3 m 2 × 100 %
where m2 is the weight of all fresh tea leaves in the selected analytical sample, g; m3 is the weight of intact fresh leaves in the selected analytical sample, g.
MR = m 3 + m 4 m 2 × 100 %
where m3 is the weight of intact fresh leaves in the selected analytical sample, g; m4 is the weight of lightly injured fresh leaves in the selected analytical sample, g.
IR = m 6 + m 7 m 1 × 100 %
where m1 is the total weight of the selected analytical sample, g; m6 is the weight of old stalks in the selected analytical sample, g; m7 is the weight of debris impurities in the selected analytical sample, g.
According to Formula (13) and (14), the missing collection rate (MCR) and the missing harvesting rate (MHR) were calculated, respectively:
MCR = w 1 m + w 1 × 100 %
where m is the weight of all machine-harvested objects in one test, g; w1 is the weight of scattered fresh leaves in one test, g.
MHR = w 2 m + w 1 + w 2 × 100 %
where w2 the weight of manual secondary harvested leaves in one test, g.

3. Results and Discussion

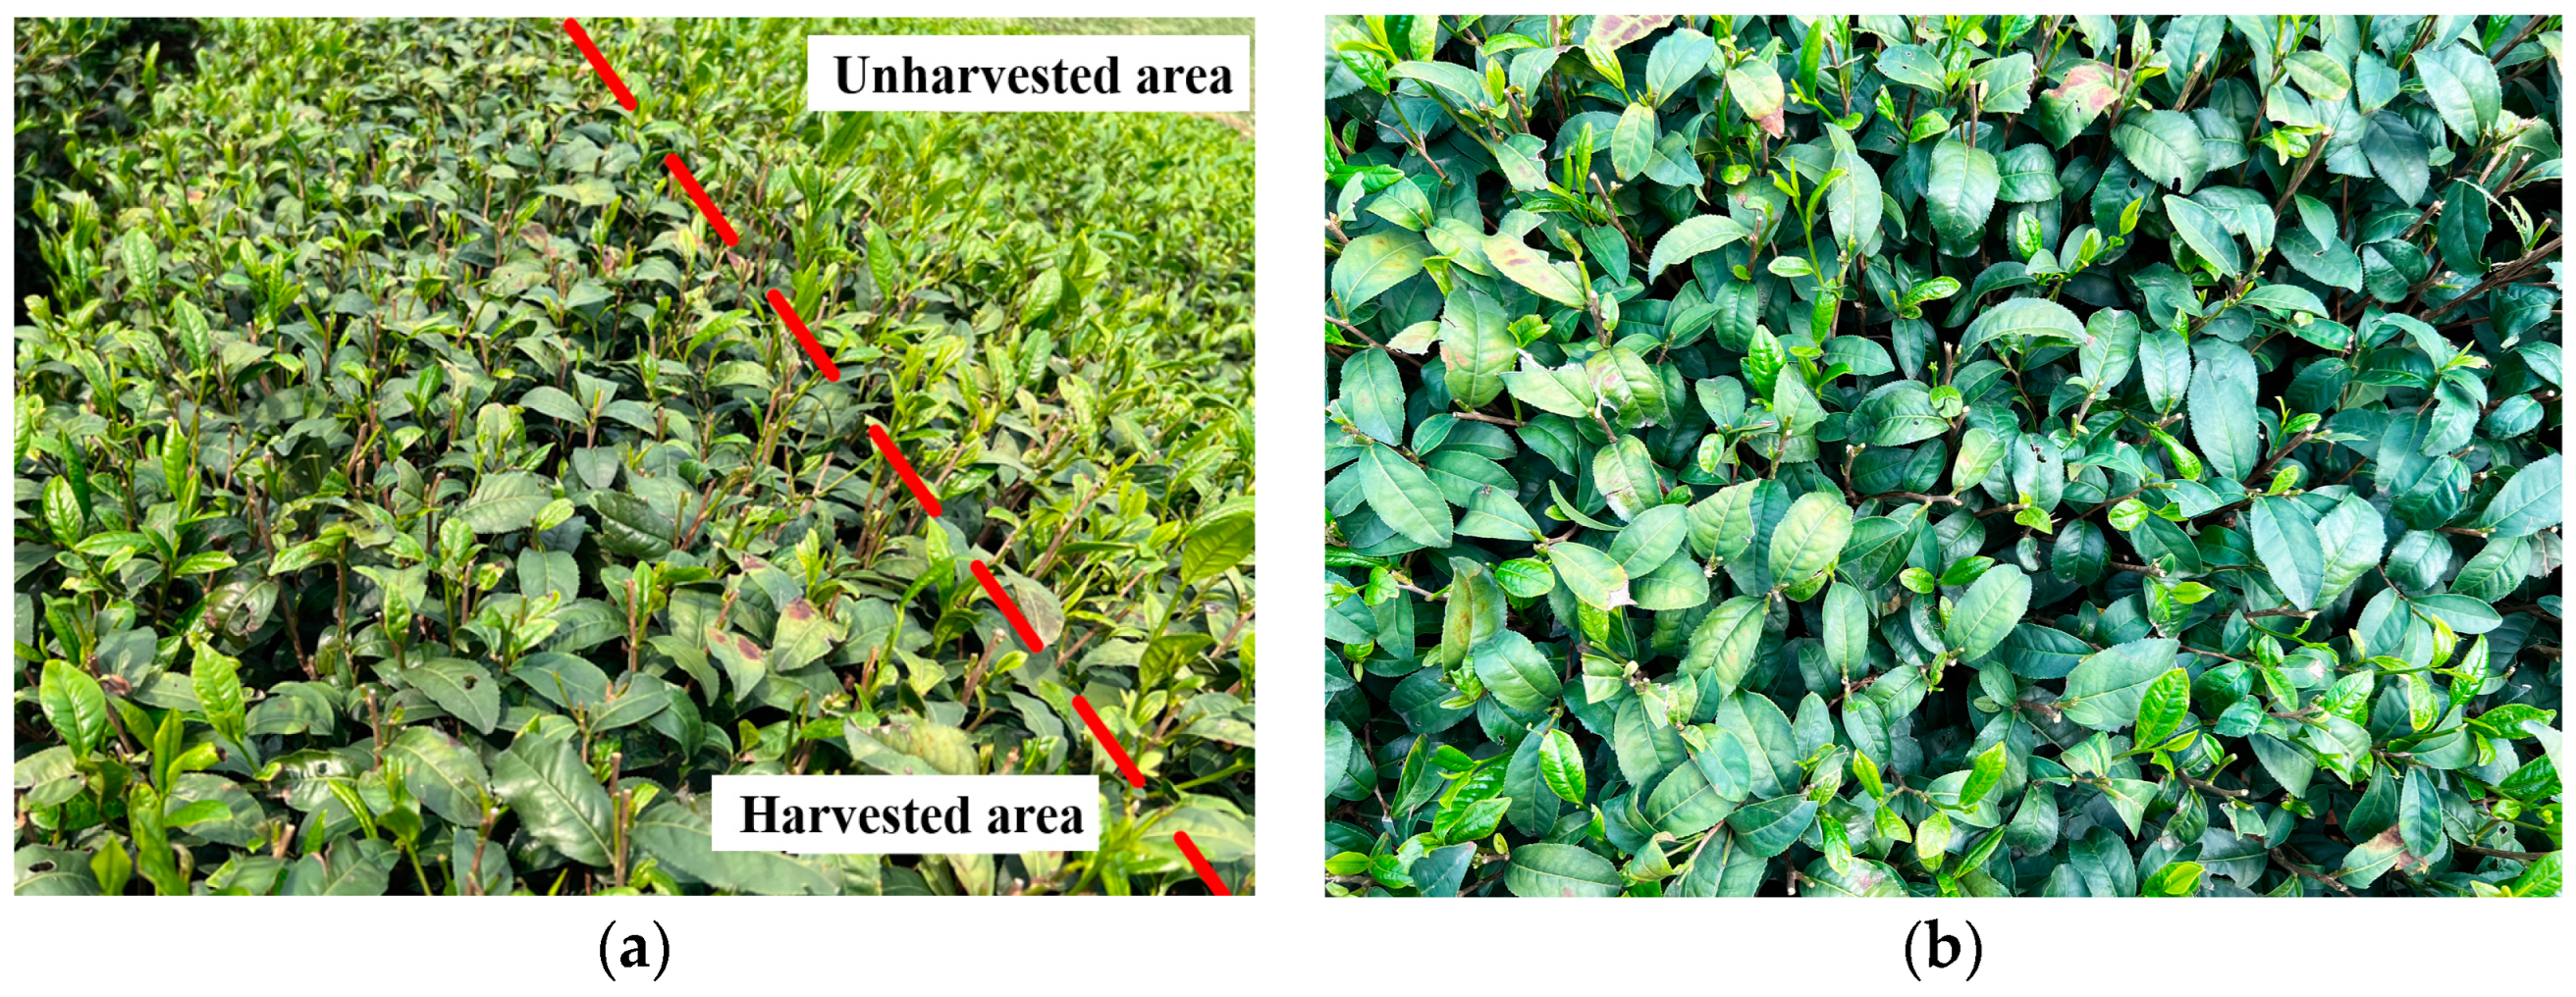
3.1. General Effect of Profiling Tea Harvesting

To visually observe the effect of tea harvesting, a harvesting test was conducted. The PTHU on the left was opened for trial harvesting testing. The comparison between the harvested area and the unharvested area is shown in Figure 20a. The left side of the red dashed line in the picture was the harvested canopy surface, while the right side was the uncollected canopy surface. The visual difference between the two was significant. The branches of the tea tree being harvested were in good condition. The tea tree harvesting surface after machine harvesting operation during the experiment is shown in Figure 20b.
During the operation of the prototype, the chassis of the prototype ran normally. The three sets of PTHUs achieved the expected profiling tea harvesting action normally, moving to the desired cutting position while following the shape of the tea canopy. After the machine harvesting operation, the tea tree harvesting surface was neat; the height was consistent; the incision was flat; and the branches of the tea tree were in good condition. At the same time, considering the unevenness of the terrain, the profiling unit could meet the design requirements to achieve profiling harvesting of the tea canopy surface. Figure 21 shows the real-time display interface of the fitting line of the canopy in the test.

3.2. Evaluation of Index and Measurement of Tea Harvesting Machine Operation Quality

Figure 22 shows the fresh leaf samples harvested during the mechanical harvesting operation. The proportion of old stalks and debris impurities is relatively small. Specifically, Table 2 shows the determination results of the composition of the fresh leaves of the machine harvested tea in each group. The results of the five groups of experiments were similar, with no significant fluctuations.
By calculation, the average BLIR was 84.64%, the average IR was 5.94%, and the average MR was 89.57%. Old stalks had the greatest impact on IR and were the main source of impurities, accounting for approximately 66% of the total impurities. Therefore, increasing the cutting height of the cutting blade and reducing the amount of old stalks cutting are the main optimization ways to reduce IR. The weight of lightly injured fresh leaves was relatively low, and intact fresh leaves were the main source of tea MR, accounting for 95% of the total tea production. The overall quality level of the fresh tea leaf harvested will be further analyzed in Section 3.4.
The experimental results of MCR and MHR after tea profiling harvesting are shown in Table 3. The average MCR of the five groups is 0.30%, and the average MHR is 0.68%. From Table 3, it can be seen that in the five groups of experiments, the weight of secondary auxiliary harvested was higher than that of scattered fresh leaves, indicating that missed tea harvesting was the main source of loss for profiling tea harvesting. MCR and MHR showed differences among the five groups. The MCRs of Groups 1–3 were lower than that of Groups 4–5. On the contrary, the MHR of Groups 1–3 was greater than that of Groups 4–5. Further measurement and calculation of the average length of the fresh tea leaves in each group after harvesting are shown in Table 3. From Table 3, it can be seen that the average length of the fresh tea leaves in Group 1–3 was shorter than that in Group 4–5. Analyzing the reasons, when the fresh tea leaves harvested through imitation are shorter, they are more likely to be missed. But a shorter length of fresh leaves makes it easier for them to be transported by wind to the collection bag, resulting in a reduction in the weight of missed collection. When the fresh tea leaves harvested through imitation are longer, the tea leaves are more likely to be cut off, resulting in less missed harvest. But the tea leaves are more prone to scattering during wind transportation, leading to an increase in MCR. Therefore, when harvesting longer fresh tea leaves, the conveying wind speed should be appropriately increased.

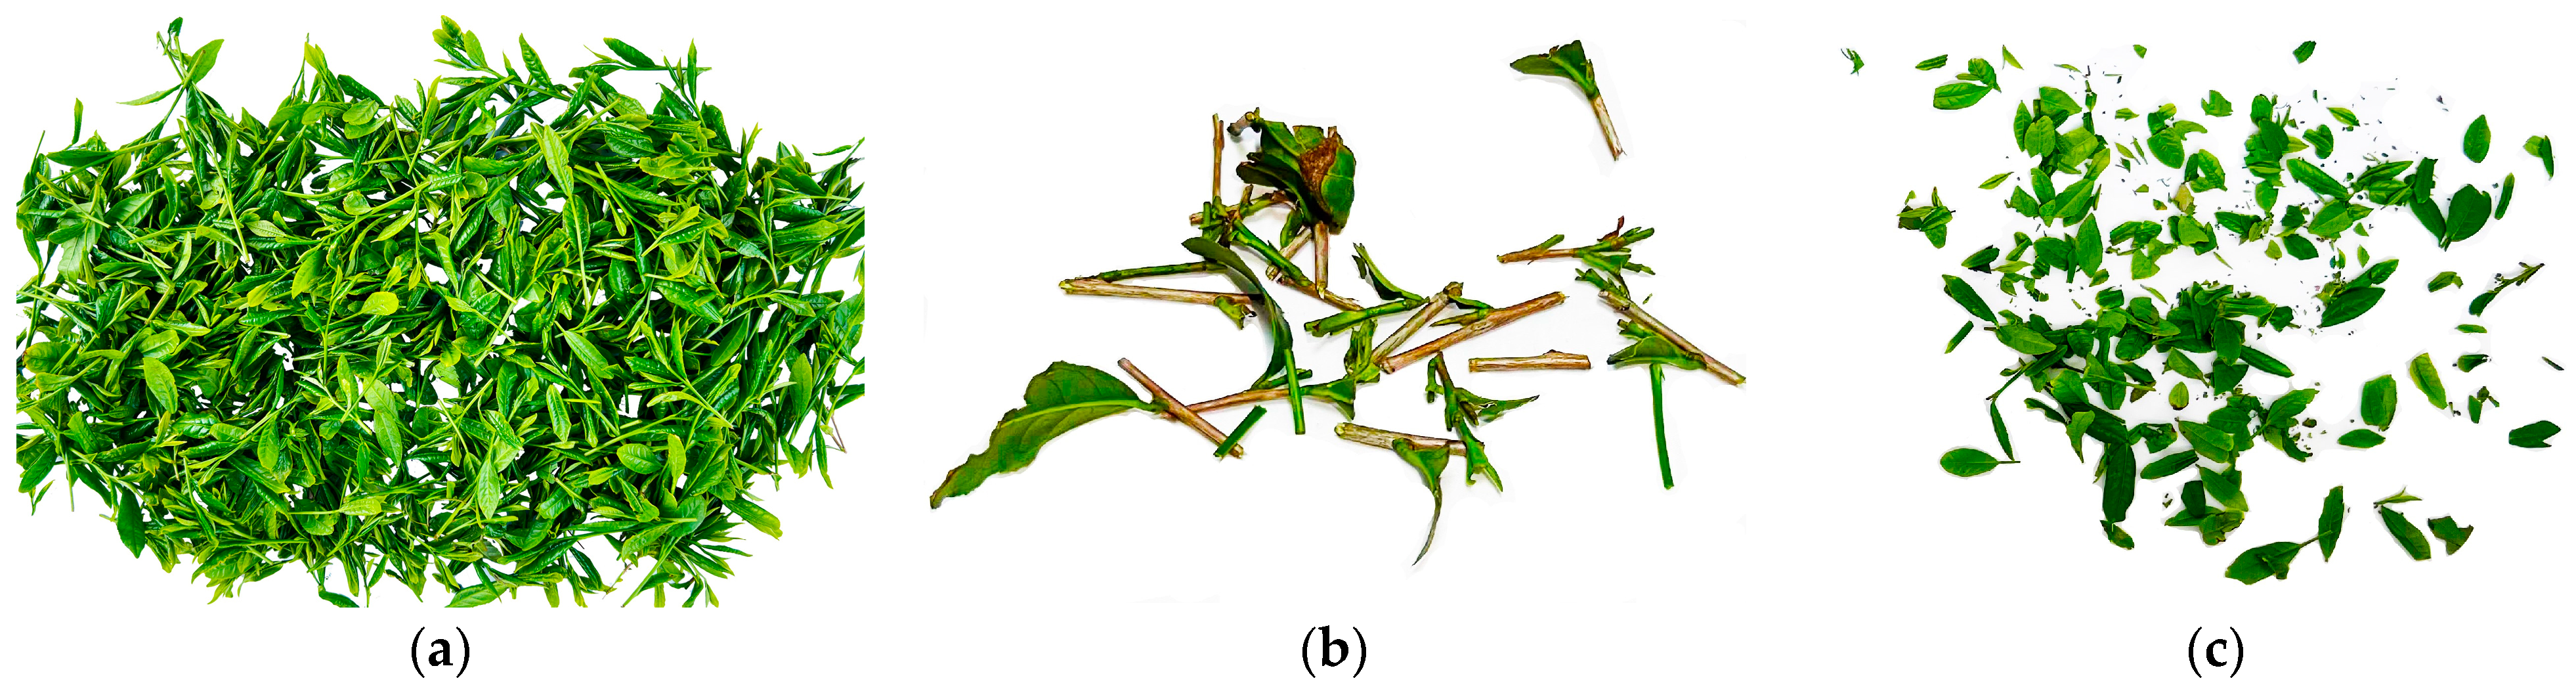
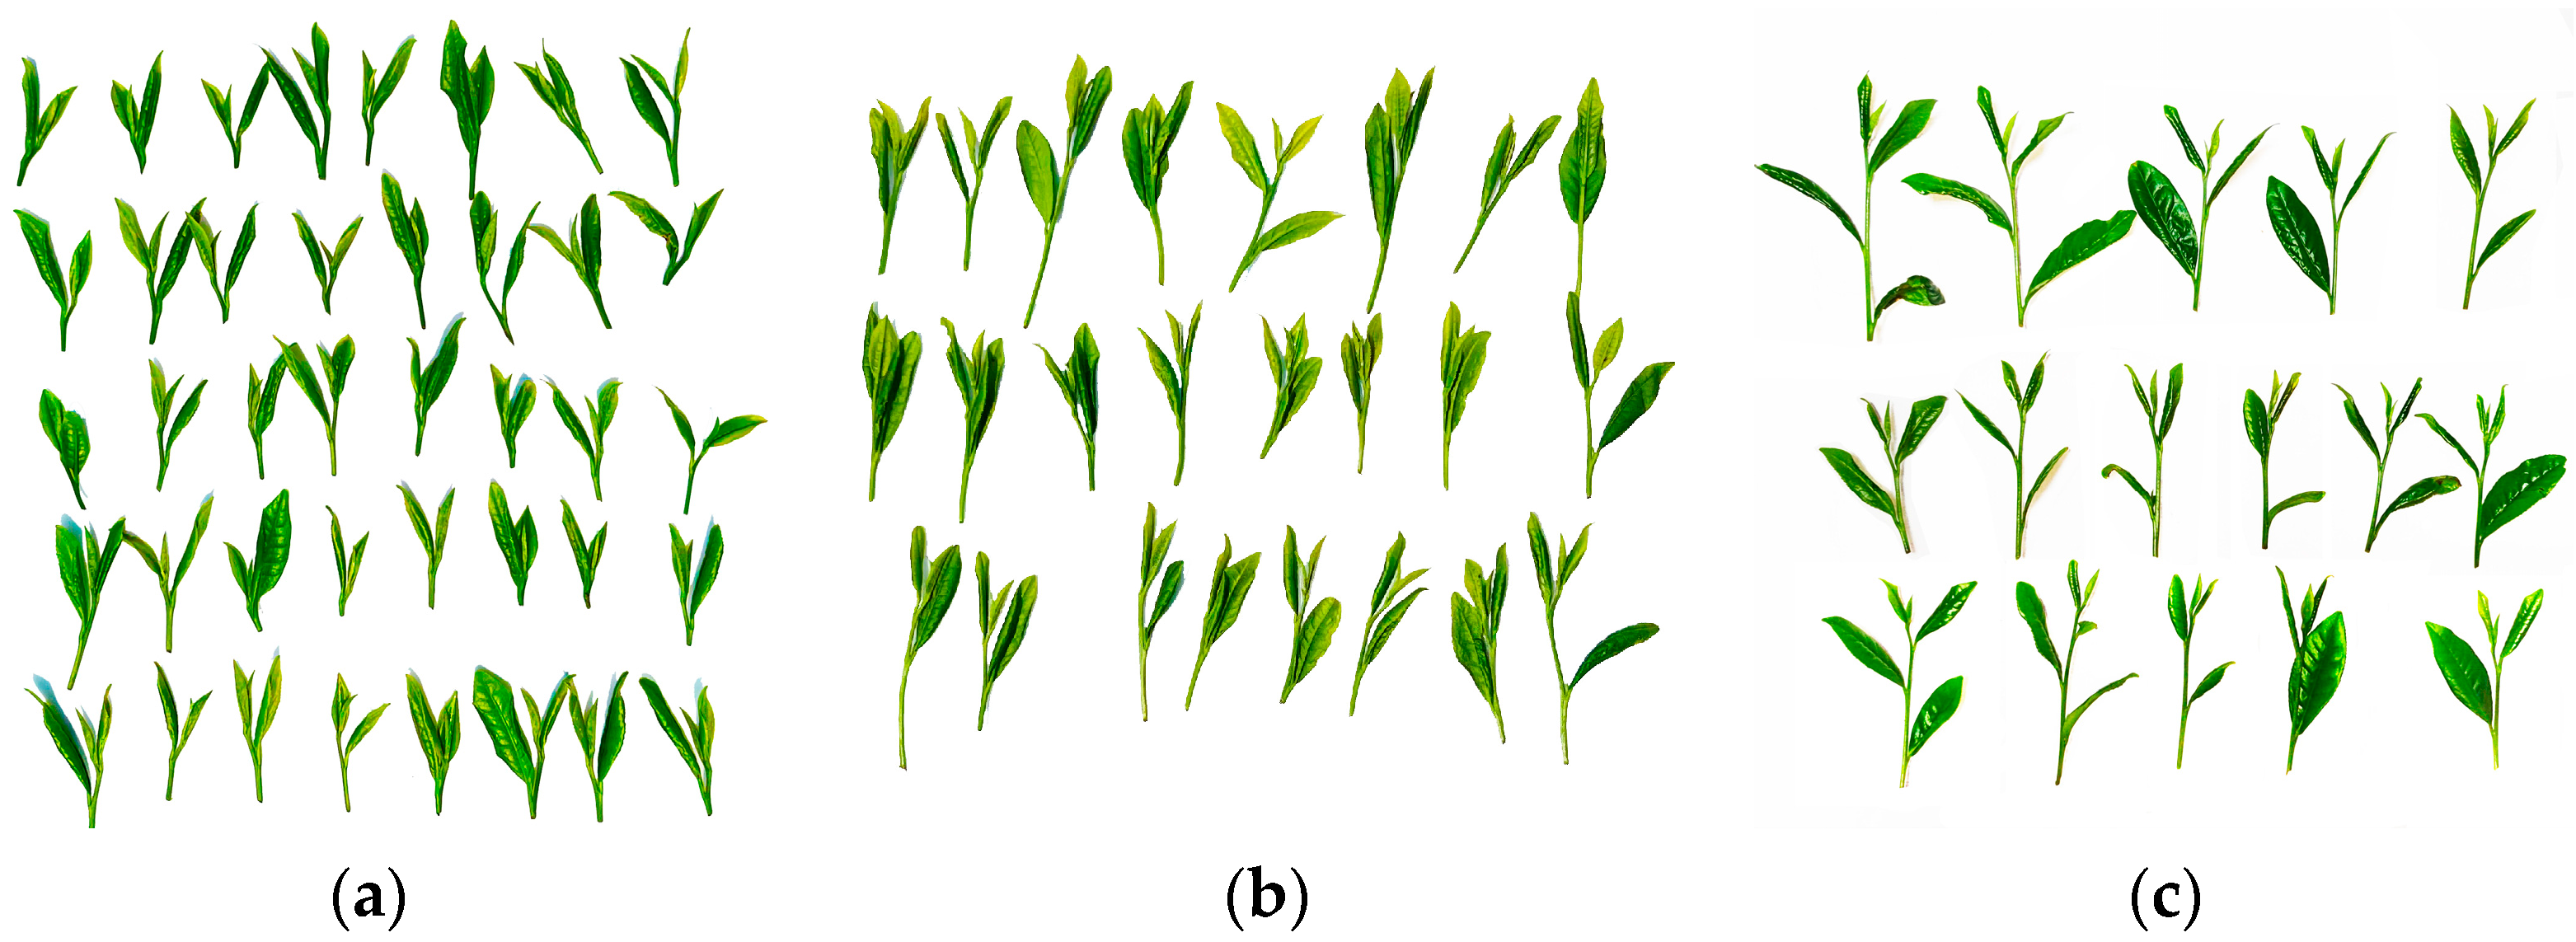
3.3. Distribution of Buds and Leaves

The samples from the first test group were analyzed. Statistical analysis was conducted on the distribution of buds and leaves on all intact shoots, and the results are shown in Table 4. Moreover, the total number of intact shoots was 326, 88.34% of which were shoots with one bud and three leaves or less. The proportion of one bud, two leaves, and one bud, three leaves was the highest, accounting for 76.46% of the total sample. This indicated that the tea harvested by the profiling device had a good appearance and high quality. The LiDAR accurately perceived the height of the tea canopy surface. The profiling unit could dynamically fit the tea canopy surface according to its changes and control the end effector to achieve reasonable harvesting of new tea leaves. Some fresh leaf samples after standard classification of bud leaves were shown in Figure 23.

3.4. Evaluation and Analysis of Operation Effect

The statistical results in Table 2 and Table 3 and the relevant requirements in the tea picker operation quality standard were compared. The final comparison results (Table 5) show that the operation quality of the prototype developed in this research meets the requirements of relevant quality indicators.
Similarly, Table 6 shows the comparison of operation quality parameters between different types of tea harvester on the current market and the tea profiling harvesting device developed in this paper [32,33]. It can be seen from the comparison results that on the premise that the relevant operation quality parameters of various tea harvesters meet the operation quality standards [31], they maintain good technical indicators in terms of the missing collection rate and the missing harvesting rate of fresh leaves. The tea profiling harvesting machine based on LiDAR studied in this article performs better on BLIR (84.64%), MCR (0.30%) and MHR (0.68%) than single or double handheld tea picking machines, riding tea picking machines, and ultrasonic based tea harvesters. The method of using LiDAR to perceive the tea canopy surface for contour cutting, controlling the real-time height change of the end effector, overcomes the impact of surface undulation and uneven ground on cutting quality. It should be noted that the improvement effect of the profiling tea harvester on the MHR indicator is not significant enough. This is related to the gaps between the PTHUs, which may lead to missed cutting.
The field test showed that the prototype of the ordinary tea profiling harvesting device based on LiDAR had a good profiling effect and good harvesting efficiency. The harvested tea quality met the operating quality standards of the tea picker and the requirements of the ordinary tea production process. However, problems that need improvement were also found during field harvesting: (1) This study adopted a segmented layout scheme where three sets of PTHUs were staggered and installed on the chassis. During the movement of the cutting blade copying mechanism, there was a certain gap between the two adjacent sets of PTHUs, which led to the inability to harvest the fresh tea leaves below the gap in a timely manner. This would cause the problem of residual tender shoots on the canopy surface. Further research on seamless profiling mechanisms is needed to address this issue. (2) This study selected multiple 2D LiDAR as the core sensors of the entire machine, and basically achieved real-time extraction of the tea canopy height. However, the sensed data is presented in a two-dimensional point cloud format, which was relatively sparse. Subsequent research may consider using a single 3D LiDAR to extract richer point cloud information from the tea canopy surface and surrounding environment. On this basis, the calculation of reference standards for tea canopy profile control and the allocation of data for each unit should be carried out to further improve the accuracy of real-time perception of the canopy height.

4. Conclusions

In order to realize the mechanized profiling harvesting of fresh ordinary tea leaves and boost the quality and efficiency of the tea industry, this study conducted design and experimental research to produce an ordinary tea profiling harvesting device and control algorithm. The specific research conclusions are as follows:
(1)
A tea canopy surface profiling method and harvesting device based on LiDAR perception were both proposed and developed, which improved the adaptability of the equipment to the terrain environment and the integrity of fresh leaf harvesting. Meanwhile, based on the scheme of sectional arrangement of multiple groups of PTHUs, a canopy height sensing method for 2D LiDAR perception was proposed. On this basis, a cross-platform communication network was built, and the point cloud fitting of the tea canopy surface and the effective estimation of cutter profiling height were realized through RANSAC. And the rapid control prototype technology was adopted to develop the whole sensing and control system.
(2)
This study built a tea harvesting machine prototype and a field test of the whole machine was carried out. And the results showed that the developed profiled tea harvesting device had good performance. The bud leaf integrity rate was 84.64%, the impurity rate was 5.94%, the missing collection rate was 0.30%, the missing harvesting rate was 0.68%, the rate that can be processed into commercial tea was 89.57%, and the young tea shoots with one bud, three leaves and below accounted for 88.34%. All of the results showed that the harvest quality can meet the technical standards of mechanized tea harvesting and the requirements of ordinary tea production. Compared with a traditional commercial tea harvester, the quality of the harvested fresh leaves has also been improved.
This study also faces issues such as missed harvesting in the profiling device and insufficient richness of the 2D LiDAR point clouds. The seamless profiling structures can be further optimized and the technology of using 3D LiDAR to perceive the tea canopy surface also needs further exploration.

Author Contributions

Methodology, X.H. and M.W.; investigation, X.H. and X.B.; data curation, X.B.; writing—original draft preparation, X.H. and X.B.; writing—review and editing, J.J. and C.K.; project administration, R.Z., C.W. and J.C. All authors have read and agreed to the published version of the manuscript.

Funding

This research was supported by the earmarked fund for the National Natural Science Foundation of China (No. 32301715, U23A20175), the China Postdoctoral Science Foundation (No. 2022 M722819), “Pioneer” R&D Program of Zhejiang (No. 2003C02009), Zhejiang Provincial Natural Science Foundation (No. LQ24E050010), Shaoxing Technology Project (No. 2023A12003), the earmarked fund for CARS (No. CARS-19), and Zhejiang Province Agricultural Machinery Integration Project. Thanks for all your support.

Institutional Review Board Statement

Not applicable.

Data Availability Statement

The data presented in this study are available on demand from the corresponding author or first author.

Acknowledgments

We thank the anonymous reviewers for providing comments and suggestions that improved the manuscript.

Conflicts of Interest

The authors declare no conflicts of interest.

References

  1. Zhou, Z.X.; Xue, C.; Ruan, H.G. An Analysis of the Spiritual Core and Value of the Chinese Tea Culture: A Case Study of Etiquette, Customs, Ceremonies and Traditions of Chinese Tea. J. Tea Sci. 2021, 41, 272–284. [Google Scholar]
  2. Gu, Y.; Liu, J.; Liu, C. The mission of China’s tea industry. Economic Daily, 9 June 2022. [Google Scholar]
  3. Han, Y.; Xiao, H.R.; Qin, G.M.; Song, Z.Y.; Ding, W.Q.; Zhao, Y. Latest research situations and trends about Tea garden machinery in China. J. Chin. Agric. Mech. 2013, 34, 13–16. [Google Scholar] [CrossRef]
  4. Erada, J. Traveling Type Tea Leaf Plucking Machine. JP Patent 2008301831, 18 December 2008. [Google Scholar]
  5. Tang, Y.P.; Han, W.M.; Hu, A.G.; Wang, W.Y. Design and experiment of intelligentized tea-plucking machine for human riding based on machine vision. Trans. Chin. Soc. Agric. Mach. 2016, 47, 15–20. [Google Scholar] [CrossRef]
  6. Tang, Y.P.; Wang, W.Y.; Zhu, W.; Xiang, Y. Tea ridge identification and navigation method for tea-plucking machine based on machine vision. Trans. Chin. Soc. Agric. Mach. 2016, 47, 45–50. [Google Scholar] [CrossRef]
  7. Yan, J.J. Optimization Design of Profiling Tea Picking Machine and Research on Coordination with Tea Plantation Management; Anhui Agricultural University: Hefei, China, 2019. [Google Scholar]
  8. Zhao, R.M.; Bian, X.B.; Chen, J.N.; Dong, C.W.; Wu, C.Y.; Jia, J.M.; Mao, M.; Xiong, Y.S. Development and test for distributed control prototype of the riding profiling tea harvester. J. Tea Sci. 2022, 42, 263–276. [Google Scholar] [CrossRef]
  9. Diego, A.H.; Ayush, K.; Aditya, S.; Lakesh, K. Yield and plant height predictions of irrigated maize through unmanned aerial vehicle in North Florida. Comput. Electron. Agric. 2023, 215, 108374. [Google Scholar] [CrossRef]
  10. Francisco, R.; Rafael, D.R.; Richard, L.S.; Daniele, Z. A novel simulation model to predict photosynthetic active radiation interception in micro-irrigated citrus production orchards based on tree spacing, canopy geometry, and row orientation. Comput. Electron. Agric. 2023, 212, 108062. [Google Scholar] [CrossRef]
  11. Mahmud, S.; Zahid, A.; He, L.; Choi, D.; Krawczyk, G.; Zhu, H.; Heinemann, P. Development of a LiDAR-guided section-based tree canopy density measurement system for precision spray applications. Comput. Electron. Agric. 2021, 182, 106053. [Google Scholar] [CrossRef]
  12. Liu, Y.C.; Wang, C.; Xi, X.H.; Wang, J.L.; Zhang, H.Q. A pits removal method for LiDAR CHM based on distance weighting and canopy control. Sci. Surv. Mapp. 2021, 46, 108–113. [Google Scholar] [CrossRef]
  13. Nidamanuri, R.R.; Jayakumari, R.; Ramiya, A.M.; Astor, T.; Wachendorf, M.; Buerkert, A. High-resolution multispectral imagery and LiDAR point cloud fusion for the discrimination and biophysical characterisation of vegetable crops at different levels of nitrogen. Biosyst. Eng. 2022, 222, 177–195. [Google Scholar] [CrossRef]
  14. Zhang, L.; Grift, T.E. A LIDAR-based crop height measurement system for Miscanthus giganteus. Comput. Electron. Agric. 2012, 85, 70–76. [Google Scholar] [CrossRef]
  15. Qiao, B.Y.; He, X.K.; Wang, Z.C.; Han, L.; Liu, W.H.; Dong, X.; Liang, W.P. Development of variable-rate spraying system for high clearance wide boom sprayer based on LiDAR scanning. Trans. Chin. Soc. Agric. Eng. 2020, 36, 89–95. [Google Scholar] [CrossRef]
  16. Cheraiet, A.; Naud, O.; Carra, M.; Codis, S.; Lebeau, F.; Taylor, J. Predicting the site-specific distribution of agrochemical spray deposition in vineyards at multiple phenological stages using 2D LiDAR-based primary canopy attributes. Comput. Electron. Agric. 2021, 189, 106402. [Google Scholar] [CrossRef]
  17. Blanquart, J.-E.; Sirignano, E.; Lenaerts, B.; Saeys, W. Online crop height and density estimation in grain fields using LiDAR. Biosyst. Eng. 2020, 198, 1–14. [Google Scholar] [CrossRef]
  18. Eizentals, P.; Oka, K. 3D pose estimation of green pepper fruit for automated harvesting. Comput. Electron. Agric. 2016, 128, 127–140. [Google Scholar] [CrossRef]
  19. Gangadharan, S.; Burks, T.F.; Schueller, J.K. A comparison of approaches for citrus canopy profile generation using ultrasonic and Leddar sensors. Comput. Electron. Agric. 2019, 156, 71–83. [Google Scholar] [CrossRef]
  20. Liu, T.; Kang, H.; Chen, C. ORB-Livox: A real-time dynamic system for fruit detection and localization. Comput. Electron. Agric. 2023, 209, 107834. [Google Scholar] [CrossRef]
  21. Cheng, M.; Cai, Z.; Ning, W.; Yuan, H. System design for peanut canopy height information acquisition based on LiDAR. Trans. Chin. Soc. Agric. Eng. 2019, 35, 180–187. [Google Scholar] [CrossRef]
  22. Zhang, H.Q.; Liu, K.H.; Zheng, F.; Chen, J.L.; Chen, S. Research on plant height measurement system based on two-dimensional LiDAR. Electron. Meas. Technol. 2021, 44, 97–103. [Google Scholar] [CrossRef]
  23. Abdi, O.; Uusitalo, J.; Pietarinen, J.; Lajunen, A. Evaluation of Forest Features Determining GNSS Positioning Accuracy of a Novel Low-Cost, Mobile RTK System Using LiDAR and TreeNet. Remote Sens. 2022, 14, 2856. [Google Scholar] [CrossRef]
  24. Liu, J.C.; Li, D.; Weng, X.W. Research on Mobile Robot SLAM Based on Laser Information. Autom. Instrum. 2018, 33, 43–47. [Google Scholar] [CrossRef]
  25. Zhao, J.W.; Zhang, H.J.; Wang, H.Y.; Gao, X.Q. Study on Building Indoor Environment Map with Laser Radar. Mach. Des. Manuf. 2017, 5, 135–137. [Google Scholar] [CrossRef]
  26. Bai, K.; Wang, L. Cloud Platform Simulation of Picking Robot Intelligent Control System Based on Simulink. J. Agric. Mech. Res. 2021, 43, 225–229. [Google Scholar] [CrossRef]
  27. Ghahremani, M.; Williams, K.; Corke, F.; Tiddeman, B.; Liu, Y.; Wang, X.; Doonan, J.H. Direct and accurate feature extraction from 3D point clouds of plants using RANSAC. Comput. Electron. Agric. 2021, 187, 106240. [Google Scholar] [CrossRef]
  28. Yang, L.X.; Wang, T.T.; He, X. Crop Row Extraction Based on Random Sampling Consistency Algorithm (RANSAC). Jiangsu Agric. Sci. 2017, 45, 195–197. [Google Scholar] [CrossRef]
  29. Xie, Y.D.; Long, Z.Q. A high-speed nonlinear discrete tracking-differentiator with high precision. Control Theory Appl. 2009, 26, 127–132. [Google Scholar]
  30. Fang, Z.; Zhang, Q.C.; Qi, Y.C. A Rapid Control Prototyping System Based on DSP. J. Northeast. Univ. (Nat. Sci.) 2009, 30, 1069–1073. [Google Scholar]
  31. Xia, Z.X.; Dai, W.; He, D.Y.; Ma, X.P. Design and Development of Rapid Control Prototype System Oriented Towards Desktop Robot Arm. Control Eng. China 2021, 28, 84–92. [Google Scholar] [CrossRef]
  32. Han, Y.; Xiao, H.; Song, Z.; Ding, W.; Mei, S. Design and experiments of 4CJ-1200 self-propelled tea plucking machine. Int. J. Agric. Biol. Eng. 2021, 14, 75–84. [Google Scholar] [CrossRef]
  33. Wang, P.; Yi, W.Y.; Xiong, C.G.; Cheng, F.P.; Deng, J.; Zhou, Y.J.; Geng, Y.; Wu, J. Design and test of 4CJZ-1000 Self-propelled tea picker. J. Southwest Univ. (Nat. Sci. Ed.) 2022, 44, 228–233. [Google Scholar] [CrossRef]
Figure 1. Mechanism diagram of the cutter profiling mechanism. (a) Schematic diagram; (b) structural diagram. 1. Cutting blade. 2. Ball screw. 3. Swinging arm. 4. Screw nut slider. 5. DC motor. 6. Rack. 7. Coupling. 8. 2D Lidar. 9. Linear guide rail. 10. End actuator.
Agriculture 14 01147 g001
Figure 2. Layout diagram of three groups of PTHUs. (a) Top view; (b) Front view. 1. Left PTHU. 2. Middle PTHU. 3. Rack. 4. Right PTHU. 5. Tea canopy.
Agriculture 14 01147 g002
Figure 3. Structure of ordinary tea profiling harvesting device. 1. Crawler type high clearance platform. 2. Driver’s seat. 3. Control box. 4. Right PTHU. 5. Middle PTHU. 6. Left PTHU.
Agriculture 14 01147 g003
Figure 4. Schematic diagram of canopy height perception based on 2D LiDAR perception.
Agriculture 14 01147 g004
Figure 5. Schematic diagram of profiling based on 2D LiDAR.
Agriculture 14 01147 g005
Figure 6. Schematic diagram of RPLIDAR A1 ranging information coordinate conversion. (a) Geometric definition of RPLIDAR A1; (b) polar–rectangular coordinate conversion.
Agriculture 14 01147 g006
Figure 7. ROS data transmission scheme.
Agriculture 14 01147 g007
Figure 8. Point cloud information of a single radar received by Simulink.
Agriculture 14 01147 g008
Figure 9. LiDAR installation location. (a) LiDAR mounting frame; (b) Schematic diagram of cutter bilateral vertices.
Agriculture 14 01147 g009
Figure 10. Processing methods of curved point cloud line fitting based on RANSAC algorithm.
Agriculture 14 01147 g010
Figure 11. Profiling height estimation modular program interface based on RANSAC.
Agriculture 14 01147 g011
Figure 12. The field experiment of the point cloud processing method. (a) LiDAR scanning testing environment; (b) The measured points on the canopy surface and the best fitting straight line.
Agriculture 14 01147 g012
Figure 13. Sectional control system architecture of the whole machine.
Agriculture 14 01147 g013
Figure 14. Schematic diagram of hardware composition of electric control system.
Agriculture 14 01147 g014
Figure 15. Control system flow of the whole machine.
Agriculture 14 01147 g015
Figure 16. Test environment information of field test. (a) Test base; (b) Physical parameters of test object.
Agriculture 14 01147 g016
Figure 17. Ordinary tea profiling harvesting device based on LiDAR perception. 1. Crawler type high clearance platform. 2. Left PTHU. 3. Driver’s seat. 4. PC. 5. Control cabinet. 6. Power supply cabinet. 7. Jetson Nano. 8. Wireless router. 9. Right PTHU. 10. Middle PTHU.
Agriculture 14 01147 g017
Figure 18. Determination test of cutter control distance height. (a) PTHU after leveling; (b) measurement of cutting point.
Agriculture 14 01147 g018
Figure 19. Field harvest test of prototype. (a) Field test site; (b) Cutter status before profiling; and (c) Cutter status after profiling.
Agriculture 14 01147 g019
Figure 20. The tea canopy surface after harvesting. (a) Comparison between harvested and unharvested areas; (b) Top view of tea canopy surface for test.
Agriculture 14 01147 g020
Figure 21. Real-time display interface of the fitting line of the canopy.
Agriculture 14 01147 g021
Figure 22. Fresh leaf samples harvested during the mechanical harvesting operation. (a) Machine harvested fresh leaves; (b) old stalks; and (c) debris impurities.
Agriculture 14 01147 g022
Figure 23. Statistical samples of some fresh leaves. (a) One bud and two leaves; (b) one bud and three leaves; (c) one bud, four leaves and above.
Agriculture 14 01147 g023
Table 1. Measurement parameters for determination of cutter control distance height.
Test Group (i) T ¯ i /mmHi/mmTest Group (i)Ti/mmHi/mm
1285762954
2224971246
3215582456
4265292755
51951101853
Table 2. Determination results of composition of fresh leaves of mechanically harvested tea.
Index12345Average
m (g)122013721185143612681296.2
m1 (g)308304309307302306.0
m2 (g)292289284289285287.8
m3 (g)253240243235247243.6
m4 (g)24101911714.2
m5 (g)153922433130.0
m6 (g)101216141212.8
m7 (g)639455.4
BLIR (%)86.6483.0485.5681.3186.6784.64
IR (%)5.194.938.095.865.635.94
MR (%)94.8686.5192.2585.1289.1289.57
Table 3. Measurement results of MCR and MHR.
IndexGroup 1Group 2Group 3Group 4Group 5Average
Weight of all harvested object m (g)122013721185143612681296.2
Working distance L0 (m)10.110.39.910.310.210.16
Weight of scattered fresh leaves w1 (g)242574
Weight of secondary auxiliary harvested w2 (g)91113748.8
MCR (%)0.1640.2910.1680.3470.5490.304
MHR T2 (%)0.7310.7931.0830.4830.3130.681
Average fresh leaf length (cm)6.337.286.197.848.037.13
Table 4. Statistics on the distribution of buds and leaves of all of the complete shoots.
IndexOne Bud and One LeafOne Bud and Two LeavesOne Bud and Three LeavesOne Bud, Four Leaves and aboveTotal
Quantity (pcs.)5314419752446
Proportion (%)11.8832.2944.1711.66100
Table 5. Comparison of operation quality requirements of tea pickers.
IndexRequirements of Quality IndicatorsAverage Parameters of Our MachineMeet the Requirements?
BLIR (%)≥7084.64Yes
MCR (%)≤1.50.30Yes
MHR (%)≤2.00.68Yes
Table 6. Comparison of operating quality parameters of different brands of tea pickers.
Brand of Tea PickerTypeBLIR (%)MCR (%)MHR (%)
HengJun4C-60
(Zhejiang Anqidi Power Machinery Co., Ltd., Taizhou, China)
Single≈70%≈1%≈1%
YaSheng4CS-120P
(Linyi Yasheng Electromechanical Co., Ltd., Linyi, China)
Double≈78%≈1%≈1%
Kawasaki KJ4N
(Zhejiang Kawasaki Tea Industry Machinery Co., Ltd., Hangzhou, China)
Riding≈80%≈1%≈1%
Ordinary tea harvesting–pruning machine
(Zhejiang Jiuqi Machinery Co., Ltd., Jinhua, China)
Riding81%0.82%0.77%
4CJ-1200
(Nanjing Agricultural Mechanization Research Institute, Nanjing, China)
Riding78.26%≈1%0.87%
Profiling tea harvester (Ultrasonic)
(Zhejiang sci-tech university, Hangzhou, China)
Riding82.6%≈1%≈1%
Profiling tea harvester (LiDAR)Riding84.64%0.30%0.68%
Disclaimer/Publisher’s Note: The statements, opinions and data contained in all publications are solely those of the individual author(s) and contributor(s) and not of MDPI and/or the editor(s). MDPI and/or the editor(s) disclaim responsibility for any injury to people or property resulting from any ideas, methods, instructions or products referred to in the content.

