Abstract
This study investigates the effects of osmotic dehydration on garlic clove halves using a low-pH osmotic solution with ascorbic acid, concentrated tomato juice, and basil extract (45° Brix). Samples, both dehydrated and fresh, were subjected to various drying methods. Physical properties, such as CT scan analysis, texture profile analysis (TPA), porosity, and density, were examined. Additional parameters like energy consumption, specific energy consumption, moisture content, water activity, and color change were evaluated. Osmotic dehydration reduced moisture content by over 7.5%. The specific energy consumption for microwave vacuum drying (MVD) was 95 kJ/g for osmotically dehydrated samples compared to 118 kJ/g for non-dehydrated samples. Drying times decreased by 24 min for MVD and 15% for microwave convective drying (MCD). The Weibull model best fit the drying kinetics, with R2 values above 0.99 and RMSE below 0.03 for all methods. TPA tests showed no significant impact of osmotic dehydration on hardness, though drying methods significantly affected hardness, ranging from 49 N to 707 N. Color change was higher for osmotically dehydrated samples, reaching 37.09 for OD-CD compared to 29.78 for CD.
1. Introduction
Garlic has become a popular ingredient around the world and has been used as a medicine since as early as 1550 BC to fight diseases such as dysentery, typhoid, influenza, and cholera [1]. It is popular as a health-promoting spice, exhibiting antibacterial [2], antifungal [3], immunomodulatory, anti-inflammatory [4], hepatoprotective [5], gastroprotective [6], cardiovascular protective [7], neuroprotective [8], and kidney-protective properties, thanks to its suitable composition of bioactive components [9]. Additionally, garlic is famous for its antioxidant activity, which helps in scavenging free radicals, and this is attributed to its high content of compounds such as allin, allicin, diallyl disulfide, and allyl mercaptan [10]. However, the processing of garlic may have a negative impact on physical and chemical properties, and the ultimate effect depends on many factors, such as the processing method, temperature, processing time, and garlic composition [11]. One of the mild methods of garlic processing might be osmotic dehydration (OD).
OD is a mass transfer process in which water is removed from a food product by exposing it to a hypertonic solution, most often based on sugars and/or salts. The removal of water from the dehydrated sample during OD is accompanied by the infiltration of solute molecules from the solution into the dehydrated material [12]. The driving force for this process is the osmotic pressure gradient established between the food product and the osmotic solution (OS). OD is commonly employed as a pre-treatment method for drying food products as it effectively reduces their water content, thereby enhancing their shelf life and influencing the texture and flavor of food. The OD process offers numerous advantages, including reduced energy consumption and increased retention of nutrients. Additionally, it improves the rehydration capacity and structural integrity of dried products, making them more similar to their fresh state. These properties make OD a valuable pre-treatment technique in the food processing industry [12,13]. Moreover, there are increasing reports of conducting the process in solutions based on concentrated fruit juices and/or using ultrasound to increase the efficiency of the process (water loss (WL)/solid gain (SG)) [14]. Performing osmotic dehydration as a pre-treatment step before drying has the potential to improve the drying kinetics, reduce drying time, and positively impact the preservation of bioactive compounds in the resulting dried material [15].
In the literature, articles can be found regarding the drying of garlic using convective drying (CD) [16], microwave vacuum drying (MVD) [17], convective pre-drying and microwave vacuum finish drying (CD/MVD) [18], vacuum drying (VD) [19], microwave convective drying (MCD) [20], and freeze drying (FD) [21]. However, there is a lack of information regarding osmotic dehydration and drying utilizing all the mentioned methods. Until now, OD of garlic has predominantly utilized elementary salt solutions, such as NaCl or CaCl2. Furthermore, the treatment has primarily centered on garlic slices, which may lead to a more efficient mass transfer due to the restricted surface area of the difficult-to-permeable epidermis than in the case of halves or whole garlic cloves [22]. Furthermore, there is a report in the literature regarding the osmotic dehydration of garlic in concentrated tomato juice with basil extract and a reduced pH [23]. Additionally, those studies focused only on selecting the best pre-treatment method for garlic before OD, and the garlic was not dried afterwards, leaving a gap for further research. Tomato juice is a vegetable product with high health benefits due to its rich content of lycopene, a potent antioxidant found in tomatoes. Consumption of lycopene has been linked to a reduced risk of certain cancers and diet-related ailments [24]. On the other hand, basil is rich in volatile compounds like linalool, methyl chavicol, eugenol, bergamotene, and methyl cinnamate, which contribute to its distinctive aroma and flavor. Moreover, basil is known for its various health benefits [25].
It is important to mention that the application of osmotic dehydration is usually not enough to obtain a safe water activity of the material and therefore there is a need for applying additional preservation techniques such as drying that could help alleviate the issue. Some research previously focused on the drying of garlic [26,27,28]. However, no study presented the effect of drying on the garlic subjected to osmotic dehydration in a complex osmotic solution based on concentrated tomato juice and basil extract.
Drying using traditional methods is a highly energy-intensive process; however, the utilization of innovative drying methods and their proper optimization allows for a significant reduction in energy consumption. Therefore, the consideration of the energy aspect is crucial in drying processes [29].
Therefore, in this study, the osmotic dehydration of garlic was combined with convective drying (CD), microwave vacuum drying (MVD), combined drying consisting of preliminary convective drying and subsequent microwave vacuum drying (CD/MVD), microwave convective drying (MCD), vacuum drying (FD), and freeze drying (FD). In the same way, the garlic was dried without OD prior to drying for comparison. Basil extract was added to the OS to reduce the strong odor and taste of garlic, which may be a reason why some consumers limit their consumption of it. The research objective was established based on the hypothesis that conducting osmotic dehydration before drying, regardless of the drying method used, leads to a reduction in porosity and an increase in the strength of dried garlic particles through the infiltration of particles from the osmotic solution into the material structure. Therefore, the article aimed to determine the effect of the osmotic dehydration of garlic in concentrated tomato juice and basil extract on the physical properties and structure of dried material such as CT scan analysis, true density, apparent density, bulk density, open and close porosity, color change, moisture content, water activity, energy consumption, and specific energy consumption. Drying kinetics were also prepared, and a drying model was selected.
2. Materials and Methods
2.1. Plant Materials
This study used commercially available garlic purchased from a local store in Wrocław, Poland. The garlic bulbs were separated into individual cloves, peeled, and halved before undergoing pre-treatment. The moisture content (Mc) of fresh garlic was 63.44 ± 0.74%. The average mass of garlic cloves was 4.8 ± 0.5 g, with an average length of 4.45 ± 0.27 cm and diameter of 2.46 ± 0.16 cm. The tomato juice, sourced from Hortex (Warsaw, Poland), was filtered and concentrated before OD. This study also utilized basil leaves to prepare an extract that would be added to the osmotic solution. The basil leaves and stems were obtained by cutting them from fresh basil purchased from a local store (Wrocław, Poland).
2.2. OS Preparation
The tomato juice was separated via centrifugation, filtered, and subsequently concentrated to a level of 60 °Brix using a ROTAVAPOR R-151 (Büchi Labortechnik AG, Flawil, Switzerland). For the preparation of basil water extract, fresh basil leaves were immersed in water (250 g/1000 mL of water) and subjected to extraction for 1 h, with the ultrasound turned on for the first 10 min at a temperature of 35 °C. The extract was then used to prepare the OS by mixing it with concentrated tomato juice (10 mL of extract for 50 mL of tomato juice). The pH of the OS was adjusted using ascorbic acid (AA), with the initial pH of the solution being 3.9 ± 0.1. The pH was lowered to a final value of 3.0 ± 0.1 (8.86 g AA/100 mL OS). The resulting OS was maintained at an initial concentration of 45 ± 0.5 °Brix.
2.3. Osmotic Dehydration
To conduct the osmotic dehydration process, beakers with the osmotic solution and garlic samples were employed and placed within a water bath (PS-40A, CE FCC RoHS, Dongguan, China) for 120 min at a temperature of 50 °C. Dehydration was conducted with a ratio of sample mass to osmotic solution volume at 1:3. To improve the mass transfer at the onset of the process, ultrasounds were applied for the first 5 min, as per Masztalerz et al. [30] and Noshad et al. [31]. The effectiveness of mass transfer was assessed through weight reduction (WR), solid weight gain (SG), and water loss (WL) calculated using the methodology presented in the article by Zimmer et al. [23].
2.4. Drying and Drying Kinetics
Convective drying (CD) was carried out using an instrument situated at the Institute of Agricultural Engineering in Wrocław, Poland, which involved drying halves of the garlic cloves in a specialized container (diameter of 100 mm) at a temperature of 70 °C, accompanied by an airflow rate of 1.0 m⋅s−1 [32]. The schematic diagram of the convective dryer, on which the research was conducted below (Figure 1.) and a detailed diagram of the dryer was presented in a previous publication by Turkiewicz et al. [33].
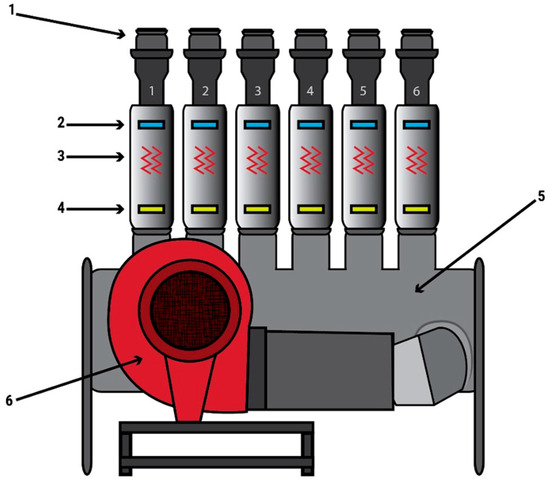
Figure 1.
The components are as follows: (1) basket for dried material; (2) thermocouple; (3) heaters with autotransformers; (4) air suplly regulator slide; (5) expansion tank; (6) fan. Figure adapted from Turkiewicz et al. (2020) [33].
Microwave vacuum drying (MVD) was conducted in SM 200 dryer (Plazmatronica, Wroclaw, Poland). The magnetron power was set at 8.33 W/g. To monitor the temperature of the sample, a pyrometer was used (CEM, InfraRed Thermometer DT-8862, Dongguan, China). The power of magnetrons was lowered to 2.08 W/g (in relation to the initial sample mass) when the sample temperature hit 80 °C to prevent overheating which could affect the thermolabile compounds and lead to negative changes in the sample [34]. For combined CD/MVD, CD was performed at 70 °C for 3 h, and it was followed by VMD at 8.33 W/g, which was subsequently reduced to 2.08 W/g when the sample temperature reached 80 °C. Vacuum drying (VD) was carried out in a laboratory dryer, model V0101 (Memmert, Schwabach, Germany), at a temperature of 70 °C with pressure below 100 Pa. Microwave convective drying (MCD) was carried out in SM 200 dryer (Plazmatronica, Wroclaw, Poland); the magnetrons power was set at 2.08 W/g, temperature to 35 °C, and the airflow rate to 0.6 m⋅s−1. All powers of the magnetrons are given with respect to fresh samples. Freeze drying (FD) was performed in a Free-Zone 4.5 L installation (Labconco, Fort Scott, KS, USA) at a temperature of −50 °C and a constant pressure of 50 Pa for 48 h. The temperature of the heating shelves was 30 °C. Both the sample after OD and the sample without OD before FD were frozen using liquid nitrogen to ensure deep freezing.
The drying kinetics chart is represented as a function of time versus moisture ratio (MR). Kinetics were developed for each of the drying methods employed, both for samples subjected to osmotic dehydration prior to the drying process and for non-dehydrated samples.
Drying kinetics illustrates the reduction of the moisture ratio (MR) over the drying period. MR is determined by Equation (1):
where , , and represent moisture levels (kg⋅kg−1 dm) at the initial moment (time = 0 min), a specific time point (time t), and the equilibrium state, respectively.
The equilibrium moisture content, denoted as , typically exhibits a considerably low magnitude. Consequently, Equation (1) is commonly streamlined into the form represented by Equation (2), with negligible impact on the MR value, as noted by Alibas [35].
2.5. Drying Model
Based on the obtained experimental data, several empirical drying models were fitted, including Newton’s model [36], Midilli’s model [37], the logarithmic model, the two-term model, Page’s model [38], and Weibull’s model using TableCurve 2D Windows v2.03 software. The results of preliminary tests revealed that the Weibull model provides the best fit determined based on the highest values of R2 and the lowest values of root mean square error (RMSE). The Weibull model is described by the following equation:
where a, b, k, and n are constants (-) [39].
2.6. Density
The true density (⍴t) of the sample was determined by dividing the mass of the sample by the volume of the powder obtained from the sample (the samples were ground using the BOSCH TSM6A013B grinder (Gerlingen, Germany) for 30 s), which was measured using the HumiPyc II gas pycnometer from InstruQuest Inc., in Boca Raton, FL, USA. On the other hand, the pycnometer density (⍴p) was obtained by weighing the sample and measuring the volume of the halves of garlic cloves using the same gas pycnometer. The measurements were carried out using argon gas at a pressure of 220 kPa [40], and three repetitions of both mass and volume were performed. Investigating apparent density involved measuring it through the placement of garlic particles within graduated cylinders filled with NaCl to predetermined volumes. The density was subsequently calculated by considering the mass of the particles and the resulting volume difference.
2.7. Porosity
Based on the obtained densities, total (), open () and closed () porosity was calculated, respectively, using the following equations [41]:
2.8. Water Activity
To determine the water activity of the samples in the study, the AquaLab Dew Point 4TE from Decagon Devices Inc., in Pullman, Washington (WA), USA, was used. The measurements were conducted three times at a temperature of 25 ± 0.5 °C.
2.9. Moisture Content
The moisture content (Mc) was determined by using a vacuum dryer (SPT-200, ZEAMiL, Horyzont, Kraków, Poland). The measurement was carried out by subjecting the sample to a temperature of 85 °C under a pressure of 100 Pa for 48 h.
2.10. Color Parameters
The color of the samples was measured in five repetitions using a Minolta Chroma Meter CR-400 (Minolta Co., Ltd., Osaka, Japan). The results were obtained in reference to the International Commission on Illumination (CIE) L*a*b* color space. In this color space, L* represents lightness, with a* values ranging from negative (green) to positive (red), and b* values ranging from negative (blue) to positive (yellow). The overall color change of the dried material was expressed as ΔE using the methodology presented in the article by Zimmer et al. [23].
The results of measurements of chromatic coordinates L*, a*, b*, and total color change (ΔE) were evaluated at three different stages: at the center of the garlic clove; on the surface of the garlic skin (epidermis); and after converting the samples into powder form. Color parameters were determined relative to the fresh garlic sample, considering the surface, cross-section of the garlic clove, and the powdered sample. The L*, a*, and b* color parameters for a sample of fresh garlic were as follows: 75.79 ± 0.72, −1.99 ± 0.14, and 21.81 ± 1.7 on the clove surface; 76.44 ± 1.19, −2.03 ± 0.28, and 21.06 ± 0.59 at the clove intersection; and 75.74 ± 1.16, −1.05 ± 0.17, and 21.08 ± 0.48 for fresh ground garlic.
2.11. Texture Profile Analysis (TPA)
TPA, following the methodology described by Figiel and Tajner-Czopek [42], was performed to evaluate the properties of the sample. The halves of garlic cloves dried by different methods were placed between two parallel plates and subjected to cycles of compression. The compression was carried out at a speed of 1 mm/s, resulting in a 50% reduction in the original height of the sample. By analyzing the resulting texture profile, two parameters were determined: hardness and cohesiveness. Hardness represents the maximum force observed on the texture profile curve. Cohesiveness is calculated by comparing the areas under the force curve during the second compression with the work conducted during the first compression. To ensure reliable results, samples obtained after each drying method were repeated eight times.
2.12. Energy Consumption
The energy that is required to carry out the CD, MVD, CD/MVD, and OD drying processes was calculated based on the methodology presented by Calín-Sanchez et al. [18]. To calculate energy consumption during the OD, the following formula was used:
where was the power of the heater installed in the water bath, the time of osmotic dehydration, was the power of the ultrasound, and was the time when the ultrasound was on. The energy used to heat the water inside the bath was reduced to 20%, because once the right temperature is reached, only a fraction of the power is required to maintain the temperature.
Energy consumption during CD was calculated based on equation:
where is the power of the fan divided by 6 because fan powers 6 drying chineys, is the power of the heater, and t was the drying time.
Energy consumption during MVD was calculated based on the following formula:
where is the output power of magnetrons, is the working efficiency of magnetrons, is the power of the vacuum, and is the power of the electric motor used to rotate the sample.
Energy consumption during MCD was calculated based on the formula:
where is the output power of magnetrons, is the working efficiency of magnetrons, is the power of the heater, and is the power of the fan and t is the drying time.
Energy consumption during VD was calculated based on the equation:
where is the power of the heater, is the power of the vacuum pomp, and t is the drying time.
Energy consumption during FD was calculated based on the following formula:
where is the power of the heater, is the power of the compressor, is the power of vacuum pomp, and t is the time of drying.
The energy consumption of CD/MVD was determined as the sum of energy expended during convective pre-drying and microwave vacuum finish drying, calculated sequentially as and :
2.13. Specific Energy Consumption
The specific energy consumption (SEC) for each of the drying methods was calculated based on the equations given by Chua et al. [43]:
where E is the energy consumed during drying and OD process, and W is the mass of the water that was removed from the sample during the drying process.
2.14. CT Scan Analysis
Computed microtomography was employed to prepare sample images using Phoenix Vitomex S (Waygate Technologies, Hürth, Germany). Reconstruction and CT scan analysis was performed using VG Studio Max (Volume Graphics, Heidelberg, Germany).
2.15. Statistical Analysis
All statistical analyses were conducted using STATISTICA 13.3 software (StatSoft, Krakow, Poland). The results obtained from physicochemical analyses were presented as mean values ± standard deviation. Analysis of variance was performed using the honest significant difference (HSD) Tukey’s test (p < 0.05) to determine the statistical significance of differences.
3. Results and Discussion
3.1. Osmotic Dehydration
After conducting an osmotic dehydration process (OD) according to the methodology, the calculated values of SG (solid gain) and WL (water loss) were found to be 0.0764 ± 0.0028 g⋅g−1 of fresh material and 0.1128 ± 0.0029 g⋅g−1 of fresh material, respectively. The OD of garlic resulted in a reduction in moisture content (Mc) by over 7.5%. In other studies involving the osmotic dehydration of garlic in an osmotic solution based on tomato juice and with reduced pH, the Mc decreased by over 12% [23]. However, it should be noted that the parameters of OD depend on the shape and size of the particles [12]. If larger garlic cloves were used in the current research, this may result in lower WL and SG values.
3.2. Drying Kinetics
Figure 2, Figure 3, Figure 4, Figure 5 and Figure 6 depict the drying kinetics for different drying methods: convective drying (CD), vacuum microwave drying (MVD), microwave convective drying (MCD), vacuum drying (VD), and combined drying (CD/MVD). Each Figure represents the drying kinetics for garlic samples that were not subjected to any pre-treatment before drying and garlic samples that underwent OD before drying.
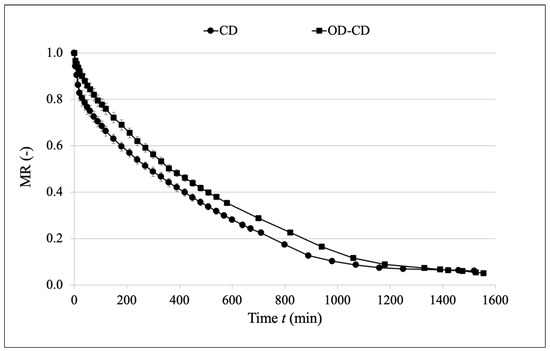
Figure 2.
Drying kinetics of garlic dried using CD (convective drying).
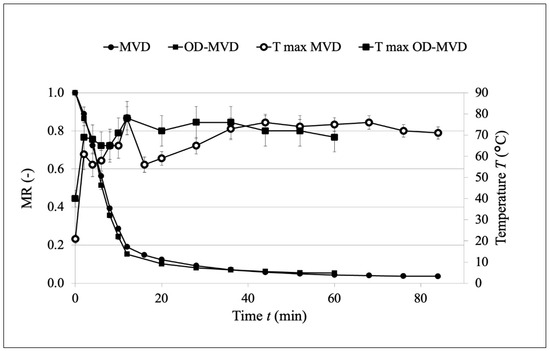
Figure 3.
Drying kinetics of garlic dried using MVD (microwave vacuum drying).
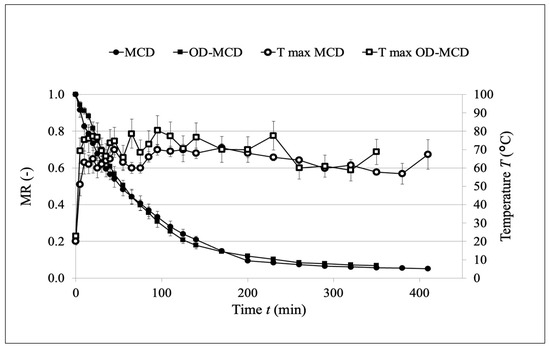
Figure 4.
Drying kinetics of garlic dried using MCD (microwave convective drying).
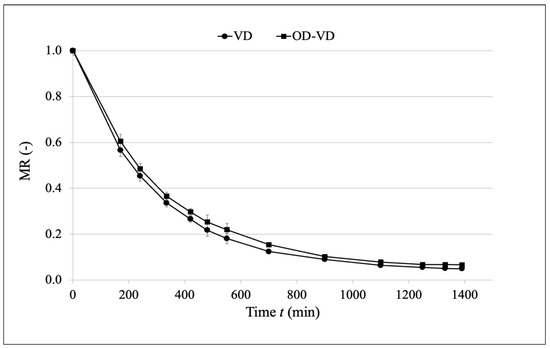
Figure 5.
Drying kinetics of garlic dried using VD (vacuum drying).
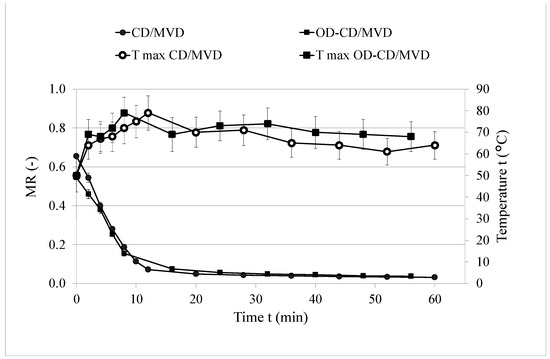
Figure 6.
Drying kinetics of garlic dried using combined drying (microwave vacuum finish drying).
Based on Figure 2, it can be observed that in the initial stages of the drying, the sample subjected to the CD exhibited a higher drying rate than the sample subjected to the OD process before CD. This phenomenon resulted from the fact that in the OD process, the diffusing water from the sample to the solution originated from the surface of the dehydrated sample, as previously documented in the scientific literature [44,45,46]. In the successive stages of drying, the drying curves of both samples became parallel, suggesting a similar drying process. It cannot be definitively concluded that the solid substance that penetrated during the OD process had a negative impact on the drying process, which also aligns with the existing literature [47]. Due to the initial drying period, during which the OD/CD sample exhibited a lower drying rate, the convective drying process took more time. However, the final Mc values for the CD and OD/CD samples reached similar levels, with no statistically significant differences between them (Table 1).

Table 1.
The ΔE (total color difference), moisture content (Mc), and water activity (Aw) of dried or dehydrated and dried garlic cloves.
The drying kinetics of dehydrated and non-dehydrated garlic, dried using the MVD method, are presented in Figure 3.
The graphs indicate a similarity in the drying kinetics of both samples. However, the drying time for the OD/MVD sample was approximately 24 min shorter than that of the MVD alone. Simultaneously, the dehydrated and dried samples exhibited a significantly lower Mc (Table 1). This suggests that substances absorbed by the sample from the osmotic solution did not lead to pore blockage within the tissue of the dried garlic as observed in studies on the osmotically dehydrated pumpkin by Lech et al. [40]. On the other hand, literature reports indicate that, in the case of this method, applying OD before the drying process resulted in a nearly-30% reduction in drying time while achieving a similar moisture content in the sample. The shorter drying time of the sample after OD can be attributed to the fact that OD can enhance drying efficiency by facilitating the movement of moisture from the interior of the sample to its surface, promoting faster and more uniform drying [48]. In addition, the shorter drying time of the sample subjected to OD before the process may result from the infiltration of molecules from the osmotic solution, which typically includes NaCl present in commercial juices. This infiltration could lead to an improvement in the dielectric properties of the sample, consequently contributing to greater microwave absorption [49]. During the MVD process, when the sample reached a temperature of 80 °C, the magnetron power was reduced to 25% of the initial power. In contrast, for the non-dehydrated sample, a significantly greater decrease in sample temperature (Figure 2) was observed after power reduction. However, in the final stages of drying, the temperatures of both samples reached similar values. The absence of a higher temperature for the OD/MVD sample during drying, which depends on the internal pressure of water vapor, may also indicate the non-blocking of pores by substances from the osmotic solution. Indeed, the data presented in Table 2 confirm that despite the lower open porosity and total porosity for the MVD sample, the OD-MVD sample exhibited a lower quantity of closed pores after drying.
Table 2.
Apparent, true, and pycnometer density (g⋅cm−1) and total, open, and closed porosity (%) of dried or dehydrated and dried samples of garlic.
In the case of MCD drying (Figure 4), the drying time of the dehydrated sample was also shorter than that of the non-dehydrated sample. Comparing drying times using MCD and CD (Table 3), it was calculated that for the undehydrated sample, MCD took 73% less time than CD. In the case of the sample previously subjected to OD, the MCD process time was 77.5% shorter than in the case of a dehydrated sample dried using CD.
Table 3.
Energy consumption and specific energy consumption of dried or dehydrated and dried samples of garlic and the total drying time of different drying methods (with and without osmotic dehydration).
Sharma and Prasad have demonstrated that the MCD method allows for the more efficient drying of garlic cloves than conventional CD, resulting in savings of 80–90% of the drying time [26]. In our research, a lower percentage reduction in drying time was observed (comparing CD to MCD), which may be attributed to differences in the biological material used. Additionally, the removal of water from garlic clove halves is easier than from whole garlic cloves due to the elimination of the hard-to-permeate epidermis layer [50]. The drying kinetics of the MCD and OD-MCD samples proceeded in a similar manner. However, the drying time of the pre-dehydrated sample was approximately 15% shorter than that of the non-dehydrated sample, which can be caused by the removal of part of the water during OD. Importantly, after drying, no significant differences were observed between the values of both Mc and Aw for the two samples.
The VD process (Figure 5) took the same amount of time for both the OD and non-OD samples. The OD-VD sample is characterized by lower humidity compared to VD; however, the differences are not statistically significant, so it can be considered that OD did not affect the drying kinetics of VD. On the other hand, in terms of kinetics, it is evident that the initial drying stage of VD is slightly faster compared to OD-VD, as observed also in samples dried using the convection method. The drying time using the VD method was very long; however, garlic cloves sliced into 5 mm thick pieces dry much faster. Rahman et al., drying such prepared garlic slices using the VD method at 60 °C, achieved an Mc of 0.1 kg/kg of the sample after 480 min of the process [51].
In the case of kinetic of combined drying (Figure 6), no statistically significant differences were observed between the drying times of the CD/MVD and OD-CD/MVD samples. Following drying, no significant differences in the Aw values of both samples were noted (Table 1). However, the sample that was not osmotically dehydrated before drying achieved a lower Mc value after the process compared to the dehydrated sample. The CD/MVD drying process for both samples began with convective pre-drying, after which the CD/MVD sample exhibited lower moisture content in its structure. In the initial stage of further drying using the MVD method, the moisture content values between the two samples equalized, and in the subsequent stages of drying, the drying kinetics of both samples exhibited a similar shape.
3.3. Drying Model
The performance of various drying models was evaluated using the coefficient of determination (R2) and root mean square error (RMSE) metrics. The results are summarized as follows: the Newton model (R2 > 0.563; RMSE < 0.134); the Midilli model (R2 > 0.969; RMSE < 0.0571); the logarithmic model (R2 > 0.968; RMSE < 0.0340); the two-term model (R2 > 0.964; RMSE < 0.0607); the modified Page model (R2 > 0.970; RMSE < 0.0557); and the Weibull model (R2 > 0.993; RMSE < 0.0225). This indicates that the Weibull model achieved the highest R2 values (>0.993) across all drying methods, signifying the best fit among the models. Additionally, the RMSE values for the Weibull model were the lowest (<0.0225) for all drying methods, demonstrating superior accuracy. The Weibull model has gained significant popularity in recent times across various domains such as agricultural processing, pharmacology, and mechanical engineering, owing to its straightforwardness, adaptability, and a broad range of applications [52]. This model has been previously utilized to model the drying kinetics of various materials such as grains [53], ginkgo seeds [54], red pepper [55], maqui berries [56], and dog roses [57]. However, it has been especially effective in describing the drying kinetics of black garlic [34]. Furthermore, Zheng et al. [58] conducted a comparative study on the influence of various drying methods on garlic slices, emphasizing the significance of the Weibull model in assessing drying characteristics and product quality.
Based on the presented parameters in this study (Table 4), it can be observed that the drying constant, represented by the parameter k, was higher for samples that underwent osmotic dehydration before the drying process for all drying methods except finish drying in the CD/MVD method. The highest values of the k parameter were observed for the finish microwave vacuum drying in CD/MVD sample, both with and without OD before the drying process. The higher value of k parameter during CD/MVD finish drying causes faster evaporation after the changing of the drying method. In the case of each utilized drying method, OD conducted prior to drying led to an increase in the parameter a. The above information points to the rationale behind the highest b parameter value specified for CD/MVD drying. Changes in the parameter n reflect differences in the drying process dynamics among various methods, which can be crucial for optimizing drying conditions in the food industry [59]. In the case of CD, pre-dehydration with OD led to an increase in the n value, a similar trend was observed for MVD and MCD. For VD, an increase in the n value was also noted for the sample subjected to prior OD, although this change was not as significant as in the aforementioned methods. In the case of CD/MVD, the kinetics of the sample pre-treated with OD before drying exhibited a slightly lower n value compared to the sample without dehydration before the drying. The parameter is significantly higher; thus, it can be concluded that OD improves the drying rate.
Table 4.
The parameters of the Weibull model (a, b, k, and n) were determined, and the fitting of the model to the drying kinetics was evaluated using the root mean square error (RMSE) and the coefficient of determination (R2).
3.4. Physical Properties of Dried Garlic
Table 1 presents the physical properties of dried garlic subjected to osmotic dehydration (OD) and untreated samples before the drying process. In Table 1, the moisture content (Mc) and water activity (Aw) of individual samples were also included.
Additionally, Figure 7 depicts the appearance of samples subjected to drying, and osmotic dehydration followed by drying using various drying methods. In the case of CD and CD/MVD methods, a slight but statistically significant increase in the final material humidity was observed compared to osmotically dehydrated samples before the application of these drying methods.
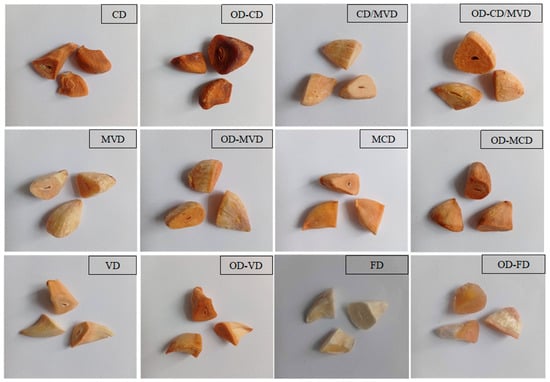
Figure 7.
The appearance of samples after the drying process using various drying methods and after the drying process preceded by osmotic dehydration.
For the sample dehydrated in tomato juice, water evaporation during lyophilization could have been hindered due to insufficient freezing of the concentrated juice, which penetrated the tissues of the dried garlic [60]. The opposite situation occurs in the case of MCD and VD samples. For the MVD method, the final humidity values did not differ significantly between the dehydrated and non-dehydrated samples (MVD, OD-MVD). However, the substances penetrating during OD (primarily NaCl from concentrated tomato juice) can enhance the dielectric properties of garlic, which significantly impacts microwave drying [49]. The only sample that showed a significant difference in final humidity values is the lyophilized sample, where dehydration before the FD process resulted in reduced drying efficiency and, consequently, twice the final humidity compared to the FD sample. In the case of non-dehydrated garlic samples, as confirmed by previous studies such as Ratti et al. [61], the FD time for whole garlic cloves was expected to be similar to that of CD; however, in the case of these studies, the time of FD was much longer (Table 3).
The lowest Aw value was obtained for samples dried using the CD/MVD method. In the case of drying methods such as CD, MVD, CD/MVD, and FD, the samples subjected to osmotic dehydration before drying achieved a higher water activity compared to non-dehydrated samples. All samples, both those subjected to osmotic dehydration before drying and those not dehydrated, reached significantly lower Aw values than 0.6, considered as the minimum value indicating food safety [62].
The total color change ΔE provides an estimate of the significance of the color change. For all dried or dehydrated and dried samples, ΔE significantly exceeds the value noticeable to the human eye, because all the values are greater than 2.0 [63]. The smallest color changes in the garlic clove epidermis were observed in samples dried using FD and MVD, while the largest changes occurred with CD and MCD methods. In the case of each sample, the dehydration process significantly influenced the increase in the ΔE parameter. For the center of the garlic clove, OD-CD exhibited the highest ΔE value, whereas samples after FD, CD/MVD, and VD displayed colors closest to fresh garlic. Minimal color changes observed after FD were attributed to the low temperature during the process, minimizing the quantity and efficiency of chemical reactions leading to color changes. Water removal occurred through sublimation, limiting alterations in the chemical structure of compounds present in the sample. Furthermore, the reduced temperature and pressure during the process protected the sample from oxidation, preventing significant color changes [61]. During MVD, the color change is not as significant as in convective drying due to its faster drying process, minimizing the exposure time to chemical components leading to color changes. Furthermore, the controlled vacuum atmosphere reduces the oxygen content, decreasing the risk of oxidation of chemical substances in the products, which is the primary cause of color change [64]. In the case of each drying method, the color change on the surface and cross-section of a garlic clove achieved higher values for dehydrated samples compared to non-dehydrated ones. High ΔE values result from the absorption of pigments present in the solution created based on tomato juice by the garlic samples, which were absorbed by the dehydrated tissue. This hypothesis is supported by studies conducted by Masztalerz et al. [30], where dehydrated samples were immersed in an osmotic solution based on concentrated chokeberry juice and mint extract, as well as in the study by Lech et al. [40], which focused on the osmotic dehydration of pumpkin in an osmotic solution based on chokeberry, flowering quince, and raspberry concentrated juice. In the case of powdered samples, the color change of dehydrated and subsequently dried samples also achieved a higher value of ΔE. When it comes to powdered samples, the least color change was observed in MVD, OD-MVD, and VD, whereas the greatest color change in powdered garlic cloves was noted in MCD and CD/MVD samples.
3.5. Structure and Texture
Table 2 presents the physical parameters concerning the density and porosity of garlic clove halves after drying processes or osmotic dehydration followed by drying as well as their hardness and cohesiveness calculated based on the TPA test.
The fresh sample has the highest apparent density due to its significant mass, resulting from a high water content in its structure. This directly influences the density value for a similar volume. Samples dried using the CD method had the highest apparent density among all tested samples. This is because of a significant drying shrinkage, which is much smaller in samples dried using VD, MVD, and CD/MVD methods. As a result, samples dried with these methods have lower apparent density values [65]. OD had a noticeable effect on density values for each drying method. The density increased for samples dehydrated before drying, especially for OD-MCD, OD-FD, and OD-CD/MVD samples. In addition, considering FD, higher apparent density values after dehydration are associated with higher Mc values. The true density values between the samples do not differ significantly, which is normal for organic matter. These values also show no significant differences between dried samples and those subjected to dehydration and subsequent drying. This is associated with the penetration of dry mass from the osmotic solution, and slight variations arise from achieving different Mc values [66].
When analyzing the effect of OD on porosity, it was noted that it was related more to the method of drying than to OD. The method of heat delivery and the conditions of the drying process more significantly affected the porosity value. The highest porosity was characterized by samples for which the MVD method was used, where very large pores were formed inside the raw material because of puffing, which was confirmed by analysis via a CT scan (Figure 8). This is typical of this drying method [67]. On the other hand, the smallest porosity values were noticed in the case of CD, which is the result of high shrinkage and collapse of the cellular structure [46]. The CT scan images for the samples in question show collapsed cell structure and small pore size (Figure 8). However, in the case of CD, it was noted that OD significantly increases the porosity of the particle; this is due to the penetration of solids from the tomato juice inside the garlic structure causing less shrinkage during drying and better maintenance of the internal structure. In Figure 8, it is noticeable that the pores of OD-CD samples are larger relative to CD [46]. MCD has an average porosity value in the samples; for this method, we can see that the distribution of pores in the cross-section of the sample is more uniform than in the case of MVD, and the size of individual pores is larger than that of CD. Microwave and confinement heating makes the diffusion of water throughout the particle more uniform, resulting in less shrinkage than with CD, and there is no puffing effect as with MVD. In addition, MCD has a higher porosity than OD-MCD. MCD samples compared to OD-MCD have larger pores in the internal structure of the garlic, and the formation may have to do with the higher water content in these samples, as a significant portion of the water in the garlic has been removed due to OD (Figure 8). For most of the samples, a much larger part of the porosity was open-pore porosity, which is typical for drying; during the drying process, there is significant damage to the internal structure, depending on the drying method, caused by high shrinkage (CD), reduced pressure (VD), freezing (FD), or MVD puffing effect. Only in the case of MCD was it observed that OD caused the volume of closed pores to be significantly larger than the volume of open pores; moreover, MCD samples had a significantly higher value of closed pores than samples obtained through other methods. This means that this method has a less destructive effect on the internal structure of the dried material, and in addition, OD caused a significant sealing of the pores by the penetration of solids from the juice.
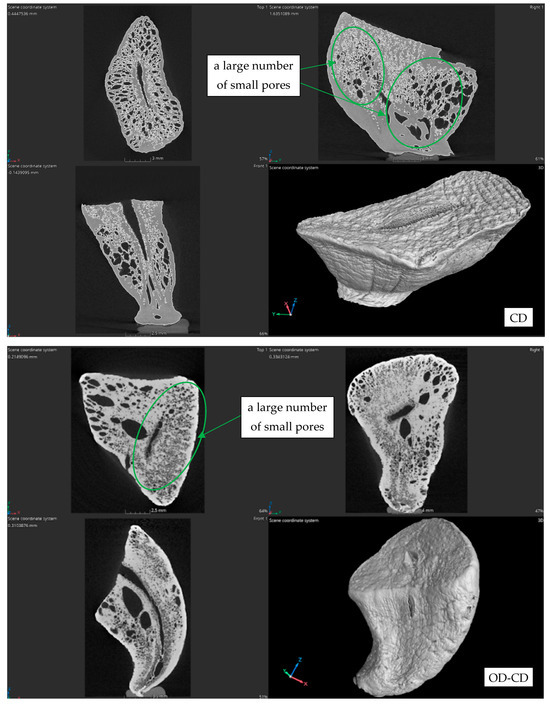
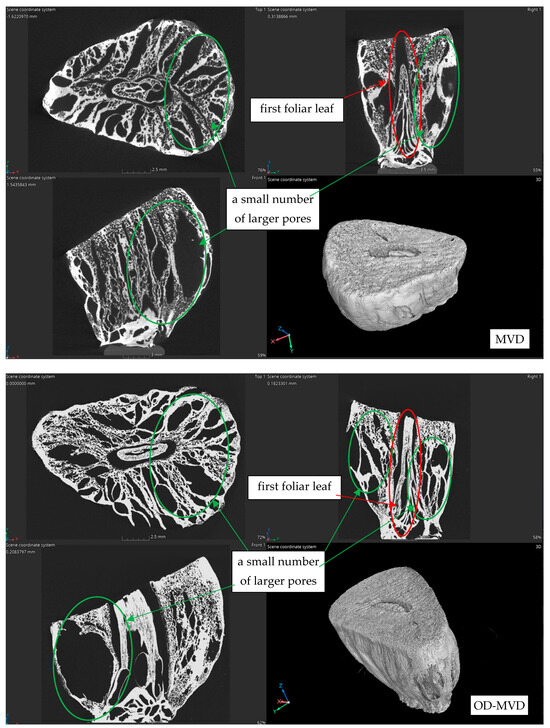
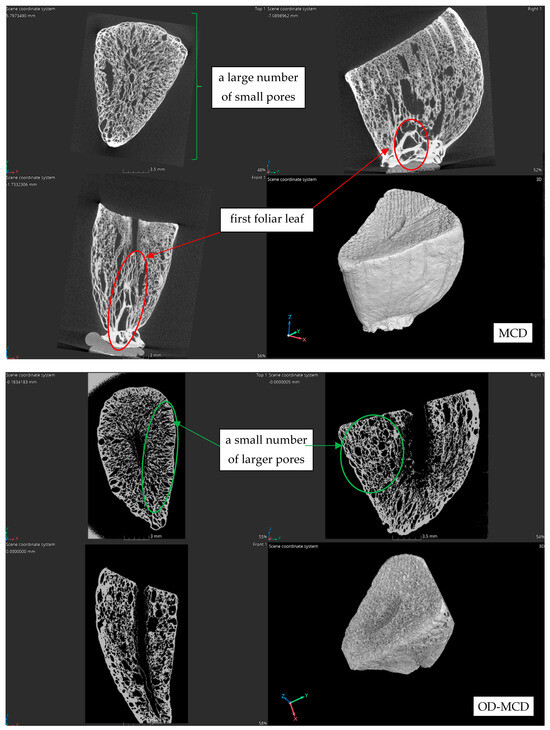
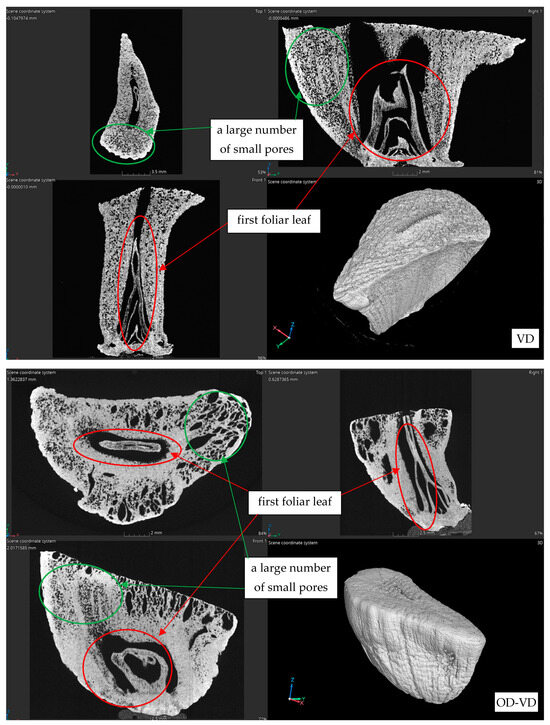
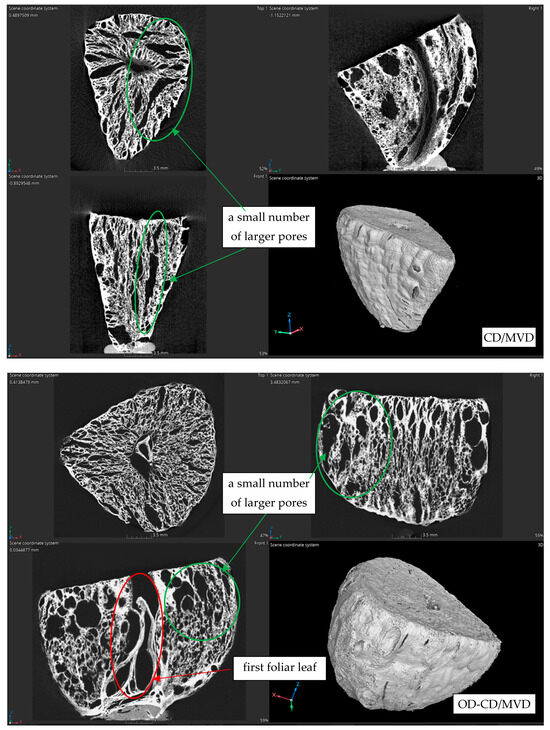
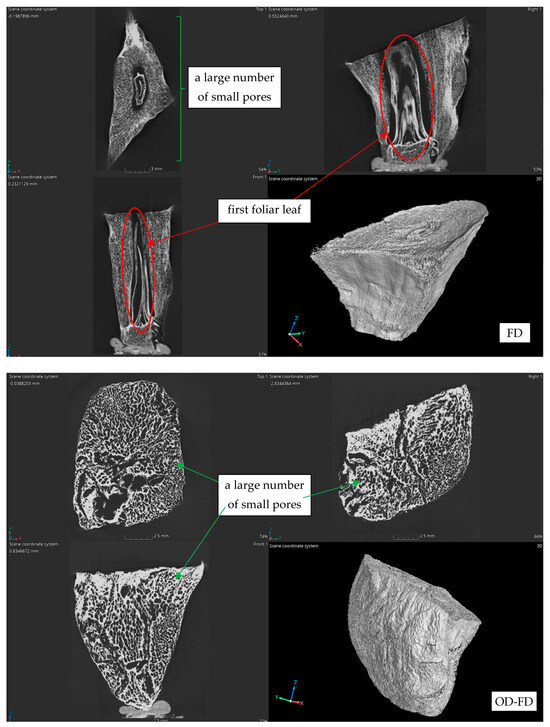
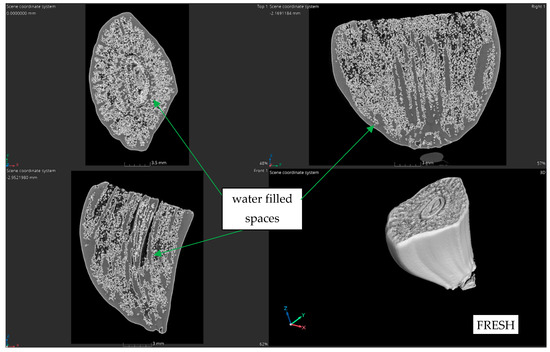
Figure 8.
Images of garlic clove halves captured through microtomography after the drying process or after osmotic dehydration and drying.
Based on TPA tests, it was found that OD had no significant effect on hardness; however, what drying method was used had a significant effect (Table 2). CD samples had the highest hardness and MVD the lowest, which is correlated with the porosity of the particles; the higher the porosity of the dried material, the lower the hardness [67]. CD samples were from about 4 to about 14 times harder than samples obtained through other methods.
Figure 8 depicts images taken using CT scans of the samples before the drying process, as well as after OD and drying, and a fresh sample of half a garlic clove. These images enabled the observation of differences in the porosity and tissue behavior of garlic following the utilization of various drying methods, as well as the impact of osmotic dehydration on these parameters.
The increase in the number of open pores may be a consequence of the leaching process of dissolved substances, leading to the formation of a greater number of open spaces within the sample structure. This phenomenon contributes to the overall total porosity, particularly when osmotic dehydration is conducted before the drying process, as indicated by the data presented in Table 2. The images obtained via CT scan confirm that MVD drying resulted in the highest total porosity, with osmotic dehydration preceding the drying process leading to the generation of a greater number of open pores. Conversely, the reduction in the number of closed pores can be attributed to cell shrinkage due to water loss during the drying process. This shrinkage limits the number of enclosed spaces within the sample structure, affecting the closed porosity. Interestingly, the non-dehydrated sample exhibited a smaller quantity of closed pores. Conducting convective pre-drying (CD) in the case of the CD/MVD sample did not significantly affect both closed porosity and open porosity. However, CT scan images of the CD/MVD and OD-CD/MVD samples revealed an increased number of small pores compared to a small quantity of large pores observed in the MVD case. This phenomenon could be linked to the reduced efficiency of the puffing phenomenon characteristic of the samples dried using the MVD method. The final alteration in the pore count is dependent on the specific characteristics of the cells themselves and the conditions of osmotic dehydration, which may vary depending on the type and condition of the sample [68]. Notably, the sample of fresh garlic exhibited the lowest porosity, attributed to the high water content present in the tissues of the examined garlic [69]. With multiple samples, the ascertained high porosity is a result of the first foliar leaf, which passes through the garlic notch, dislodging from the sample after drying. This phenomenon is highlighted in red in Figure 8 and is not an inherent outcome of the drying process itself.
3.6. Energy Consumption and Specific Energy Consumption
In Table 3, values of energy consumption and specific energy consumption for dehydrated and non-dehydrated garlic samples dried using various methods are presented. Additionally, the table includes information about the total drying time for the samples using the respective drying methods. In the case of osmotic dehydration conducted before the drying process, the energy consumption for this part of the process was 342 ± 20 kJ, with a duration of 90 ± 2 min, which was subsequently added to the overall energy consumption and process time.
FD is energy-intensive primarily due to the high energy demand required to maintain suitable temperature and pressure conditions, as well as the use of powerful vacuum pumps to remove water vapor from the lyophilization chamber [22,70]. Despite its energy costs, it is often used for its ability to preserve the quality of delicate food and pharmaceutical products [10]; however, in this study, it proved to be inefficient, especially for pre-dehydrated samples. CD was relatively less energy-intensive than FD; however, both the energy consumption and specific energy consumption values for CD and OD-CD samples, compared to those dried using other methods such as MCD or MVD, were significantly higher. In convective drying, energy is mainly used to heat the air, which is then transferred to the food product to evaporate moisture. Evaporating water from the sample using this method is also time-consuming due to the challenge of removing water from deeper layers of the dried material [71]. For MVD, the dehydrated sample dried in a shorter time. Moreover, MVD proved to be the most efficient and least energy-intensive process. This suggests that the implementation of the MVD method resulted in a more efficient and expedited dehydration process, highlighting its potential for effective and energy-efficient drying compared to other methods examined, as confirmed, for example, in the study by Hnin et al. [72]. The overall process time for OD-CD/MVD was 30 min longer than for the non-dehydrated sample, even though the drying time for the pre-dehydrated sample itself was shorter. Nevertheless, a study conducted by Angel Calin-Sanchez et al. [18] found that utilizing the CD/MVD method for drying garlic slices resulted in a significant reduction in energy consumption by 54.42 to 86.2% when compared to using the traditional CD method. In the case of these studies focusing on drying half garlic cloves, the energy consumption for the CD/MVD method decreased 4.5 times compared to the CD method. Moreover, the CD/MVD method proved to be effective in preserving bioactive compounds present in garlic slices [18]. Based on the data regarding energy consumption and drying process time, it might be speculated that pre-drying the sample may not be justified. However, the utilization of convective pre-drying and microwave vacuum finish drying resulted in samples with more favorable physical parameters, such as Mc or Aw. Based on the research findings, OD did not significantly impact energy consumption during the drying process. However, the drying method had a significant effect on energy consumption. FD resulted in the highest energy consumption, around 106 MJ, while the lowest was observed for the MVD method at about 4 MJ. Although OD did not significantly affect energy consumption for selected drying methods, it was noted that methods utilizing microwaves for sample heating resulted in slightly lower energy consumption, possibly due to improved dielectric properties of garlic leading to more efficient drying. For other methods, energy consumption was slightly higher for pre-dehydrated samples because the drying time was similar, and relatively little water was removed during osmotic dehydration.
4. Conclusions
The results of this study did not confirm the hypothesis that conducting osmotic dehydration before drying, regardless of the drying method used, leads to a reduction in porosity and an increase in the strength of dried garlic particles through the infiltration of particles from the osmotic solution into the structure of the dehydrated material. It turned out that the drying method rather, than osmotic dehydration, had a significant effect on the studied structure and the strength of dried garlic.
Taking into account the above, we reach the following conclusions:
- The process of osmotic dehydration in filtered concentrated tomato juice had a slight influence on the creation of the structure of the dried product. On the other hand, penetration of the substance from the juice into the garlic could significantly affect the chemical and sensory properties of the product, however, it requires more studies on the topic.
- Osmotic dehydration significantly increased the total color difference of the dried product compared to samples without osmotic dehydration for both the surface of the particles and the powder obtained from the dried product.
- Energy consumption during drying was significantly affected by the chosen drying method, while osmotic dehydration did not significantly affect energy consumption within the same drying method. Only a slight increase in the total processing time could be reported compared to the drying process without pretreatment.
- Based on drying kinetics, the Weibull model was fitted as the best-suited model for drying osmotically dehydrated and non-dehydrated garlic clove halves.
Future Perspectives and Practical Application
Research on the impact of osmotic dehydration on the process of garlic drying and the analysis of various drying methods have significant practical implications for the food industry. Implementing the findings of this research can contribute to improving the quality of production of dried spices and garlic-based food products. Utilizing osmotic dehydration before garlic drying may result in increased product shelf life and reduced energy consumption in the production process. Further refinement of drying methods based on the findings of this study could lead to the introduction of innovative solutions in the food industry, enhancing competitiveness in the market and promoting sustainable food production. The findings underscore the advantageous effects of incorporating osmotic dehydration as a preliminary step in the drying processes. These insights contribute valuable information to the optimization of drying techniques, emphasizing the potential of osmotic dehydration as a beneficial pre-treatment in various drying applications. Future research should focus on exploring the chemical and sensory properties of dried garlic after osmotic dehydration, as well as investigating other osmotic solutions and drying methods, to further enhance the quality of the products and the efficiency of the drying processes.
Author Contributions
Conceptualization: A.Z., K.M. and K.L.; Data curation: A.Z., K.M. and K.L.; Formal analysis: A.Z. and K.L.; Funding acquisition: K.M.; Investigation: A.Z. and K.M.; Methodology: A.Z. and K.M.; Project administration: K.M.; Resources: K.M.; Supervision: K.M. and K.L.; Validation: K.M. and K.L.; Visualization: A.Z. and K.M.; Writing—original draft: A.Z., K.M. and K.L.; Writing—review and editing: K.M. and K.L. All authors have read and agreed to the published version of the manuscript.
Funding
This work was funded by the National Science Centre (POLAND) based on decision no UMO-2019/33/N/NZ9/00247. The publication is the result of the research group activity: “Plants4food”.
Institutional Review Board Statement
Not applicable. This study did not involve human or animal subjects and therefore did not require ethical approval.
Data Availability Statement
The original contributions presented in the study are included in the article material, further inquiries can be directed to the corresponding author.
Acknowledgments
The article is part of a Ph.D. dissertation titled: “Influence of pre-treatment of raw material and solution on physicochemical properties and kinetics of osmotic dehydration and drying of garlic”, prepared within the Doctoral School at the Wroclaw University of Environmental and Life Sciences. The APC is financed by Wroclaw University of Environmental and Life Sciences.
Conflicts of Interest
The authors declare no conflicts of interest. The funders had no role in the design of the study; in the collection, analyses, or interpretation of data; in the writing of the manuscript; or in the decision to publish the results.
References
- Petrovska, B.; Cekovska, S. Extracts from the History and Medical Properties of Garlic. Pharmacogn. Rev. 2010, 4, 106. [Google Scholar] [CrossRef] [PubMed]
- Bhatwalkar, S.B.; Mondal, R.; Krishna, S.B.N.; Adam, J.K.; Govender, P.; Anupam, R. Antibacterial Properties of Organosulfur Compounds of Garlic (Allium sativum). Front. Microbiol. 2021, 12, 613077. [Google Scholar] [CrossRef]
- El-Saber Batiha, G.; Magdy Beshbishy, A.; G. Wasef, L.; Elewa, Y.H.A.; A. Al-Sagan, A.; Abd El-Hack, M.E.; Taha, A.E.; M. Abd-Elhakim, Y.; Prasad Devkota, H. Chemical Constituents and Pharmacological Activities of Garlic (Allium sativum L.): A Review. Nutrients 2020, 12, 872. [Google Scholar] [CrossRef]
- Shao, X.; Sun, C.; Tang, X.; Zhang, X.; Han, D.; Liang, S.; Qu, R.; Hui, X.; Shan, Y.; Hu, L.; et al. Anti-Inflammatory and Intestinal Microbiota Modulation Properties of Jinxiang Garlic (Allium sativum L.) Polysaccharides toward Dextran Sodium Sulfate-Induced Colitis. J. Agric. Food Chem. 2020, 68, 12295–12309. [Google Scholar] [CrossRef]
- Guan, M.-J.; Zhao, N.; Xie, K.-Q.; Zeng, T. Hepatoprotective Effects of Garlic against Ethanol-Induced Liver Injury: A Mini-Review. Food Chem. Toxicol. 2018, 111, 467–473. [Google Scholar] [CrossRef]
- Kuna, L.; Zjalic, M.; Kizivat, T.; Roguljic, H.; Nincevic, V.; Omanovic Kolaric, T.; Wu, C.H.; Vcev, A.; Smolic, M.; Smolic, R. Pretreatment of Garlic Oil Extracts Hampers Epithelial Damage in Cell Culture Model of Peptic Ulcer Disease. Medicina 2022, 58, 91. [Google Scholar] [CrossRef] [PubMed]
- Shang, A.; Cao, S.-Y.; Xu, X.-Y.; Gan, R.-Y.; Tang, G.-Y.; Corke, H.; Mavumengwana, V.; Li, H.-B. Bioactive Compounds and Biological Functions of Garlic (Allium sativum L.). Foods 2019, 8, 246. [Google Scholar] [CrossRef] [PubMed]
- Mathew, B.C.; Biju, R.S. Neuroprotective Effects of Garlic A Review. Libyan J. Med. 2008, 3, 23–33. [Google Scholar] [CrossRef] [PubMed][Green Version]
- Dorrigiv, M.; Zareiyan, A.; Hosseinzadeh, H. Garlic (Allium sativum) as an Antidote or a Protective Agent against Natural or Chemical Toxicities: A Comprehensive Update Review. Phytother. Res. 2020, 34, 1770–1797. [Google Scholar] [CrossRef]
- Sah, R.; Singh, M.P.; Gohil, K.J. A Comprehensive Study of Allium sativum Linn. Curr. Funct. Foods 2024, 2, e291123224020. [Google Scholar] [CrossRef]
- Barreca, D.; Trombetta, D.; Smeriglio, A.; Mandalari, G.; Romeo, O.; Felice, M.R.; Gattuso, G.; Nabavi, S.M. Food Flavonols: Nutraceuticals with Complex Health Benefits and Functionalities. Trends Food Sci. Technol. 2021, 117, 194–204. [Google Scholar] [CrossRef]
- Yadav, A.K.; Singh, S.V. Osmotic Dehydration of Fruits and Vegetables: A Review. J. Food Sci. Technol. 2014, 51, 1654–1673. [Google Scholar] [CrossRef]
- Ashtiani, S.-H.M.; Aghkhani, M.H.; Feizy, J.; Martynenko, A. Effect of Cold Plasma Pretreatment Coupled with Osmotic Dehydration on Drying Kinetics and Quality of Mushroom (Agaricus bisporus). Food Bioprocess Technol. 2023, 16, 2854–2876. [Google Scholar] [CrossRef]
- Salehi, F. Recent Advances in the Ultrasound-Assisted Osmotic Dehydration of Agricultural Products: A Review. Food Biosci. 2023, 51, 102307. [Google Scholar] [CrossRef]
- Kowalska, H.; Marzec, A.; Kowalska, J.; Ciurzyńska, A.; Samborska, K.; Bialik, M.; Lenart, A. Rehydration Properties of Hybrid Method Dried Fruit Enriched by Natural Components. Int. Agrophysics 2018, 32, 175–182. [Google Scholar] [CrossRef]
- Tao, Y.; Zhang, J.; Jiang, S.; Xu, Y.; Show, P.-L.; Han, Y.; Ye, X.; Ye, M. Contacting Ultrasound Enhanced Hot-Air Convective Drying of Garlic Slices: Mass Transfer Modeling and Quality Evaluation. J. Food Eng. 2018, 235, 79–88. [Google Scholar] [CrossRef]
- Liu, J.; Liu, Y.; Li, X.; Zhu, J.; Wang, X.; Ma, L. Drying Characteristics, Quality Changes, Parameters Optimization and Flavor Analysis for Microwave Vacuum Drying of Garlic (Allium sativum L.) Slices. LWT 2023, 173, 114372. [Google Scholar] [CrossRef]
- Calín-Sánchez, Á.; Figiel, A.; Wojdyło, A.; Szarycz, M.; Carbonell-Barrachina, Á.A. Drying of Garlic Slices Using Convective Pre-Drying and Vacuum-Microwave Finishing Drying: Kinetics, Energy Consumption, and Quality Studies. Food Bioprocess Technol. 2014, 7, 398–408. [Google Scholar] [CrossRef]
- Zhou, C.; Feng, Y.; Zhang, L.; Yagoub, A.E.A.; Wahia, H.; Ma, H.; Sun, Y.; Yu, X. Rehydration Characteristics of Vacuum Freeze- and Hot Air-Dried Garlic Slices. LWT 2021, 143, 111158. [Google Scholar] [CrossRef]
- Sharma, G.P.; Prasad, S. Effective Moisture Diffusivity of Garlic Cloves Undergoing Microwave-Convective Drying. J. Food Eng. 2004, 65, 609–617. [Google Scholar] [CrossRef]
- Sablani, S.S.; Rahman, M.S.; Al-Kuseibi, M.K.; Al-Habsi, N.A.; Al-Belushi, R.H.; Al-Marhubi, I.; Al-Amri, I.S. Influence of Shelf Temperature on Pore Formation in Garlic during Freeze-Drying. J. Food Eng. 2007, 80, 68–79. [Google Scholar] [CrossRef]
- Feng, Y.; Yu, X.; Yagoub, A.E.A.; Xu, B.; Wu, B.; Zhang, L.; Zhou, C. Vacuum Pretreatment Coupled to Ultrasound Assisted Osmotic Dehydration as a Novel Method for Garlic Slices Dehydration. Ultrason. Sonochemistry 2019, 50, 363–372. [Google Scholar] [CrossRef] [PubMed]
- Zimmer, A.; Masztalerz, K.; Lech, K. The Influence of the Pretreatment of Garlic (Allium sativum L.) and Tomato (Solanum lycopersicum L.) Osmotic Solution on Physical Properties of the Material. J. Food Process Eng. 2023, 46, e14314. [Google Scholar] [CrossRef]
- McCullough, M.L.; Giovannucci, E.L. Diet and Cancer Prevention. Oncogene 2004, 23, 6349–6364. [Google Scholar] [CrossRef] [PubMed]
- Shahrajabian, M.H.; Sun, W.; Cheng, Q. Chemical Components and Pharmacological Benefits of Basil (Ocimum basilicum): A Review. Int. J. Food Prop. 2020, 23, 1961–1970. [Google Scholar] [CrossRef]
- Sharma, G.P.; Prasad, S. Drying of Garlic (Allium sativum) Cloves by Microwave–Hot Air Combination. J. Food Eng. 2001, 50, 99–105. [Google Scholar] [CrossRef]
- Younis, M.; Abdelkarim, D.; Zein El-Abdein, A. Kinetics and Mathematical Modeling of Infrared Thin-Layer Drying of Garlic Slices. Saudi J. Biol. Sci. 2018, 25, 332–338. [Google Scholar] [CrossRef] [PubMed]
- Zhou, L.; Guo, X.; Bi, J.; Yi, J.; Chen, Q.; Wu, X.; Zhou, M. Drying of Garlic Slices (Allium sativum L.) and Its Effect on Thiosulfinates, Total Phenolic Compounds and Antioxidant Activity during Infrared Drying. J. Food Process. Preserv. 2017, 41, e12734. [Google Scholar] [CrossRef]
- von Horstig, M.-W.; Schoo, A.; Loellhoeffel, T.; Mayer, J.K.; Kwade, A. A Perspective on Innovative Drying Methods for Energy-Efficient Solvent-Based Production of Lithium-Ion Battery Electrodes. Energy Technol. 2022, 10, 2200689. [Google Scholar] [CrossRef]
- Masztalerz, K.; Łyczko, J.; Lech, K. Effect of Filtrated Osmotic Solution Based on Concentrated Chokeberry Juice and Mint Extract on the Drying Kinetics, Energy Consumption and Physicochemical Properties of Dried Apples. Molecules 2021, 26, 3274. [Google Scholar] [CrossRef]
- Noshad, M.; Savari, M.; Roueita, G. A Hybrid AHP-TOPSIS Method for Prospectively Modeling of Ultrasound-assisted Osmotic Dehydration of Strawberry. J. Food Process Eng. 2018, 41, e12928. [Google Scholar] [CrossRef]
- Calín-Sánchez, Á.; Lipan, L.; Cano-Lamadrid, M.; Kharaghani, A.; Masztalerz, K.; Carbonell-Barrachina, Á.A.; Figiel, A. Comparison of Traditional and Novel Drying Techniques and Its Effect on Quality of Fruits, Vegetables and Aromatic Herbs. Foods 2020, 9, 1261. [Google Scholar] [CrossRef] [PubMed]
- Turkiewicz, I.P.; Wojdyło, A.; Tkacz, K.; Lech, K.; Nowicka, P. Osmotic Dehydration as a Pretreatment Modulating the Physicochemical and Biological Properties of the Japanese Quince Fruit Dried by the Convective and Vacuum-Microwave Method. Food Bioprocess Technol. 2020, 13, 1801–1816. [Google Scholar] [CrossRef]
- Masztalerz, K.; Dróżdż, T.; Nowicka, P.; Wojdyło, A.; Kiełbasa, P.; Lech, K. The Effect of Nonthermal Pretreatment on the Drying Kinetics and Quality of Black Garlic. Molecules 2023, 28, 962. [Google Scholar] [CrossRef] [PubMed]
- Alibas, I. Characteristics of Chard Leaves during Microwave, Convective, and Combined Microwave-Convective Drying. Dry. Technol. 2006, 24, 1425–1435. [Google Scholar] [CrossRef]
- Kaya, A.; Aydın, O.; Demirtaş, C. Drying Kinetics of Red Delicious Apple. Biosyst. Eng. 2007, 96, 517–524. [Google Scholar] [CrossRef]
- Macedo, L.L.; Vimercati, W.C.; da Silva Araújo, C.; Saraiva, S.H.; Teixeira, L.J.Q. Effect of Drying Air Temperature on Drying Kinetics and Physicochemical Characteristics of Dried Banana. J. Food Process Eng. 2020, 43, e13451. [Google Scholar] [CrossRef]
- Toğrul, İ.T.; Pehlivan, D. Modelling of Drying Kinetics of Single Apricot. J. Food Eng. 2003, 58, 23–32. [Google Scholar] [CrossRef]
- Babalis, S.J.; Papanicolaou, E.; Kyriakis, N.; Belessiotis, V.G. Evaluation of Thin-Layer Drying Models for Describing Drying Kinetics of Figs (Ficus carica). J. Food Eng. 2006, 75, 205–214. [Google Scholar] [CrossRef]
- Lech, K.; Figiel, A.; Michalska, A.; Wojdyło, A.; Nowicka, P. The Effect of Selected Fruit Juice Concentrates Used as Osmotic Agents on the Drying Kinetics and Chemical Properties of Vacuum-Microwave Drying of Pumpkin. J. Food Qual. 2018, 2018, 7293932. [Google Scholar] [CrossRef]
- Lech, K.; Jursova, S.; Kobel, P.; Pustejovska, P.; Bilik, J.; Figiel, A.; Romański, L. The Relation between CRI, CSR Indexes, Chemical Composition and Physical Parameters of Commercial Metallurgical Cokes. Ironmak. Steelmak. 2019, 46, 124–132. [Google Scholar] [CrossRef]
- Figiel, A.; Tajner-Czopek, A. The Effect of Candy Moisture Content on Texture. J. Foodserv. 2006, 17, 189–195. [Google Scholar] [CrossRef]
- Chua, L.Y.W.; Chua, B.L.; Figiel, A.; Chong, C.H.; Wojdyło, A.; Szumny, A.; Lech, K. Characterisation of the Convective Hot-Air Drying and Vacuum Microwave Drying of Cassia alata: Antioxidant Activity, Essential Oil Volatile Composition and Quality Studies. Molecules 2019, 24, 1625. [Google Scholar] [CrossRef] [PubMed]
- da Silva, W.P.; da Silva e Silva, C.M.D.P.; de Farias Aires, J.E.; da Silva Junior, A.F. Osmotic Dehydration and Convective Drying of Coconut Slices: Experimental Determination and Description Using One-Dimensional Diffusion Model. J. Saudi Soc. Agric. Sci. 2014, 13, 162–168. [Google Scholar] [CrossRef]
- Kroehnke, J.; Szadzińska, J.; Radziejewska-Kubzdela, E.; Biegańska-Marecik, R.; Musielak, G.; Mierzwa, D. Osmotic Dehydration and Convective Drying of Kiwifruit (Actinidia deliciosa)—The Influence of Ultrasound on Process Kinetics and Product Quality. Ultrason. Sonochemistry 2021, 71, 105377. [Google Scholar] [CrossRef] [PubMed]
- Pavkov, I.; Radojčin, M.; Stamenković, Z.; Kešelj, K.; Tylewicz, U.; Sipos, P.; Ponjičan, O.; Sedlar, A. Effects of Osmotic Dehydration on the Hot Air Drying of Apricot Halves: Drying Kinetics, Mass Transfer, and Shrinkage. Processes 2021, 9, 202. [Google Scholar] [CrossRef]
- Igual, M.; García-Martínez, E.; Martín-Esparza, M.E.; Martínez-Navarrete, N. Effect of Processing on the Drying Kinetics and Functional Value of Dried Apricot. Food Res. Int. 2012, 47, 284–290. [Google Scholar] [CrossRef]
- Deliana, Y.; Wulandari, E.; Salam, I.M. Study the Rate of Drying and Level of Osmosis Dehydration on Physical Properties of Dried Mango Cengkir. IOP Conf. Ser. Earth Environ. Sci. 2020, 443, 012098. [Google Scholar] [CrossRef]
- Zhang, J.; Li, M.; Cheng, J.; Wang, J.; Ding, Z.; Yuan, X.; Zhou, S.; Liu, X. Effects of Moisture, Temperature, and Salt Content on the Dielectric Properties of Pecan Kernels During Microwave and Radio Frequency Drying Processes. Foods 2019, 8, 385. [Google Scholar] [CrossRef]
- Bai, B.; Li, L.; Hu, X.; Wang, Z.; Zhao, G. Increase in the Permeability of Tonoplast of Garlic (Allium sativum) by Monocarboxylic Acids. J. Agric. Food Chem. 2006, 54, 8103–8107. [Google Scholar] [CrossRef]
- Rahman, M.S.; Al-Shamsi, Q.H.; Bengtsson, G.B.; Sablani, S.S.; Al-Alawi, A. Drying Kinetics and Allicin Potential in Garlic Slices during Different Methods of Drying. Dry. Technol. 2009, 27, 467–477. [Google Scholar] [CrossRef]
- Ju, H.-Y.; Zhao, S.-H.; Mujumdar, A.S.; Fang, X.-M.; Gao, Z.-J.; Zheng, Z.-A.; Xiao, H.-W. Energy Efficient Improvements in Hot Air Drying by Controlling Relative Humidity Based on Weibull and Bi-Di Models. Food Bioprod. Process. 2018, 111, 20–29. [Google Scholar] [CrossRef]
- Liu, Z.; Xu, Y.; Han, F.; Zhang, Y.; Wang, G.; Wu, Z.; Wu, W. Control Method for Continuous Grain Drying Based on Equivalent Accumulated Temperature Mechanism and Artificial Intelligence. Foods 2022, 11, 834. [Google Scholar] [CrossRef] [PubMed]
- Boateng, I.D.; Yang, X.-M.; Tahany, A.A.A.; Li, Y.-Y.; Yolandani. Drying Methods Affect Organoleptic and Physicochemical Properties of Rehydrated Ginkgo Seed Slices. Ind. Crops Prod. 2021, 160, 113166. [Google Scholar] [CrossRef]
- Yang, X.-H.; Deng, L.-Z.; Mujumdar, A.S.; Xiao, H.-W.; Zhang, Q.; Kan, Z. Evolution and Modeling of Colour Changes of Red Pepper (Capsicum annuum L.) during Hot Air Drying. J. Food Eng. 2018, 231, 101–108. [Google Scholar] [CrossRef]
- Issis, Q.-F.; Antonio, V.-G.; Elsa, U.; Valeria, V.; Nicole, C.; Jacqueline, P. Vacuum Drying Application to Maqui (Aristotelia chilensis [Mol] Stuntz) Berry: Weibull Distribution for Process Modelling and Quality Parameters. J. Food Sci. Technol. 2019, 56, 1899–1908. [Google Scholar] [CrossRef] [PubMed]
- Pashazadeh, H.; Zannou, O.; Koca, I. Modeling and Optimization of Drying Conditions of Dog Rose for Preparation of a Functional Tea. J. Food Process Eng. 2021, 44, e13632. [Google Scholar] [CrossRef]
- Zheng, Z.-A.; Wang, S.-Y.; Wang, H.; Xiao, H.; Liu, Z.-L.; Pan, Y.-H.; Gao, L. Comparative Study on the Influence of Various Drying Techniques on Drying Characteristics and Physicochemical Quality of Garlic Slices. Foods 2023, 12, 1314. [Google Scholar] [CrossRef] [PubMed]
- Yue, Y.; Zhang, Q.; Wan, F.; Ma, G.; Zang, Z.; Xu, Y.; Jiang, C.; Huang, X. Effects of Different Drying Methods on the Drying Characteristics and Quality of Codonopsis pilosulae Slices. Foods 2023, 12, 1323. [Google Scholar] [CrossRef]
- Auleda, J.M.; Raventós, M.; Sánchez, J.; Hernández, E. Estimation of the Freezing Point of Concentrated Fruit Juices for Application in Freeze Concentration. J. Food Eng. 2011, 105, 289–294. [Google Scholar] [CrossRef]
- Ratti, C. Hot Air and Freeze-Drying of High-Value Foods: A Review. J. Food Eng. 2001, 49, 311–319. [Google Scholar] [CrossRef]
- Chawla, A.S.; Kasler, D.R.; Sastry, S.K.; Yousef, A.E. Microbial Decontamination of Food Using Ozone. In Microbial Decontamination in the Food Industry; Elsevier: Amsterdam, The Netherlands, 2012; pp. 495–532. ISBN 978-0-85709-085-0. [Google Scholar]
- Melgosa, M.; Hita, E.; Poza, A.J.; Alman, D.H.; Berns, R.S. Suprathreshold Color-Difference Ellipsoids for Surface Colors. Color Res. Appl. 1997, 22, 148–155. [Google Scholar] [CrossRef]
- Dong, W.; Cheng, K.; Hu, R.; Chu, Z.; Zhao, J.; Long, Y. Effect of Microwave Vacuum Drying on the Drying Characteristics, Color, Microstructure, and Antioxidant Activity of Green Coffee Beans. Molecules 2018, 23, 1146. [Google Scholar] [CrossRef] [PubMed]
- Curcio, S.; Aversa, M. Influence of Shrinkage on Convective Drying of Fresh Vegetables: A Theoretical Model. J. Food Eng. 2014, 123, 36–49. [Google Scholar] [CrossRef]
- Rodríguez-Ramírez, J.; Méndez-Lagunas, L.; López-Ortiz, A.; Torres, S.S. True Density and Apparent Density During the Drying Process for Vegetables and Fruits: A Review. J. Food Sci. 2012, 77, R146–R154. [Google Scholar] [CrossRef] [PubMed]
- Yan, W.-Q.; Zhang, M.; Huang, L.-L.; Mujumdar, A.S.; Tang, J. Influence of Microwave Drying Method on the Characteristics of the Sweet Potato Dices: Microwave Drying on Sweet Potato Dices. J. Food Process. Preserv. 2013, 37, 662–669. [Google Scholar] [CrossRef]
- Nieto, A.B.; Salvatori, D.M.; Castro, M.A.; Alzamora, S.M. Structural Changes in Apple Tissue during Glucose and Sucrose Osmotic Dehydration: Shrinkage, Porosity, Density and Microscopic Features. J. Food Eng. 2004, 61, 269–278. [Google Scholar] [CrossRef]
- Thuwapanichayanan, R.; Prachayawarakorn, S.; Soponronnarit, S. Heat and Moisture Transport Behaviour and Quality of Chopped Garlic Undergoing Different Drying Methods. J. Food Eng. 2014, 136, 34–41. [Google Scholar] [CrossRef]
- Keselj, K.; Pavkov, I.; Radojcin, M.; Stamenkovic, Z. Comparison of Energy Consumption in the Convective and Freeze Drying of Raspberries. J. Process Energy Agric. 2017, 21, 192–196. [Google Scholar] [CrossRef]
- Motevali, A.; Minaei, S.; Khoshtagaza, M.H. Evaluation of Energy Consumption in Different Drying Methods. Energy Convers. Manag. 2011, 52, 1192–1199. [Google Scholar] [CrossRef]
- Khaing Hnin, K.; Zhang, M.; Mujumdar, A.S.; Zhu, Y. Emerging Food Drying Technologies with Energy-Saving Characteristics: A Review. Dry. Technol. 2019, 37, 1465–1480. [Google Scholar] [CrossRef]


Disclaimer/Publisher’s Note: The statements, opinions and data contained in all publications are solely those of the individual author(s) and contributor(s) and not of MDPI and/or the editor(s). MDPI and/or the editor(s) disclaim responsibility for any injury to people or property resulting from any ideas, methods, instructions or products referred to in the content. |
© 2024 by the authors. Licensee MDPI, Basel, Switzerland. This article is an open access article distributed under the terms and conditions of the Creative Commons Attribution (CC BY) license (https://creativecommons.org/licenses/by/4.0/).