Article

Effects of Buried Straw Strips with Different Internal Structures on Water and Salt Distribution and Leaching Efficiency in Coastal Saline Soil

1
College of Agricultural Science and Engineering, Hohai University, Nanjing 210098, China
2
Tashkent Institute of Irrigation and Agricultural Mechanization Engineers, National Research University, Tashkent 100000, Uzbekistan
3
National Center for Efficient Irrigation Engineering and Technology Research-Beijing, Beijing 100048, China
4
Institute of Environment and Sustainable Development in Agriculture, Chinese Academy of Agricultural Sciences, Beijing 100081, China
5
Key Laboratory of Crop Water Use and Regulation, Farmland Irrigation Research Institute, Chinese Academy of Agricultural Science, Ministry of Agriculture and Rural Affairs, Xinxiang 453003, China
6
College of Energy and Power Engineering, Lanzhou University of Technology, Lanzhou 730050, China
*
Authors to whom correspondence should be addressed.
Agriculture 2024, 14(7), 994; https://doi.org/10.3390/agriculture14070994
Submission received: 11 May 2024 / Revised: 15 June 2024 / Accepted: 20 June 2024 / Published: 25 June 2024
(This article belongs to the Special Issue Saline–Alkali Land Ecology and Soil Management)

Abstract

:
Straw strip burial in saline soil is an effective method for tideland reclamation in China, but optimal forms of straw strips for regulating soil water and salinity remain unclear. An indoor soil column test investigated the water and salt distribution in soil treated with four different straw forms under freshwater irrigation. The treatments included no straw layer (CK), straw stalks arranged longitudinally (T5), horizontally (T25), longitudinally combined horizontally in layers (T25+2.5), and randomly (T2.5). The results showed that compared to CK, T25, T5, and T25+2.5 significantly reduced the infiltration rate of irrigation water, leading to prolonged infiltration times. Wetting front curves under T5, T25+2.5, and T25 exhibited similar inverted “V” shapes, while CK and T2.5 showed fluctuating parallel lines. Water retention in the soil was higher under straw strip treatments (T5, T25, T25+2.5) and straw layer treatment (T2.5) compared to CK after 24 h of the first irrigation. T5 demonstrated the most effective salt removal, surpassing other treatments, with a desalination rate of 97.71%. Additionally, T5 had the highest salt leaching efficiency (SLE) in the 0–20 cm soil layer, recommending it as the optimal form for managing saline soils in crop production due to its simplicity and higher SLE. We found that buried straw strips reduced soil water infiltration rate and wetting front propulsion speed, increased soil water content and enhanced salt leaching efficiency in the saline soil. Our findings provide a basis for developing strategies that improve soil quality and irrigation efficiency, mitigate the effects of salinity on crop production, and ensure food security for a rapidly growing global population.

1. Introduction

Soil salinity is one of the most prevalent environmental hazards to sustainable agriculture development [1,2,3]. Saline soils cover approximately 424 million hectares worldwide [4], including 99 million hectares in China [5,6,7]. Coastal saline soil is considered as a critical agricultural land reserve in eastern China due to its significant contribution to relieving population pressure and satisfying food demand [8]. However, shallow groundwater tables with high salinity and windy conditions in spring and winter in the coastal regions of eastern China result in an accumulation of excessive salt on the soil surface, leading to adverse effects on physicochemical properties of the soil [9,10,11]. Moreover, many specific problems such as low nutrients, scarcity of freshwater, and lower microbial diversity have always been the limiting factors of coastal saline soil, eventually restricting the growth of crops [12]. Therefore, finding effective strategies with less fresh water to manage soil salinity is essential for maintaining food security and sustainable agriculture in eastern China.
Buried straw layers have been reported to improve rainfall infiltration, enhance soil moisture, aggregation, and biological activity, while inhibiting soil evaporation [13], which can stimulate plant growth and development [14], and improve crop productivity and quality [15,16]. Furthermore, due to its wide availability and low cost, the straw layer is usually used as the capillary barrier in the coastal saline land [17,18,19]. Through an indoor soil column experiment investigating the spatiotemporal dynamics of water distribution, Cao et al. [20] observed that the incorporation of a straw layer initially impeded the infiltration rate of soil water. However, the straw layer subsequently facilitated the stabilization of the infiltration rate over time. In another column study, Zhao et al. [21] found that a 5 cm thick straw layer buried at a 40 cm soil depth could reduce the infiltration rate of soil water and wetting front velocity, as well as inhibit the phreatic evaporation and soil salinization. Despite the potential benefits of straw mulching, several studies have reported that using straw mulch alone may not increase crop yields and, in some cases, can actually lead to reduced yields [22]. This may be related to the reduction in soil temperature and hindrance of field operations, such as sowing and harvesting, under traditional straw mulching, which covers the entire soil surface.
Some researchers have suggested that applying straw strip mulching to a portion of the soil surface could resolve the conflict between soil temperature reduction and the restraint of surface water evaporation, as well as maintain soil moisture, thereby improving the yield of crops in the coastal area [23,24,25]. Compared with mulching the entire soil surface, a smaller quantity of straw strips reduced the amount of earthwork excavation and straw materials [26], as well as created an isolation effect to prevent salt accumulation on the soil surface [27]. Meanwhile, the buried straw strips at a specific depth and slope can serve as drainage pipes to remove saltwater and prevent salt accumulation on the soil surface [28]. However, few studies have investigated the appropriate forms of straw layer (or strips) that can serve as a capillary barrier as well as drainage pipes during the initial stages of coastal soil reclamation, for the optimal regulation of soil water and salinity. An indoor simulation test can minimize the uncontrollability and save costs while providing useful operational parameters and a theoretical basis for the application of related technologies prior to field demonstration and application.
The objectives of this study are as follows:
(1)
To determine the effects of different forms of straw layer (or strips) treatments on water and salt distribution in the soil;
(2)
To investigate the leaching process and efficiency under different forms of straw strips;
(3)
To identify the appropriate form for straw strip treatments.

2. Materials and Methods

2.1. Experimental Site
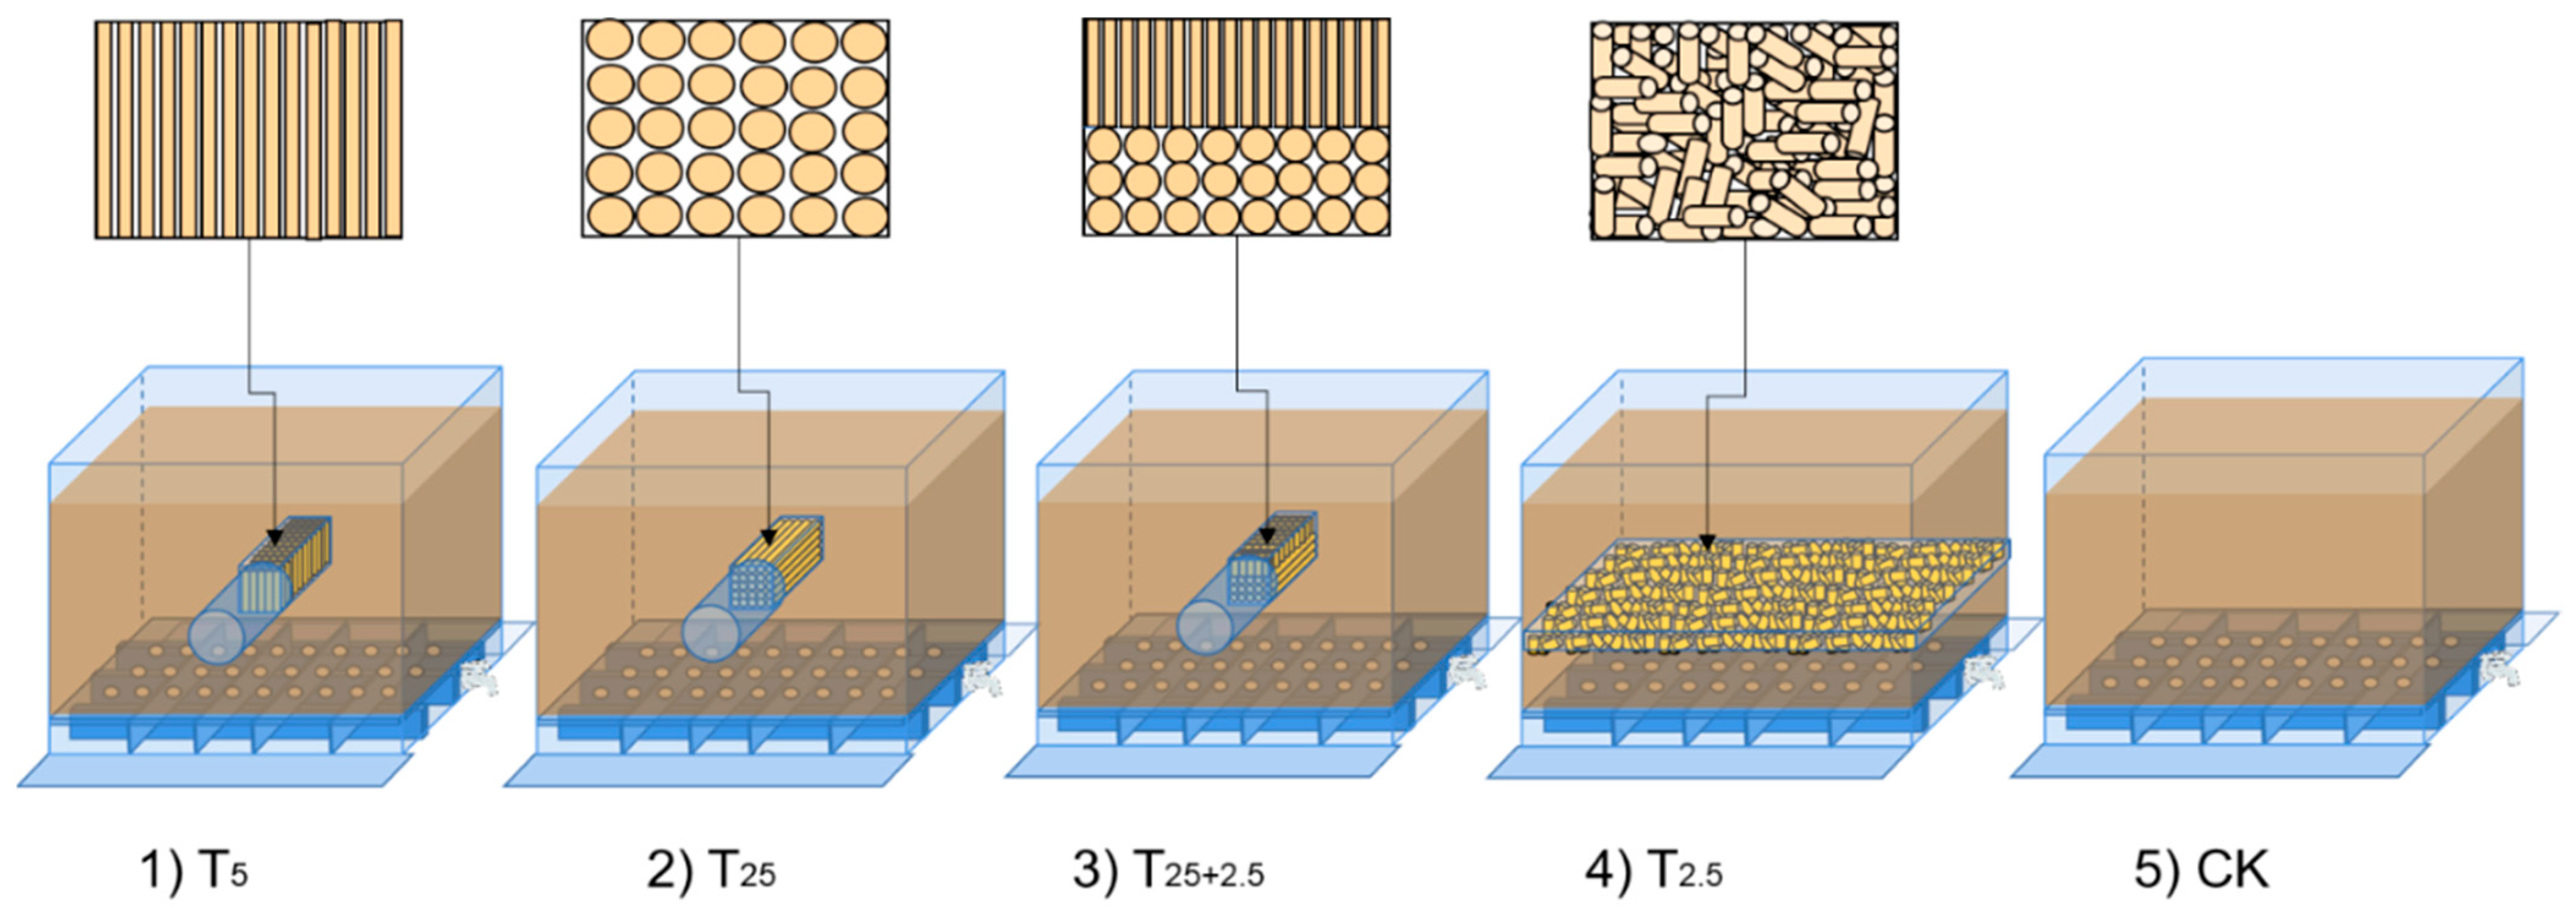
The experiments were conducted from August to February (2020–2021) at the water-saving irrigation laboratory in the College of Agricultural Science and Engineering, Hohai University Nanjing, Jiangsu Province, China. The soil texture in this experiment was salty sand with an EC1:5 of 3.0 mS cm−1 and was brought from the coastal area of Dongtai, Jiangsu Province. The concentrations of Ca2+, Mg2+, Na+, K+, CO32−, HCO3, Cl and SO42− in the saline soil with the EC1:5 value of 3.0 mS cm−1 were 2.58 mmol kg−1, 0.82 mmol kg−1, 70.02 mmol kg−1, 0.21 mmol kg−1, 2.32 mmol kg−1, 9.21 mmol kg−1, 84.31 mmol kg−1, and 3.58 mmol kg−1, respectively. The soil was evenly mixed and sifted using a 1 mm sieve, and put in the experimental tank in layers at an interval of 5 cm with bulk density of 1.40 g cm−3. The straw strips (or straw layer) used in this study were made of sorghum straw with a diameter of about 7 mm, made in Binzhou City, Shandong Province, and wrapped with two layers of non-woven fabric textile. A tank experiment was conducted to investigate the processes of wetting front, soil water and salt distribution, as well as salt leaching efficiency under different forms of straw strips (or straw layer). The height, width, and length of each tank were 44 cm, 47.7 cm, and 25 cm, respectively. The abutting gap between the original experimental tank and the newly added polymethyl methacrylate board was plugged with glass glue. Furthermore, triangular support made of steel was used to reinforce the upper edge of the soil trough. The schematic design of the soil tank is shown in Figure 1. To provide a smooth environment in the infiltration process, a perforated glass plate with a width of 47.7 cm and a length of 25 cm was laid at 3 cm away from the bottom of the soil tank to separate into upper and lower parts. The lower part of the soil tank was used for water leakage and water storage. The perforated glass plate holes were arranged at intervals of 10 cm. Two layers of 200 g geotextile were laid above the water storage diaphragm as filter layers to prevent soil loss in the tank.

2.2. Treatments

The following five treatments with straw stalks evenly laid at the 20–25 cm layer below the surface of the soil columns include the following: (1) no straw layer (CK); (2) 5 cm long straw stalks longitudinally arranged to form a straw strip with 10 cm in width, 25 cm in length, and 5 cm in height (T5); (3) 25 cm long straw stalks horizontally arranged to form a straw strip with 10 cm in width, 25 cm in length and 5 cm in height (T25); (4) 2.5 cm long straw stalks longitudinally arranged in the upper layer and 25 cm long straw stalks horizontally arranged in the lower layer to form a straw strip with 10 cm in width, 25 cm in length and 5 cm in height (T25+2.5); and (5) 2.5 cm long straw stalks randomly arranged to form a straw strip with 47.7 cm in width, 25 cm in length and 1.5 cm in height (T2.5). Each of the treatments were replicated three times. The specific schematic straw layer arrangement of each treatment is depicted in Figure 2.

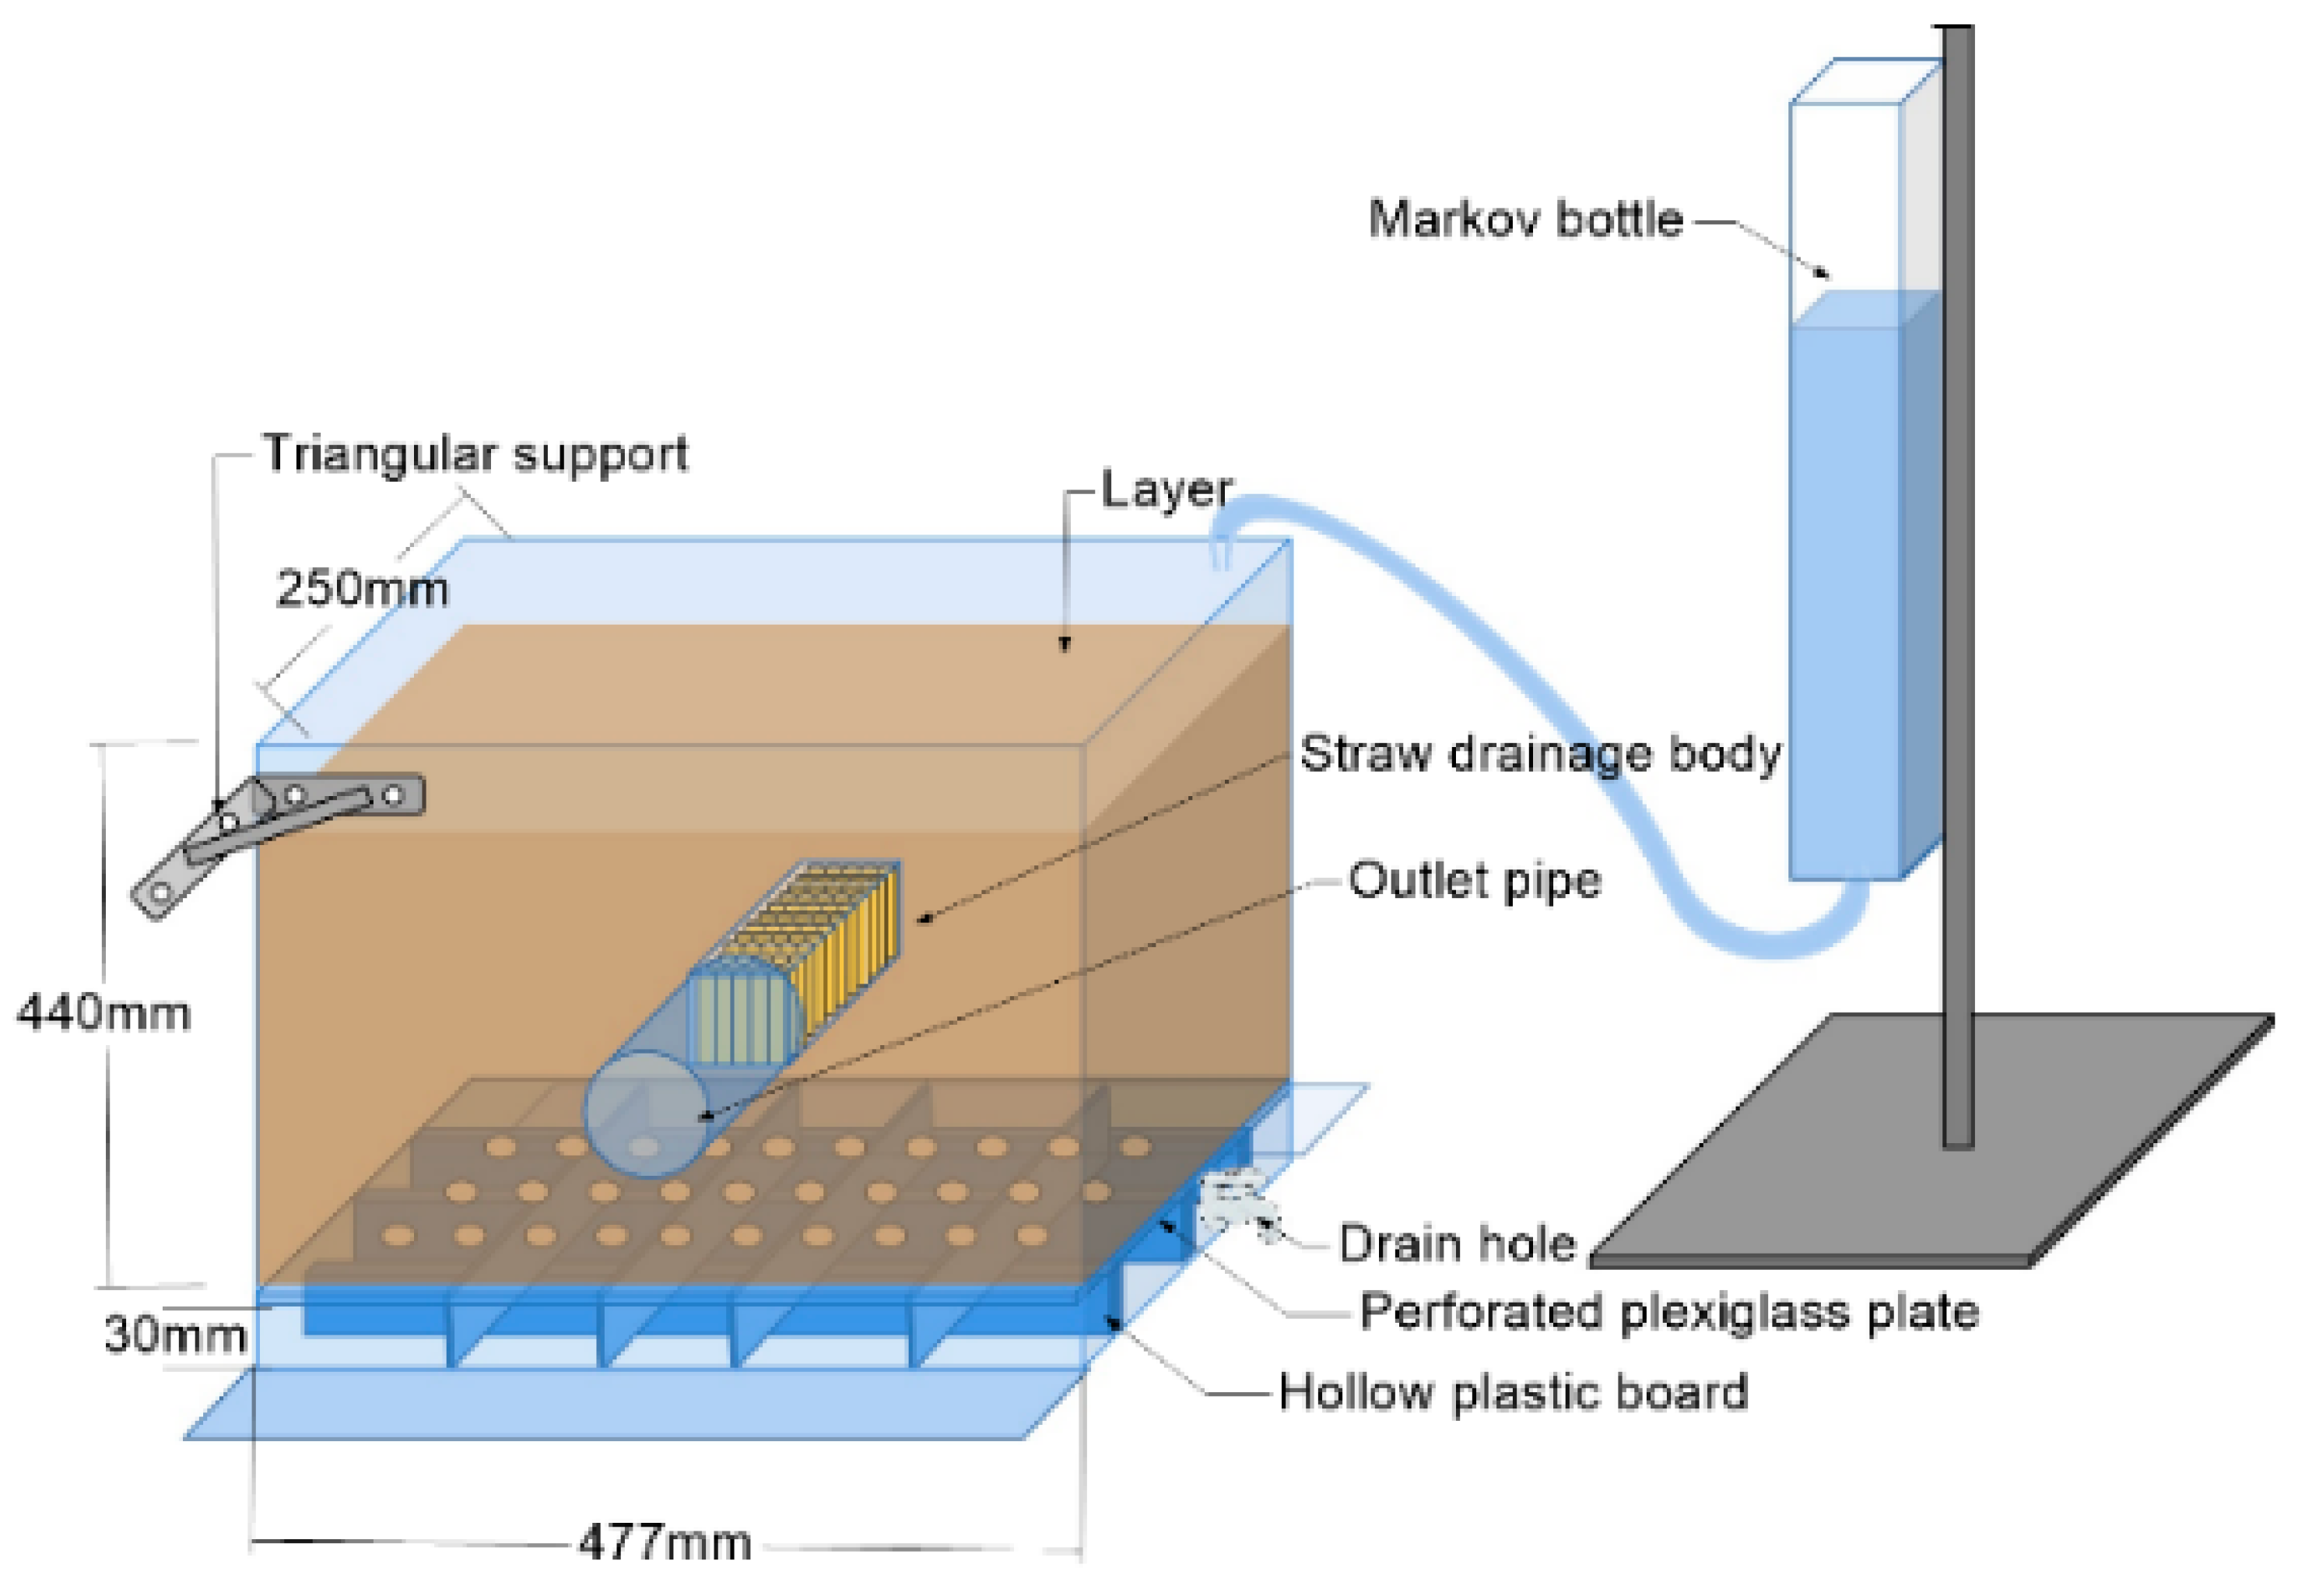
2.3. Experimental Process

2.3.1. Wetting Front

The wetting front is an important index that characterizes soil water movement. The wetting front movement in the soil profile and the wetting front shapes were recorded at 10 min, 20 min, 30 min, 45 min, 1 h, 3 h, 7 h, 24 h after the first irrigation, and 3 h, 6 h, 9 h and 24 h after the second irrigation. Wetting front lines were marked with a marker pen on the polyvinyl chloride film in front of the soil tank. Wetting front data were collected using the Get-Data Graph Digitizer software (version 2.25.0.32).

2.3.2. Irrigation Schedule

At the beginning of the first irrigation, 5937.5 mL of water was poured into the soil tank, and a 5 cm thick water layer was formed on the surface of the soil. Twenty-four hours later, 5937.5 mL of water was added, and about a 5 cm water layer was formed on the soil surface. Forty-eight hours later, 2385.5 mL of water was poured into the soil tank to make the water layer reach 2 cm. Following the above three steps of irrigation, Markov bottles were used to continuously supply water to the soil. The changes in water volumes within the Markov bottles were recorded. The experiment was finished when the water from the straws stably drained.

2.3.3. Soil Sampling Method

Soil samples were collected from each tank using an auger (2 cm diameter, 40 cm length) at 1 h, 3 h, 6 h, 10 h, 24 h, 48 h after the first irrigation as well as at the end of the experiment. Soil samples for measurements of water content and salt concentration from different layers (5–15 cm, 15–25 cm, and 25–35 cm soil layer, respectively) of the soil tank were collected through the sampling holes (10 cm, 20 cm, and 30 cm) horizontally away from the center of straw strips, as well as directly above them, respectively (Figure 3). After sampling, the sampling holes were backfilled with soil in a similar property to prevent the emergence of preferential flow.

2.3.4. The Measurement of Soil Water Content and EC Value

The soil moisture content was determined using an oven drying method. The soil samples obtained from the soil tank were weighed immediately to obtain the fresh soil sample weights. Then, they were placed in an oven at 105 °C for 24 h, and soil dry weights were recorded [29,30]. The EC1:5 of the naturally air-dried soil sample was determined by using EC-215 Multi-Range Conductivity Meter (HANNA Instruments, Padova, Italy) [31,32].

2.4. Calculations

Soil water content was calculated by applying the following equation:
  S W C % = S w S D S D × 100
where SWC represents the percentage of soil water content on a dry basis, SW is the soil sample wet weight, and SD means the soil sample dry weight.
The relationship between the EC1:5 values and salt contents was fitted with the following equation:
y = 3.0 x
where y is the salt content (g kg−1); x is the EC1:5 values (mS cm−1); the coefficient of determination (R2) was 0.98 (p < 0.01).
Salt storage was calculated according to Zhao et al. [21] as follows:
S S = A × D × H × S × 10 3
where SS is the soil salt storage (g), A is the soil column area (cm2), D is the soil bulk density (g cm−3), and S is the salt content after infiltration (g kg−1).
Soil desalination rate was calculated as:
P % = S B S A S B × 100
where P is the salt desalination rate (%), SB is the salt content before infiltration (g kg−1), and SA is the salt content after infiltration (g kg−1).
Salt leaching efficiency was determined by the following formula:
S L E = S S B S S A W + U 0 U 1 × T
where SLE is the salt leaching efficiency (g mm−1 h−1), SSB is the salt storage before infiltration (g), SSA is the salt storage after infiltration (g), W is the total irrigation amount (mm), U1 is the water storage after infiltration (mm), U0 is the initial water storage of the corresponding soil layer (mm), and T is the time for wetting front to reach the bottom layer (h).

2.5. Data Analysis and Statistics

An analysis of variance (ANOVA) was performed using SPSS software (version 18.0, SPSS Inc., Chicago, IL, USA) with the general linear model to test the effects of the treatments on the measured parameters with three replications. Mean comparisons were performed with Duncan’s multiple range test at p < 0.05. The distribution of water content and EC1:5 values were drawn by Surfer software (version 22.0, Golden Software Inc., Golden, CO, USA).

3. Results

3.1. Wetting Front

Temporal variations in wetting front shapes for different treatments were depicted in Figure 4. All the treatments exhibited similar temporal variations in the wetting front. Across treatments, the movement speed of the wetting front was faster at the beginning of the experiment, but gradually slowed down as irrigation time increased. The wetting front speed under T2.5 (treatment with straw layer) was significantly lower than that under the buried straw strips treatments (T5, T25, and T25+2.5). There was no significant difference in the migration speed among T25, T5, and T25+2.5. The wetting fronts took approximately 24 h to reach the upper surface of the straw layer (20 cm) under T25, T5, and T25+2.5 straw strip treatments and CK. In terms of the duration of time for wetting fronts passing through the straw layer or straw strips (20–25 cm), the straw layer treatment (T2.5) was significantly higher than the strip treatments (T5, T25, and T25+2.5), (p < 0.05), and it varied in the order of T2.5 > T25+2.5 > T25 > T5 (Table 1). After passing through the straw strip layers, the wetting front curves under T5, T25+2.5, and T25 exhibited similar inverted V‘‘ shapes, whereas those of CK and T2.5 showed fluctuating parallel lines (Figure 4). The time for the wetting front to move from the lower surface of the straw layer (25 cm) to the bottom of the soil column (35 cm) under T25+2.5, T25, and T5 straw strip treatments was significantly lower than in the CK treatment (p < 0.05, Figure 4).

3.2. Water and Salt Distribution during and after the Infiltration

3.2.1. Water Distribution across the Soil Layer

The distribution of soil water content in the soil profiles of various treatments was analyzed after 1 h, 24 h, and at the end of the experiment, respectively (Figure 5). After 1 h, for the 10 cm soil layer, there was no significant difference among the various treatments, and their soil water content was 25.5%. For the 20 cm soil layer, the soil water content under straw strip treatments (T25, T5, and T25+2.5) was significantly higher than the T2.5 and CK treatments (p < 0.05, Figure 5A). After 24 h, for the 10 cm soil layer, the soil water content under straw layer (T2.5) and straw strip treatments (T25, T5, and T25+2.5) was the most pronounced and varied in the order of T2.5 > T25+2.5 > T5 > T25 > CK. For the 20 cm soil layer, the soil water content under T2.5 treatment was 17.07%, and it was significantly higher than T25+2.5 treatment (9.14%) (p < 0.05). For the 30 cm soil layer, the soil water content under CK treatment (12.07%) was significantly higher than T5 treatment (6.65%) (p < 0.05, Figure 5B). At the end of the experiment, for the 10 cm soil layer, the soil water content under CK treatment (31.65%) was significantly higher than that of T25+2.5 treatment (25.3%) (p < 0.05). For the 20 cm soil layer, the soil water content under T2.5 treatment was higher than those of the other treatments and varied in the order of T2.5 >T25+2.5 > CK > T5 > T25. For the 30 cm soil layer, the soil water content under CK treatment (31.55%) was significantly higher than those of T25 and T5 treatments (28.12%) (p < 0.05, Figure 5C).

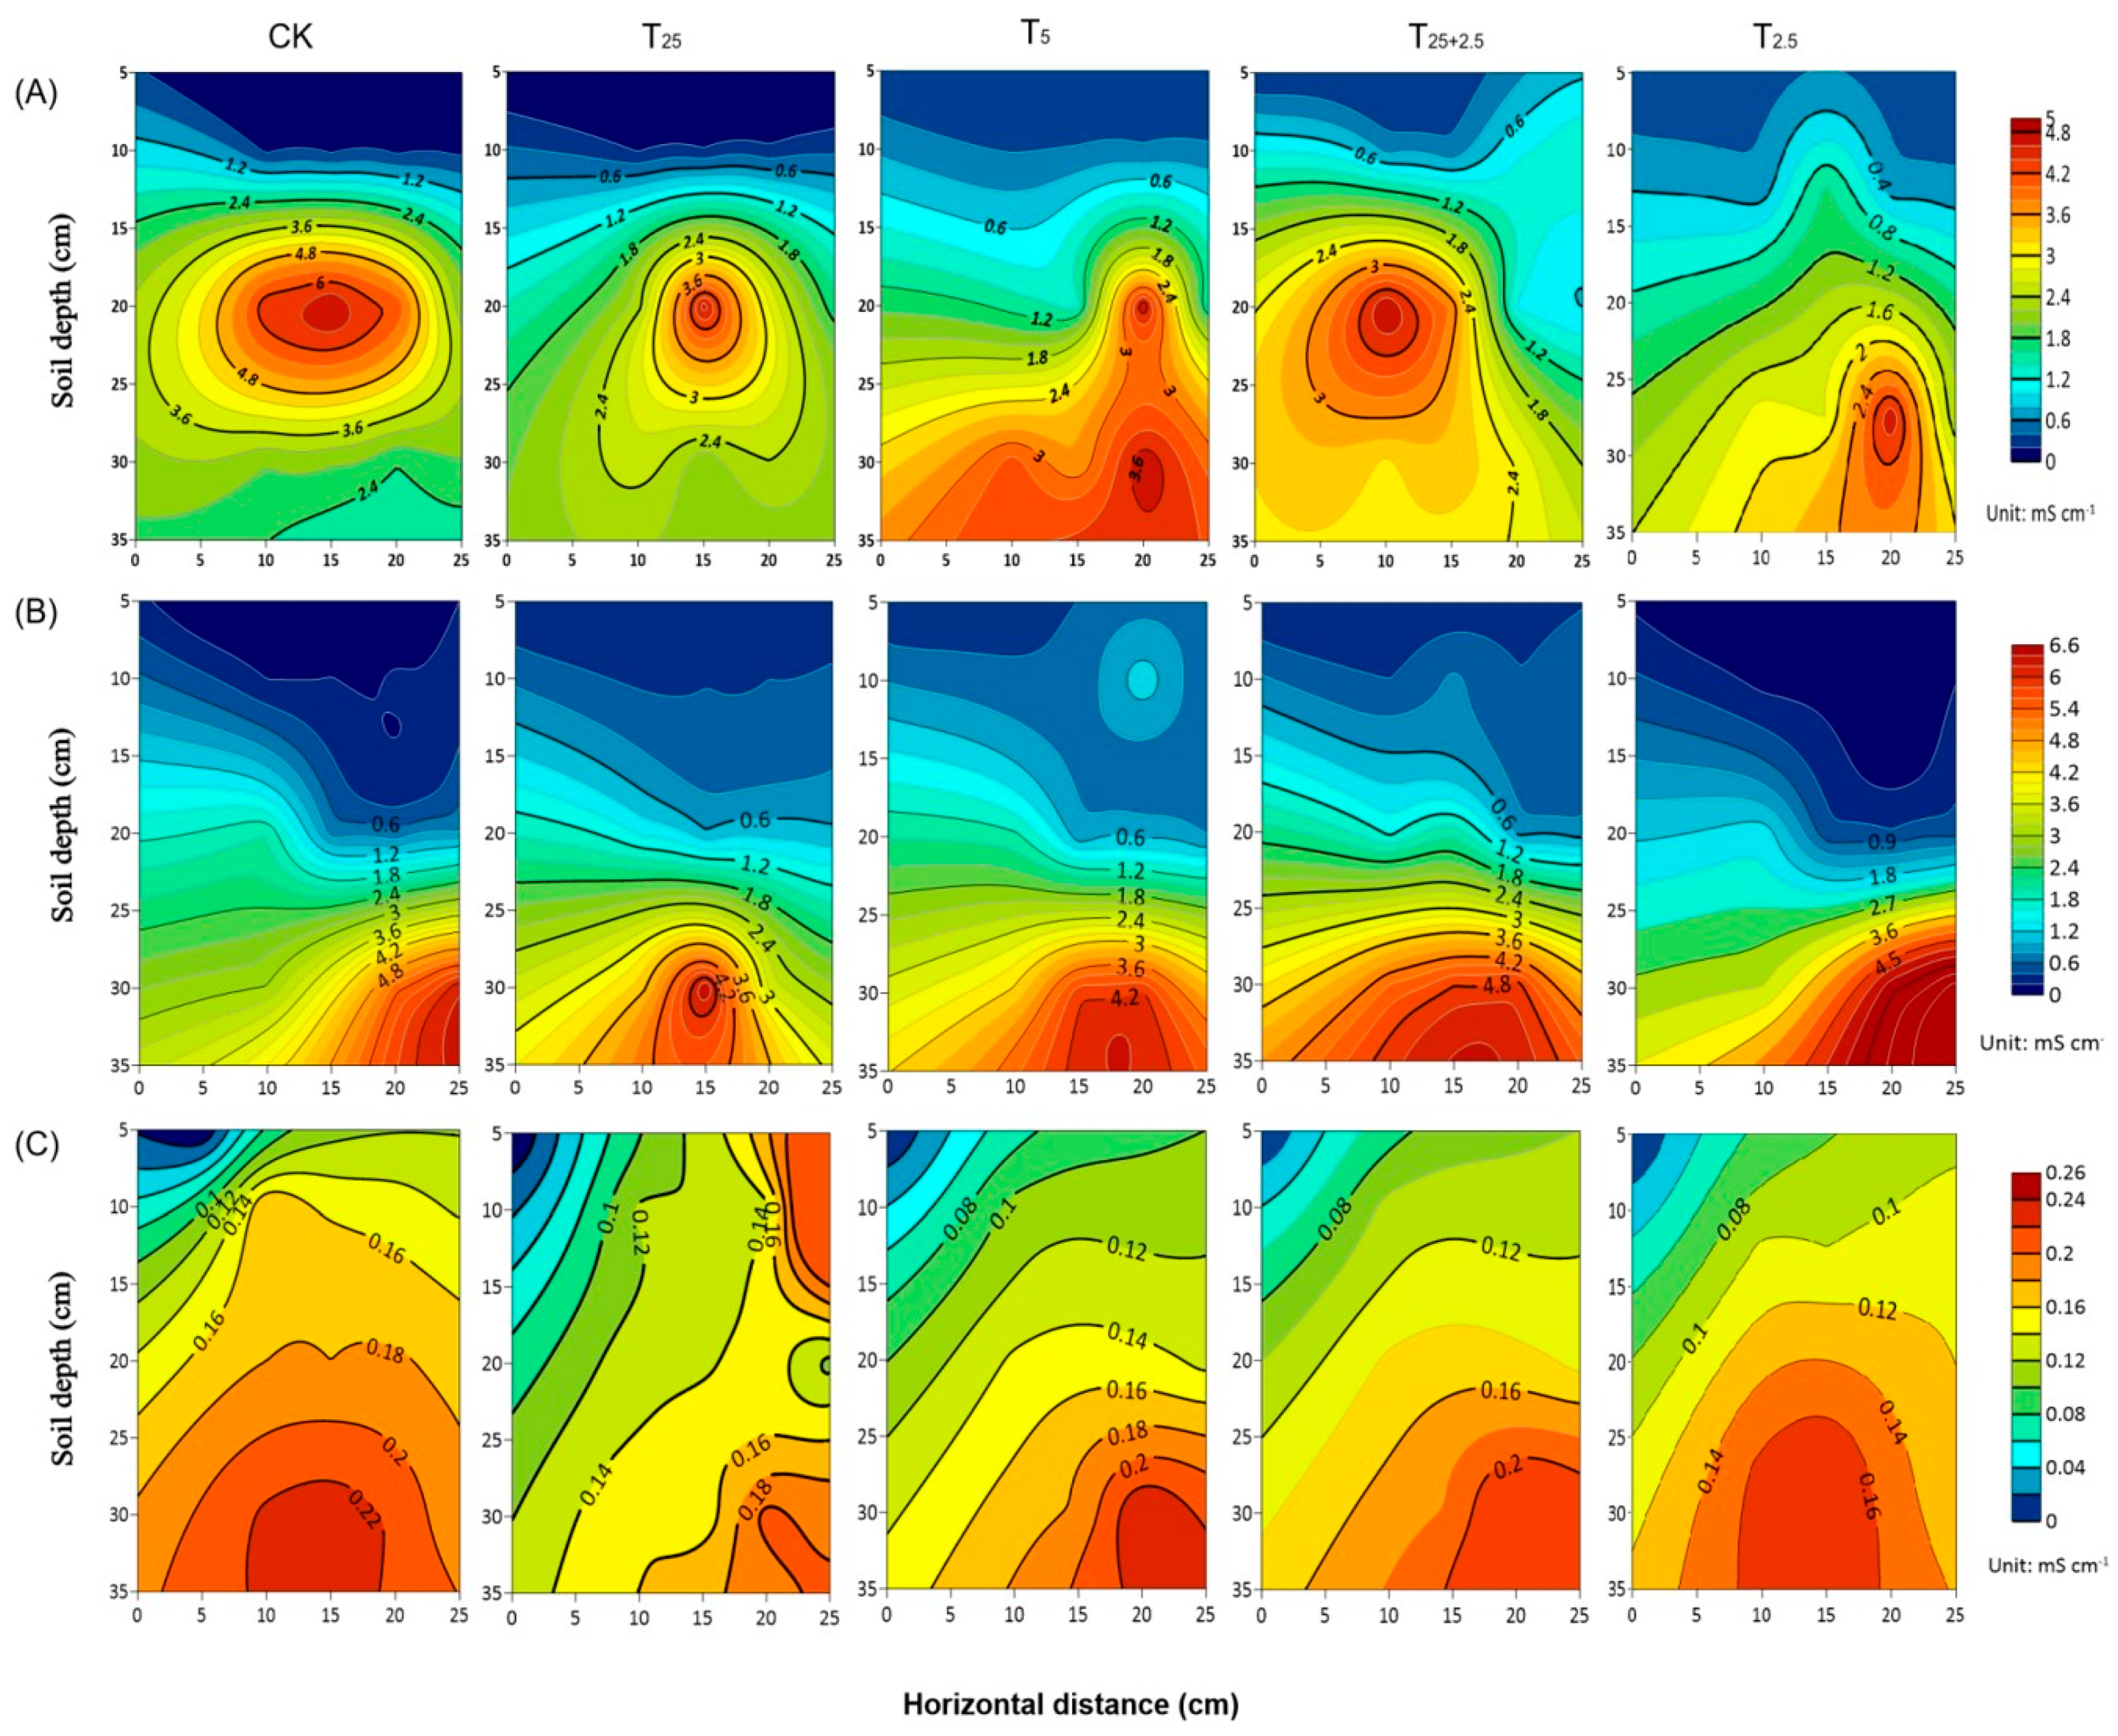
3.2.2. Salt Distribution (EC1:5) across the Soil Layer

The distribution of EC1:5 in the soil profiles of different treatments was analyzed after 1 h, 24 h, and at the end of the experiment, respectively (Figure 6). After 1 h, for the 10 cm soil layer, the EC1:5 value under the CK treatment (1.29 mS cm−1) was significantly higher than that under the T2.5 treatment (0.36 mS cm−1) (p < 0.05, Figure 6A). For the 20 cm soil layer, the EC1:5 value under the CK treatment (5.23 mS cm−1) was significantly higher than that of the T5 treatment (1.89 mS cm−1) (p < 0.05). For the 30 cm soil layer, the EC1:5 value of the T5 treatment (3.6 mS cm−1) was significantly higher than other treatments (p < 0.05). After 24 h, for the 10 cm soil layer, the EC1:5 value of the T2.5 treatment (0.2 mS cm−1) was lower than those of other treatments. For the 20 cm soil layer, the EC1:5 value of the CK treatment was 1.8 mS cm−1, and it was higher than the T2.5 treatment. For the 30 cm soil layer, the EC1:5 value of the straw strip treatments (T25, T5, and T25+2.5) was lower than that of the CK treatment (Figure 6B). At the end of the experiment, for the 10 cm soil layer, the EC1:5 value of the T5 treatment (0.08 mS cm−1) was significantly lower than that of the T25+2.5 treatment (0.4 mS cm−1) (p < 0.05). For the 20 cm soil layer, the average EC1:5 value of the T25+2.5 treatment was 1.6 mS cm−1, and it was significantly higher than that of the T25 treatment (0.13 mS cm−1) (p < 0.05). For the 30 cm soil layer, the EC1:5 value of the T25 treatment was 0.08 mS cm−1, and it was significantly lower than the T25+2.5 treatment (1.8 mS cm−1) (p < 0.05, Figure 6C).

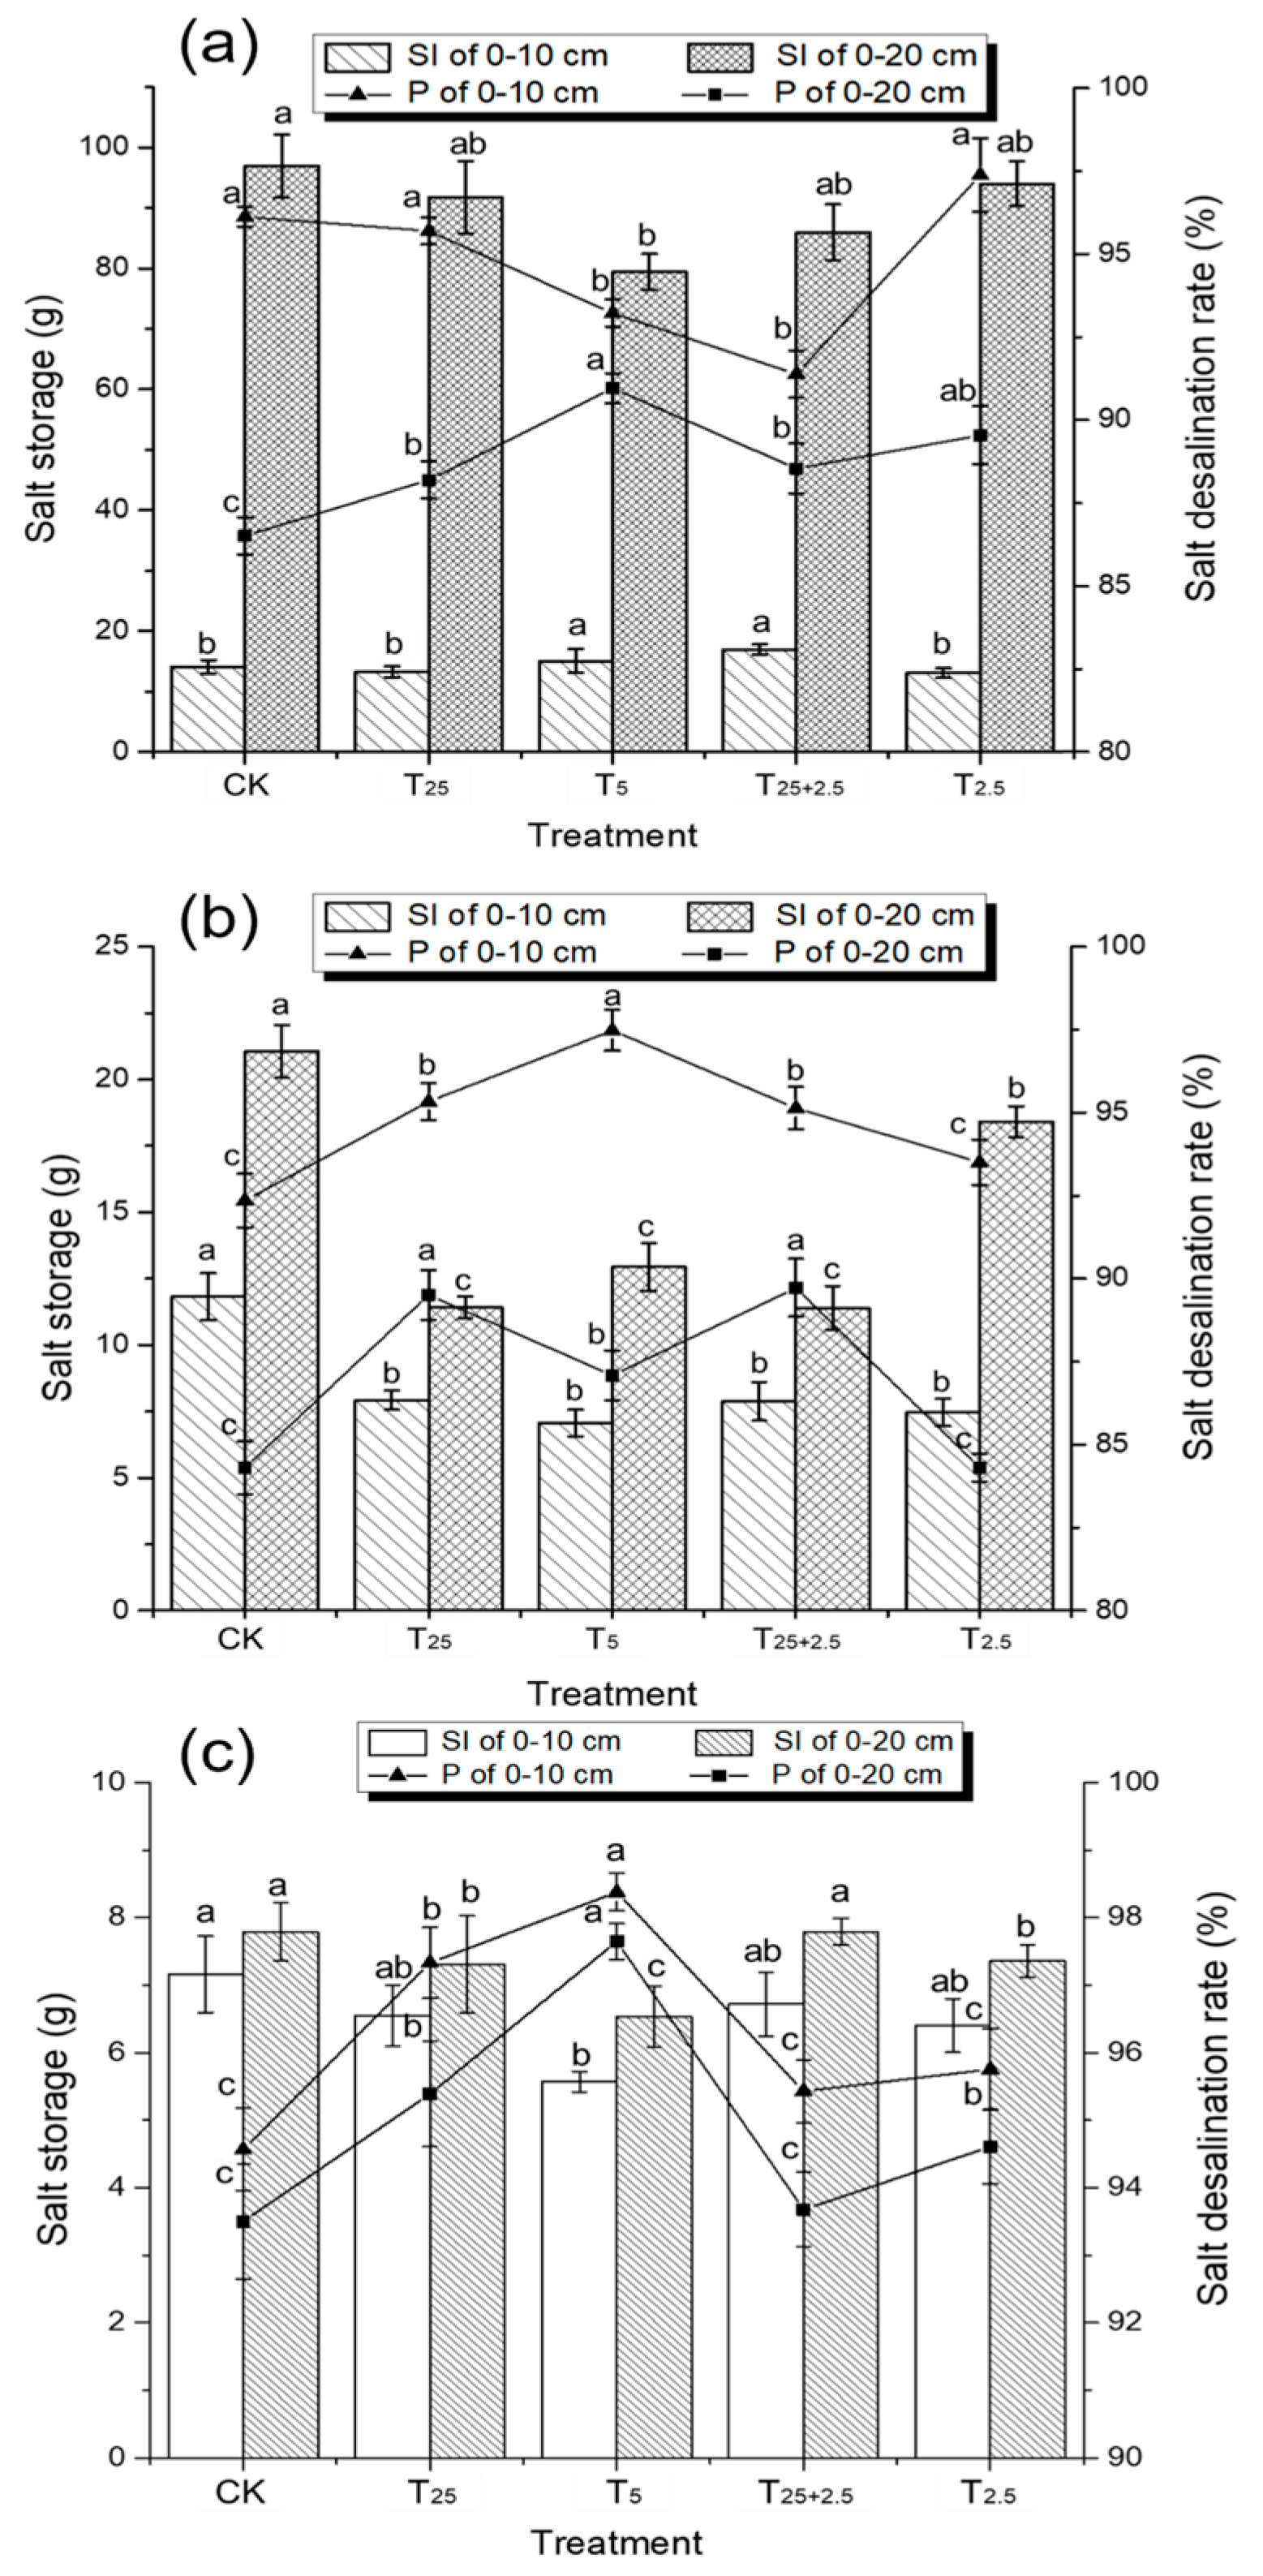
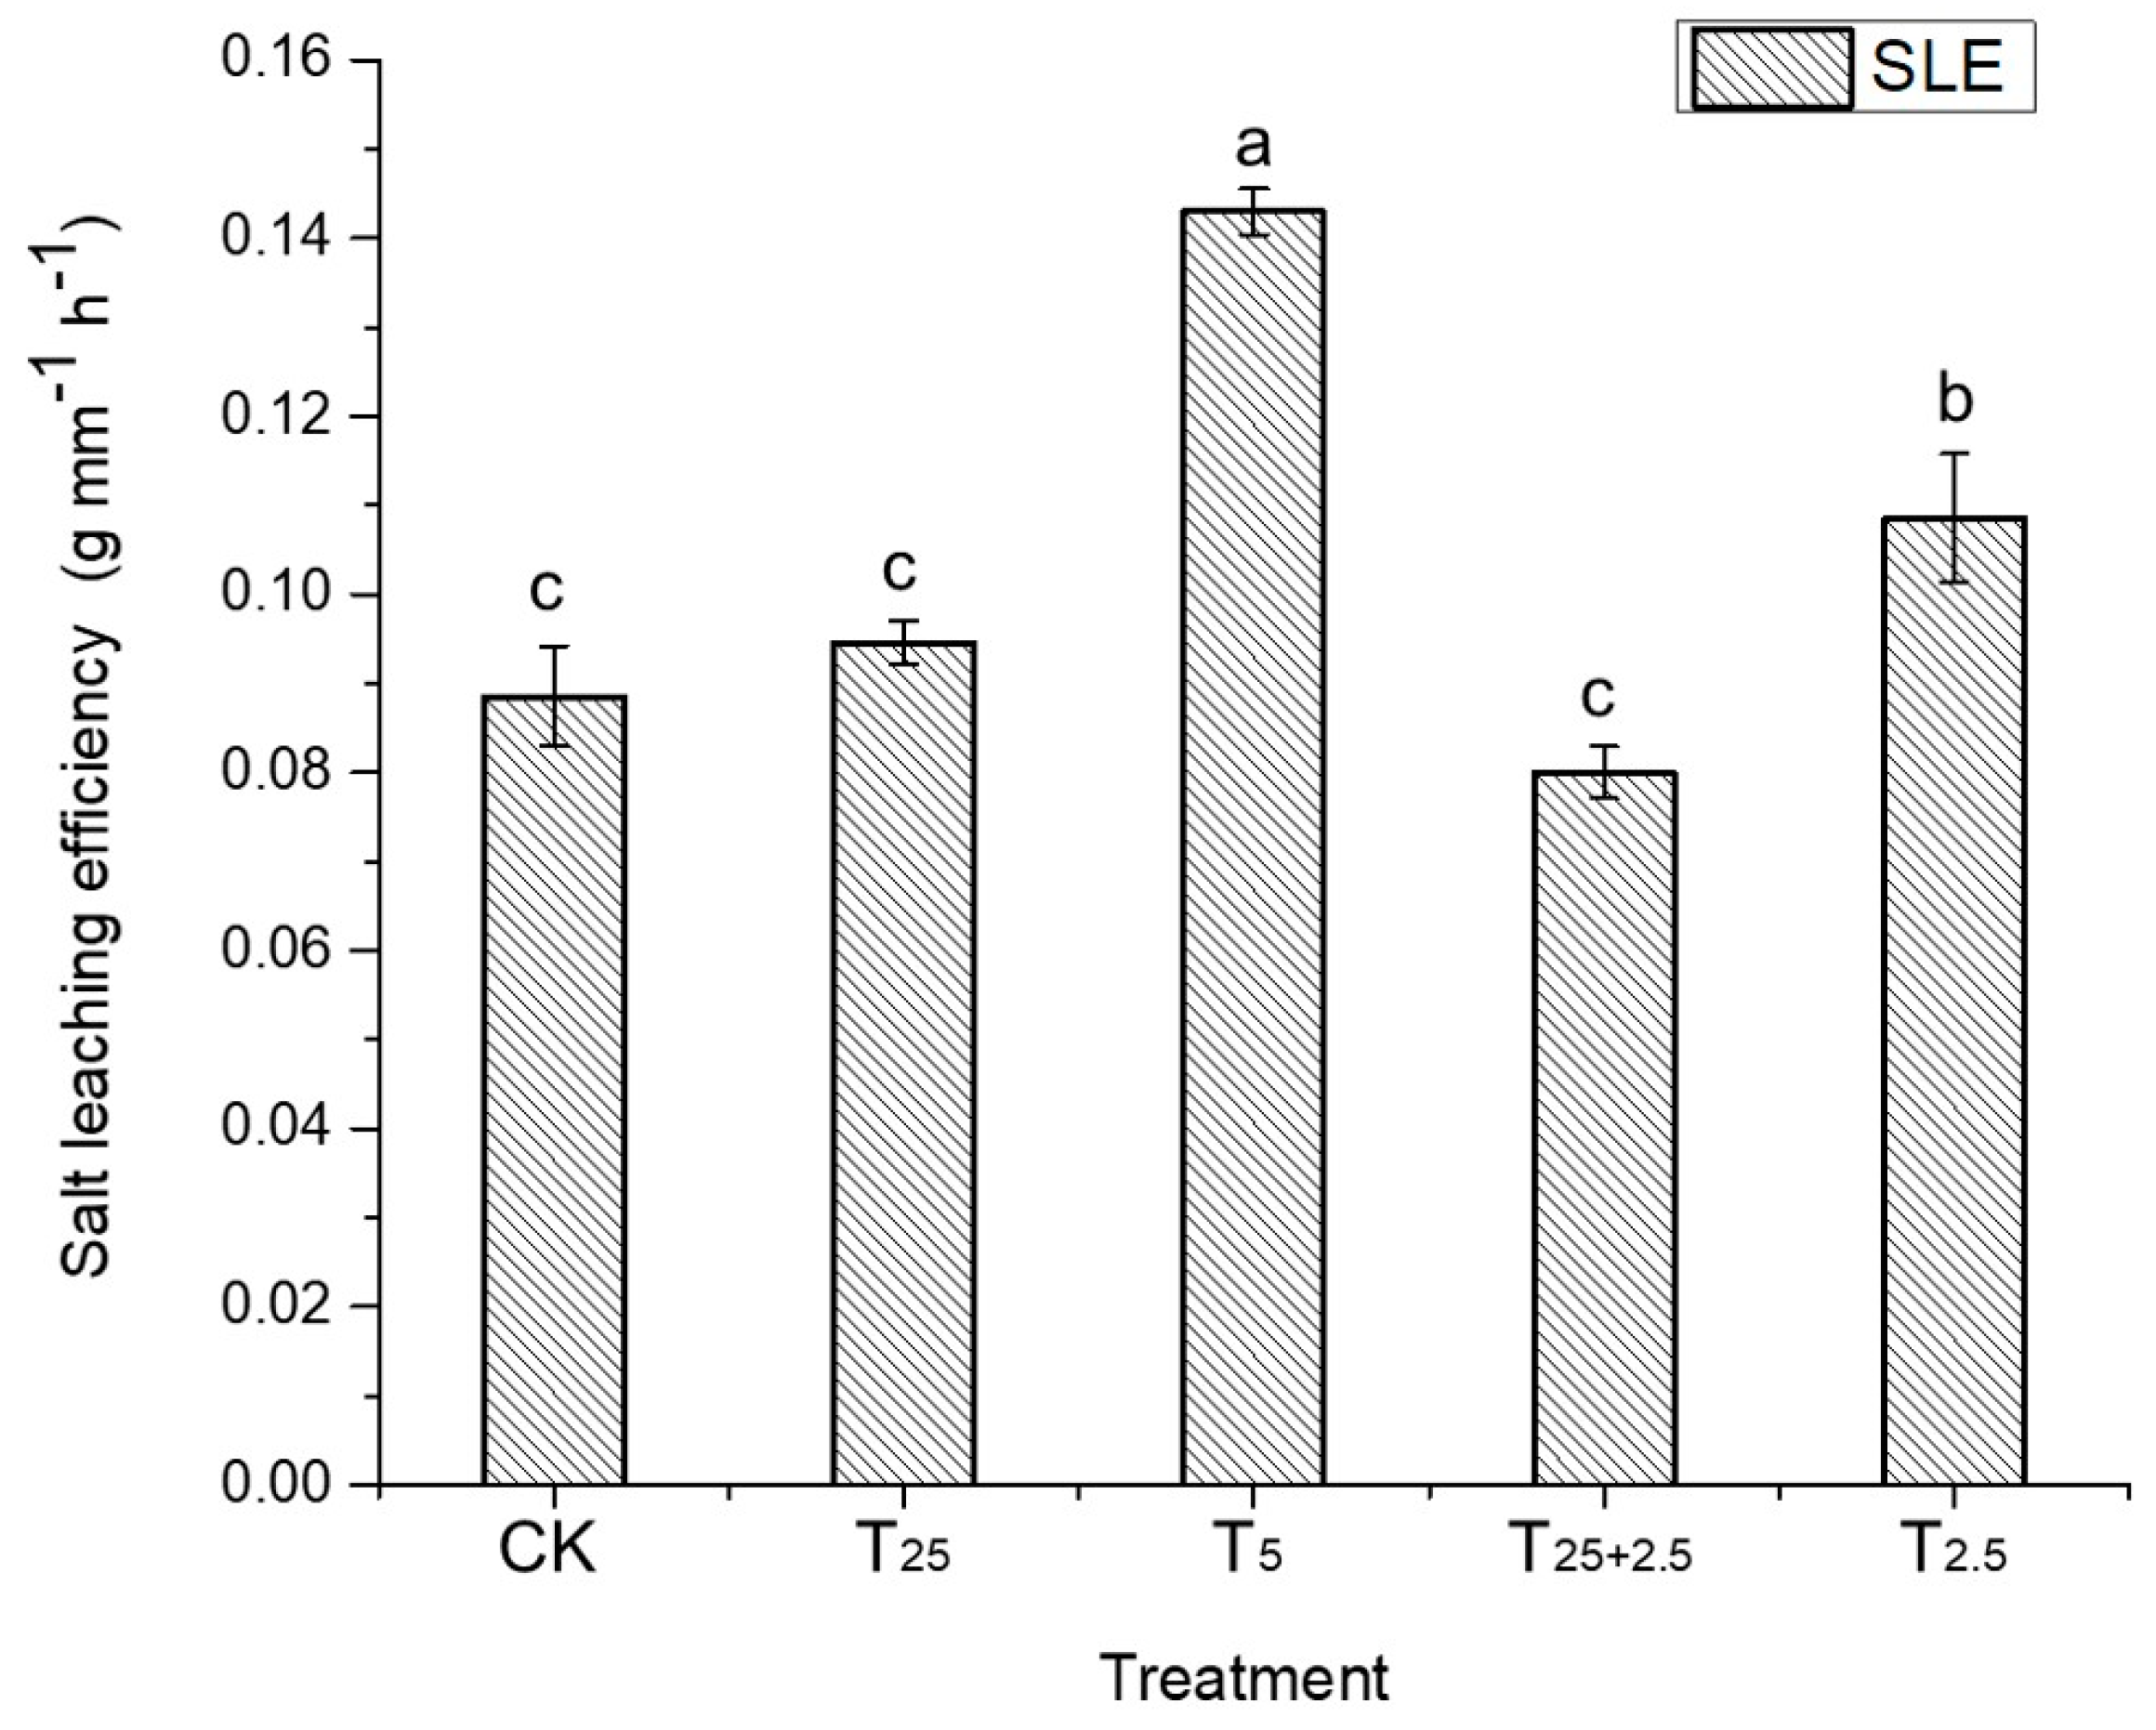
3.3. Analysis of Salt Desalination Rate and Leaching Efficiency under Different Treatments

Compared with CK, the straw strip treatments significantly reduced salt storage in the soil profile, and increased the salt leaching effect (p < 0.05) (Figure 7). After 24 h, salt storage (0–10 cm) under T25+2.5 and T5 (19.27 g) was significantly higher than T2.5 treatment (14.76 g). The variations in desalination rate followed the order of T2.5 (92.35%) > CK (91.10%) > T25 (90.67%) > T5 (87.11%) > T25+2.5 (86.37%) (Figure 7a). For the 0–20 cm soil layer, the salt storage under T5 was 79.23 g and it was lower than other treatments; the desalination rate under T5 (86.39%) was significantly higher than that of CK treatment (81.02%) (p < 0.05). After 48 h, the salt storage (0–10 cm) under T5 treatment (7.95 g) was lower than CK treatment (12.03 g); the desalination rate under T5 treatment (97.02%) was significantly higher than CK treatment (90.77%) (p < 0.05). For the 0–20 cm soil layer, the salt storage under CK was 21.56 g, and it was significantly higher than the T25+2.5 and T25 treatments (11.79 g) (p < 0.05), and the desalination rates varied in the order of T25+2.5 (89.72%) > T25 (89.51%) > T5 (87.08%) > T2.5 (84.12%) > CK (83.91%) (Figure 7b). At the end of the experiment, the salt storage (0–10 cm) under T5 treatment (5.64 g) was lower than CK treatment (7.23 g); the desalination rate under T5 treatment was 98.34% and it was significantly higher than that of the CK treatment (94.47%) (p < 0.05). For the 0–20 cm soil layer, the salt storage under the CK treatment was 7.94 g, and it was significantly higher than the T5 treatment (6.87 g); the desalination rate under T5 treatment (97.71%) was significantly higher than that of the T25+2.5 treatment (93.12%) (p < 0.05, Figure 7c).
In addition, at the end of experiment, the salt leaching efficiency (SLE) under T5 treatment was 0.143 g mm−1 h−1, and it was significantly higher than T25+2.5 treatment (0.0789 g mm−1 h−1) (p < 0.05; Figure 8).

4. Discussion

The problem of soil salinity is exacerbated by the irrigation with saline water and the utilization of uncultivable saline soils to fulfill the demand of a growing global population [33,34]. Straw mulching has been employed in agricultural production as a practical and efficient technique for mitigating salt accumulation and reducing soil water loss [35]. However, its extensive application in practice is impeded by the substantial requirement of excavation earthwork and straw materials. Compared to mulching the entire soil surface, narrowing the straw layer to a strip configuration can effectively reduce the requirements for earthwork excavation and straw materials. Additionally, straw strip mulching has the capacity to maintain soil moisture and improve the capillary blocking effect [36], thereby effectively preventing salt accumulation on the soil surface compared to the absence of mulching [18,24,37,38]. Despite the abundance of research on the effects of straw mulching on soil water and salt dynamics, there is a lack of information regarding water and salt distribution, as well as leaching efficiency in relation to different forms of straw strip configurations.

4.1. Wetting Front

The present study showed that the straw layer and straw strip treatments significantly reduced the advance of the wetting front and the infiltration rate during the wetting front crossing the whole soil profile (Figure 4), compared with CK (no straw layer or straw strips buried in the soil profile). The wetting fronts took approximately 56 h to reach the bottom of the soil profile for T25, T5, and T25+2.5 straw strip treatments, whereas those for CK took 51 h (Table 1). In agreement with this result, Zhang et al. [39] found that wetting front migration speed was significantly increased in the CK treatment (without straw layer) compared to straw layer treatments. This is because the addition of straw layers could introduce soil heterogeneity and create a discontinuous capillary at the soil interface, thereby causing a sudden change in matrix potential [20]. Therefore, when the soil profile and straw layer were dry, there was no effective hydraulic connection in the coarse-textured profiles (straw layer). Soil water reaching the upper surface of the straw layer did not immediately infiltrate downward but continued to do so only when the water above the straw layer accumulated to levels where the capillary break effect vanished [40,41].
Moreover, as shown in Table 1 and Figure 4, the time for wetting fronts passing through the straw layer or strips (20–25 cm) under the buried straw strip treatments (T5, T25, and T25+2.5) was significantly lower than that under the full-cover straw layer treatment (T2.5). The reason is that the T2.5 treatment, entirely covered with straw sticks in the 20–25 cm depth soil layer, allowed for better water absorption [39] and delayed transit through the straw layer compared to the partially laid straw strip treatments (T5, T25, and T25+2.5). Furthermore, as indicated by Meng et al. [42], water infiltration rates tended to decrease with the increase in the number of small pores. In agreement with this, in our experiment, the migration velocity of the wetting front for the straw layer (T2.5) was significantly lower than those of straw strip treatments (Table 1). This difference might be related to the varied number of small pores [43]. For the T2.5 treatment, the embedded straw layer randomly arranged with shorter stalks might result in an enhanced number of small pores compared to the embedded straw strips regularly arranged with longer stalks (Figure 2). During and after passing through the straw strip layers, the wetting front curves under T5, T25+2.5, and T25 showed similar inverted V‘‘ shapes, whereas those under CK displayed relatively straight parallel lines. In straw strip treatments, the hydraulic barrier effects’ caused by the straw strip could impede water infiltration into the deeper soil profile beneath the straw strip [40]. As a result, the soil profile not beneath the straw strip showed a relatively higher velocity of the wetting front, leading to the formation of inverted V‘‘ shapes. In the case of the CK treatment, the homogeneous hydraulic parameters of the same soil type along the horizontal direction resulted in a similar water infiltration rate into the deeper soil profiles, leading to the formation of relatively straight parallel lines of wetting fronts. Moreover, compared to CK, the wetting front lines for T2.5 during and after transitioning through the straw layer (or straw strips) showed much more severe fluctuations (Figure 4). This behavior might be related to the vertical heterogeneous structure of the straw layer. In this study, the buried straw layer could be considered a capillary barrier within the soil during infiltration. Due to the relatively higher soil water content in the fine-textured layer (soil profile) and the high-saturated hydraulic conductivity of the underlying coarse-textured layer (straw layer), water may infiltrate into the coarse-textured layer through preferential flow pathways, especially in the presence of minor inequalities in soil structure or disturbances in the straw layer [40]. This led to the instability of the capillary barriers, consequently presenting a fluctuating state for wetting front lines.

4.2. Water and Salt Distribution

The buried straw strip not only changed water infiltration rate, but also affected the distribution of soil water content (Figure 5) as well as EC values (Figure 6) in the soil profile [44,45]. After 24 h, compared with CK, the soil water content under straw strip treatments (T5, T25 and T25+2.5) and straw layer treatments (T2.5) was significantly higher in the 0–20 cm soil layer (Figure 5). Moreover, the average salt contents under T2.5 treatment was significantly lower than those of straw strip treatments in the 0–35 cm soil layer (Figure 6, p < 0.05). In agreement with our results, Xu et al. [46] indicated that, compared with CK, straw layer treatment made a longer retention time of wetting front and higher water content in the upper soil layer. Similarly, Zhao et al. [18] demonstrated that situating the straw layer with phosphor-gypsum in the 0–30 cm soil layer increased the water-holding time of the soil above the isolation layer. The phenomenon might be due to the capillary barrier effects and the hydraulic barrier effects caused by the embedding straw layer or straw strips in the soil profiles [39]. Under such circumstances, compared with CK, more salt could be discharged in the straw layers and straw strip treatments, because of the promotion for the exchange and absorption of soluble salt ions in the soil profile [47]. In the same soil depth, the distribution of soil water content and EC1:5 values also varied with treatments (Figure 5 and Figure 6). For example, compared with straw strip treatments, CK and straw layer treatment (T2.5) showed much more uniform soil water content and EC1:5 distribution. This is because, for the CK and T2.5, beneath the soil profile, there was no straw layer or it was fully covered with a straw layer, whereas for the straw strip treatments, the uneven displacement of straw in the soil profile would result in the heterogeneous physical properties of the soil profile in the horizontal direction (Figure 5 and Figure 6), ultimately influencing water flow and solute transport in soil profiles [48].

4.3. Salt Leaching Efficiency

Salt leaching efficiency is related to the soil and straw properties, such as structure and texture [49,50]. At the end of our experiment, we observed that T5 had remarkably higher values of SLE than those of T2.5, owing to the significantly lower salt concentration and shorter leaching time for T5 compared with T2.5 (Figure 8). Moreover, among the different arrangements of the straw strip treatments (T25, T5, and T25+2.5) and CK, T2.5 had the significantly highest salt leaching efficiency. Considering that the time for the wetting front to reach the bottom of the soil tank for all the straw strip treatments was almost the same (Table 1), the significantly higher values of T5 were mainly related to the significantly lower salt concentration. This indicated that the arrangement of the straw segments in T5 that formed parallel vertical gaps between the straw segments may benefit the leaching of solute salt compared with T25, where parallel horizontal gaps were formed, as well as T25+2.5, where a combination of vertical gaps in the top layer and horizontal gaps in the lower layer was formed. Taking into consideration the lower cost of raw materials, as well as the convenience of production [51], T5 has the potential for wide application in actual production, whereas in the future, the effects of impeding the upward movement of soil water and solute content by different straw layer treatments should also be considered in actual applications.

5. Conclusions

The current study investigated the appropriate forms of the straw strips (or layers) for the optimal regulation of soil water and salinity in the coastal saline soil. The experimental results showed that the straw layer (or straw strip) treatments changed spatial distribution patterns of water and salt in the soil profile, and enhanced salt leaching efficiency compared with CK. Our results showed the following:
  • At the end of the experiment, the average water content (0–20 cm) under the straw layer (T2.5) was significantly higher than the CK treatment. Compared with CK, the salt content under straw strip treatments (T25, T5, and T25+2.5) and the straw layer (T2.5) were significantly lower in the 0–20 cm soil layer.
  • Among the straw layer (or straw strip) treatments, the T5 and T2.5 treatments showed higher desalination rates and salt leaching efficiency in the 0–20 cm soil layer than T25 and T25+2.5 treatments.
  • T5 treatment can be arranged more easily in actual production and showed a shorter infiltration time for irrigation water, as well as higher salt leaching efficiency in the 0–20 cm soil layer than the other straw treatments. Therefore, T5 is recommended as the optimal treatment compared to others.
The findings can serve as a foundation for strategy formulation aimed at enhancing soil quality, optimizing salt leaching efficiency, and alleviating the impact of salinity on crop production.

Author Contributions

All authors contributed to the study conception and design. Conceptualization: Z.W., Q.L. and U.M.; methodology: Z.W., U.M. and Q.L.; formal analysis and investigation: M.T., X.Q., J.L., Y.W. (Yuexiong Wang), Y.F., K.C., S.C. and C.H.; writing—original draft preparation: U.M., Z.W. and Q.L.; writing—review and editing: Z.W. and Q.L. and Y.W. (Yaosheng Wang); supervision: Z.W. and Q.L. All authors have read and agreed to the published version of the manuscript.

Funding

This study was funded by the National Natural Science Foundation of China (52079041, 52109052).

Institutional Review Board Statement

Not applicable.

Data Availability Statement

The data used to support the findings of this study are available from the corresponding author upon request.

Conflicts of Interest

The authors declare no conflicts of interest.

References

  1. Alotaibi, M.M.; Aljuaid, A.; Alsudays, I.M.; Aloufi, A.S.; AlBalawi, A.N.; Alasmari, A.; Alghanem, S.M.S.; Albalawi, B.F.; Alwutayd, K.M.; Gharib, H.S.; et al. Effect of Bio-Fertilizer Application on Agronomic Traits, Yield, and Nutrient Uptake of Barley (Hordeum vulgare) in Saline Soil. Plants 2024, 13, 951. [Google Scholar] [CrossRef] [PubMed]
  2. Qi, J.; Sun, K.; Pan, Y.; Hu, Q.; Zhao, Y. Effect of Ridging Shapes on the Water–Salt Spatial Distribution of Coastal Saline Soil. Water 2023, 15, 2999. [Google Scholar] [CrossRef]
  3. Amerian, M.; Palangi, A.; Gohari, G.; Ntatsi, G. Enhancing salinity tolerance in cucumber through Selenium biofortification and grafting. BMC Plant Biol. 2024, 24, 24. [Google Scholar] [CrossRef] [PubMed]
  4. FAO. Global Map of Salt Affected Soils Version 1.0. 2021. Available online: https://www.fao.org/soils-portal/data-hub/soil-maps-and-databases/global-map-of-salt-affected-soils/en (accessed on 10 May 2024).
  5. Li, J.; Pu, L.; Han, M.; Zhu, M.; Zhang, R.; Xiang, Y. Soil salinization research in China: Advances and prospects. J. Geogr. Sci. 2014, 24, 943–960. [Google Scholar] [CrossRef]
  6. Guo, J.; Du, M.; Lu, C.; Wang, B. Use of Salt-Tolerant Plants and Halophytes as Potential Crops in Saline Soils in China. World J. Agric. Soil Sci. 2020, 5. [Google Scholar] [CrossRef]
  7. Zhou, J.; Miao, Y.; Guo, L.; Zhang, T.; Nie, Z.; Luo, X.; Yang, F.; Wang, Z. Evaluating the Enzyme Activities and Soil Physicochemical Properties of Four Typical Halophytic Communities in Saline-Sodic Soil. Agronomy 2024, 14, 141. [Google Scholar] [CrossRef]
  8. Chen, S.; Zhang, Z.; Wang, Z.; Guo, X.; Liu, M.; Hamoud, Y.A.; Zheng, J.; Qiu, R. Effects of uneven vertical distribution of soil salinity under a buried straw layer on the growth, fruit yield, and fruit quality of tomato plants. Sci. Hortic. 2016, 203, 131–142. [Google Scholar] [CrossRef]
  9. Wang, J.; Huang, X.; Zhong, T.; Chen, Z. Climate change impacts and adaptation for saline agriculture in north Jiangsu Province, China. Environ. Sci. Policy 2013, 25, 83–93. [Google Scholar] [CrossRef]
  10. Nan, J.; Chen, X.; Wang, X.; Lashari, M.S.; Wang, Y.; Guo, Z.; Du, Z. Effects of applying flue gas desulfurization gypsum and humic acid on soil physicochemical properties and rapeseed yield of a saline-sodic cropland in the eastern coastal area of China. J. Soils Sediments 2016, 16, 38–50. [Google Scholar] [CrossRef]
  11. Lu, P.; Zhang, Z.; Sheng, Z.; Huang, M.; Zhang, Z. Effect of surface straw incorporation rate on water–salt balance and maize yield in soil subject to secondary salinization with brackish water irrigation. Agronomy 2019, 9, 341. [Google Scholar] [CrossRef]
  12. Sun, Y.P.; Yang, J.S.; Yao, R.J.; Chen, X.B.; Wang, X.P. Biochar and fulvic acid amendments mitigate negative effects of coastal saline soil and improve crop yields in a three year field trial. Sci. Rep. 2020, 10, 8946. [Google Scholar] [CrossRef]
  13. Song, X.; Sun, R.; Chen, W.; Wang, M. Effects of surface straw mulching and buried straw layer on soil water content and salinity dynamics in saline soils. Can. J. Soil Sci. 2020, 100, 58–68. [Google Scholar] [CrossRef]
  14. Du, C.; Li, L.; Effah, Z. Effects of Straw Mulching and Reduced Tillage on Crop Production and Environment: A Review. Water 2022, 14, 2471. [Google Scholar] [CrossRef]
  15. Li, M.; Wang, W.; Wang, X.; Yao, C.; Wang, Y.; Wang, Z.; Zhou, W.; Chen, E.; Chen, W. Effect of Straw Mulching and Deep Burial Mode on Water and Salt Transport Regularity in Saline Soils. Water 2023, 15, 3227. [Google Scholar] [CrossRef]
  16. Wang, X.; Jia, Z.; Liang, L.; Zhao, Y.; Yang, B.; Ding, R.; Wang, J.; Nie, J. Changes in soil characteristics and maize yield under straw returning system in dryland farming. Field Crops Res. 2018, 218, 11–17. [Google Scholar] [CrossRef]
  17. Sarker, K.K.; Kamar, S.S.A.; Hossain, M.A.; Mainuddin, M.; Bell, R.W.; Barrett-Lennard, E.G.; Gaydon, D.; Glover, M.; Saha, R.R.; Rashid, M.H.; et al. Effect of Straw Mulch and Irrigation on Sunflower and Maize Cultivation in No Tillage Systems of Coastal Heavy Soils. Proceedings 2019, 36, 145. [Google Scholar] [CrossRef]
  18. Zhao, Y.; Li, Y.; Wang, J.; Pang, H.; Li, Y. Buried straw layer plus plastic mulching reduces soil salinity and increases sunflower yield in saline soils. Soil Tillage Res. 2016, 155, 363–370. [Google Scholar] [CrossRef]
  19. Huo, L.; Pang, H.; Zhao, Y.; Wang, J.; Lu, C.; Li, Y. Buried straw layer plus plastic mulching improves soil organic carbon fractions in an arid saline soil from Northwest China. Soil Tillage Res. 2017, 165, 286–293. [Google Scholar] [CrossRef]
  20. Cao, J.; Liu, C.; Zhang, W.; Guo, Y. Effect of integrating straw into agricultural soils on soil infiltration and evaporation. Water Sci. Technol. 2012, 65, 2213–2218. [Google Scholar] [CrossRef]
  21. Zhao, Y.; Li, Y.; Hu, X.; Wang, J.; Pang, H. Effects of plastic mulching and deep burial of straw on dynamics of soil water and salt in micro-plot field cultivation. Acta Pedol. Sin. 2013, 50, 1129–1137. [Google Scholar] [CrossRef]
  22. Zhang, J.X. Study on the Effect of Straw Mulching on Farmland Soil Water. J. Environ. Public Health 2022, 2022, 3101880. [Google Scholar] [CrossRef] [PubMed]
  23. Chang, L.; Han, F.; Han, F.; Chai, S.; Cheng, H.; Yang, D.; Chen, Y. Straw strip mulching affects soil moisture and temperature for potato yield in semiarid regions. Agron. J. 2019, 112, 1126–1139. [Google Scholar] [CrossRef]
  24. Chai, Y.; Chai, Q.; Li, R.; Li, Y.; Yang, C.; Cheng, H.; Chang, L.; Chai, S. Straw strip mulching in a semiarid rainfed agroecosystem achieves winter wheat yields similar to those of full plastic mulching by optimizing the soil hydrothermal regime. Crop J. 2022, 10, 879–892. [Google Scholar] [CrossRef]
  25. Huang, C.; Wu, Y.; Ye, Y.; Li, Y.; Ma, J.; Ma, J.; Yan, J.; Chang, L.; Wang, Z.; Wang, Y.; et al. Straw Strip Mulching Increases Winter Wheat Yield by Optimizing Water Consumption Characteristics in a Semi-Arid Environment. Water 2022, 14, 1894. [Google Scholar] [CrossRef]
  26. Chen, Y.; Chai, S.; Tian, H.; Chai, Y.; Li, Y.; Chang, L.; Cheng, H. Straw strips mulch on furrows improves water use efficiency and yield of potato in a rainfed semiarid area. Agric. Water Manag. 2019, 211, 142–151. [Google Scholar] [CrossRef]
  27. Lan, X.; Chai, S.; Coulter, J.A.; Cheng, H.; Chang, L.; Huang, C.; Li, R.; Chai, Y.; Li, Y.; Ma, J.; et al. Maize straw strip mulching as a replacement for plastic film mulching in maize production in a semiarid region. Sustainability 2020, 12, 6273. [Google Scholar] [CrossRef]
  28. Lu, P.; Zhang, Z.; Sheng, Z.; Huang, M.; Zhang, Z. Assess effectiveness of salt removal by a subsurface drainage with bundled crop straws in coastal saline soil using HYDRUS-3D. Water 2019, 11, 943. [Google Scholar] [CrossRef]
  29. Pansu, M.; Gautheyrou, J. Water Content and Loss on Ignition, Handbook of Soil Analysis. Mineralogical, Organic and 470 Inorganic Methods; Springer: Berlin/Heidelberg, Germany, 2006; pp. 3–13. [Google Scholar] [CrossRef]
  30. Dane, J.H.; Topp, G.C. (Eds.) Methods of Soil Analysis, Part 4-Physical 494 Methods; Soil Science Society of America: Madison, WI, USA, 2002; pp. 417–545. [Google Scholar] [CrossRef]
  31. United States Department of Agriculture (USDA). Diagnoses and Improvement of Saline and Alkali Soils; Agriculture Handbook No. 60; United States Department of Agriculture: Washington, DC, USA, 1954. Available online: https://acsess.onlinelibrary.wiley.com/doi/abs/10.2136/sssaj1954.03615995001800030032x (accessed on 10 May 2024).
  32. He, Y.; DeSutter, T.; Prunty, L.; Hopkins, D.; Jia, X.; Wysocki, D. Evaluation of 1:5 soil to water extract electrical conductivity methods. Geoderma 2012, 185–186, 12–17. [Google Scholar] [CrossRef]
  33. Jiang, S.Q.; Yu, Y.N.; Gao, R.W.; Wang, H.; Zhang, J.; Li, R.; Long, X.H.; Shen, Q.R.; Chen, W.; Cai, F. High-throughput absolute quantification sequencing reveals the effect of different fertilizer applications on bacterial community in a tomato cultivated coastal saline soil. Sci. Total Environ. 2019, 687, 601–609. [Google Scholar] [CrossRef]
  34. Ashkan, Y.; Ahmad, F.; Milad, A. The effects of shallow saline groundwater on evaporation, soil moisture, and temperature distribution in the presence of straw mulch. Hydrol. Res. 2020, 51, 720–738. [Google Scholar] [CrossRef]
  35. Rahma, A.E.; Wang, W.; Tang, Z.; Lei, T.; Warrington, D.N.; Zhao, J. Straw mulch can induce greater soil losses from loess slopes than no mulch under extreme rainfall conditions. Agric. For. Meteorol. 2017, 232, 141–151. [Google Scholar] [CrossRef]
  36. Li, Y.; Pang, H.; Han, F.; Yan, S.; Zhao, Y.; Wang, J.; Zhai, Z.; Zhang, J. Buried straw layer and plastic mulching increase microflora diversity in salinized soil. J. Integr. Agric. 2016, 15, 1602–1611. [Google Scholar] [CrossRef]
  37. Meyer, M.; Diehl, D.; Schaumann, G.E.; Muñoz, K. Multiannual soil mulching in agriculture: Analysis of biogeochemical soil processes under plastic and straw mulches in a 3-year field study in strawberry cultivation. J. Soils Sediments 2021, 21, 3733–3752. [Google Scholar] [CrossRef]
  38. Li, Y.; Chai, Y.; Ma, J.; Li, R.; Cheng, H.; Chang, L.; Chai, S. Straw strip mulching in a semiarid rainfed agroecosystem achieves carbon sequestration and emission reduction from winter wheat fields. Agric. Ecosyst. Environ. 2022, 334, 107990. [Google Scholar] [CrossRef]
  39. Zhang, H.; Lu, C.; Pang, H.; Liu, N.; Zhang, X.; Li, Y. Straw layer burial to alleviate salt stress in silty loam soils: Impacts of straw forms. J. Integr. Agric. 2020, 19, 265–276. [Google Scholar] [CrossRef]
  40. Li, X.; Chang, S.X.; Salifu, K.F. Soil texture and layering effects on water and salt dynamics in the presence of a water table: A review. Environ. Rev. 2013, 22, 41–50. [Google Scholar] [CrossRef]
  41. Zhang, H.; Pang, H.; Zhao, Y.; Lu, C.; Liu, N.; Zhang, X.; Li, Y. Water and salt exchange flux and mechanism in a dry saline soil amended with buried straw of varying thicknesses. Geoderma 2020, 365, 114213. [Google Scholar] [CrossRef]
  42. Meng, X.; Gao, M.; Ma, T.; Yan, L. Analysis of Pore Structure on Carbon Powder of Hemp Straw. Adv. Mater. Res. 2010, 177, 640–642. [Google Scholar] [CrossRef]
  43. Zheng, J.; Wang, Y.; Cai, H.; Zhang, E.; Sun, Y. Experimental investigation into effects of maize leaf and straw fragments on soil water infiltration characteristics in furrow irrigation. J. Drain. Irrig. Mach. Eng. 2016, 34, 66–78. [Google Scholar] [CrossRef]
  44. Yang, H.; Rahardjo, H.; Leong, E.C.; Fredlund, D.G. A study of infiltration on three sand capillary barriers. Can. Geotech. J. 2004, 41, 629–643. [Google Scholar] [CrossRef]
  45. Paul, P.L.C.; Bell, R.W.; Barrett-Lennard, E.G.; Kabir, E. Impact of Rice Straw Mulch on Soil Physical Properties, Sunflower Root Distribution and Yield in a Salt-Affected Clay-Textured Soil. Agriculture 2021, 11, 264. [Google Scholar] [CrossRef]
  46. Xu, Q.; Liu, H.; Li, M.; Li, P. The Presence of the Biochar Interlayer Effectively Inhibits Soil Water Evaporation and Salt Migration to the Soil Surface. Agriculture 2023, 13, 638. [Google Scholar] [CrossRef]
  47. Abd El-Wahed, M.H.; Al-Omran, A.M.; Hegazi, M.M.; Ali, M.M.; Ibrahim, Y.A.M.; EL Sabagh, A. Salt Distribution and Potato Response to Irrigation Regimes under Varying Mulching Materials. Plants 2020, 9, 701. [Google Scholar] [CrossRef] [PubMed]
  48. Szoboszlay, M.; Näther, A.; Liu, B.; Carrillo, A.; Castellanos, T.; Smalla, K.; Jia, Z.; Tebbe, C.C. Contrasting microbial community responses to salinization and straw amendment in a semiarid bare soil and its wheat rhizosphere. Sci. Rep. 2019, 9, 9795. [Google Scholar] [CrossRef]
  49. Burt, C.M.; Isabell, B. Leaching of accumulated soil salinity under drip irrigation. Am. Soc. Agric. Eng. 2005, 48, 2115–2121. [Google Scholar] [CrossRef]
  50. Monteleone, M. Irrigation management in Mediterranean salt affected agriculture: How leaching operates. Ital. J. Agron. 2012, 7, e5. [Google Scholar] [CrossRef]
  51. Su, X.; Wang, Y.; Wang, G.; Zhang, Y.; Gong, X.; Yu, J.; Gou, F.; Lu, H. Assessment and prediction of coastal saline soil improvement effects combining substrate amendments and salt barrier materials in typical region of the Yangtze River Delta. Soil Tillage Res. 2022, 223, 105483. [Google Scholar] [CrossRef]
Figure 1. The schematic design of the soil tank.
Agriculture 14 00994 g001
Figure 2. Arrangement of the straw strips (layer) by sorghum stalks for five treatments. (1) T5, in which 10 cm width of straw strip with 5 cm long sorghum stalks were longitudinally arranged in the 20–25 cm soil layer; (2) T25, in which 10 cm width of straw strip with 25 cm long sorghum stalks horizontally arranged in the 20–25 cm soil layer; (3) T25+2.5, straw strip with the upper layer was longitudinally arranged using 2.5 cm long sorghum stalks and the lower layer horizontally arranged using 25 cm long sorghum stalks in the 20–25 cm soil layer; (4) T2.5, in which 25 cm width straw layer randomly arranged with 2.5 cm long sorghum stalks (the straw layer wrapped with two layers of non-woven fabric (200 g)) in the 20–25 cm soil layer; (5) CK, no straw layer.
Agriculture 14 00994 g002
Figure 3. Soil sampling position.
Agriculture 14 00994 g003
Figure 4. Temporal variations in the wetting front under five treatments. (a) T5, in which 10 cm width of straw strip with 5 cm long sorghum stalks were longitudinally arranged in the 20–25 cm soil layer; (b) T25, in which 10 cm width of straw strip with 25 cm long sorghum stalks horizontally arranged in the 20–25 cm soil layer; (c) T25+2.5, straw strip with the upper layer was longitudinally arranged using 2.5 cm long sorghum stalks and the lower layer horizontally arranged using 25 cm long sorghum stalks in the 20–25 cm soil layer; (d) T2.5, in which 25 cm width straw layer randomly arranged with 2.5 cm long sorghum stalks (the straw layer wrapped with two layers of non-woven fabric (200 g)) in the 20–25 cm soil layer; (e) CK, no straw layer.
Agriculture 14 00994 g004
Figure 5. Soil water content distribution in the 5–35 cm soil profile under different treatments after infiltration. (A) After 1 h of the first irrigation, (B) after 24 h of the first irrigation and (C) at the end of the experiment. CK, no straw layer; T25, in which 10 cm width of straw strip with 25 cm long sorghum stalks horizontally arranged in the 20–25 soil layer; T5, in which 10 cm width of straw strip with 5 cm long sorghum stalks were longitudinally arranged in the 20–25 cm soil layer; T25+2.5, straw strip with the upper layer was longitudinally arranged using 2.5 cm long sorghum stalks and the lower layer horizontally arranged using 25 cm long sorghum stalks in the 20–25 cm soil layer; T2.5, in which 25 cm width straw layer randomly arranged with 2.5 cm long sorghum stalks (the straw layer wrapped with two layers of non-woven fabric (200 g)) in the 20–25 cm soil layer.
Agriculture 14 00994 g005
Figure 6. Electrical conductivity (EC1:5) distribution in the 5–35 cm soil profile under different treatments after infiltration. (A) After 1 h of the first irrigation, (B) after 24 h of the first irrigation and (C) at the end of experiment. CK, no straw layer; T25, in which 10 cm width of straw strip with 25 cm long sorghum stalks were horizontally arranged in the 20–25 cm soil layer; T5, in which 10 cm width of straw strip with 5 cm long sorghum stalks were longitudinally arranged in the 20–25 cm soil layer; T25+2.5, straw strip with the upper layer was longitudinally arranged using 2.5 cm long sorghum stalks and the lower layer horizontally arranged using 25 cm long sorghum stalks in the 20–25 cm soil layer; T2.5, in which 25 cm width straw layer randomly arranged with 2.5 cm long sorghum stalks (the straw layer wrapped with two layers of non-woven fabric (200 g)) in the 20–25 cm soil layer.
Agriculture 14 00994 g006
Figure 7. Salt storage and desalination rate in the 0–10 cm and 0–20 cm soil layers under different treatments after infiltration. (a) After 24 h of the first irrigation, (b) after 48 h of the second irrigation and (c) at the end of experiment. CK, no straw layer; T25, in which 10 cm width of straw strip with 25 cm long sorghum stalks horizontally arranged in the 20–25 cm soil layer; T5, in which 10 cm width of straw strip with 5 cm long sorghum stalks were longitudinally arranged in the 20–25 cm soil layer; T25+2.5, straw strip with the upper layer was longitudinally arranged using 2.5 cm long sorghum stalks and the lower layer horizontally arranged using 25 cm long sorghum stalks in the 20–25 cm soil layer; T2.5, in which 25 cm width straw layer randomly arranged with 2.5 cm long sorghum stalks (the straw layer wrapped with two layers of non-woven fabric (200 g)) in the 20–25 cm soil layer; SI, the salt storage after infiltration; P, the salt desalination rate. Within treatments, different small letters show a significant difference at the p < 0.05 level. The data bar is SE.
Agriculture 14 00994 g007
Figure 8. Salt leaching efficiency (SLE) at the 0 10 and 10–20 cm soil layer under different treatments after infiltration. Within treatments, different small letters show a significant difference at the p < 0.05 level. The data bar is SE.
Agriculture 14 00994 g008
Table 1. Infiltration time under the different treatments.
Treatment 1Time for Wetting Front to Transit from 5 cm to 20 cm in Depth from the Top of the Soil
(h)
Time for Wetting Front to Transit from 20 cm to 25 cm in Depth from the Top of the Soil
(h)
Time for Wetting Front to Transit from 25 cm to 35 cm in Depth from the Top of the Soil
(h)
CK24.06 ± 0.11 b3.16 ± 0.03 c24.43 ± 0.02 c
T2524.12 ± 0.02 b5.13 ± 0.11 b26.38 ± 0.04 b
T524.05 ± 0.03 b5.05 ± 0.02 b26.57 ± 0.05 b
T25+2.524.17 ± 0.05 b5.34 ± 0.03 b26.36 ± 0.02 b
T2.525.55 ± 0.03 a6.57 ± 0.04 a29.17 ± 0.08 a
1 Note: CK, no straw layer; T25, horizontally straw buried at the 20–25 cm depth; T5, longitudinally straw buried at 20–25 cm depth; T25+2.5, combined straw buried at the 20–25 cm depth; T2.5, randomly arranged straw buried at the 20–25 cm depth. Data are mean ± SE. Different letters within a column indicate significant differences at the 0.05 level.
Disclaimer/Publisher’s Note: The statements, opinions and data contained in all publications are solely those of the individual author(s) and contributor(s) and not of MDPI and/or the editor(s). MDPI and/or the editor(s) disclaim responsibility for any injury to people or property resulting from any ideas, methods, instructions or products referred to in the content.

