Article

Humic Acids Combined with Dairy Slurry as Fertilizer Can Increase Alfalfa Yield and Reduce Nitrogen Losses

1
Agro-Environmental Protection Institute, Ministry of Agriculture and Rural Affairs, Tianjin 300191, China
2
Key Laboratory of Low-Carbon Green Agriculture in North China, Ministry of Agriculture and Rural Affairs, Beijing 100193, China
3
Department of Agriculture and Food, RISE-Research Institutes of Sweden, P.O. Box 7033, 75758 Uppsala, Sweden
4
BNU-HKUST Laboratory for Green Innovation, Advanced Institute of Natural Sciences, Beijing Normal University, Zhuhai 519087, China
5
Institute of Animal Husbandry and Veterinary Medicine, Xinjiang Academy of Agricultural and Reclamation Sciences, Shihezi 832000, China
*
Author to whom correspondence should be addressed.
Agriculture 2024, 14(8), 1208; https://doi.org/10.3390/agriculture14081208 (registering DOI)
Submission received: 18 June 2024 / Revised: 16 July 2024 / Accepted: 18 July 2024 / Published: 23 July 2024
(This article belongs to the Section Agricultural Soils)

Abstract

:
Dairy slurry could be a significant source of nitrogen (N) for plants, but mismanagement can lead to atmospheric ammonia losses or nitrate leaching into groundwater. To make the use of dairy slurry efficient and reasonable, the loss of N pollution to the environment should be reduced. We used repacked lysimeters to comprehensively determine ammonia emission and N leaching losses in an alfalfa–soil system. The application of dairy slurry had no significant effect on alfalfa yield at the same rate of N application in comparison to chemical fertilizer, and adding humic acids significantly increased yield by about 12%. However, the application of dairy slurry increased the ammonia emission rate significantly, leading to an increase in the cumulative amount of ammonia emission, while the addition of humic acids reduced the ammonia emissions by 11%. Chemical fertilizer and dairy slurry application significantly increased nitrate leaching compared to the control treatment, while the addition of humic acids can significantly reduce ammonium N leaching. Dairy slurry was proven to be as effective as chemical N fertilizer in achieving the optimum biomass, and adding humic acids can significantly reduce N loss to the atmosphere and groundwater. This study showed the possibility of replacing chemical fertilizer with dairy slurry in alfalfa production and the advantages of humic acids’ addition to alfalfa to maintain production yield and improve environmental friendliness.

1. Introduction

Alfalfa is an excellent source of easily digestible protein for ruminants, making it an ideal choice for animal feed. Its high productivity provides a significant amount of feed output, making it one of the essential crops for supporting the development of livestock production [1]. Amidst the rapid expansion of large-scale dairy farming in China, there is a notable shortage of high-quality forage grasses, including alfalfa [2]. From 2008 to 2018, China’s imported amount of alfalfa increased from 2 × 10⁵ kg to 1.38 × 10⁶ kg, making it the world’s largest importer of alfalfa [3]. This shortage of domestically produced alfalfa impedes dairy production and compromises milk quality in the region [4]. As China adopts the concept of “pasture-based livestock industries”, there are new governmental initiatives aimed at boosting the production of high-quality forage and promoting the use of slurry as a fertilizer in grassland management. This approach supports the integration of agriculture and enhances nutrient recycling in livestock operations [5]. Although alfalfa is a legume that fixes nitrogen from the atmosphere, studies show that nitrogen fertilization can improve both the quality and the yield of alfalfa. The type and quantity of fertilizer significantly influences various characteristics of the alfalfa [6,7]. Notably, the use of organic fertilizers has been proven to enhance the yield and quality of alfalfa crops [8].
Beyond the insufficient supply of forage grass, the substantial volume of manure produced by the livestock industry also significantly impedes its development [9]. Often perceived merely as a waste, manure should instead be considered a by-product and a valuable resource for use as organic fertilizer. Rich in nutrients like nitrogen (N) and phosphorus (P), global practical experience has demonstrated that applying manure significantly enhances soil physical and chemical properties, boosting both crop quality and yield [10].
Manure is typically categorized as either solid or liquid, based on its ability to flow under gravity or its pumpability [11]. In China, liquid manure or slurry refers to the liquid fraction after solid–liquid separation and can also include digestate from biogas fermentation [12]. The volume of this liquid fraction exceeds the solid fraction, leading to higher costs for storage and transportation. Furthermore, the application of liquid on fields is restricted in China according to season, application method, and other factors [13]. Several studies have shown that slurry application can enhance crop yield [14,15], improve crop quality [16], and can ameliorate soil properties [17,18]. For example, Shi et al. [19] reported that the total dry matter yields of tall fescue were 4.1 times greater with slurry application compared to controls. Shakoor et al. [20] found in a 7-year continuous experiment that an average slurry dose of 146 kg·N·ha−1 yielded barley grain amounts of around 3–4 Mg·ha−1 comparable to those using higher doses of mineral fertilizers. Additionally, Abubaker et al. [21] observed that the application of anaerobically digested manure during alfalfa cultivation in desert soils significantly enhanced the germination, plant height, and total stem number of alfalfa. Photosynthetic characteristics in crops, including net photosynthesis rate (Pn), stomatal conductance (Gs), transpiration rate (Tr), and intercellular CO2 concentration (Ci), are vital for productivity and are closely related to the yield [22]. Zhang et al. [23] found that the addition of organic fertilizer can enhance the average net photosynthetic rate of peanut leaves by 8.31%. The study of Vasileva and Kostov [24] indicated that the average dry yield of alfalfa can be increased by 15.9% when applying manure instead of chemical fertilizers. However, research focusing on the photosynthetic response of alfalfa to slurry application remains limited.
Applying N fertilizers to arable land increases N input, which often results in greater N loss [25]. N from slurry can lead to leaching and ammonia emission, reduce nutrient availability for crops, and negatively impact both atmosphere and surface and ground waters [26,27,28]. Urease activity, essential in N mineralization, converts organic N to inorganic N, thus supplying inorganic N to the soil and crops [29]. According to the result of the second national census of pollution sources, animal husbandry accounts for 42.14% of N emissions from all agricultural sources [30]. In previous studies, lysimeter experiments were used to study N leaching across various environments and agricultural practices [31,32,33], providing a means to quantitatively analyze N loss, which is otherwise difficult to measure in the field [34,35].
Humic acids are heterogeneous compounds known for their ability to improve soil quality and increase crop yields, primarily due to their phenol and carboxylic acid functional groups [36]. Their application promotes plant growth and development through multiple pathways [37]. Adding external acids to dairy slurry application can significantly promote the production of ammonium N in soil and enhance N uptake in crops [38]. Humic acids contain abundant photodegradable substances that may improve light energy capture and conversion in leaves, thus increasing photosynthesis [39]. Studies by Baghaie and Aghili [40] showed that mineral source humic acids can increase tomato yield by enhancing soil enzyme activity. Additionally, adding humic acids into soil can notably alleviate salt stress and lead to improved soil nutrient availability, water retention, structure, and microbial activities [41,42]. Humic acids also strengthen crop roots and reduce ammonia emissions through N fixation [43]. Li et al. [44] found that the application of humic acids with fertilizers increased the average nitrification rate of the soil, resulting in a reduction of ammonia emissions at the yield-scale by 12.8% to 23.5%. However, acidified slurry may increase the risk of nitrate leaching [45]. The effects of combined dairy slurry and humic acid application on alfalfa yield, ammonia emissions, and N leaching are still not fully understood.
This study investigates the impact of dairy slurry application on alfalfa yields, agronomic traits, photosynthetic characteristics, soil organic matter, soil urease activity, ammonia emissions, and N leaching. Additionally, it examines the effect of adding humic acids to the soil together with the dairy slurry. Through soil lysimeter experiments, this study aims to provide a scientific basis for optimizing dairy slurry application. Our main hypothesis is that using dairy slurry instead of chemical fertilizers, at equivalent N application rates, will not decrease alfalfa yields. Furthermore, we hypothesized that adding humic acids will increase alfalfa yields while reducing N losses.

2. Materials and Methods

2.1. Soil and Dairy Slurry Properties

The experimental soil was collected from a demonstration base for the recycling of waste from dairy farming in October 2019. The base is located in Tianjin (38°47′ N, 117°12′ E), which is characterized by typical semi-humid continental monsoon climate with warm and humid summers and cold and dry winters.
The soil that was classified as fluvo-aquic with a loamy texture. Soil samples were collected from three soil layers, each 20 cm in depth (0–20 cm, 20–40 cm, 40–60 cm), at 10 different sites across a 10-hectare field under maize cultivation. Freshly collected soil samples were preserved for ammonium N and nitrate N analysis. The remaining soil samples were air-dried and sieved through a 5 mm nylon mesh to remove roots and rocks. Each layer was then mixed thoroughly to ensure homogeneity of the original field layers before usage. The initial composition and characteristics of each soil layer are shown in Table 1.
The slurry was separated with a screw press which removed approximately 50% of the dry matter into a solid fraction. The resulting liquid fraction was stored in a 2000 m3 storage tank and underwent anaerobic fermentation prior to soil application. The composition and characteristics of the liquid fraction after digestion were as follows: total N 1438.21 mg·L−1, ammonia N 826.68 mg·L−1, nitrate N 1.54 mg·L−1, total phosphorus 120.67 mg·L−1, total potassium 1002.50 mg·L−1, Cu 1.83 mg·L−1, Zn 11.88 mg·L−1, Cr 0.01 mg·L−1, As 22.40 μg·L−1, Pb 41.91 μg·L−1, and Cd 19.22 μg·L−1. This is hereafter referred to as slurry.

2.2. Lysimeter Installation

The lysimeter experiment was conducted in the glass greenhouse at the Agro-Environmental Protection Institute, Ministry of Agriculture and Rural Affairs (Tianjin, China), without additional heating. The experiment set included 20 lysimeters, each 80 cm height and a 25 cm in diameter constructed from PVC material. Lysimeters were fixed vertically in a stainless steel frame. A 400-mesh nylon filter was placed at the bottom and then covered with 2 cm fine quartz sand to prevent clogging by fine soil particles (Figure 1). To minimize wall-dominate flow, the inner walls of the PVC tubes were coated with Vaseline before filling the soil into lysimeters. The soil used for each layer was calculated based on field-measured bulk density and in the same sequence and thickness as in the field. The lysimeters were irrigated with ultrapure water for a week to allow the soil to settle naturally.

2.3. Experimental Design

The alfalfa cultivar tested was “Zhongmu 1”, sown in the lysimeter on 15 December 2019 at a density of 20–25 plants per lysimeter and sowing depth of 3 cm. There were five treatments with four replications: (1) control treatment (Control), with no fertilizer was applied; (2) chemical fertilizer application treatment (CF); (3) dairy slurry application treatment (DS); (4) chemical fertilizer combined with humic acid application treatment (CFHA); and (5) dairy slurry combined with humic acid application treatment (DSHA). All treatments had the same nutrient application rate in each fertilization: N 90 kg·ha−1 based on the total nitrogen of the slurry, phosphorus (P2O5) 120 kg·ha−1, and potassium (K2O) 180 kg·ha−1, aligning with recommendations of the Chinese Agricultural Industry Standard NY/T2700 [46]. For the CF and CFHA treatments, urea was used to provide N, calcium superphosphate was used to provide phosphate, and potassium chloride was used to provide potassium. Chemical fertilizer was mixed into the top 0–20 cm soil layer before planting. The slurry’s equivalent application rate was 62.6 m3·ha−1. Any deficit in phosphorus and potassium in the slurry was supplemented with chemical fertilizer, which was pre-mixed into the slurry before application. Humic acids, sourced from lignite by Yuanye Biotechnology (Shanghai, China) with 75% organic matter content, were applied at a rate of 5% by mass to the 0–20 cm soil layer and mixed into the soil before the first irrigation. The fertilizer dosage with DS and DSHA was split and applied twice with irrigation, in January 2020 and June 2020, to coincide with the overwintering and greening stages of alfalfa, respectively.
Alfalfa was harvested three times during the experiment, which was irrigated with the equivalent of 6000 m3·ha−1 deionized water prior to the first harvest. For the first harvest, irrigation occurred three times (8 January 2020, 19 April 2020, and 6 May 2020) with deionized water at an amount of 2000 m3·ha−1 each time. The second harvest, having a shorter growth period, was irrigated twice (16 June 2020 and 29 June 2020) with deionized water at an amount of 3000 m3·ha−1 each time. The third harvest was irrigated three times (27 July 2020, 14 August 2020, and 5 September 2020), the first session using 3000 m3·ha−1 and the subsequent session using 1500 m3·ha−1 each.

2.4. Sample Collection and Measurement

The aboveground biomass of alfalfa was harvested at the bud stages three times (27 May 2020, 10 July 2020, and 30 September 2020). For each harvest, only the alfalfa plants with a height > 5 cm were cut. The fresh weight of biomass was recorded immediately after cutting.
Photosynthesis parameters were measured using a portable photosynthesis system (Li-6400XT; Li-Cor Inc, Lincoln, OR, USA) with a pump flow rate of 500 μmol·s−1, and the irradiance was set at 1200 μmol·m−2·s−1. The red-blue light (Li-6400-02BLED) provided by the system was the simulated light source. The CO2 concentration in the reference chamber was maintained at 400 μmol·mol−1, controlled by injecting CO2. The measurement chamber temperature was set at 35 °C, and greenhouse temperatures were monitored when exceeding this set point. The middle leaflet of the fourth fully expanded leaf from the top was chosen for measuring for photosynthesis on clear, windless mornings between 9:00 a.m. and 11:00 a.m. Measurements included net photosynthetic rate (Pn, μmol·m−2·s−1), stomatal conductance (Gs, μmol·m−2·s−1), intercellular CO2 concentration (Ci, μmol·mol−1), transpiration rate (Tr, mmol·m−2·s−1), leaf water use efficiency (WUE, μmol·mmol−1), light use efficiency (LUE, mmol·mol−1), and photosynthetically active radiation (PAR, nm). The latter two were calculated using the following formulas:
WUE = Pn/Tr,
LUE = Pn/PAR.
Alfalfa plant height, stem diameter, and leaf width were measured on selected plants. Height was measured from the soil surface to the top of the plant, and a vernier caliper was used to measure stem diameter, 10–15 cm above the soil surface, and leaf width, at the same position as that for measuring leaf photosynthesis.
After each harvest of alfalfa, soil samples were collected from each soil lysimeter using an auger to a depth of 0–20 cm. The fresh soil samples were extracted with 2 mol·L−1 KCl and the concentration of ammonium N and nitrate N was determined using a flow injection analyzer (FIA-6000+, Beijing Jitian Instrument Co., Ltd., Beijing, China). Urease activity was measured using the phenol sodium hypochlorite colorimetric method, then measured at a wavelength of 578 nm via a UV spectrophotometer. Soil pH was measured by potentiometric pH measurement. Soil organic matter was quantified by oxidizing with a potassium dichromate-sulfuric acid solution under heating conditions, followed by titration with a standardized ferrous sulfate solution, in accordance with Chinese Agricultural Industry Standards NY/T 1121.6-2006 [47].
Ammonia emissions were determined using the continuous airflow enclosure method (Figure 1). Ammonia volatilized from the soil within the closed chamber was extracted by a vacuum pump and passed through a gas-washing bottle containing 50 mL of 2% boric acid solution, where it was to be absorbed. Soil ammonia emissions were then quantified by titrating the collected boric acid solution with 0.005 mol·L−1 H2SO4. Measurements were taken on days 1, 2, 3, 4, 5, 7, and 10 following irrigations. Leachate samples were collected on the 1st, 2nd, 5th, and 10th days after irrigation. These samples were analyzed for uniformity in compositions and volume, and concentrations of ammonium N, nitrate N, and total N content were analyzed via a flow injection analyzer (FIA-6000+, Beijing Jitian Instrument Co., Ltd., Beijing, China).

2.5. Statistical Analysis

Data were collected and analyzed using Microsoft Excel 2021. Figures were plotted using Origin 2022 software (OriginLab Inc., Northampton, MA, USA). Statistical significance was determined through one-way analysis of variance (one-way ANOVA) conducted using SAS software (Version 9.4), where mean comparisons were made using the least significant difference method at the 0.05 probability level. Relationships among alfalfa yield, agronomic traits, and soil physicochemical properties were evaluated using Spearman’s correlation coefficients.

3. Results

3.1. Yield of Alfalfa

The fresh weight of aboveground biomass of alfalfa, which represents alfalfa yield, is shown in Table 2. The average alfalfa yield of three harvests of alfalfa was 7946.71 kg·ha−1 in the Control, which was significantly lower than other fertilizer treatments. The average yield of alfalfa for the fertilizer treatments was from 10,238.54 kg·ha−1 and 11,664.57 kg·ha−1 for CF and DS, respectively, representing an average increase of 28.84–46.78% compared to the Control treatment. No significant difference in average yield was observed between CF and DS. However, during the second harvest, which had a shorter growth period, DS had a significantly greater yield than CF. The average yields in the humic acid treatments were significantly greater than the fertilizers alone. Similarly, no difference was found in average yield between CFHA and DSHA except for during the second harvest where DSHA yields were significantly greater than CFHA.

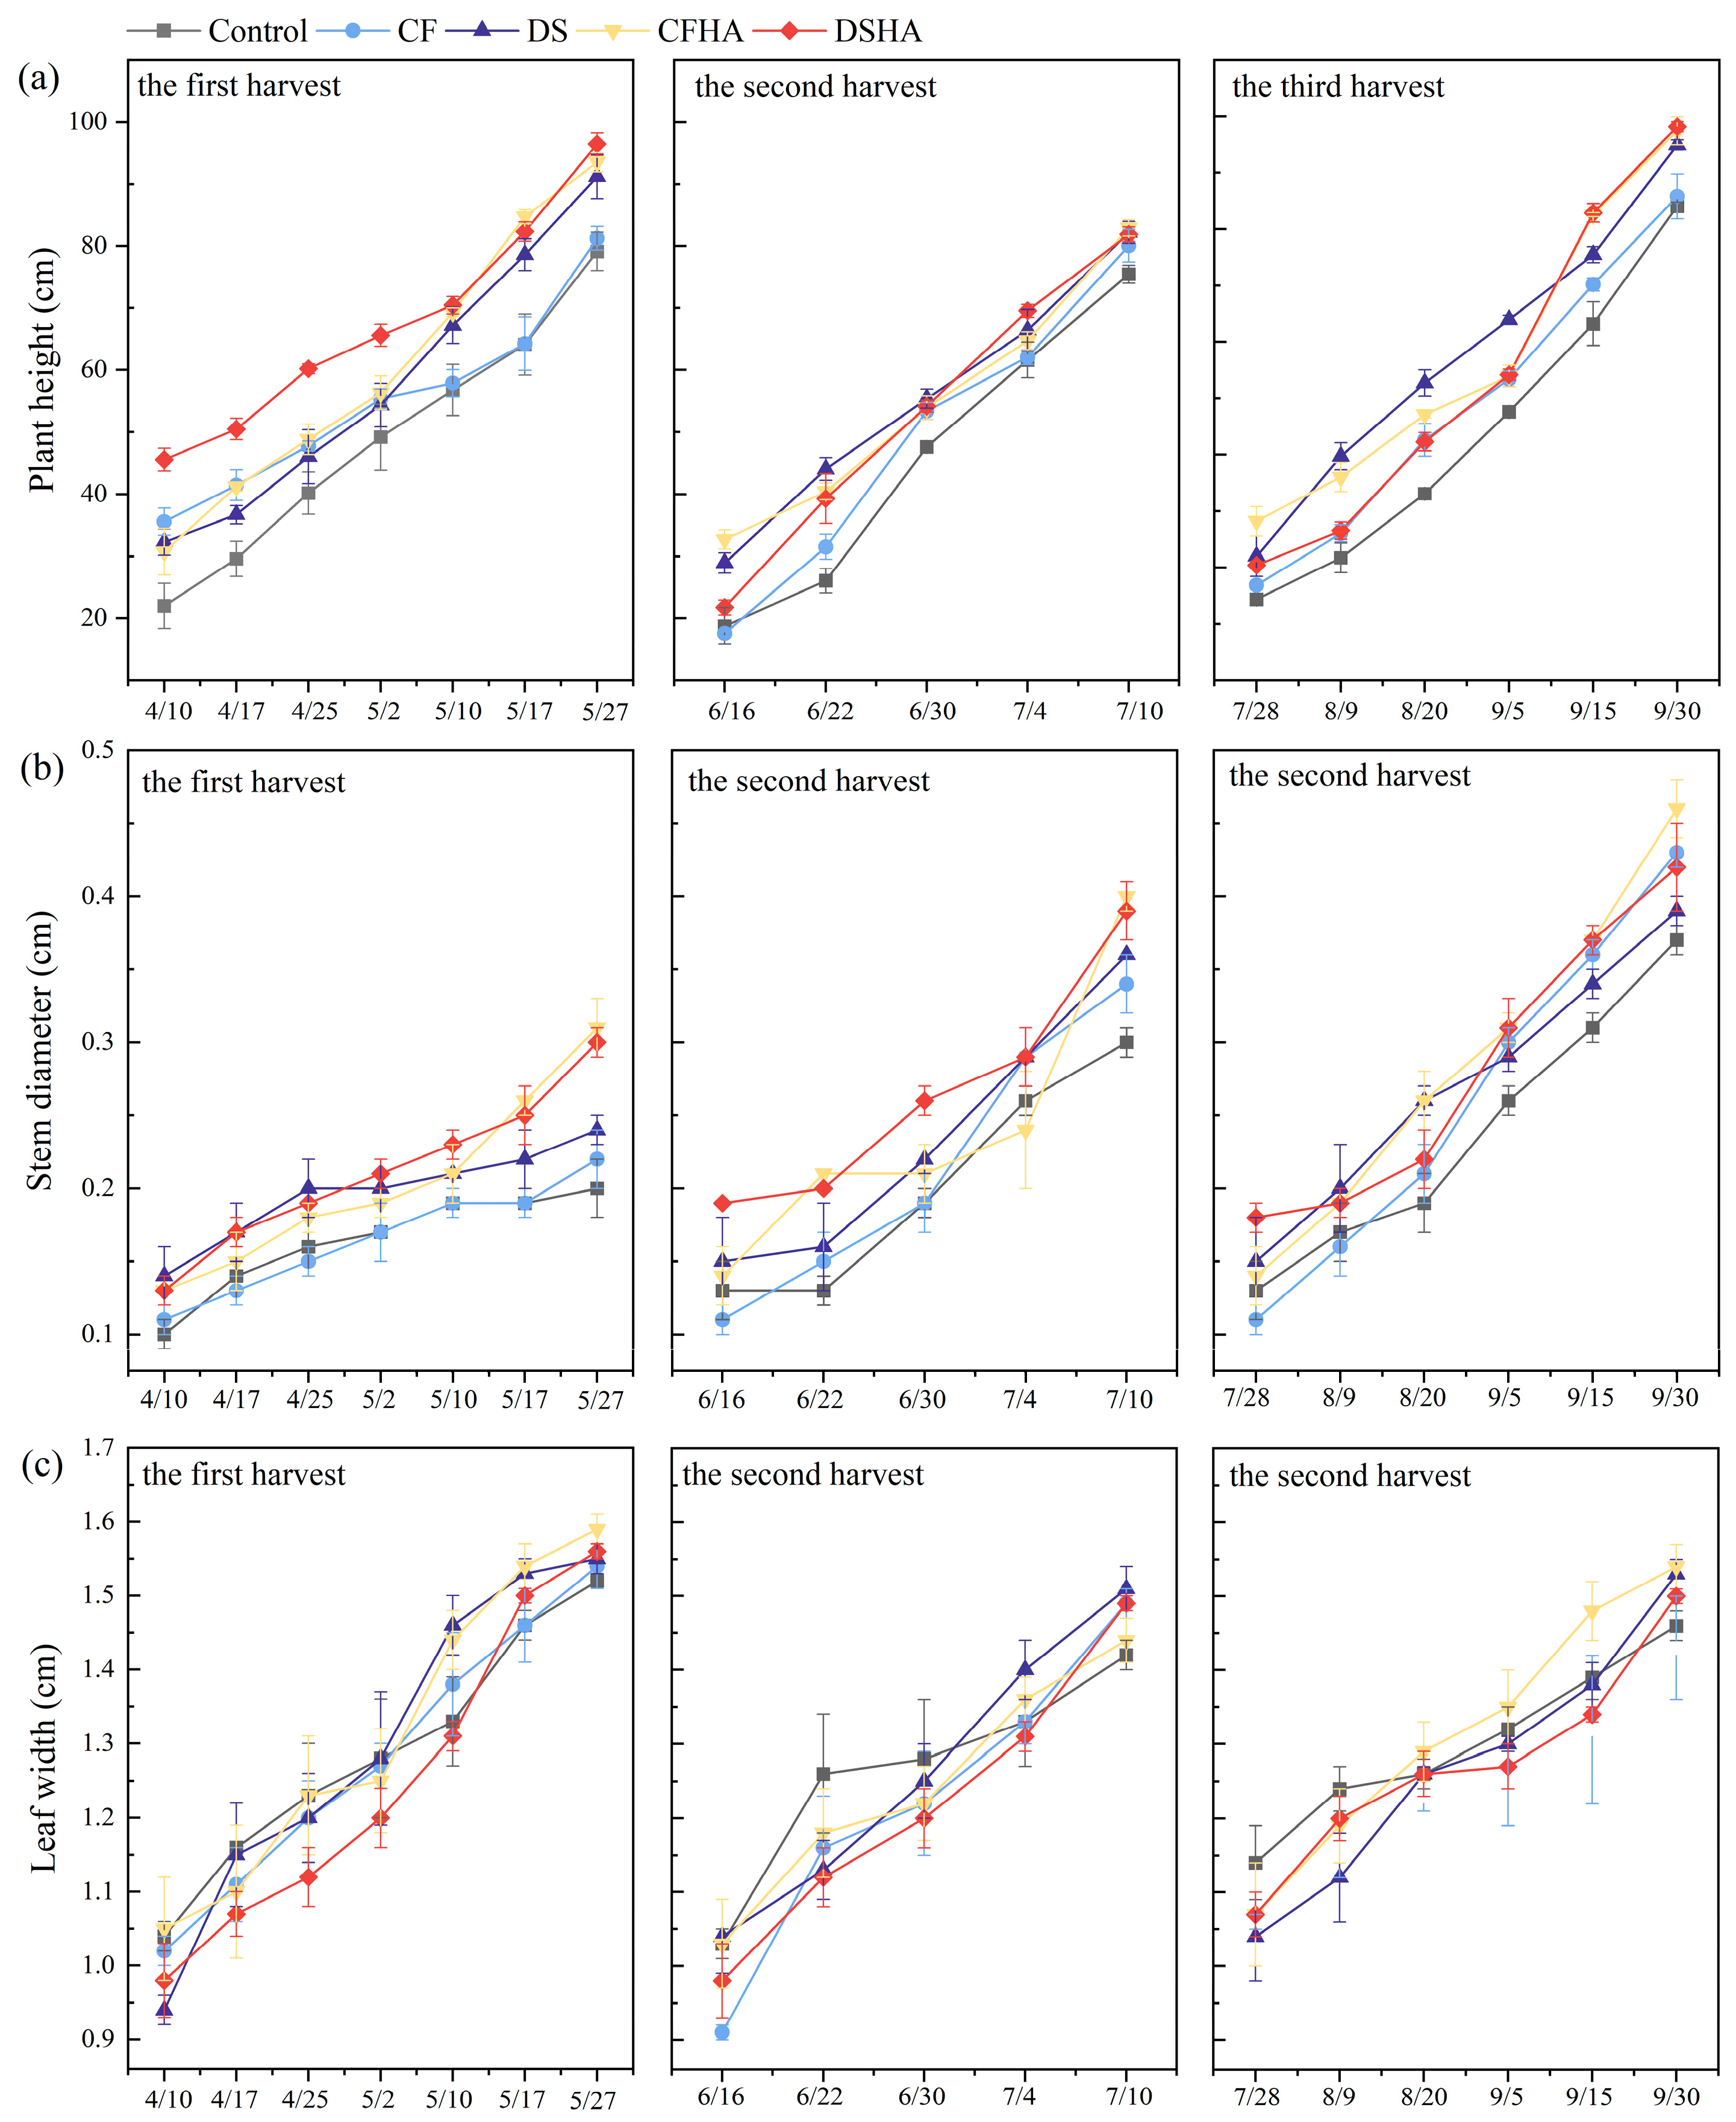
3.2. Agronomic Traits and Growth Rate of Alfalfa

The application of dairy slurry promotes alfalfa plant height more effectively than chemical fertilizer, as shown in Figure 2a. During the three harvests, the dairy slurry application compared with chemical fertilizer increased plant height by 12.28%, 2.65%, and 10.61%, respectively, with significant increases observed in the first and third harvests. The CFHA treatment significantly enhanced alfalfa plant height across all the three harvest periods compared to the CF treatment with increases of 15.11%, 3.56%, and 13.52%, respectively, with significant increases during the first and third harvests. Although the DSHA treatment initially showed a rapid increase in plant height of the first harvest, it did not show further increases compared to the DS treatment.
Alfalfa stem diameter increased across the harvests (Figure 2b). After the three harvests, the stem diameter in the DS treatment increased by an average of 2.83% relative to CF, and DSHA increased by 12.50% relative to DS; however, neither were statistically significant. The CFHA treatment resulted in a significant increase of 40.23% in the first harvest and a significant increase of 17.04% in the second harvest compared to CF, while the third harvest showed a 7.01% increase, which was not significant. Figure 2c illustrates the response of leaf width under different treatments under the same N application rate. Both CF and DS treatments increased leaf width, under the same N application rate, yet showed no significant difference between them. The addition of humic acids did not produce consistent changes compared to the treatment without humic acids.

3.3. Photosynthetic Characteristics

The photosynthetic characteristics of alfalfa leaves at different growth stages after various treatments are shown in Figure 3. The net photosynthetic rate, Pn, of CF relative to the Control increased by an average of 24.63%. Specifically, Pn significantly increased by 53.75% during the jointing stage, 17.44% during the squaring stage, and 28.44% during the flowering stage, though the increase during flowing was not significant. In comparison, Pn in the DS treatment compared to the Control showed an average increase of 44.34%, with significant increases of 37.89%, 89.53%, and 46.86% observed during the jointing, squaring, and flowering stages, respectively. Notably, Pn in the DS treatment reached a peak of 14.23 μmol·m−2·s−1 during the squaring stage, marking a significant increase of 61.39% compared to CF. The CFHA treatment showed an average Pn increase of 12.11%, with a significant increase of 28.65% during the squaring stage. Except for the squaring stage, the DSHA treatment showed the highest Pn values at each growth stage, with increases of 19.64% compared to the DS treatment.
Stomatal conductance, Gs, values during the returning green, jointing, and flowering stages were relatively concentrated, ranging only from 0.13 to 0.24 μmol·m−2·s−1 (Figure 3b). Gs values during the squaring stage were higher than those in other stages, ranging from 0.18 to 0.44 μmol·m−2·s−1. The treatments with humic addition (CFHA and DSHA) increased Gs by an average of 48.36% and 31.21% compared to CF and DS. No regular significant differences were observed between CFHA and DSHA.
Intercellular CO2 concentrations, Ci, during the flowering stage ranged from 215.81 to 286.02 μmol·mol−1, which were lower than those of other stages (Figure 3c). After fertilization, the Ci of alfalfa increased; however, the differences during the early growth stages of alfalfa (returning green and jointing stage) where not significant between CF and DS. In the squaring stage, DS was significantly 18.38% greater than CF, and it was 20.64% in the flowering stage. CFHA and DSHA showed increases of 10.81% and 0.50% over CF and DS, respectively, without showing a regular pattern of differences across different growth stages.
Transpiration, Tr, during the jointing and squaring stages was 4.44–6.86 mmol·m−2·s−1, which was greater than the range observed in the returning green stage and flowering stage, which values were from 1.43 to 3.04 mmol·m−2·s−1. During the four stages, DS showed an average increase of 24.99% relative to CF, with a significant increase of 20.85% observed only during the squaring stage. The addition of humic acids increased Tr, with CFHA showing an average increase of 27.47% over CF and a significant increase of 39.99% at the squaring stage. DSHA showed a 16.19% increase compared to DS, with no differences at individual stages.
Leaf water use efficiency, WUE, during the returning green and flowering stages was relatively high, ranging from 4.65 to 8.33 μmol·mmol−1, with no significant differences observed among treatments (Figure 3e). The WUE during the jointing and squaring stages was lower, ranging from 1.25 to 2.40 μmol·mmol−1. Light use efficiency, LUE, did not show significant differences among CF, DS, and CFHA, except during the squaring stage (Figure 3f). The DSHA treatment was significantly greater than the other treatments. During the squaring stage, DS had the highest LUE, reaching 0.0356 mmol·mol−1.

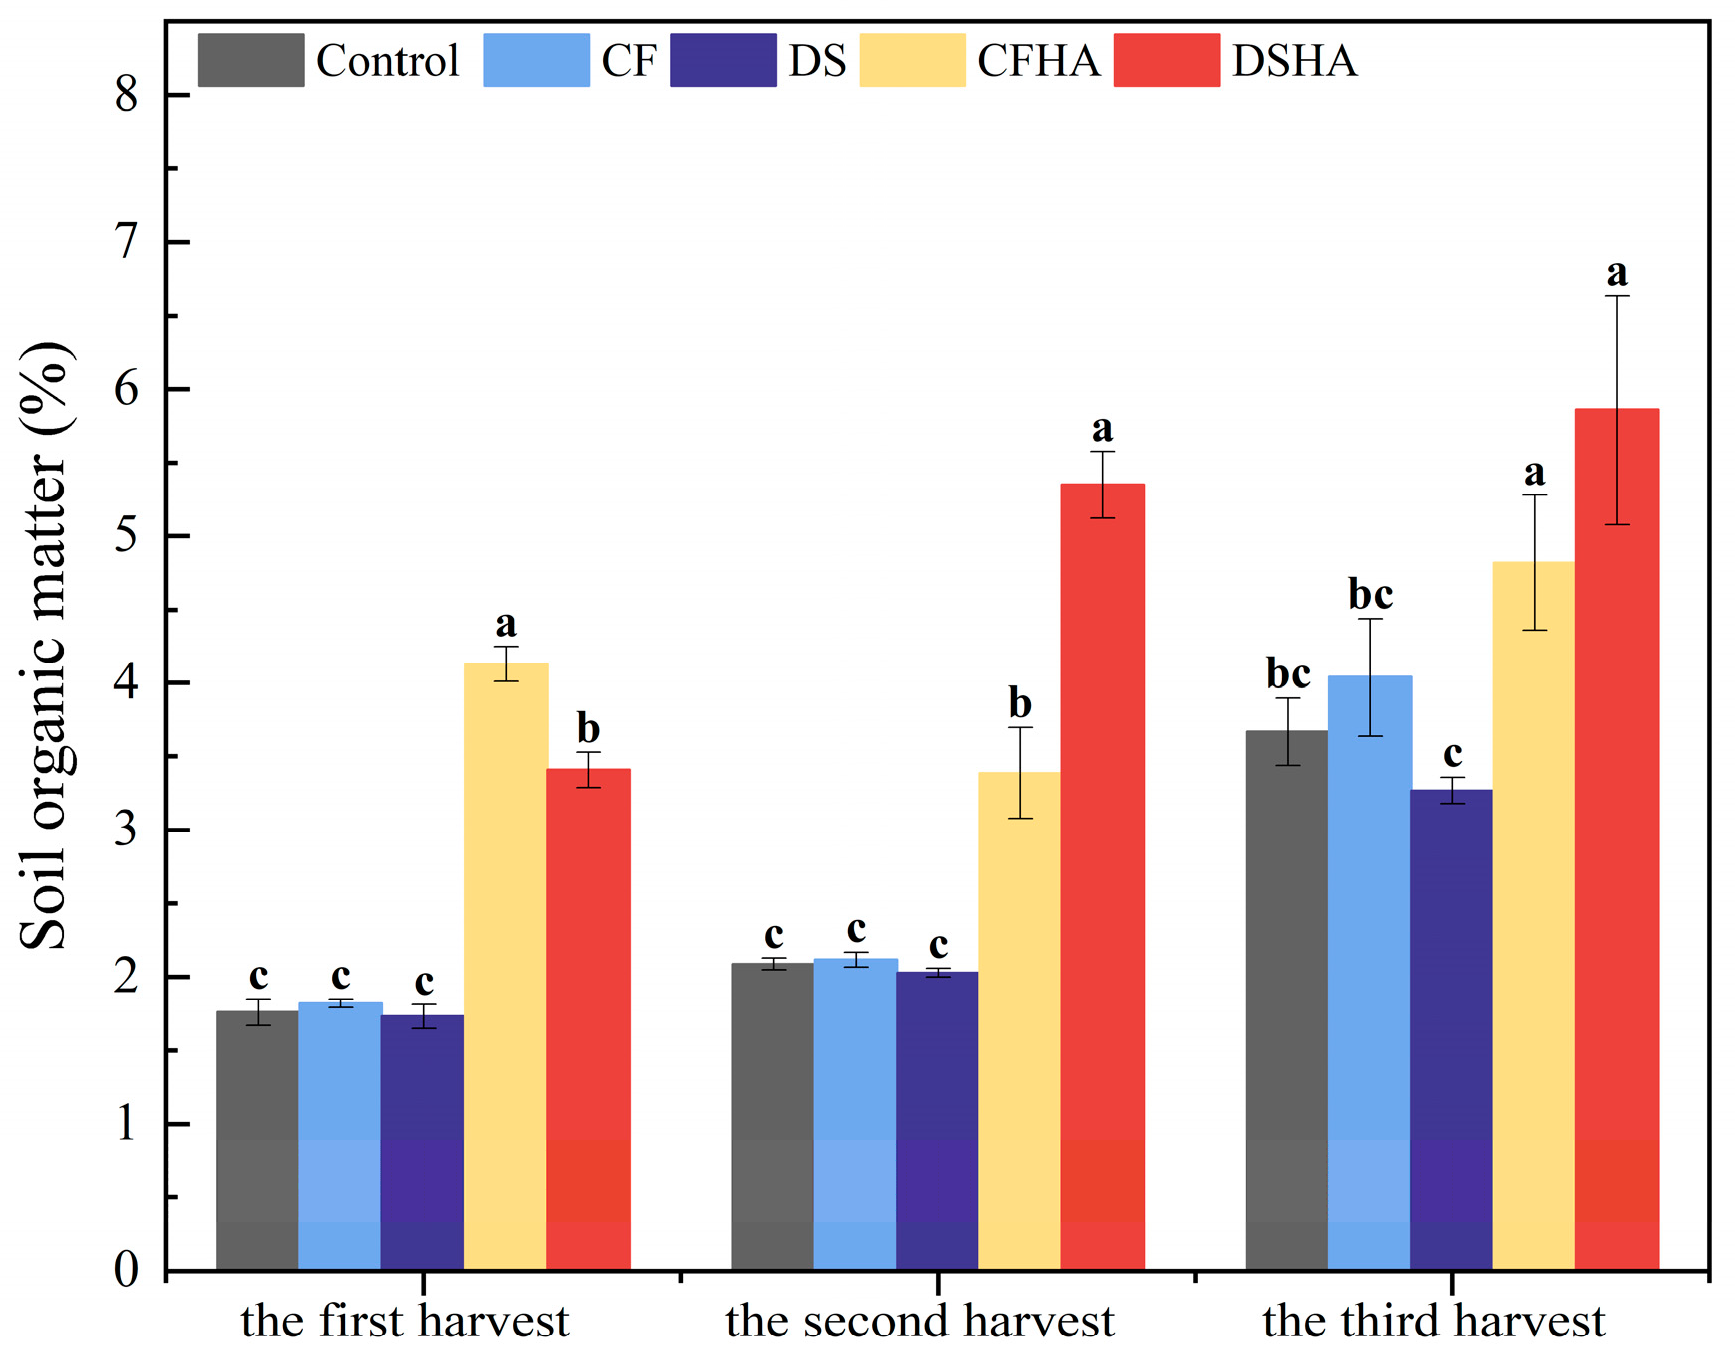
3.4. Soil Organic Matter, Soil pH, and Urease Activity

The soil organic matter content after all three harvests varied, with ranges from 1.76 to 4.13%, 2.03 to 5.35%, and 3.27 to 5.86%, respectively. Each subsequent harvest saw an increase in soil organic matter content (Figure 4). The highest content, 5.86%, was found in the DSHA treatment after the third harvest. While the application of CF or DS alone did not show a significant difference compared to the Control treatment, the addition of humic acids significantly increased soil organic matter content compared to fertilizers alone, with increases ranging from 60.15% to 163.21%.
Fertilizer application significantly decreased soil pH in the 0–20 cm layer after the second harvest compared to the Control; however, there were no differences found after the first and the third harvests (Table 3). There were no significant differences in soil pH between the CF treatment and DS treatment. Fertilizer application with the addition of humic acids significantly reduced soil pH, and DSHA treatment was significantly lower than CFHA treatment.
Neither fertilizer nor humic acid addition affected urease activity compared to the Control. After applying fertilizer (without using humic acids), the range of urease activity was 1.53–1.87 mg·g−1·d−1. Except for the first harvest, there was no significant difference among the CF, DS, and Control treatments. The lowest and highest values of urease activity occurred in the CFHA treatment, which was after the second harvest (1.40 mg·g−1·d−1) and after the third harvest (1.93 mg·g−1·d−1), respectively. Most of the fertilization treatments showed lower urease activity after the second harvest of alfalfa compared to the other two harvests.

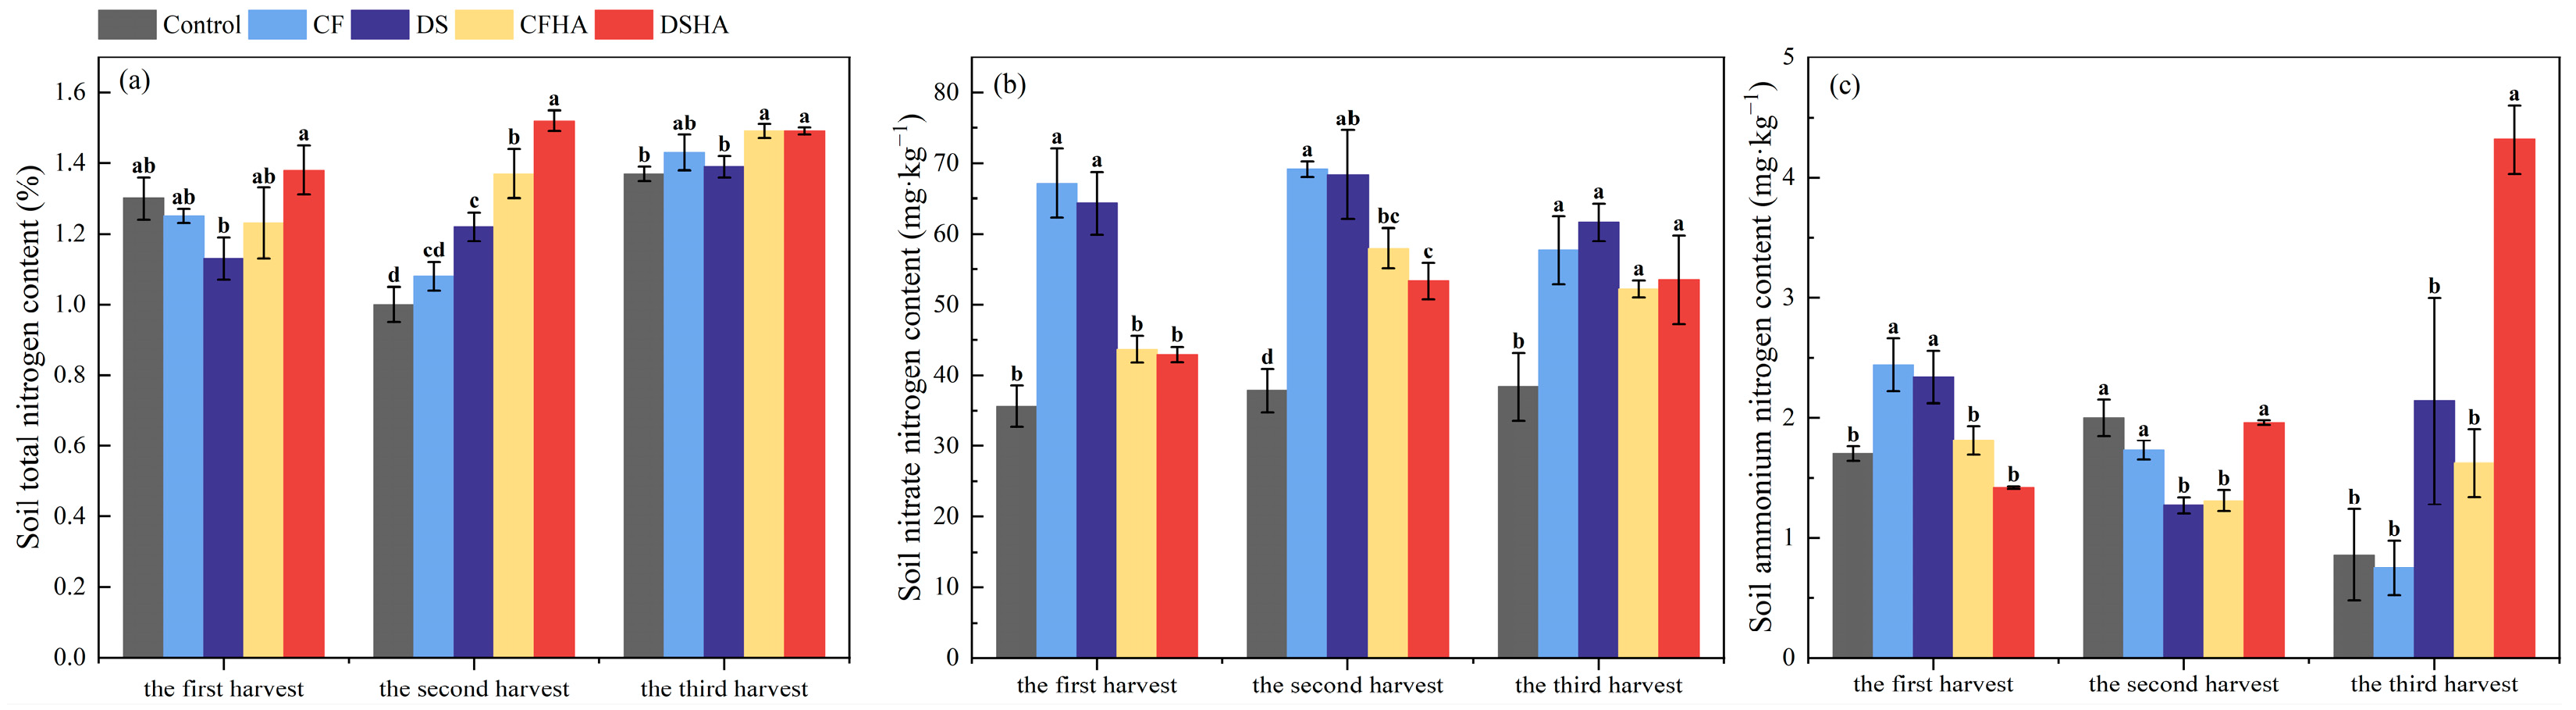
3.5. Soil Total Nitrogen, Nitrate Nitrogen, and Ammonium Nitrogen

Total nitrogen content in the 0–20 cm soil layer after each harvest is shown in Figure 5a. After the first harvest, the DS treatment had the lowest total N content at 1.13%, with no differences compared to Control CF. After the second harvest, treatments with humic acids significantly increased total N compared to those without, with CFHA showing a 27.29% increase over CF and DSHA a 24.21% increase over DS. After the third harvest, the differences among treatments were relatively lower, with the overall total N content ranging from 1.37% to 1.49%.
The content of nitrate N and ammonium N in the soil after each harvest is shown in Figure 5b,c. When comparing the soil nitrate N content after three harvests, fertilizer application led to a significant increase compared to the Control, which ranged from 35.63 to 38.38 mg·kg−1. However, it increased significantly to 57.67–69.18 mg·kg−1 and 61.65–68.41 mg·kg−1 in the CF and DS treatments, respectively. Compared to CF, the addition of humic acids in CFHA significantly reduced soil nitrate N content by 34.97% and 16.19% for the first two harvests, respectively, but the slight reduction after the third harvest was not significant. The content of ammonium N in the soil did not exceed 5 mg·kg−1, and no significant trend was observed in different treatments.

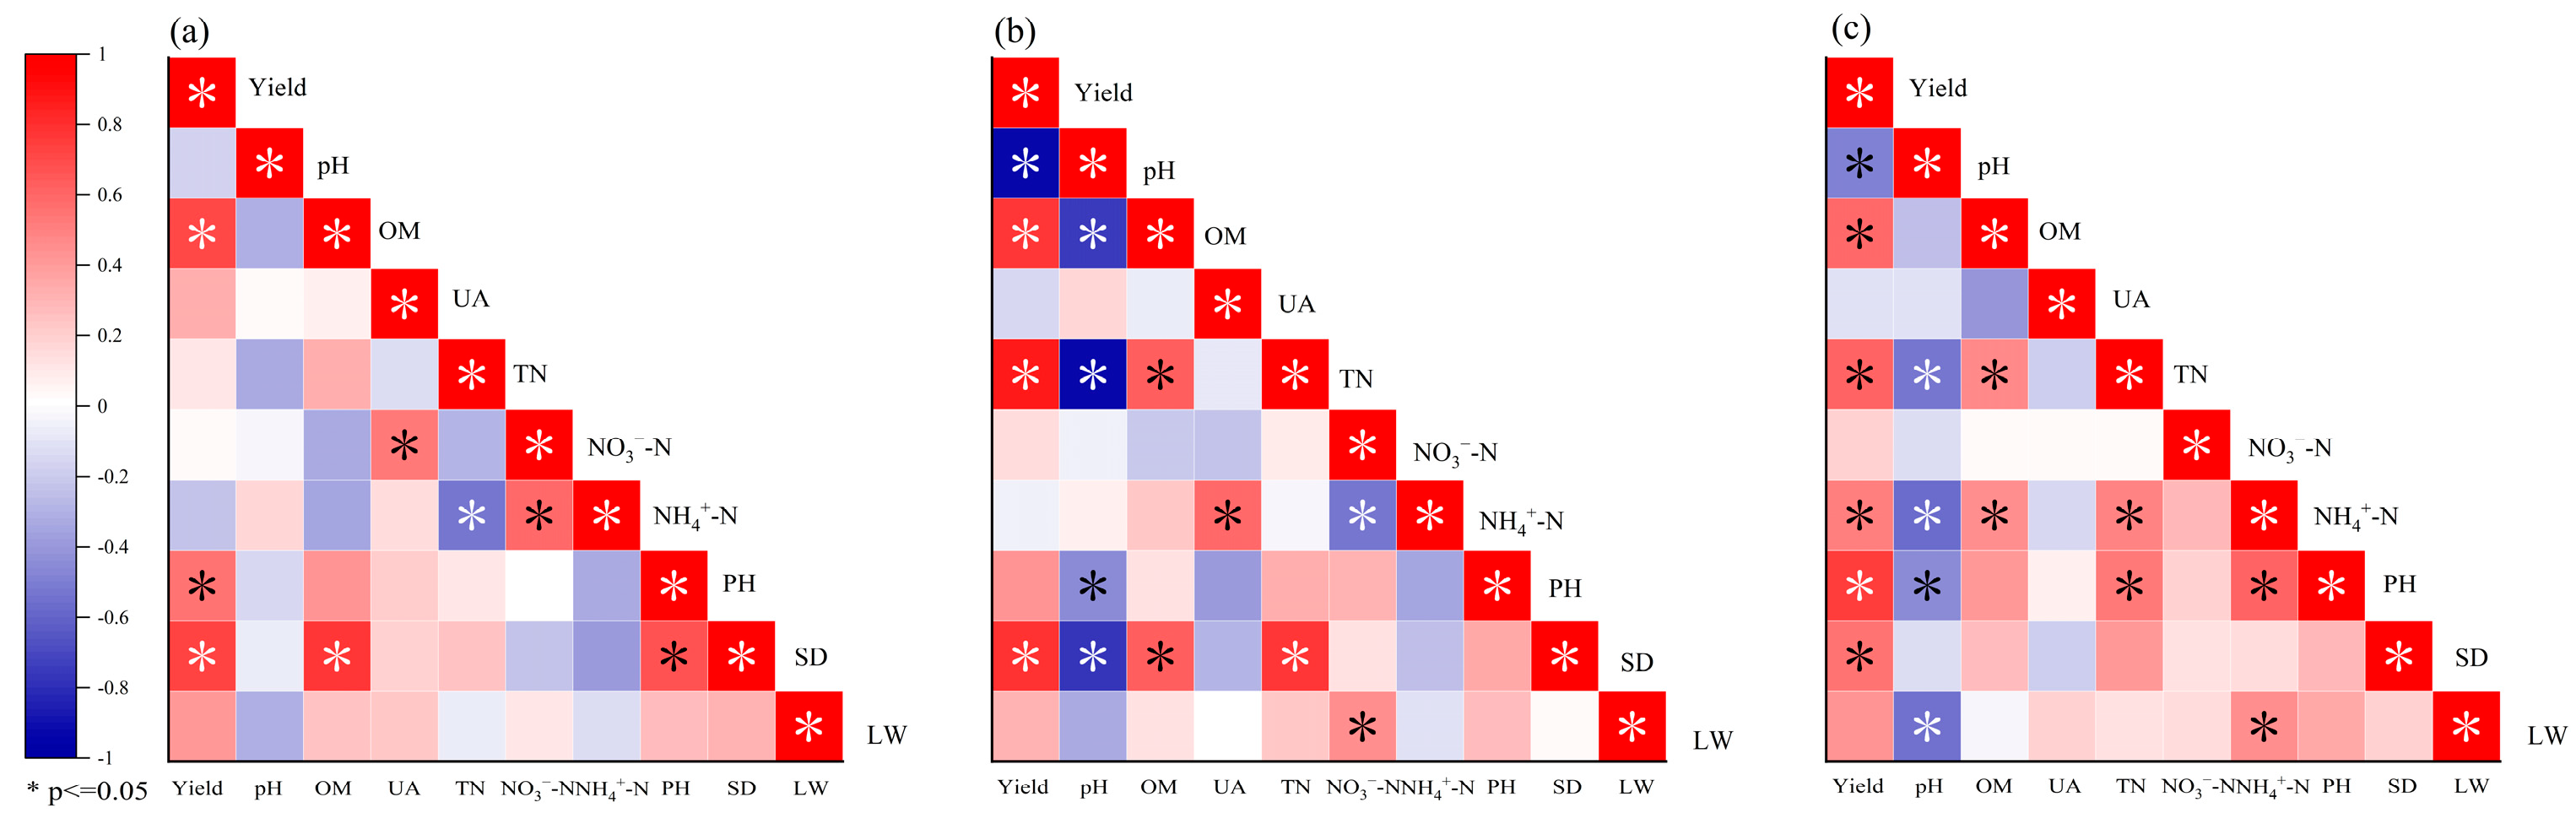
3.6. The Relationships between Alfalfa Yield and Soil Physicochemical Properties

The yield of the three alfalfa harvests exhibited significant correlations with soil organic matter content (Figure 6). In the second and third harvests, the yield of alfalfa showed significant positive correlations with soil total nitrogen content, and both of these factors exhibited significant negative correlations with soil pH.

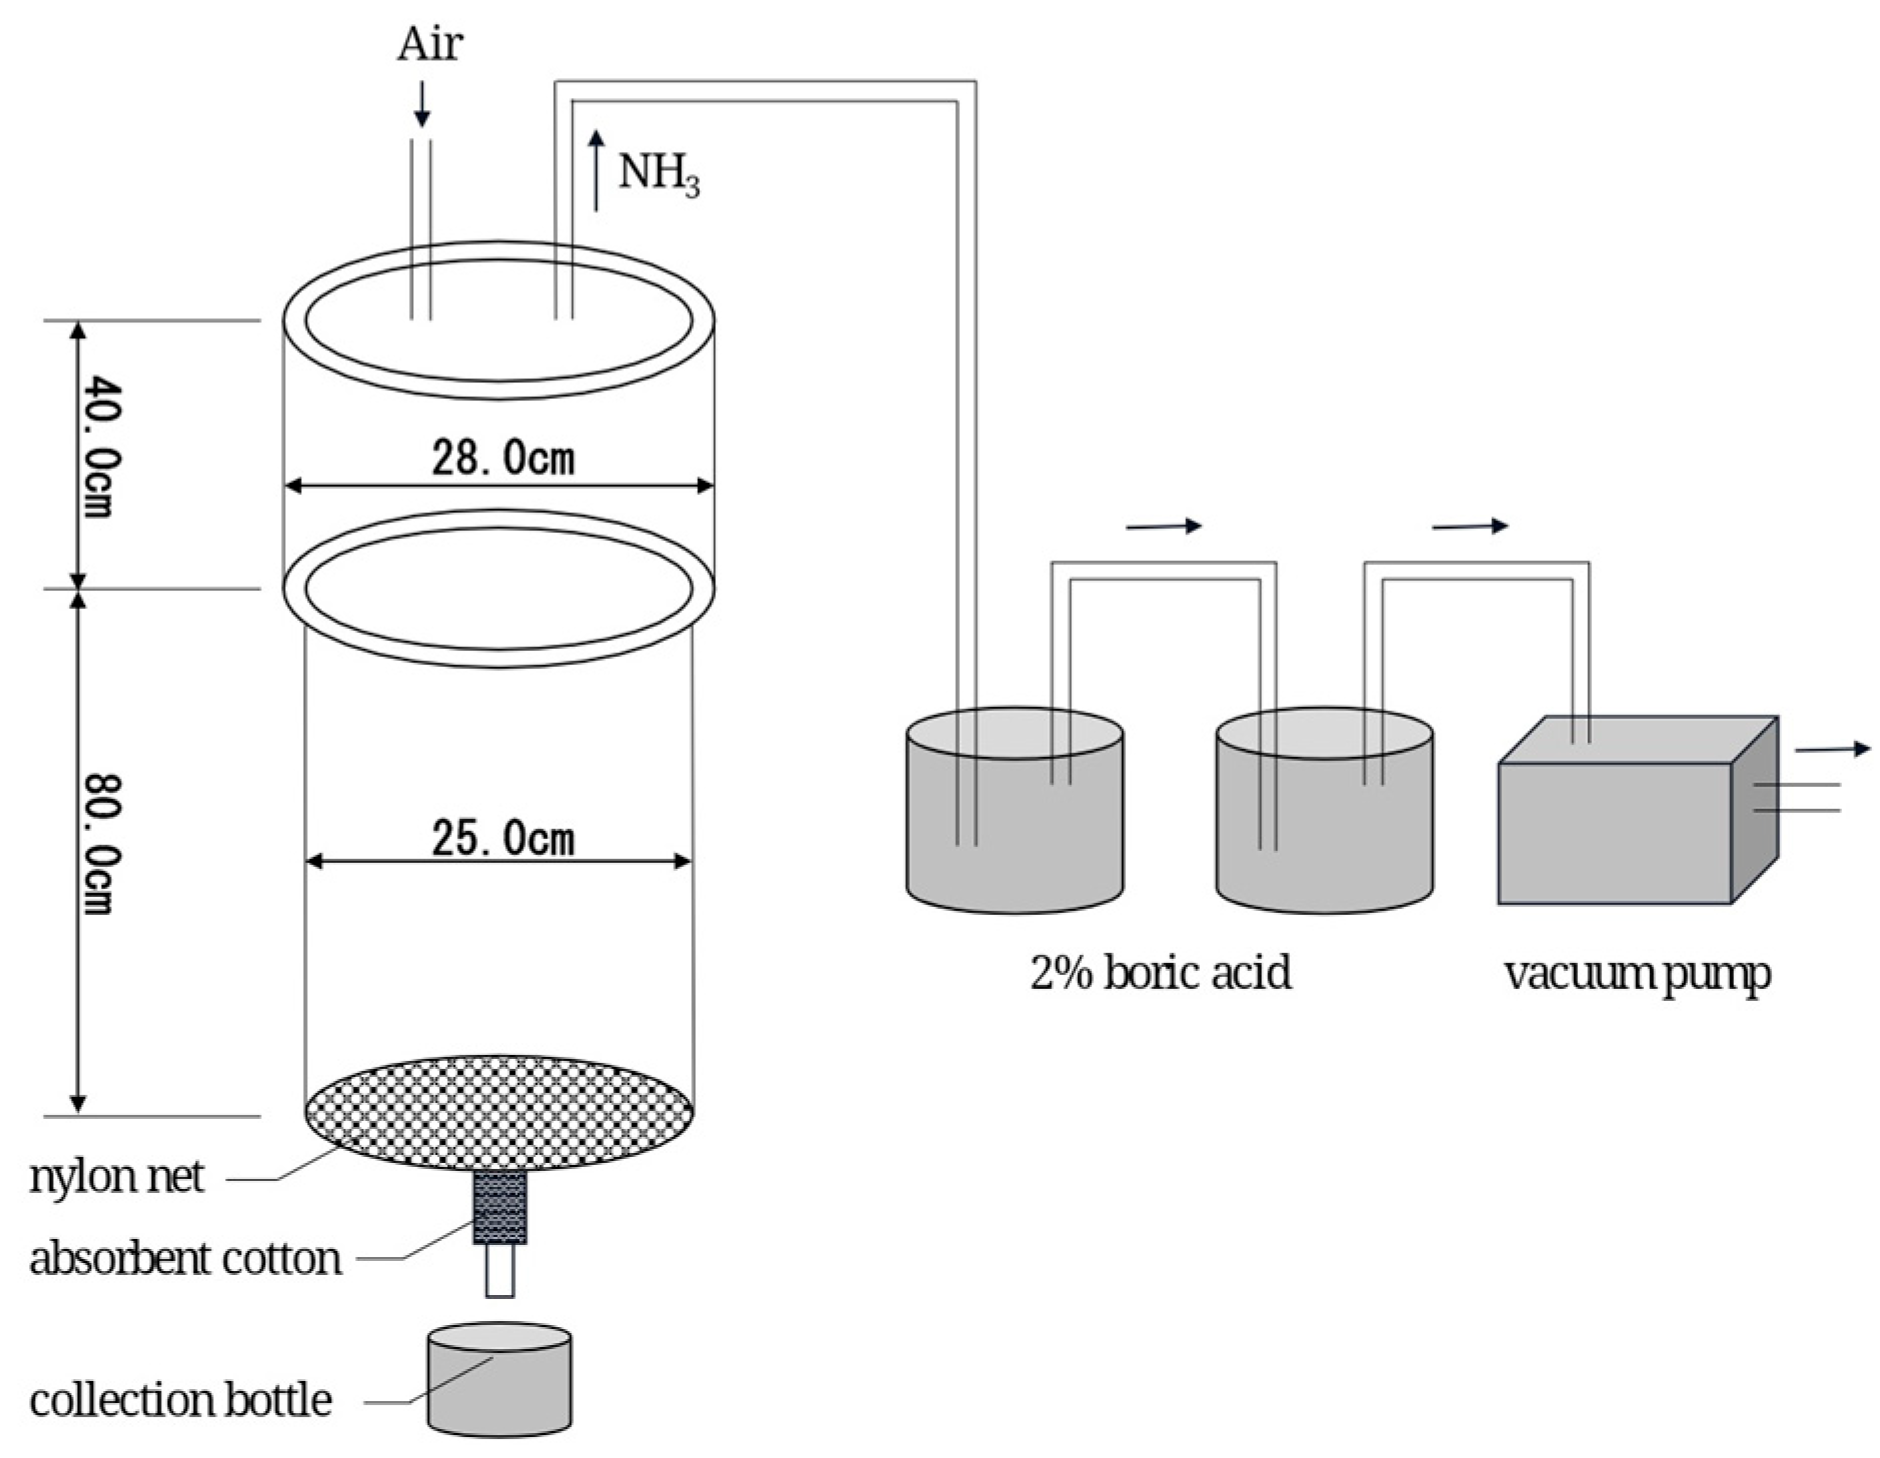
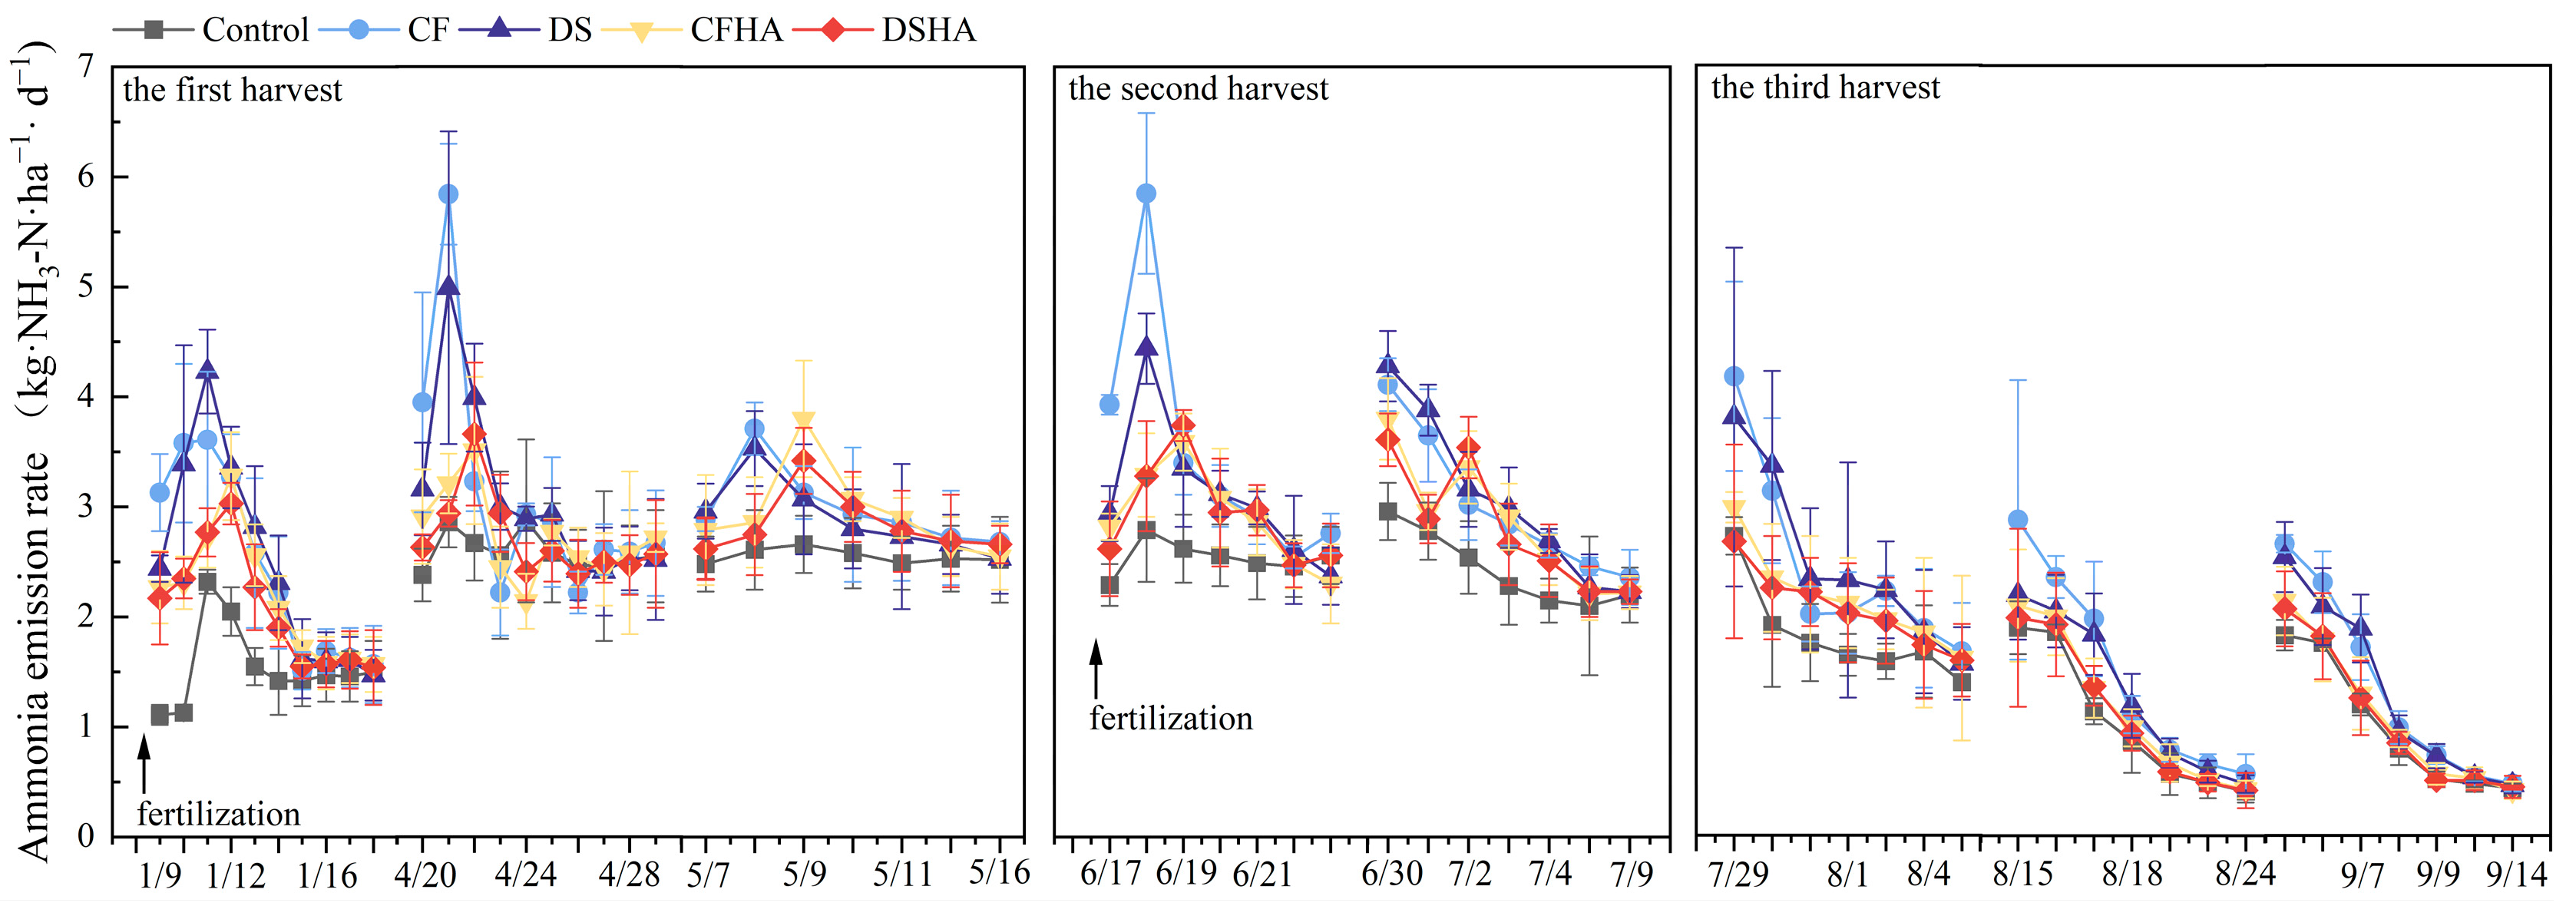
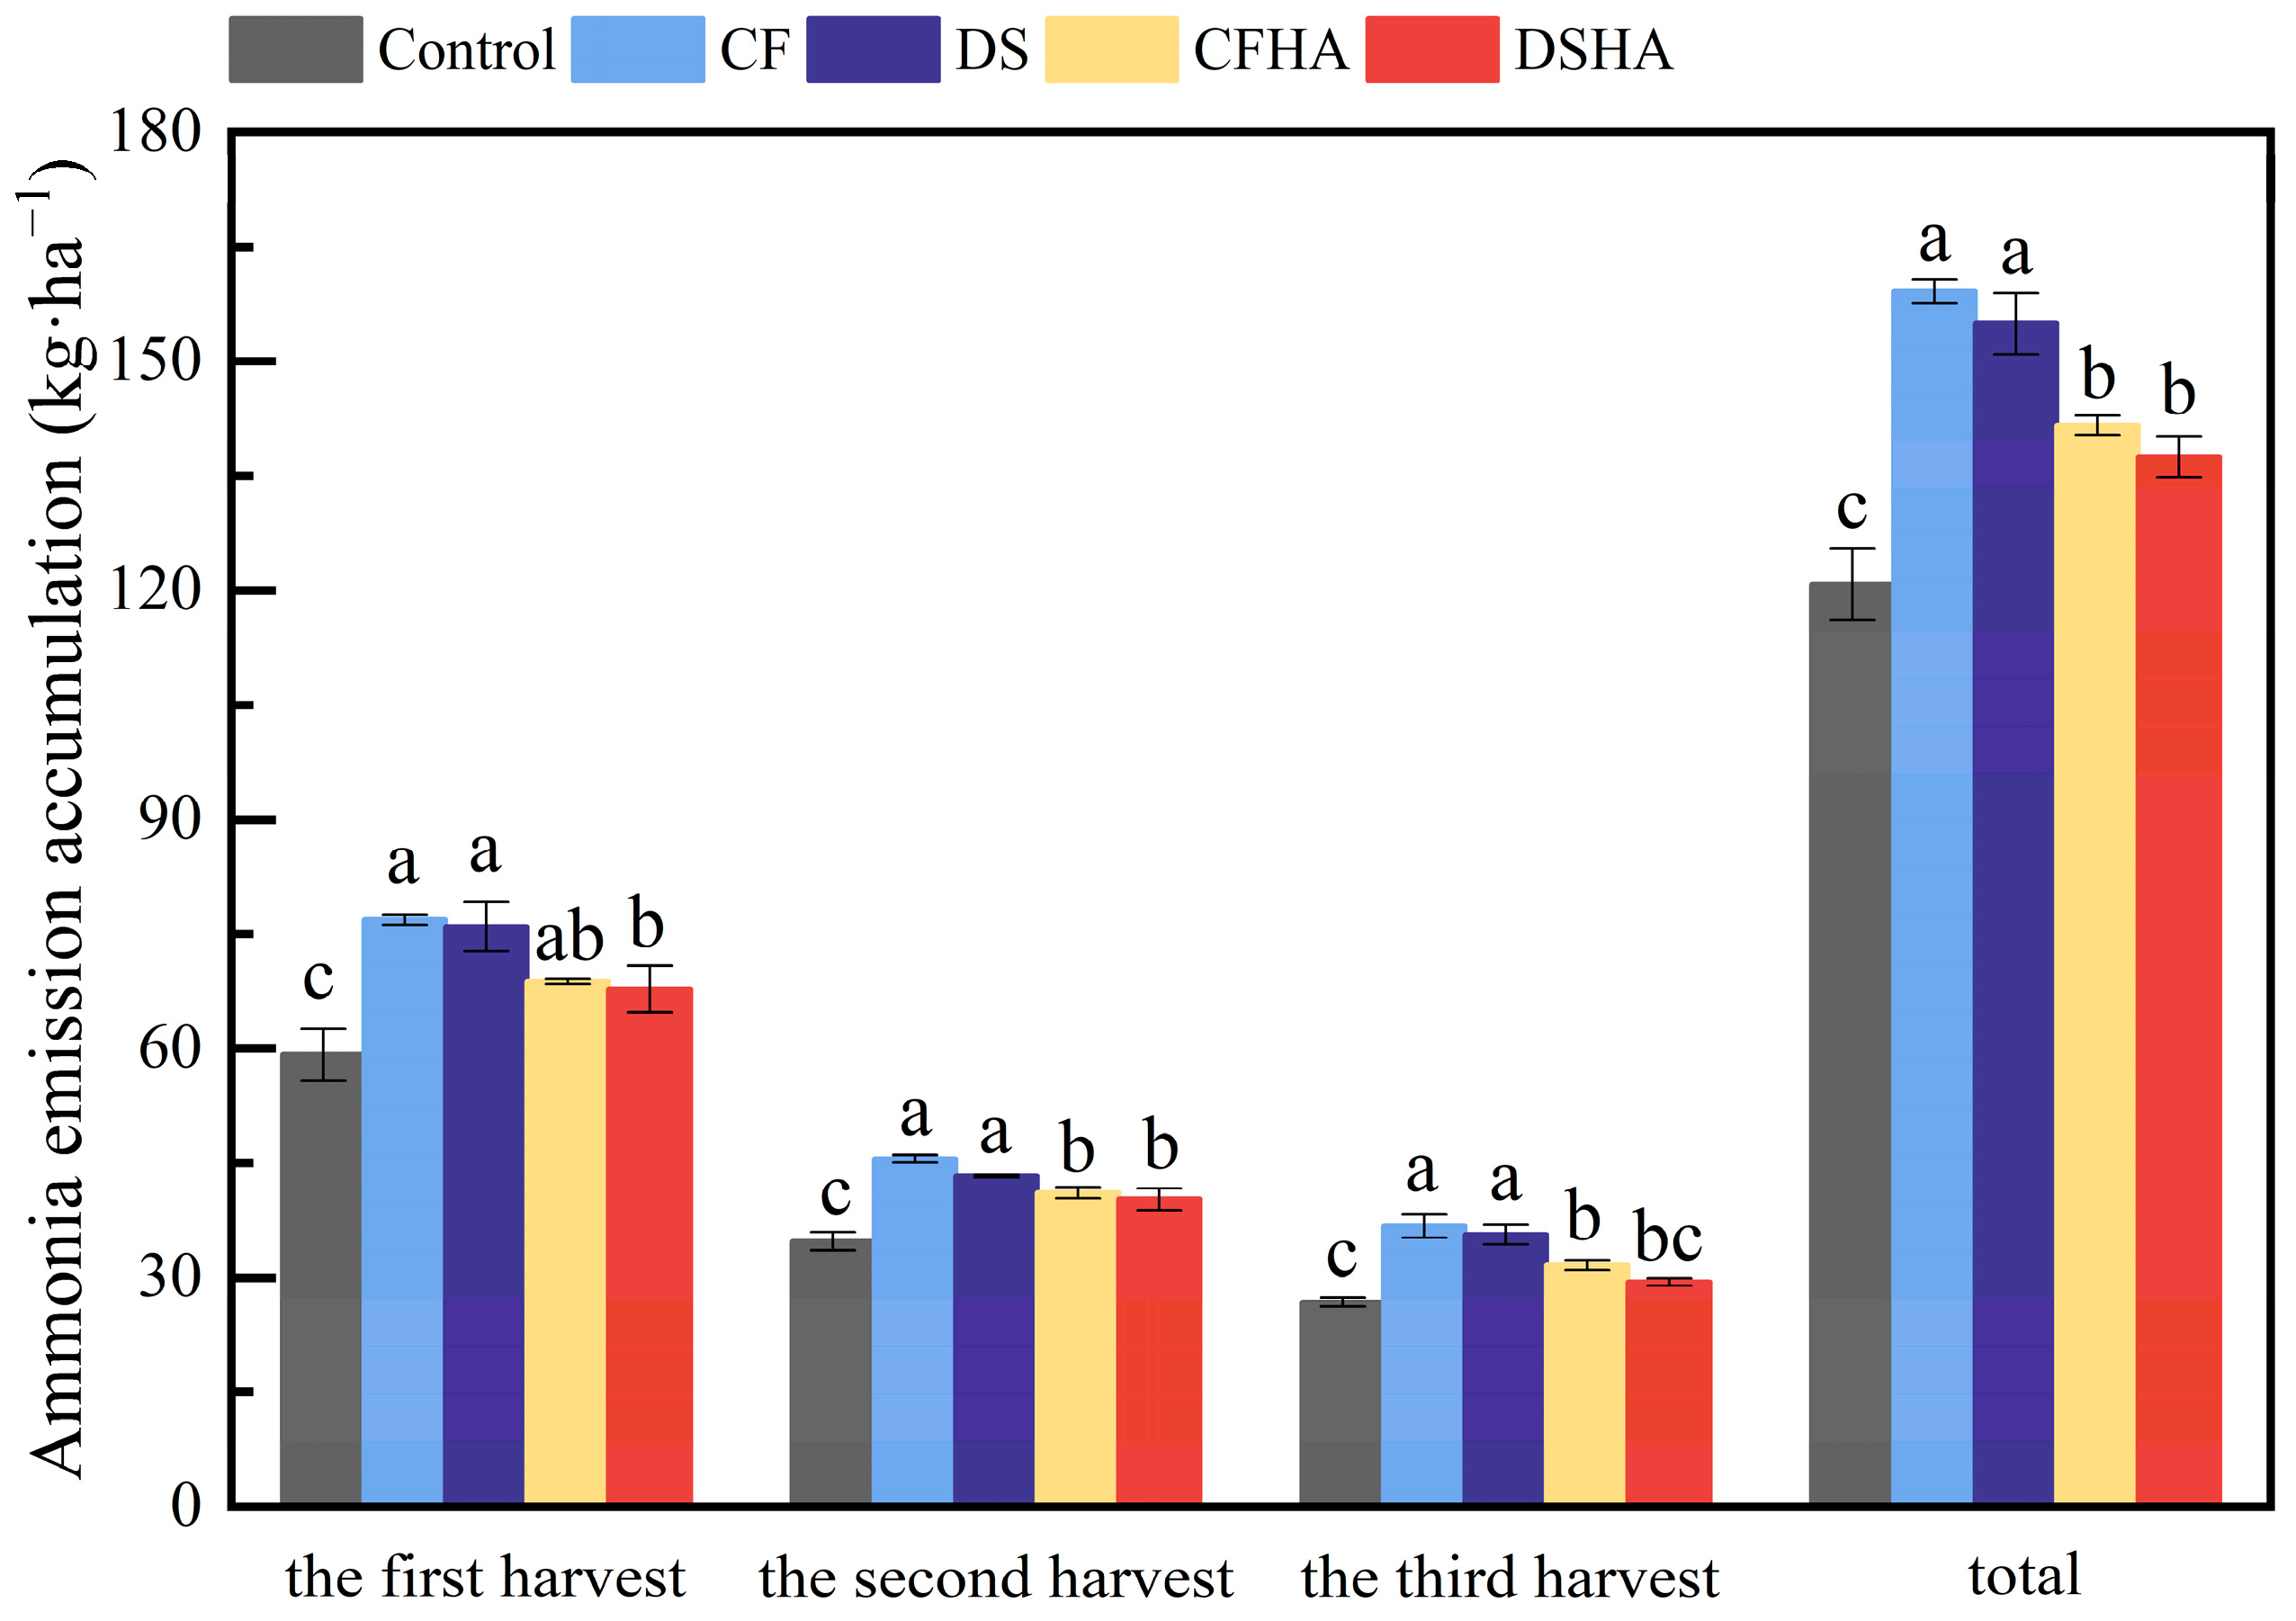
3.7. Ammonia Emissions

The ammonia emission rates for each treatment after fertilization and irrigation are shown in Figure 7. Compared to the Control treatment, fertilization significantly increased the ammonia emissions rate. During the first two harvest periods, the peak of the ammonia emission rate occurred between the second and fourth day after irrigation. The treatments with only fertilizers (CF and DS) reached the peak on the same day as the Control treatment, while the treatments with additional humic acids (CFHA and DSHA) reached the peak one day later and the peak was lower. During the third harvest, the peak of each treatment was observed on the day immediately following irrigation. During all the three harvests, the trend of ammonia volatilization rate was to increase initially, reach a peak, and then decrease until it became stable.
During the first alfalfa harvest, fertilization and the first irrigation were conducted simultaneously. The highest ammonia emission rates occurred on the third day for CF and DS, and on the fourth day after fertilization with CFHA and DSHA. For the second irrigation where no fertilizer was applied, ammonia emissions peaked for CF and DS at 5.84 kg·ha−1·d−1 and 4.99 kg·ha−1·d−1, respectively, while CFHA and DSHA peaked at 3.51 kg·ha−1·d−1 and 3.66 kg·ha−1·d−1, respectively. Similar ammonia emission patterns were observed after the third irrigation, and there was no significant difference between CF and DS. During the second alfalfa harvest, only two irrigations were conducted, and the ammonia emission trends were similar, peaking on the second day for CF and DS and on the third day for CFHA and DSHA. Ammonia emission rates were greatest after the first irrigation, which was combined with fertilizer application. Before the third harvest, three irrigations occurred without fertilizer application. The highest ammonia emission rates in all treatments occurred on the first day after irrigation and then decreased until the tenth day after irrigation, with no difference observed between the fertilization treatments and Control treatment.
Cumulative ammonia emissions in fertilizer treatments were significantly higher than in the Control treatment for all three alfalfa harvests (Figure 8). Under the same N application rate, there was no significant difference in the accumulative ammonia emission between the chemical fertilizer and dairy slurry treatments, and the accumulative ammonia emission was significantly decreased by adding humic acids. The results for each harvest also generally conformed to the trend above.

3.8. Nitrogen Leaching

The total N concentration in the leachate varied widely throughout the experiment (Figure 9a), peaking on the first day after irrigation (51.11–67.95 mg·L−1) and then gradually decreasing to the lowest concentration just before the next irrigation. Fertilization was combined with the first irrigation of both the first alfalfa harvest and second alfalfa harvest, resulting in significantly greater total N concentrations of fertilizer treatments on the first day after fertilization compared to other times. After the first fertilization, the total N concentration in the DS treatment ranged from 30.23 to 67.95 mg·L−1, similar to the CF treatment. However, adding humic acids significantly reduced the total N concentrations from both fertilization treatments. After the second fertilization, total N concentration in DS treatment ranged from 16.59 to 48.16 mg·L−1, which was significantly lowered by the addition of humic acids to the slurry.
The difference in nitrate N concentration between DS and CF treatments was not significant; however, the nitrate N concentration in leachate was significantly reduced after adding humic acids to both fertilization treatments (Figure 9b). Across the three alfalfa harvests, cumulative nitrate N leaching from the fertilizer treatments was significantly higher than the Control, with no notable difference among fertilizer treatments. Nevertheless, cumulative nitrate N leaching in DSHA and CFHA treatments was lower than that in the DS and CF treatments during the second and third harvest. During the first alfalfa harvest, the cumulative nitrate N leaching loss from fertilization application increased by 16.91–31.63% compared to the Control treatment. During the second harvest, nitrate N leaching loss from the fertilizer treatments was 56.65–74.59% greater than the Control, and it was 21.21–44.20% greater during the third alfalfa harvest. Nitrate N was the dominant form of N in the leachate, with cumulative leaching losses in CF, DS, CFHA, and DSHA treatments accounting for 79.41%, 76.20%, 79.66%, and 79.90% of total N, respectively. Throughout the three harvests (Figure 9c), ammonium N concentration in the leachate was low, never exceeding 0.5 mg·L−1 and with cumulative losses only ranging from 0.21 to 0.27 kg·ha−1.
The cumulative loss of total N in the DS treatment was not significantly different from that in the CF treatment under the same nutrient application rate (Figure 9d–f). Humic acid addition with fertilization resulted in a significant reduction in cumulative total N leaching losses for both the CF and DS fertilizers, as shown by CFHA and DSHA.

4. Discussion

4.1. The Impact of Applying Dairy Slurry with Humic Acids on the Production of Alfalfa

As alfalfa is a high-quality forage [48], its yield is crucial for the successful development of animal husbandry [49]. Being a leguminous plant, alfalfa can fix nitrogen, which theoretically reduces its reliance on soil mineral N [50]. However, multiple harvests in the same year deplete significant amounts of nutrients, requiring additional N supplementation to maintain high yields [51,52]. In this study, yields from all treatments with external N were significantly greater than the Control treatment, suggesting that N fixation was insufficient across three harvests. Even after only one harvest, it was not able to provide enough N to maintain high yields. Additionally, limited available soil N might also be affecting alfalfa growth. The proportion of organic N in cow manure must be mineralized by microorganisms before it becomes available to crops [53]. The mineralization rate of dairy slurry ranges from 10% to 30% [54], indicating that under the same N application rate (90 kg·ha−1), the plant-available N in the DS treatment was lower than in the CF treatment. Yet, no significant difference in yield was found between the two treatments. This could be due to the low dose of mineralized N from the slurry promoting growth, or that the excessive N supply from the CF treatment reduced alfalfa yield by promoting greater root–shoot ratios [55]. Another explanation could be that both CF and DS treatments satisfied the N requirements. The N provided by CF treatment was not excessive, but instead, it was the rich soil microbial community and organic matter in the dairy slurry that provided a sufficient release of plant-available N, allowing it to reach the same yield as the CF treatment [36,56]. Controlled-release fertilizers have been shown to better match plant N needs throughout the growing season, leading to greater yields while reducing N losses to the environment, leading to increased N availability for the plants [57]. Similarly, organic N in the DS may act somewhat like a controlled-release fertilizer, better matching plant needs and potentially reducing losses since nitrate is more soluble and leachable than organic nitrogen [58].
Previous research has indicated that adding humic acids can enhance crop yields, particularly when sufficient mineral nutrients are available [59,60]. However, other studies have shown that the benefits of humic acids on photosynthetic traits are primarily seen through foliar application [61]. In this study, the increase in yield is more likely due to the humic acids enhancing the soil organic matter. Li et al. [62] found that combining humic acids with chemical fertilizers improved the soil environments for crops growth by promoting beneficial microorganisms and reducing harmful effects, which is consistent with this study. However, their results also indicated that humic acid application enhanced the urease activity, which was not evident in the present study. This could be due to the complex soil environment caused by the growth of alfalfa roots or other specific properties and interactions between the functional groups of humic acids themselves and the thiol groups of ureases, which can form large-sized complexes that inhibit their activity [63,64]. Possibly, the decrease in urease activity may be due to the suppression of urease production caused by the activation of nitrification and denitrification processes [65]. Further experiments focusing on microorganisms and soil structure are needed to explore the mechanisms behind these observations.

4.2. The Impact of Applying Dairy Slurry with Humic Acids on the Nitrogen Loss

Dairy slurry contains a significant amount of ammonium N, accounting for up to 70% of total N [66]. The conversion from ammonium to nitrate forms in the soil is rapid and widespread under favorable conditions [67]. To minimize N loss, it is crucial to decrease ammonia volatilization and N leaching [68]. This study demonstrated that combining fertilizer application with humic acids significantly reduced ammonia emissions. The ammonia emission rates for all treatments, including the Control, increased initially to a peak on the second to fourth day and then decreased, which was consistent with the studies of Li et al. [44] and Pang et al. [69]. The addition of humic acids here both reduced the peak ammonia emissions and decreased the total amount of ammonia emissions. This finding aligned with Jatana et al. [70] and Gurgel et al. [71], which suggested that humic acids enhanced the soil’s capacity to retain NH4+. Notably, we found that the addition of humic acids delayed the peak of ammonia emission during the first two harvests, potentially due to interactions between urea and carbonyl and hydroxyl groups in humic acid molecules, which inhibit the nitrification and ammonification of urea in the soil, thus delaying the release of ammonia [72]. Using dairy slurry as an alternative to chemical fertilizers effectively slowed the release of ammonium N through mineralization of organic N, having a positive although not significant effect on reducing nitrate leaching. This indicated that the current dairy slurry fertilization rate and irrigation amounts were appropriate to avoid excessive nutrient supply that could lead to N leaching [73,74]. The reduction in ammonia emissions from the addition of humic acids could be due to the changes in soil pH caused by humic acids, as pH is an important factor affecting ammonia volatilization [75]. Further studies will continue to monitor soil pH after the application of fertilizers and irrigation to explore the effects of different dosages and application methods of humic acids on ammonia emission.
Previous studies have suggested that pH is an important factor in soil N leaching [76,77]. In this study, significant differences in soil pH were observed among the treatments during the second harvest, and these differences were accompanied by significant differences in yield. However, the second harvest showed no significant performance in other N loss indicators except for the lower ammonium N leaching, which was an insignificant amount of N. This could be due to the high temperatures during the second harvest period, shorter growth period, and larger single irrigation volumes, despite equal total irrigation across all harvest periods. According to existing research, both temperature and irrigation amount significantly affect alfalfa growth and soil N loss [78,79], suggesting the need to control these variables in future experiments to better understand their effects.

5. Conclusions

This study underscores the significance of nitrogen management in alfalfa cultivation, highlighting how the application of dairy slurry and humic acids can influence soil nitrogen dynamics and plant growth. The findings reveal that dairy slurry can effectively replace chemical fertilizers without jeopardizing yields or increasing nitrogen loss through ammonia emissions or nitrate leaching. We therefore recommend using dairy slurry instead of chemical fertilizers for alfalfa production in the North China Plain or other regions with similar climate and soil conditions. Furthermore, incorporating 5% humic acids with fertilization not only enhanced alfalfa yield but also effectively reduced nitrogen loss through both reduced ammonia volatilization and nitrate leaching, particularly when compared to chemical fertilizer use. Therefore, combining humic acids with dairy slurry is of great significance to promote the efficient and environmentally friendly production of alfalfa. Furthermore, the variations in yield and soil nitrogen parameters across different harvests emphasize the impact of environmental factors such as temperature and irrigation practices. Future research should focus on isolating these factors to better understand their roles in optimizing nitrogen utilization and alfalfa productivity under varying agricultural conditions.

Author Contributions

Conceptualization, H.D.; methodology, H.D.; formal analysis, Y.H. and L.D.; investigation, G.W., X.G. and F.L.; resources, K.Z.; data curation, H.D.; writing—original draft preparation, Y.H. and G.W.; writing—review and editing, H.S., E.S., F.L., X.G., H.D. and L.D.; visualization, Y.H. and H.S.; supervision, K.Z.; project administration, L.D. All authors have read and agreed to the published version of the manuscript.

Funding

This work was supported by National Key Research and Development Program of China (No.2023YFD1701703), the project of State Key Laboratory of Sheep Genetic Improvement and Healthy Production (2021ZD09), and the Central Public-interest Scientific Institution Basal Research Fund (Agro-Environmental Protection Institute, Ministry of Agriculture and Rural Affairs).

Institutional Review Board Statement

Not applicable.

Data Availability Statement

The data that support the findings of this study are available from the corresponding author upon reasonable request.

Conflicts of Interest

The authors declare no conflicts of interest.

References

  1. Özköse, A. Effect of environment × cultivar interaction on protein and mineral contents of Alfalfa (Medicago sativa L.) in Central Anatolia, Turkey. Sains Malays. 2018, 47, 551–562. [Google Scholar] [CrossRef]
  2. Wang, T.; Zhong, J. Creating modern technological system for grass product processing to guarantee macroscopic food security. Bull. Chin. Acad. Sci. 2021, 36, 675–684. (In Chinese) [Google Scholar] [CrossRef]
  3. Wang, Q.; Zou, Y. China’s alfalfa market and imports: Development, trends, and potential impacts of the US–China trade dispute and retaliations. J. Integr. Agric. 2020, 19, 1149–1158. [Google Scholar] [CrossRef]
  4. Feng, Y.; Shi, Y.; Zhao, M.; Shen, H.; Xu, L.; Luo, Y.; Liu, Y.; Xing, A.; Kang, J.; Jing, H.; et al. Yield and quality properties of alfalfa (Medicago sativa L.) and their influencing factors in China. Eur. J. Agron. 2022, 141, 126637. [Google Scholar] [CrossRef]
  5. Shi, S.; Nan, L.; Smith, K.F. The current status, problems, and prospects of alfalfa (Medicago sativa L.) breeding in China. Agronomy 2017, 7, 1. [Google Scholar] [CrossRef]
  6. Wan, W.; Li, Y.; Li, H. Yield and quality of alfalfa (Medicago sativa L.) in response to fertilizer application in China: A meta-analysis. Front. Plant Sci. 2022, 13, 1051725. [Google Scholar] [CrossRef]
  7. Liu, W.; Liu, L.; Gao, J.; Wu, S.; Liu, Y. Evaluation of the effectiveness of irrigation methods and fertilization strategies for alfalfa: A meta-analysis. J. Agron. Crop Sci. 2023, 6, 788–801. [Google Scholar] [CrossRef]
  8. Wang, X.; Yu, X.; Shen, Y.; Zhang, Q.; Li, Y. Fertilization increased alfalfa yield and nutritive value in northern China: A Meta-analysis. Pratacultural Sci. 2023, 40, 208–217. (In Chinese) [Google Scholar] [CrossRef]
  9. Zhang, Q.; Chu, Y.; Yin, Y.; Ying, H.; Zhang, F.; Cui, Z. Comprehensive assessment of the utilization of manure in China’s croplands based on national farmer survey data. Sci. Data 2023, 10, 223. [Google Scholar] [CrossRef]
  10. Chadwick, D.; Wei, J.; Yan’an, T.; Guanghui, Y.; Qirong, S.; Qing, C. Improving manure nutrient management towards sustainable agricultural intensification in China. Agric. Ecosyst. Environ. 2015, 209, 34–46. [Google Scholar] [CrossRef]
  11. Pain, B.; Menzi, H. Glossary of Terms on Livestock and Manure Management, 2nd ed.; Ramiran: Hamburg, Germany, 2011; p. 80. [Google Scholar]
  12. Zhang, K.; Du, L.; Du, H.; Shen, S. Application of livestock and poultry waste to agricultural land: A review. J. Agric. Environ. Sci. 2021, 11, 2472–2481+2591. (In Chinese) [Google Scholar] [CrossRef]
  13. Dong, H.; Zuo, L.; Wei, S.; Zhu, Z.; Yin, F. Establish manure nutrient management plan to promote green development of integrated crop-livestock production system. Bull. Chin. Acad. Sci. 2019, 34, 180–189. (In Chinese) [Google Scholar] [CrossRef]
  14. Lourenzi, C.; Ceretta, C.; Brunetto, G.; Girotto, E.; Tiecher, T.; Vieira, R.; Cancian, A.; Ferreira, P. Pig slurry and nutrient accumulation and dry matter and grain yield in various crops. Rev. Bras. De Cienc. Do Solo 2014, 38, 949–958. [Google Scholar] [CrossRef]
  15. Du, Y.; Cui, B.; Wang, Z.; Sun, J.; Niu, W. Effects of manure fertilizer on crop yield and soil properties in China: A meta-analysis. Catena 2020, 193, 104617. [Google Scholar] [CrossRef]
  16. Stoltz, E.; Nadeau, E. Effects of intercropping on yield, weed incidence, forage quality and soil residual N in organically grown forage maize (Zea mays L.) and faba bean (Vicia faba L.). Field Crop. Res. 2014, 169, 21–29. [Google Scholar] [CrossRef]
  17. De, C.; Ceretta, C.; Ferreira, P.; Lorensini, F.; Lourenzi, C.; Vidal, R.; Tassinari, A.; Brunetto, G. Effects of pig slurry application and crops on phosphorus content in soil and the chemical species in solution. Rev. Bras. De Cienc. Do Solo 2015, 39, 774–787. [Google Scholar] [CrossRef]
  18. Park, S.; Lee, B.; Cho, W.; Kim, T. Comparative nitrogen use efficiency of urea and pig slurry for regrowth yield and nutritive value in perennial ryegrass sward. Asian Australas. J. Anim. 2017, 30, 514. [Google Scholar] [CrossRef]
  19. Shi, Y.; Ziadi, N.; Hamel, C.; Bittman, S.; Hunt, D.; Lalande, R.; Shang, J. Soil microbial biomass, activity, and community composition as affected by dairy manure slurry applications in grassland production. Appl. Soil Ecol. 2018, 125, 97–107. [Google Scholar] [CrossRef]
  20. Shakoor, A.; Bosch-Serra, À.D.; Alberdi, J.R.O.; Herrero, C. Seven years of pig slurry fertilization: Impacts on soil chemical properties and the element content of winter barley plants. Environ. Sci. Pollut. Res. 2022, 29, 74655–74668. [Google Scholar] [CrossRef]
  21. Abubaker, J.; Alaswd, A.; Mohammed, N.S.; Zeadani, H.E.; Khalifa, M. Alfalfa (Medicago sativa L.) growth and yield in desert soil fertilized with raw and anaerobically digested cattle manure. J. Plant Nutr. 2021, 45, 992–1003. [Google Scholar] [CrossRef]
  22. Lin, F.; Liu, X.; Tong, C.; Wu, Y. Characteristics of light energy utilization of intercropping alfalfa/Gramineae forage based on yield effect. Chin. J. Appl. Ecol. 2020, 31, 2963–2976. (In Chinese) [Google Scholar] [CrossRef]
  23. Zhang, G.; Liu, Q.; Zhang, Z.; Ci, D.; Zhang, J.; Xu, Y.; Guo, Q.; Xu, M.; He, K. Effect of Reducing Nitrogen Fertilization and Adding Organic Fertilizer on Net Photosynthetic Rate, Root Nodules and Yield in Peanut. Plants 2023, 12, 2902. [Google Scholar] [CrossRef]
  24. Vasileva, V.; Kostov, O. Effect of mineral and organic fertilization on alfalfa forage and soil fertility. Emir. J. Food Agric. 2015, 27, 678–686. [Google Scholar] [CrossRef]
  25. Huddell, A.; Galford, G.; Tully, K.; Crowley, C.; Palm, C.; Neill, C.; Menge, D. Meta-analysis on the potential for increasing nitrogen losses from intensifying tropical agriculture. Glob. Change Biol. 2020, 26, 1668–1680. [Google Scholar] [CrossRef]
  26. Cheng, J.; Chen, Y.; He, T.; Liu, R.; Yi, M.; Yang, Z. Nitrogen leaching losses following biogas slurry irrigation to purple soil of the Three Gorges Reservoir Area. Environ. Sci. Pollut. Res. 2015, 25, 29096–29103. [Google Scholar] [CrossRef]
  27. Gronwald, M.; Helfrich, M.; Don, A.; Fuß, R.; Well, R.; Flessa, H. Application of hydrochar and pyrochar to manure is not effective for mitigation of ammonia emissions from cattle slurry and poultry manure. Biol. Fertil. Soils 2018, 54, 451–465. [Google Scholar] [CrossRef]
  28. Pedersen, J.; Nyord, T.; Feilberg, A.; Labouriau, R.; Hunt, D.; Bittman, S. Effect of reduced exposed surface area and enhanced infiltration on ammonia emission from untreated and separated cattle slurry. Biosyst. Eng. 2021, 211, 141–151. [Google Scholar] [CrossRef]
  29. Hou, R.; Li, T.; Fu, Q.; Liu, D.; Li, M.; Zhou, Z.; Li, Q.; Zhao, H.; Yu, P.; Yan, J. The effect on soil nitrogen mineralization resulting from biochar and straw regulation in seasonally frozen agricultural ecosystem. J. Clean. Prod. 2020, 255, 120302. [Google Scholar] [CrossRef]
  30. Ministry of Ecology and Environment of the People’s Republic of China, 2017, Bulletin of the Second National Pollution Source Census. Available online: https://www.mee.gov.cn/home/ztbd/rdzl/wrypc/zlxz/202006/t20200616_784745.html (accessed on 16 June 2024).
  31. Klammler, G.; Fank, J. Determining water and nitrogen balances for beneficial management practices using lysimeters at Wagna test site (Austria). Sci. Total Environ. 2014, 499, 448–462. [Google Scholar] [CrossRef]
  32. Wang, X.; Di, H.; Cameron, K.; Li, B. Effect of treated farm dairy effluent on E. coli, phosphorus and nitrogen leaching and greenhouse gas emissions: A field lysimeter study. J. Soils Sediments 2019, 19, 2303–2312. [Google Scholar] [CrossRef]
  33. Rychel, K.; Meurer, K.; Getahun, G.; Bergström, L.; Kirchmann, H.; Kätterer, T. Lysimeter deep N fertilizer placement reduced leaching and improved N use efficiency. Nutr. Cycl. Agroecosyst. 2023, 126, 213–228. [Google Scholar] [CrossRef]
  34. Gu, L.; Liu, T.; Wang, J.; Liu, P.; Dong, S.; Zhao, B.; So, H.; Zhang, J.; Li, J. Lysimeter study of nitrogen losses and nitrogen use efficiency of Northern Chinese wheat. Field Crop. Res. 2016, 188, 82–95. [Google Scholar] [CrossRef]
  35. Karimi, R.; Akinremi, W.; Flaten, D. Cropping system and type of pig manure affect nitrate-nitrogen leaching in a sandy loam soil. J. Environ. Qual. 2017, 46, 785–792. [Google Scholar] [CrossRef] [PubMed]
  36. de Melo, B.; Motta, F.; Santana, M. Humic acids: Structural properties and multiple functionalities for novel technological developments. Mater. Sci. Eng. C 2016, 62, 967–974. [Google Scholar] [CrossRef]
  37. Wang, R.; Li, D.; Deng, F.; Cao, Z.; Zheng, G. Production of artificial humic acid from rice straw for fertilizer production and soil improvement. Sci. Total Environ. 2024, 906, 167548. [Google Scholar] [CrossRef] [PubMed]
  38. Fangueiro, D.; Surgy, S.; Fraga, I.; Vasconcelos, E.; Coutinho, J. Acid treatment of animal slurries: Potential and limitations. In Proceedings-International Fertiliser Society. Int. Fert. Soc. 2015, 775, 1–24. [Google Scholar] [CrossRef]
  39. Zhi, Y.; Li, X.; Wang, X.; Jia, M.; Wang, Z. Photosynthesis promotion mechanisms of artificial humic acid depend on plant types: A hydroponic study on C3 and C4 plants. Sci. Total Environ. 2024, 917, 170404. [Google Scholar] [CrossRef]
  40. Baghaie, A.H.; Aghili, F. Contribution of piriformospora indica on improving the nutritional quality of greenhouse tomato and its resistance against cu toxicity after humic acid addition to soil. Environ. Sci. Pollut. Res. 2021, 28, 64572–64585. [Google Scholar] [CrossRef] [PubMed]
  41. Liu, J.; Xie, W.; Yang, J.; Yao, R.; Wang, X.; Li, W. Effect of Different Fertilization Measures on Soil Salinity and Nutrients in Salt-Affected Soils. Water 2023, 15, 3274. [Google Scholar] [CrossRef]
  42. Feng, X.; Zhang, L. Vermiculite and humic acid improve the quality of green waste compost as a growth medium for Centaurea cyanus L. Environ. Technol. Innov. 2021, 24, 101945. [Google Scholar] [CrossRef]
  43. Guo, Y.; Ma, Z.; Ren, B.; Zhao, B.; Liu, P.; Zhang, J. Effects of humic acid added to controlled-release fertilizer on summer maize yield, nitrogen use efficiency and greenhouse gas emission. Agriculture 2022, 12, 448. [Google Scholar] [CrossRef]
  44. Li, N.; Yang, Y.; Wu, Y.; Liu, B.; Tao, L.; Zhan, Y.; Ni, X.; Yang, Y. Better performance of compound fertilizers than bulk-blend fertilizers on reducing ammonia emission and improving wheat productivity. Agric. Ecosyst. Environ. 2022, 335, 108018. [Google Scholar] [CrossRef]
  45. Fangueiro, D.; Pereira, J.; Bichana, A.; Surgy, S.; Cabral, F.; Coutinho, J. Effects of cattle-slurry treatment by acidification and separation on nitrogen dynamics and global warming potential after surface application to an acidic soil. J. Environ. Manag. 2015, 162, 1–8. [Google Scholar] [CrossRef] [PubMed]
  46. Technical Regulations for Soil Testing and Fertilization in Grassland Alfalfa. Available online: https://hbba.sacinfo.org.cn/stdDetail/323920d1219b9c18ffd0da6e5444dd6c2fd76044231571a2651be9f927fb16f0 (accessed on 16 June 2024).
  47. Soil Testing Part 6: Method for Determination of Soil Organic Matter. Available online: https://hbba.sacinfo.org.cn/stdDetail/8c5969f13e0acfbaf685a468a20e6f92b028b4c34fce864c83d6916c47287abe (accessed on 16 June 2024).
  48. Dhakal, M.; West, C.; Villalobos, C.; Sarturi, J.; Deb, S. Trade-off between nutritive value improvement and crop water use for an alfalfa–grass system. Crop Sci. 2020, 60, 1711–1723. [Google Scholar] [CrossRef]
  49. Noland, R.; Wells, M.; Coulter, J.; Tiede, T.; Baker, J.; Martinson, K.; Sheaffer, C. Estimating alfalfa yield and nutritive value using remote sensing and air temperature. Field Crop. Res. 2018, 222, 189–196. [Google Scholar] [CrossRef]
  50. Aung, B.; Gao, R.; Gruber, M.; Yuan, Z.; Sumarah, M.; Hannoufa, A. MsmiR156 affects global gene expression and promotes root regenerative capacity and nitrogen fixation activity in alfalfa. Transgenic Res. 2017, 26, 541–557. [Google Scholar] [CrossRef] [PubMed]
  51. Lu, J.; Yang, M.; Liu, M.; Lu, Y.; Yang, H. Nitrogen and phosphorus fertilizations alter nitrogen, phosphorus and potassium resorption of alfalfa in the Loess Plateau of China. J. Plant Nutr. 2019, 42, 2234–2246. [Google Scholar] [CrossRef]
  52. McDonald, I.; Baral, R.; Min, D. Effects of alfalfa and alfalfa-grass mixtures with nitrogen fertilization on dry matter yield and forage nutritive value. J. Anim. Sci. Technol. 2021, 63, 305. [Google Scholar] [CrossRef] [PubMed]
  53. Sradnick, A.; Feller, C. A typological concept to predict the nitrogen release from organic fertilizers in farming systems. Agronomy 2020, 10, 1448. [Google Scholar] [CrossRef]
  54. Bhogal, A.; Williams, J.; Nicholson, F.; Chadwick, D.; Chambers, K.; Chambers, B. Mineralization of organic nitrogen from farm manure applications. Soil Use Manag. 2016, 32, 32–34. [Google Scholar] [CrossRef]
  55. Hua, W.; Luo, P.; An, N.; Cai, F.; Zhang, S.; Chen, K.; Yang, J.; Han, X. Manure application increased crop yields by promoting nitrogen use efficiency in the soils of 40-year soybean-maize rotation. Sci. Rep. 2020, 10, 14882. [Google Scholar] [CrossRef]
  56. Pandey, B.; Chen, L. Technologies to recover nitrogen from livestock manure-A review. Sci. Total Environ. 2021, 784, 147098. [Google Scholar] [CrossRef]
  57. Ransom, C.; Jolley, V.; Blair, T.; Sutton, L.; Hopkins, B. Nitrogen release rates from slow- and controlled-release fertilizers influenced by placement and temperature. PLoS ONE 2020, 15, e0234544. [Google Scholar] [CrossRef]
  58. Sun, H.; Zhou, S.; Zhang, J.; Zhang, X.; Wang, C. Effects of controlled-release fertilizer on rice grain yield, nitrogen use efficiency, and greenhouse gas emissions in a paddy field with straw incorporation. Field Crop. Res. 2020, 253, 107814. [Google Scholar] [CrossRef]
  59. Dogan, Y.; Togay, Y.; Togay, N.; Kulaz, H. Effect of humic acid and phosphorus applications on the yield and yield components in lentil (Lens culinaris Medic.). Legume Res. Int. J. 2014, 37, 316–320. [Google Scholar] [CrossRef]
  60. Mosaad, I.; Serag, A.; Sheta, M. Promote sugar beet cultivation in saline soil by applying humic substances in-soil and mineral nitrogen fertilization. J. Plant Nutr. 2022, 45, 2447–2464. [Google Scholar] [CrossRef]
  61. Yang, M.; Zhang, L.; Xu, S.; Neil, B.; Liu, J. Effect of water soluble humic acid applied to potato foliage on plant growth, photosynthesis characteristics and fresh tuber yield under different water deficits. Sci. Rep. 2020, 10, 7854. [Google Scholar] [CrossRef]
  62. Li, Y.; Fang, F.; Wei, J.; Wu, X.; Cui, R.; Li, G.; Zheng, F.; Tan, D. Humic acid fertilizer improved soil properties and soil microbial diversity of continuous cropping peanut: A three-year experiment. Sci. Rep. 2019, 9, 12014. [Google Scholar] [CrossRef]
  63. Li, Y.; Koopal, L.; Chai, Y.; Tan, W.; Wu, C.; Tang, X.; Chen, Y. Spectroscopic investigation of conformational changes in urease caused by interaction with humic acid. Colloids Surf. B 2022, 215, 112510. [Google Scholar] [CrossRef]
  64. Liu, X.; Zhang, M.; Li, Z.; Zhang, C.; Wan, C.; Zhang, Y.; Lee, D. Inhibition of urease activity by humic acid extracted from sludge fermentation liquid. Bioresour. Technol. 2019, 290, 121767. [Google Scholar] [CrossRef]
  65. Aon, M.; Cabello, M.; Sarena, D.; Colaneri, A.; Franco, M.; Burgos, J.; Cortassa, S. Spatio-temporal patterns of soil microbial and enzymatic activities in an agricultural soil. Appl. Soil Ecol. 2001, 18, 239–254. [Google Scholar] [CrossRef]
  66. Fu, L.; Wang, G.; Du, H.; Zhang, K. Effect of slurry application on soil ammonia volatilization and response factors. J. Agric. Resour. Environ. 2020, 06, 931–938. (In Chinese) [Google Scholar] [CrossRef]
  67. Kupper, T.; Häni, C.; Neftel, A.; Kincaid, C.; Bühler, M.; Amon, B.; VanderZaag, A. Ammonia and greenhouse gas emissions from slurry storage-A review. Agric. Ecosyst. Environ. 2020, 300, 106963. [Google Scholar] [CrossRef]
  68. Zhou, M.; Ying, S.; Chen, J.; Jiang, P.; Teng, Y. Effects of biochar-based fertilizer on nitrogen use efficiency and nitrogen losses via leaching and ammonia volatilization from an open vegetable field. Environ. Sci. Pollut. Res. 2021, 28, 65188–65199. [Google Scholar] [CrossRef] [PubMed]
  69. Pang, L.; Song, F.; Song, X.; Guo, X.; Lu, Y.; Chen, S.; Zhu, F.; Zhang, N.; Zou, J.; Zhang, P. Effects of different types of humic acid isolated from coal on soil NH3 volatilization and CO2 emissions. Environ. Res. 2021, 194, 110711. [Google Scholar] [CrossRef] [PubMed]
  70. Jatana, B.S.; Gami, S.K.; Ketterings, Q.M. Assessing the Impact of Mixing Acid Whey With Dairy Manure On pH and Nitrogen Dynamics During Manure Handling. J. Soil Sci. Plant Nutr. 2023, 23, 2878–2890. [Google Scholar] [CrossRef]
  71. Gurgel, G.; Ferrari, A.; Fontana, A.; Polidoro, J.; Coelho, L.; Zonta, E. Ammonia volatilization from mixed mineral fertilizers containing urea. Pesqui. Agropecu. Bras. 2016, 51, 1686–1694. [Google Scholar] [CrossRef]
  72. Shen, Y.; Lin, H.; Gao, W.; Li, M. The effects of humic acid urea and polyaspartic acid urea on reducing nitrogen loss compared with urea. J. Sci. Food Agric. 2020, 100, 4425–4432. [Google Scholar] [CrossRef] [PubMed]
  73. Demurtas, C.; Seddaiu, G.; Ledda, L.; Cappai, C.; Doro, L.; Carletti, A.; Roggero, P. Replacing organic with mineral N fertilization does not reduce nitrate leaching in double crop forage systems under Mediterranean conditions. Agric. Ecosyst. Environ. 2016, 219, 83–92. [Google Scholar] [CrossRef]
  74. Du, H.; Gao, W.; Li, J.; Shen, S.; Wang, F.; Fu, L.; Zhang, K. Effects of digested biogas slurry application mixed with irrigation water on nitrate leaching during wheat-maize rotation in the North China Plain. Agric. Water Manag. 2019, 213, 882–893. [Google Scholar] [CrossRef]
  75. Kim, S.; Heo, W.; Lee, S.; Han, B.; Lee, H.; Kim, Y. Characterisitcs of Saccharomyces boulardii for reducing ammonia emission from livestock manure. Appl. Biol. Chem. 2021, 64, 30. [Google Scholar] [CrossRef]
  76. Kemmitt, S.; Wright, D.; Jones, D. Soil acidification used as a management strategy to reduce nitrate losses from agricultural land. Soil Biol. Biochem. 2005, 37, 867–875. [Google Scholar] [CrossRef]
  77. Shahraki, Z.; Mao, X.; Waugh, S.; Lotfikatouli, S.; Walker, H.; Gobler, C.; Wanlass, J. Potential release of legacy nitrogen from soil surrounding onsite wastewater leaching pools. Water Res. 2020, 169, 115241. [Google Scholar] [CrossRef]
  78. Elgharably, A.; Benes, S. Alfalfa biomass yield and nitrogen fixation in response to applied mineral nitrogen under saline soil conditions. J. Soil Sci. Plant Nutr. 2021, 21, 744–755. [Google Scholar] [CrossRef]
  79. Zhang, Y.; Pan, B.; Lam, S.; Bai, E.; Hou, P.; Chen, D. Predicting the ratio of nitrification to immobilization to reflect the potential risk of nitrogen loss worldwide. Environ. Sci. Technol. 2021, 55, 7721–7730. [Google Scholar] [CrossRef]
Figure 1. Ammonia emission and leaching solution collection device. The arrows in the figure indicate the direction of airflow.
Agriculture 14 01208 g001
Figure 2. The growth rate of alfalfa during each harvest. (a) The plant height of alfalfa in three harvest stage; (b) the stem diameter of alfalfa in the three harvest stages; (c) the leaf width of alfalfa in three harvest stages.
Agriculture 14 01208 g002
Figure 3. The growth rate photosynthesis characteristics of alfalfa in each stage. (a) The net photosynthetic rate (Pn) of alfalfa in each stage; (b) the stomatal conductance (Gs) of alfalfa; (c) the intercellular CO2 concentration (Ci) of alfalfa; (d) the transpiration rate (Tr) of alfalfa; (e) the leaf water use efficiency (WUE) of alfalfa; (f) the light use efficiency (LUE) of alfalfa. Different lowercase letters indicate significant (p < 0.05) differences between treatments. Error bars indicate standard deviations (n = 4).
Agriculture 14 01208 g003
Figure 4. Effect of the treatments on soil organic matter measured directly after each harvest in the top layer (0–20 cm). Different lowercase letters indicate significant (p < 0.05) differences between treatments. Error bars indicate standard deviations (n = 4).
Agriculture 14 01208 g004
Figure 5. Nitrogen content in different forms within the 0–20 cm soil layer. (a) The total nitrogen content in soil; (b) the nitrate nitrogen content in soil; (c) the ammonium nitrogen content in soil. Different lowercase letters indicate significant (p < 0.05) differences between treatments. Error bars indicate standard deviations (n = 4).
Agriculture 14 01208 g005
Figure 6. The relationships between alfalfa yield and soil physicochemical properties. * Represents a significant relationship between two indicators (p < 0.05). (a) The relationships in the first harvest; (b) the relationships in the second harvest; (c) the relationships in the third harvest. In this figure, OM means soil organic matter, UA means soil urease activity, TN means soil total nitrogen, PH means the plant height of alfalfa, SD means the stem diameter, and LW means the leaf width.
Agriculture 14 01208 g006
Figure 7. The effect of dairy slurry with humic acids on ammonia emission rate.
Agriculture 14 01208 g007
Figure 8. The accumulation of ammonia emission. Different lowercase letters indicate significant (p < 0.05) differences between treatments. Error bars indicate standard deviations (n = 4).
Agriculture 14 01208 g008
Figure 9. Nitrogen concentration and the total amount of different forms in leachate. (a) The total nitrogen concentration; (b) the nitrate nitrogen concentration; (c) the ammonium nitrogen concentration; (d) the total nitrogen amount; (e) the nitrate nitrogen amount; (f) the ammonium nitrogen amount. Different lowercase letters indicate significant (p < 0.05) differences between treatments. Error bars indicate standard deviations (n = 4).
Agriculture 14 01208 g009
Table 1. Basic properties of the tested soil before being filled in the lysimeter.
Depth
(cm)
SOM
(g·kg−1)
TN
(mg·kg−1)
NH4+-N
(mg·kg−1)
NO3-N
(mg·kg−1)
Olsen-P
(mg·kg−1)
Ni
(mg·kg−1)
As
(mg·kg−1)
Cu
(mg·kg−1)
Zn
(mg·kg−1)
Cr
(mg·kg−1)
Cd
(mg·kg−1)
Pb
(mg·kg−1)
0–2013.42989.375.6828.3410.1021.9535.5211.4129.2834.240.9921.25
20–408.91658.094.0812.133.4517.3336.647.3822.1730.890.9117.28
40–605.73489.433.5911.090.8917.9537.187.7420.1432.050.8416.94
Table 2. Alfalfa yield per harvest, total yield, and average increase rate.
TreatmentAlfalfa Yield of Each Harvest (kg·ha−1)Total Yield (kg·ha−1)Average Yield (kg·ha−1)Average Increase Rate (%)
First HarvestSecond HarvestThird Harvest
Control9065.47 ± 107.15 b7242.19 ± 168.30 e7532.49 ± 63.54 c23,840.14 ± 139.26 c7946.71 c-
CF11,031.35 ± 161.59 a9284.46 ± 221.04 d10,399.82 ± 152.11 b30,715.63 ± 336.64 b10,238.54 b28.84% b
DS11,072.09 ± 186.99 a9814.13 ± 89.72 c10,552.61 ± 195.40 b31,438.83 ± 226.45 b10,479.61 b31.87% b
CFHA12,263.84 ± 775.02 a10,282.68 ± 93.86 b12,218.01 ± 600.21 a34,764.53 ± 1450.85 a11,588.18 a45.82% a
DSHA12,284.22 ± 717.46 a11,117.93 ± 59.61 a11,591.57 ± 231.53 a34,993.72 ± 924.34 a11,664.57 a46.78% a
Control: no fertilizer was applied; CF: chemical fertilizer application; DS: dairy slurry application; CFHA: chemical fertilizer with humic acid application; DSHA: dairy slurry with humic acid application. The same letter in the same column denotes no significant difference between treatments (LSD test, p < 0.05).
Table 3. pH and urease activity of soil at a depth of 0–20 cm after each harvest.
TreatmentpHUrease Activity (mg·g−1·d−1)
First HarvestSecond HarvestThird HarvestFirst HarvestSecond HarvestThird Harvest
Control8.83 ± 0.05 a8.43 ± 0.07 a8.17 ± 0.02 a1.57 ± 0.08 b1.67 ± 0.04 a1.74 ± 0.05 b
CF8.79 ± 0.02 a8.24 ± 0.04 b8.17 ± 0.03 a1.82 ± 0.07 a1.57 ± 0.02 a1.67 ± 0.07 b
DS8.83 ± 0.03 a8.17 ± 0.00 b8.14 ± 0.07 a1.87 ± 0.04 a1.53 ± 0.09 ab1.70 ± 0.05 b
CFHA8.80 ± 0.03 a7.91 ± 0.05 c8.06 ± 0.04 a1.79 ± 0.11 a1.40 ± 0.01 b1.93 ± 0.03 a
DSHA8.78 ± 0.04 a7.75 ± 0.05 d8.10 ± 0.03 a1.78 ± 0.02 ab1.69 ± 0.07 a1.68 ± 0.07 b
Control: no fertilizer was applied; CF: chemical fertilizer application; DS: dairy slurry application; CFHA: chemical fertilizer with humic acid application; DSHA: dairy slurry with humic acid application. The same letter in the same column denotes no significant difference between treatments (LSD test, p < 0.05).
Disclaimer/Publisher’s Note: The statements, opinions and data contained in all publications are solely those of the individual author(s) and contributor(s) and not of MDPI and/or the editor(s). MDPI and/or the editor(s) disclaim responsibility for any injury to people or property resulting from any ideas, methods, instructions or products referred to in the content.

