Article

Solid and Liquid Fraction of Digestate as an Alternative Mineral Nitrogen Source: Two-Year Field Research in Croatia

1
Faculty of Agriculture, University of Zagreb, Svetošimunska 25, 10000 Zagreb, Croatia
2
Faculty of Bioscience Engineering, Ghent University, Copure Links 653, 9000 Ghent, Belgium
*
Authors to whom correspondence should be addressed.
Agriculture 2024, 14(8), 1243; https://doi.org/10.3390/agriculture14081243 (registering DOI)
Submission received: 19 June 2024 / Revised: 24 July 2024 / Accepted: 25 July 2024 / Published: 27 July 2024
(This article belongs to the Section Crop Production)

Abstract

:
This research aimed to assess the effect of applying digestate fractions and conventional mineral nitrogen (N) fertilizers on plant and soil properties, as well as potential nitrate leaching, in acidic soil over two consecutive years (2018 and 2019). The digestate fractions were obtained after the anaerobic co-digestion of maize silage and liquid cattle manure (LCM). Seven different treatments were applied to the maize crop in four replicates: unfertilized control (C), mineral fertilizer (MF), LCM, solid fraction of digestate (SFD), liquid fraction of digestate (LFD) and a mixture of SFD and LFD with MF (50% of total N from digestate fractions + 50% of total N from MF). The highest maize yields were achieved on average in 2018. Statistically, the highest dry grain yield was observed in the MF treatment (12.1 t ha−1) and in the mixtures of MF+SFD (11.0 t ha−1) and MF+LFD (11.8 t ha−1), while the lowest yield was achieved in both years in the C treatment (7.9 t ha−1). The N fertilizer replacement value was statistically highest on average in the MF treatment (100%) and in the mixtures of MF+LFD (80.5%) for both years. The experiment results could inform legal guidelines and standardize digestate application on agricultural land in Croatia and the European Union (EU).

1. Introduction

Renewable energy sources (RES) have been pursued due to increasing prices and fossil fuels becoming less accessible on the market [1]. In this, it is essential to find alternative sources of nutrients for plant production, considering the high requirement of fossil resources to produce synthetic mineral fertilizers. Such alternative fertilizers have to be efficient, with low cost, accessible, forgeable and without any negative impacts on the environment [2].
Around 180 million tonnes of digestate is produced in the EU per year and the largest digestate producer in the EU is Germany with around 87 million tonnes, followed by Italy, the UK, France, Belgium and others [3,4]. These countries also have a strong support schemes and incentives for biogas production as a RES [5,6,7,8,9]. As for the Eastern European member states, these countries have slower implementation of anaerobic digestion (AD) technology. However, over recent years uptake of AD has been increasing in Croatia. In 2023 there were 41 operating AD plants in Croatia, installed with power from 0.5 MW to 3.5 MW capacity. These AD plants had contracts for electricity production with the Croatian Energy Market Operator (HROTE). With the electricity they produce, AD plants can cover the consumption of around 100,000 households. On average, one biogas plant with 1 MW of installed power produces 8000 MWh of electricity per year, which means that all Croatian biogas plants produce 384,000 MWh of electricity [10,11]. The intention of the Croatian government is to increase the share of renewable energy by 30% by the year of 2030 [1].
Most of Europe uses diverse feedstocks to obtain biogas such as agricultural residues (livestock manure, crop residues), energy crops, municipal solid waste, industrial residues (sewage sludge, food industry waste, slaughterhouse residues), etc. In recent years, the production of biogas is mostly based on the use of energy crops (silage corn, grass) and industrial and municipal waste [12,13,14]. According to Đurđević [15] the most often used input for biogas production in Croatia consists of manure (50–60%, mainly obtained from cattle farming but also from pigs, poultry or their combinations), maize (or grass) silage (25–35%) and other available biodegradable feedstocks (5–25%, e.g., food waste, spent brewer’s yeast, wastewater sludge, fats, garden waste).
AD represents one of the most sustainable ways of treating surplus agricultural residues and biodegradable industrial by-products by producing renewable energy, heat and fuel. With this technology, not only is energy produced but also a plant nutrient-rich residue digestate. The digestate contains plant available nutrients and as such has potential to be used as a sustainable substitute for mineral fertilizers [16,17,18,19]. By far the biggest change during AD happens with nitrogen (N), since a large part transforms into a readily plant available ammoniac form [20]. Depending on the input of AD, usability of N from digestate can vary from 50% for cattle slurry digestate to 70% for pig slurry digestate and for food-based digestate even 80% in the first year of application [3,21,22]. Organic fertilizers typically exhibit a residual nitrogen (N) effect beyond the first year of application due to the gradual decomposition of organic materials, a process which often extends beyond a year [23,24,25,26,27,28]. Digestate is characterized by alkaline pH, so according to Czekala [29] apart from being an alternative fertilizer it could be particularly beneficial on soil with very low pH.
The increasing problem of soil acidity in agricultural production is a global concern, with significant impacts on crop yield and soil health. Intensive agriculture and excessive use of N fertilizers are contributing to the soil acidification, leading to a range of negative effects on soil and plant health [30]. As far as this is concerned, Croatia has more than 50% acid soils in all agricultural land and more than 90% in the Pannonian region of Croatia [31,32]. Low soil pH adversely affects various aspects of plant production, including yield, nutrient availability and solubility [33].
Since there might be a risk for nitrate leaching into deeper soil layers, the use of digestate as a fertilizer must be in accordance with the Nitrates Directive (ND) (91/676/EEC), which limits its application to 170 kg total N ha−1 per year in case of (co-)digested animal manure. Therefore, regulation on maximum allowable levels of nitrates in the ground water, which is 50 mg L−1 nitrate, applies to Croatia and EU-27. Also, with the new Fertilizing Products Regulation 2019/1009 from the European Parliament and the council a new opportunity opens for organic and waste-derived fertilizers such as digestate under a unified European market [34,35,36,37,38].
To evaluate digestate as a partial or complete substitute for mineral N fertilizers, apparent N recovery (ANR) and N fertilizer replacement value (NFRV) calculations are used as indications. According to Schoder [38] and Cavalli [39] the ANR represents the fraction of applied total N that can be taken up by the crop in comparison to what is taken up by an unfertilized control in a single season after fertilizer (in this case digestate) application. Additionally, NFRV equals the organic fertilizer ANR divided by the mineral fertilizer ANR. It was hypothesized that (i) the digestate fractions will not have negative impact on chemical soil properties nor NO3-N leaching; (ii) applied organic N will increase the NFRV of digestate fractions after consecutive years; (iii) the digestate application can increase soil pH after one or two consecutive applications.
Therefore, the aim of this research was to compare the effect of the application of digestate with the use of conventional mineral nitrogen (N) fertilizers and to determine possible soil nitrate leaching. Further, the evaluation of the tested mixtures of digestate fractions and fertilizers over two consecutive growing seasons was conducted by assessing their impact on plant and soil properties in acidic soil.

2. Materials and Methods

2.1. Experimental Site

The experimental research was performed during two consecutive years, 2018 and 2019, in the fields of the University of Zagreb Faculty of Agriculture, Maksimir site (45°49′39, S; 16°02′02, I) on silt–loam soil. Maize was grown in a maize (Zea mays L.)–soybean (Glycine max (L.) Merr)–winter wheat (Triticum aestivum L.) crop rotation. This is a standard crop rotation on this experimental field. The soil characteristics, from the 0–30 cm soil layer prior to the experiment in the spring, are shown in Table 1. Based on these data the fertilizing recommendation dosages were formulated. Soil pH-KCl was 4.21 in 2018 and 3.93 in 2019, which is very acidic soil [40].

2.2. Weather Conditions during Maize Growing Season

The weather conditions for temperature and precipitations were taken from the Croatian Meteorological and Hydrological Service (DHMZ) for the years 2018 and 2019.
Table 2 shows the average air temperatures and precipitation for two consecutive years. The average data from the last 70 years were used to evaluate the data from two years of research.
The temperature and precipitation measurements were taken for the months of April, May, June, July, August, September and October, which represent the period from maize sowing to maize harvest.
Optimal temperature for maize growth is from 24 to 29 °C. Lowest limit of temperature for germination is 12–13 °C, and the upper limit is 40–45 °C. The optimal average temperature during maize growth from May to September is 21.5 °C [43].
During the vegetation period (from April to October), the average air temperature in 2018 was 19.2 °C and in 2019 it was 18.1 °C. In 2018 air temperatures from April to October were higher than the long-term average. The highest temperature in 2018 was recorded in August, while the lowest in October. In 2019 the highest temparature was recorded in June and the lowest in April.
The annual course of the amount of precipitation (mm) during maize vegetation growth through the 70-year period (Table 2) was 569.7 mm [43]. The amount of precipitation during 2018 was 535.8 mm and in 2019 it was 625.5 mm [41,42]. According to Pucarić [43] the average course of the amount of precipitation (mm) during the maize vegetation period for 2018 from April to October was 76.5 mm and for 2019 it was 89.4 mm [41,42]. Average precipitation during the 70-year maize growth from April to October was 81.4 mm [43]. The highest amount of precipitation in 2018 was recorded in June, while the lowest in August. In 2019 the highest amount of precipitation was recorded in September and the lowest in October.

2.3. Composition of the Digestate Fractions and Organic Fertilizer

The solid fraction of digestate (SFD) and liquid fraction of digestate (LFD) were sampled and collected at the AD plant Bojana (Čazma, Croatia 45°44′17, S; 16°39′05, I) and liquid cattle manure (LCM) from a cattle farm close to the AD plant. Since all these fractions can be obtained in Croatia, it is essential to study their practical application.
Product sampling and characterization were performed at two time points. At the first sampling, before fertilization, all products were collected from the AD plant to determine the required application rate for the test crop, while respecting the legal limits imposed by the Nitrates Directive and good agricultural practice (91/676/EEC). The day before the fertilization, products were sampled and analyzed again to determine nutrient content applied to the field and no deviations were found.
The AD plant (Bojana Čazma) has been operational since October 2014 and is located in a region characterized by agriculture and intensive cattle farming. The treatment capacity is 85,000 t per year and 28.000 MWh of electricity produced per year under thermophilic digestion. The plant receives liquid cattle manure from farmers in a radius of 10 km, and yearly 55% of liquid cattle manure and 42% of corn silage are co-digested [44]. SFD and LFD were obtained after screw press mechanical separation. Both products were collected from mixed storage tanks while LCM from a nearby cattle farm from non-mixed storage. All products were collected in polyethylene sampling bottles (3 L) and stored at 4 °C until chemical analyses.
The physico-chemical characteristics of LCM, SFD and LFD are shown in Table 3. As can be seen, the amount of extractable nutrients is higher for SFD and LFD than in LCM in both years. Also, there is a difference in dry matter content between products.

2.4. Experimental Design, Fertilization Treatments and Dosage

The experiment was established in plots sized 33.6 m2 per seven replicates arranged in a quadruplicate randomized block design to minimize potential influence of variable soil conditions. Experiment involve 7 treatments: 1: unfertilized control (C), 2: mineral fertilizer NPK 15-15-15 + CAN 27%N (MF), 3: liquid cattle manure (LCM), 4: solid fraction of digestate (SFD), 5: liquid fraction of digestate (LFD), 6: a mixture of (MF+SFD) and 7: a mixture of (MF+LFD).
As a reference fertilizer, nitrogen potassium potash (NPK—in which nitrogen (N) is in ammonium nitrate form) and calcium ammonium nitrate (CAN), which are the most commonly used MFs in Croatia, were applied in combination with both digestate fractions, SFD and LFD.
The application dosage was set at 140 kg of total N in all fertilization treatments (suboptimal concentration presented in Table 3). This amount meets the N requirements (150–200 kg N ha−1) necessary for the normal growth of maize [45]. Before fertilization ≈ 30 kg of available nitrogen was determined in the soil. Also, maize was sown after the maize and there was no catch crop in between. Since the experimental field falls within a nitrate vulnerable zone (NVZ) [46,47], a dosage of 140 kg N ha−1 was applied in order to prevent subsequent nitrate leaching after harvest, even though the Nitrates Directive allows 170 kg total N ha−1. Nutrient application rates for the different fertilization treatments over two consecutive years are summarized in Table 4.
Each year all tested fertilizers were applied on the same day. Before application they were mixed so that the fertilizer mixture was homogeneous. All fertilizers were added to the soil manually in order to ensure accurate dosage. After application, the fertilizers were immediately incorporated into the soil by a rotary harrow (depth 10 cm) to reduce the ammonia volatilization. Two days later, on 29 April, sowing took place, while in 2019, sowing took place on the next day, 3 May. As a test crop, maize hybrid P 0725 FAO vegetation group 570 was implemented. Maize hybrid P 0725 is widely cultivated in Croatia. It is known for its excellent drought tolerance and it is used for both silage and dry grain production [48]. The desired plant populations of 80,000 plant ha−1 were achieved by overplanting and thinning in growth stages V3 to V4 (three to four fully developed leaves) [49]. In each plot, maize was sown in 8 rows and only 4 inner rows were harvested and analyzed. During the vegetation period all agro-technical measures have been implemented (cultivation, weed and pest control).

2.5. Soil and Plant Sampling

Soil samples were taken from each experimental plot before fertilization treatments and then three times during different maize growth stages (vegetative stage V4 or four fully developed leaves; reproductive stage R5 or dent stage and reproductive stage R6 or after physiological maturity stage) [49]. Homogenized soil samples were taken at three soil depths (0–30 cm, 30–60 cm and 60–90 cm) using an auger. The samples were collected in polyethylene sampling bags and transported from the field to the laboratory of the Department of Plant Nutrition, Faculty of Agriculture (Zagreb, Croatia) for further analysis. Each soil sample was divided into two parts. The first part represents wet soil for mineral N, NO3-N and NH4+-N determination that was cold stored. The second part includes the soil sample that was air dried at room temperature (25 °C) and analyzed for pH, available P2O5 and K2O.
Maize samples were taken three times during the vegetative growth (vegetative stage V4 or four fully developed leaves; reproductive stage R5 or dent stage and harvested in reproductive stage R6 or after physiological maturity stage) [49]. The growth and development stages of maize (V4, R5 and R6) were selected to evaluate nutrient accumulation both in the green mass of the plant and in the grain. During first and second samplings, from each plot 12 maize plants were randomly harvested, while at harvest time two middle rows of each plot were taken (separately maize cob and plant stem). Plants were cut above ground level and taken to the laboratory, chopped and homogenously mixed for analysis. From this mixture 500 g of sample was oven dried at 105 °C for determination of the DM (%) content. The dry samples were ground and prepared for chemical analysis.

2.6. Digestate Fractions, Soil and Plant Measurements (or Chemical Analysis)

All materials were analyzed accordingly: dry matter (DM) was determined as the remaining mass after 48 h of drying at 105 °C, while soil was air dried. Total N was determined using Kjeldahl destruction (HRN ISO 11261:2004) [50] and NH4+-N using a KjeltecTM 8100 distilling unit [50] after addition of MgO to the sample and subsequent titration. As for other parameter analyses, organic matter (OM) was measured after incineration of the samples for 3 h at 550 °C in a muffle furnace, where the loss of mass on ignition was regarded as the OM. Organic carbon was determined by a conversion factor [51], as follows:
o r g a n i c   c a r b o n   C o r g = o r g a n i c   m a t t e r × 0.56
The determination of organic carbon is important because it serves as a carbon source for microorganisms. It is also known that a more fertile soil promotes greater microbiological activity.
EC and pH were determined by using a Mettler Toledo EL30/EL3 conductivity electrode and a Mettler Toledo EL20/EL2 pH meter, respectively. For liquid samples, EC and pH measurements were performed directly in the original sample, while solid samples were equilibrated for 1 h in deonized water at a 10:1 liquid to dry sample ratio. The suspension was then filtered and pH and EC were measured. Organic N was calculated by subtracting NH4+-N from the total N. After aqua regia microwave digestion (5 mL HNO3 and 15 mL HCl) of the dry sample, total P, S, K, Ca, Mg, Cu and Zn were measured: P with the Evolution 60S UV–visible spectrophotometer, K with the JENWEY PFP 7 flame photometer and other macro- and microelements with the Solaar M5 Series atomic absorption spectrometer [52].

2.6.1. Soil Analysis

The moisture content was determined by weight loss after drying the soil sample to a constant weight at 105 °C for at least 24 h. The pH was determined by using a Mettler Toledo pH meter. Total N content in soil was determined using the Kjeldahl digestion method (HRN ISO 11261:2004). Nitrate-N (NO3-N) and ammonium-N (NH4+-N) in soil were extracted according to phenoldisulfonic acid method [53] and Nessler method [54], respectively, and then analyzed using an Evolution 60S UV–visible spectrophotometer. Available P2O5 and K2O were determined using the ammonium lactate (AL) method. Subsequently, P was analyzed with the Evolution 60S UV–visible spectrophotometer and K with the JENWEY PFP 7 flame photometer [52].

2.6.2. Plant Analysis

The aboveground plant samples were collected in the field and weighed to determine the fresh weight (FW) of biomass. After oven drying at 105 °C for determination of the dry weight (DW) content, the dry samples were ground and then analyzed. Total N content in plant was determined using the Kjeldahl digestion method (HRN ISO 11261:2004). After aqua regia microwave digestion (9 mL HNO3 and 1 mL H2O2) of the dry sample, total P, S, K, Ca, Mg, Cu and Zn were measured: P with the Evolution 60S UV–visible spectrophotometer, K with the JENWAY PFP 7 flame photometer and other macro- and microelements with the Solaar M5 Series atomic absorption spectrometer [52].

2.7. Calculations and Statistical Analysis

Apparent N recovery (ANR) and N fertilizer replacement value (NFRV) were calculated as follows [55]:
A p p a r e n t   N   r e c o v e r y   ( A N R ) = N   u p t a k e t r e a t m e n t k g   h a 1 N   u p t a k e c o n t r o l k g   h a 1 T o t a l   N   a p p l i e d t r e a t m e n t k g   h a 1
N   f e r t i l i z e r   r e p l a c e m e n t   v a l u e   ( N F R V , % ) = A N R t r e a t m e n t A N R r e f e r e n c e × 100
where in the formula above “control” is unfertilized treatment; “treatment” contains one of the tested materials (LCM, SFD, LFD, MF+SFD, MF+LFD) and “reference” is a mineral fertilizer (MF).
An analysis of variance (ANOVA) was performed to assess the effects of various factors on measured yields and for physico-chemical analyses of soil and plant samples. The ANOVA model included fixed effects for year, fertilization treatment and phenophase (where applicable) and the random effect of replication.
Before ANOVA, assumptions of normality and homogeneity of variances were checked using Shapiro–Wilk and Levene’s tests, respectively.
The significance level for all statistical tests was set at α = 0.05. When significant main effects or interactions were detected, Tukey’s honestly significant difference (HSD) or a post hoc test was applied to determine specific differences between treatment means.
All statistical analyses were performed using SPSS statistical software (version 22.0; SPSS Inc., Chicago, IL, USA).

3. Results

3.1. Maize Yield

There was a statistically significant interaction between the effects of year and vegetative stage as well as fertilization treatment and vegetative stage for both fresh and dry weight yield (Table 5). The simple main effects analysis showed that higher yields of fresh biomass and dry weight were achieved in 2019 (38.45 t ha−1 FW and 15.7 t ha−1 DW) compared to 2018 (30.9 t ha−1 FW and 14.4 t ha−1 DW). Furthermore, in both years, the statistically highest average fresh and dry weight yields were found in MF treatments (39.6 t ha−1 FW and 17.4 t ha−1 DW) and a mixture of MF+LFD (37.5 t ha−1 FW and 16.5 t ha−1 DW), whereas the lowest average FW (29.6 t ha−1) and DW (12.7 t ha−1) were obtained in the C treatment. In both years FW and DW increase significantly, from vegetative stage V4 to reproductive stage R6, and higher yields were found in reproductive stages R5 and R6 in 2019 compared to 2018. There was no statistical difference between 2018 and 2019 in both FW and DW yields in vegetative stage V4. Similarly, there were no differences in FW and DW biomass among fertiliziation treatments in vegetative stage V4. With the plant development, the differences became more evident and the highest FW and DW yields in reproductive stages R5 and R6 were found in MF and a mixture of MF+LFD fertilization treatments, and the lowest was found in C treatment.
The highest dry grain yield was recorded in 2018 (10.9 t ha−1) compared to 2019 (9.6 t ha−1) (p < 0.0001). In addition, phosphorus (P) and potassium (K) from NPK fertilizers likely had a synergistic effect on yield when combined with LFD. Furthermore, it should be noted that statistically similar values were observed in the mixture of MF+SFD treatment. Moreover, the MF treatment (12.1 t ha−1) and a mixture of MF+LFD (11.9 t ha−1) gave statistically higher results compared to the other treatments (Figure 1). In addition, the highest dry grain yield in 2018 was recorded for MF (13.1 t ha−1), a mixture of MF+SFD (11.2 t ha−1) and a mixture of MF+LFD (12.2 t ha−1) treatments, as well as in 2019, where MF (11.1 t ha−1), a mixture of MF+SFD (10.8 t ha−1) and a mixture of MF+LFD (11.5 t ha−1) treatments were used. The lowest dry grain yield was observed in both years in the C treatment.

3.2. Maize Nutrient Uptake

An ANOVA was performed to determine the effects of year and fertilization treatments on maize nutrient uptake for macro- and micronutrients. Nitrogen (N), phosporous (P), potassium (K), calcium (Ca), magnesium (Mg), iron (Fe), zinc (Zn), manganese (Mn) and copper (Cu) were observed.
A statistically significant interaction was found between the effects of year and fertilization treatment for N (p < 0.0090), K (p < 0.0152) and Cu (p < 0.0263) uptake.
The simple main effects analysis showed that the highest nutrient uptake of N, P, Zn and Cu (kg ha−1) on average was achieved in 2018 compared to 2019 while the highest Ca, Mg, Fe and Mn uptakes (kg ha−1) were obtained in 2019. Finally, there was no significant difference in K uptake (kg ha−1) between the years.
Moreover, the highest N uptake was recorded for MF treatment (271.9 kg ha−1). The mixture of MF+SFD and a mixture of MF+LFD treatment also gave higher results compared to LFD, SFD, LCM and C treatments (Table 6).
Overall, the statistically lowest P uptake was observed in the LFD and C treatments, while the lowest K uptake was recorded in the LFD, LCM and C treatments. No significant differences were recorded among other treatments. The highest Ca uptake was recorded in the MF and a mixture MF+LFD treatments. The highest Mg and Cu uptake was observed in the MF treatment, while the lowest for C treatment. On average the highest Mn uptake was recorded for treatments with MF and a mixture of MF+SFD. No statistical differences were observed in the uptake of Fe and Zn between the years (Table 6).

3.3. Apparent Nitrogen Recovery (ANR) and Nitrogen Fertilizer Replacement Value (NFRV)
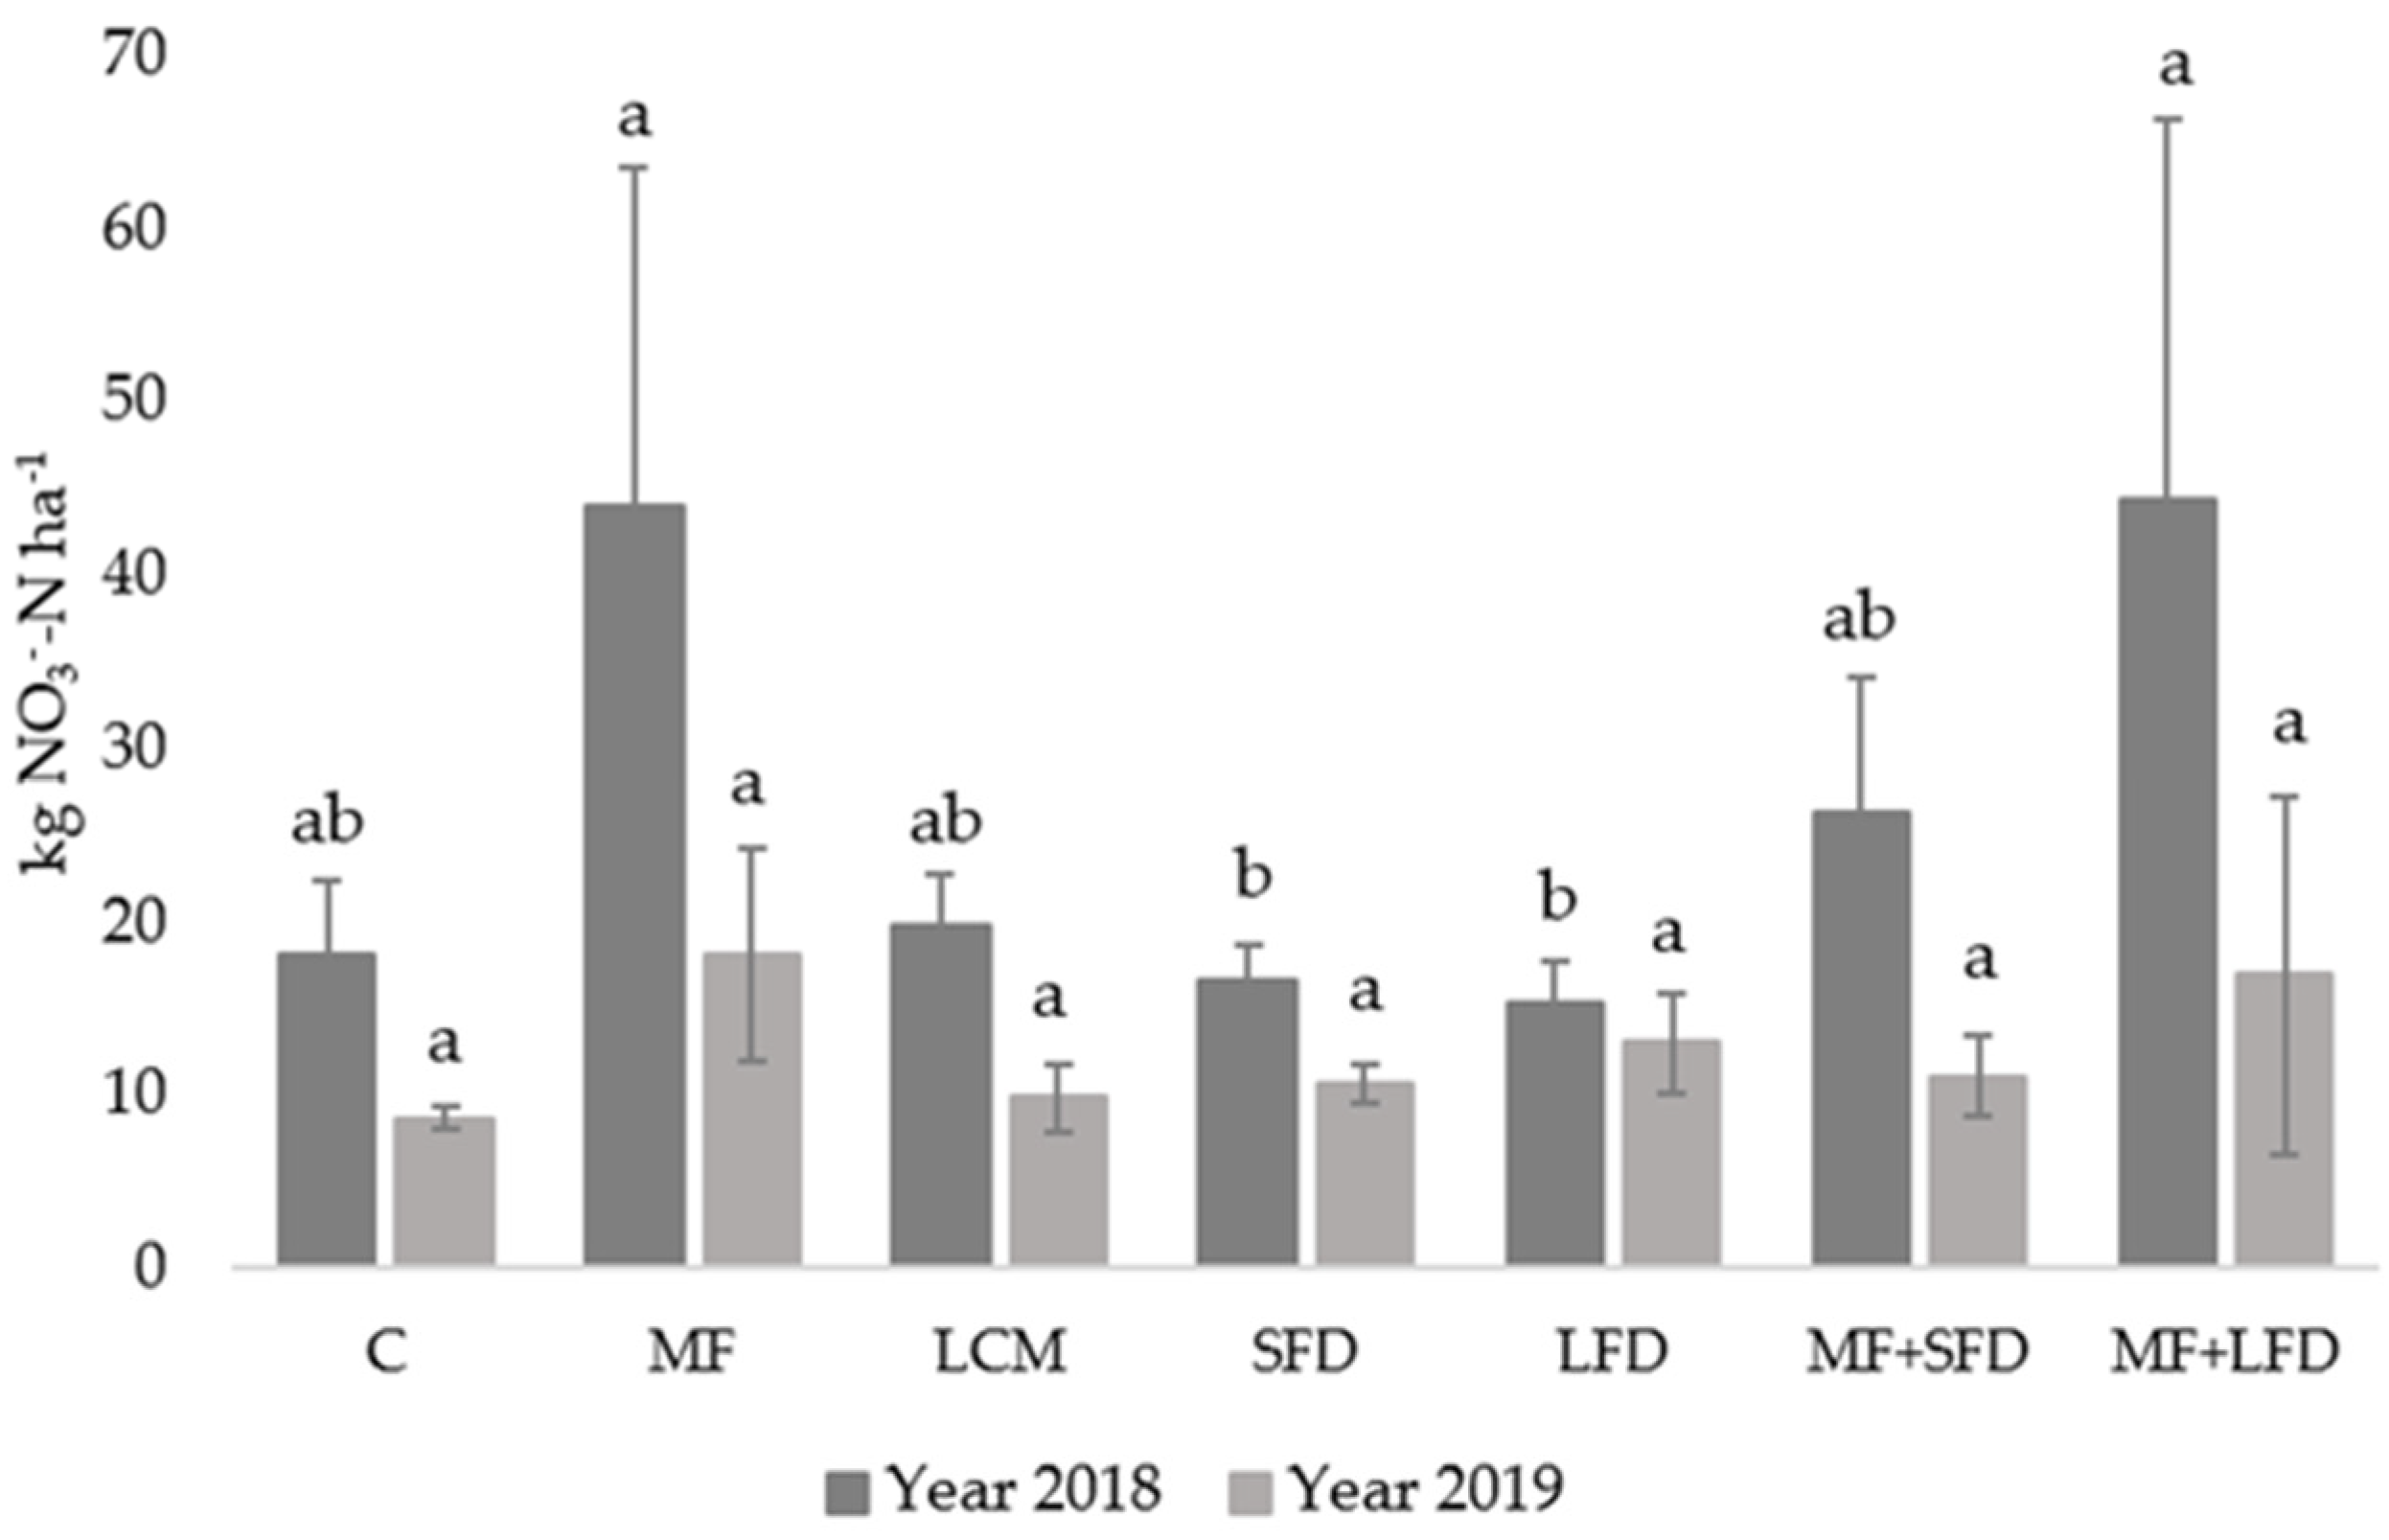
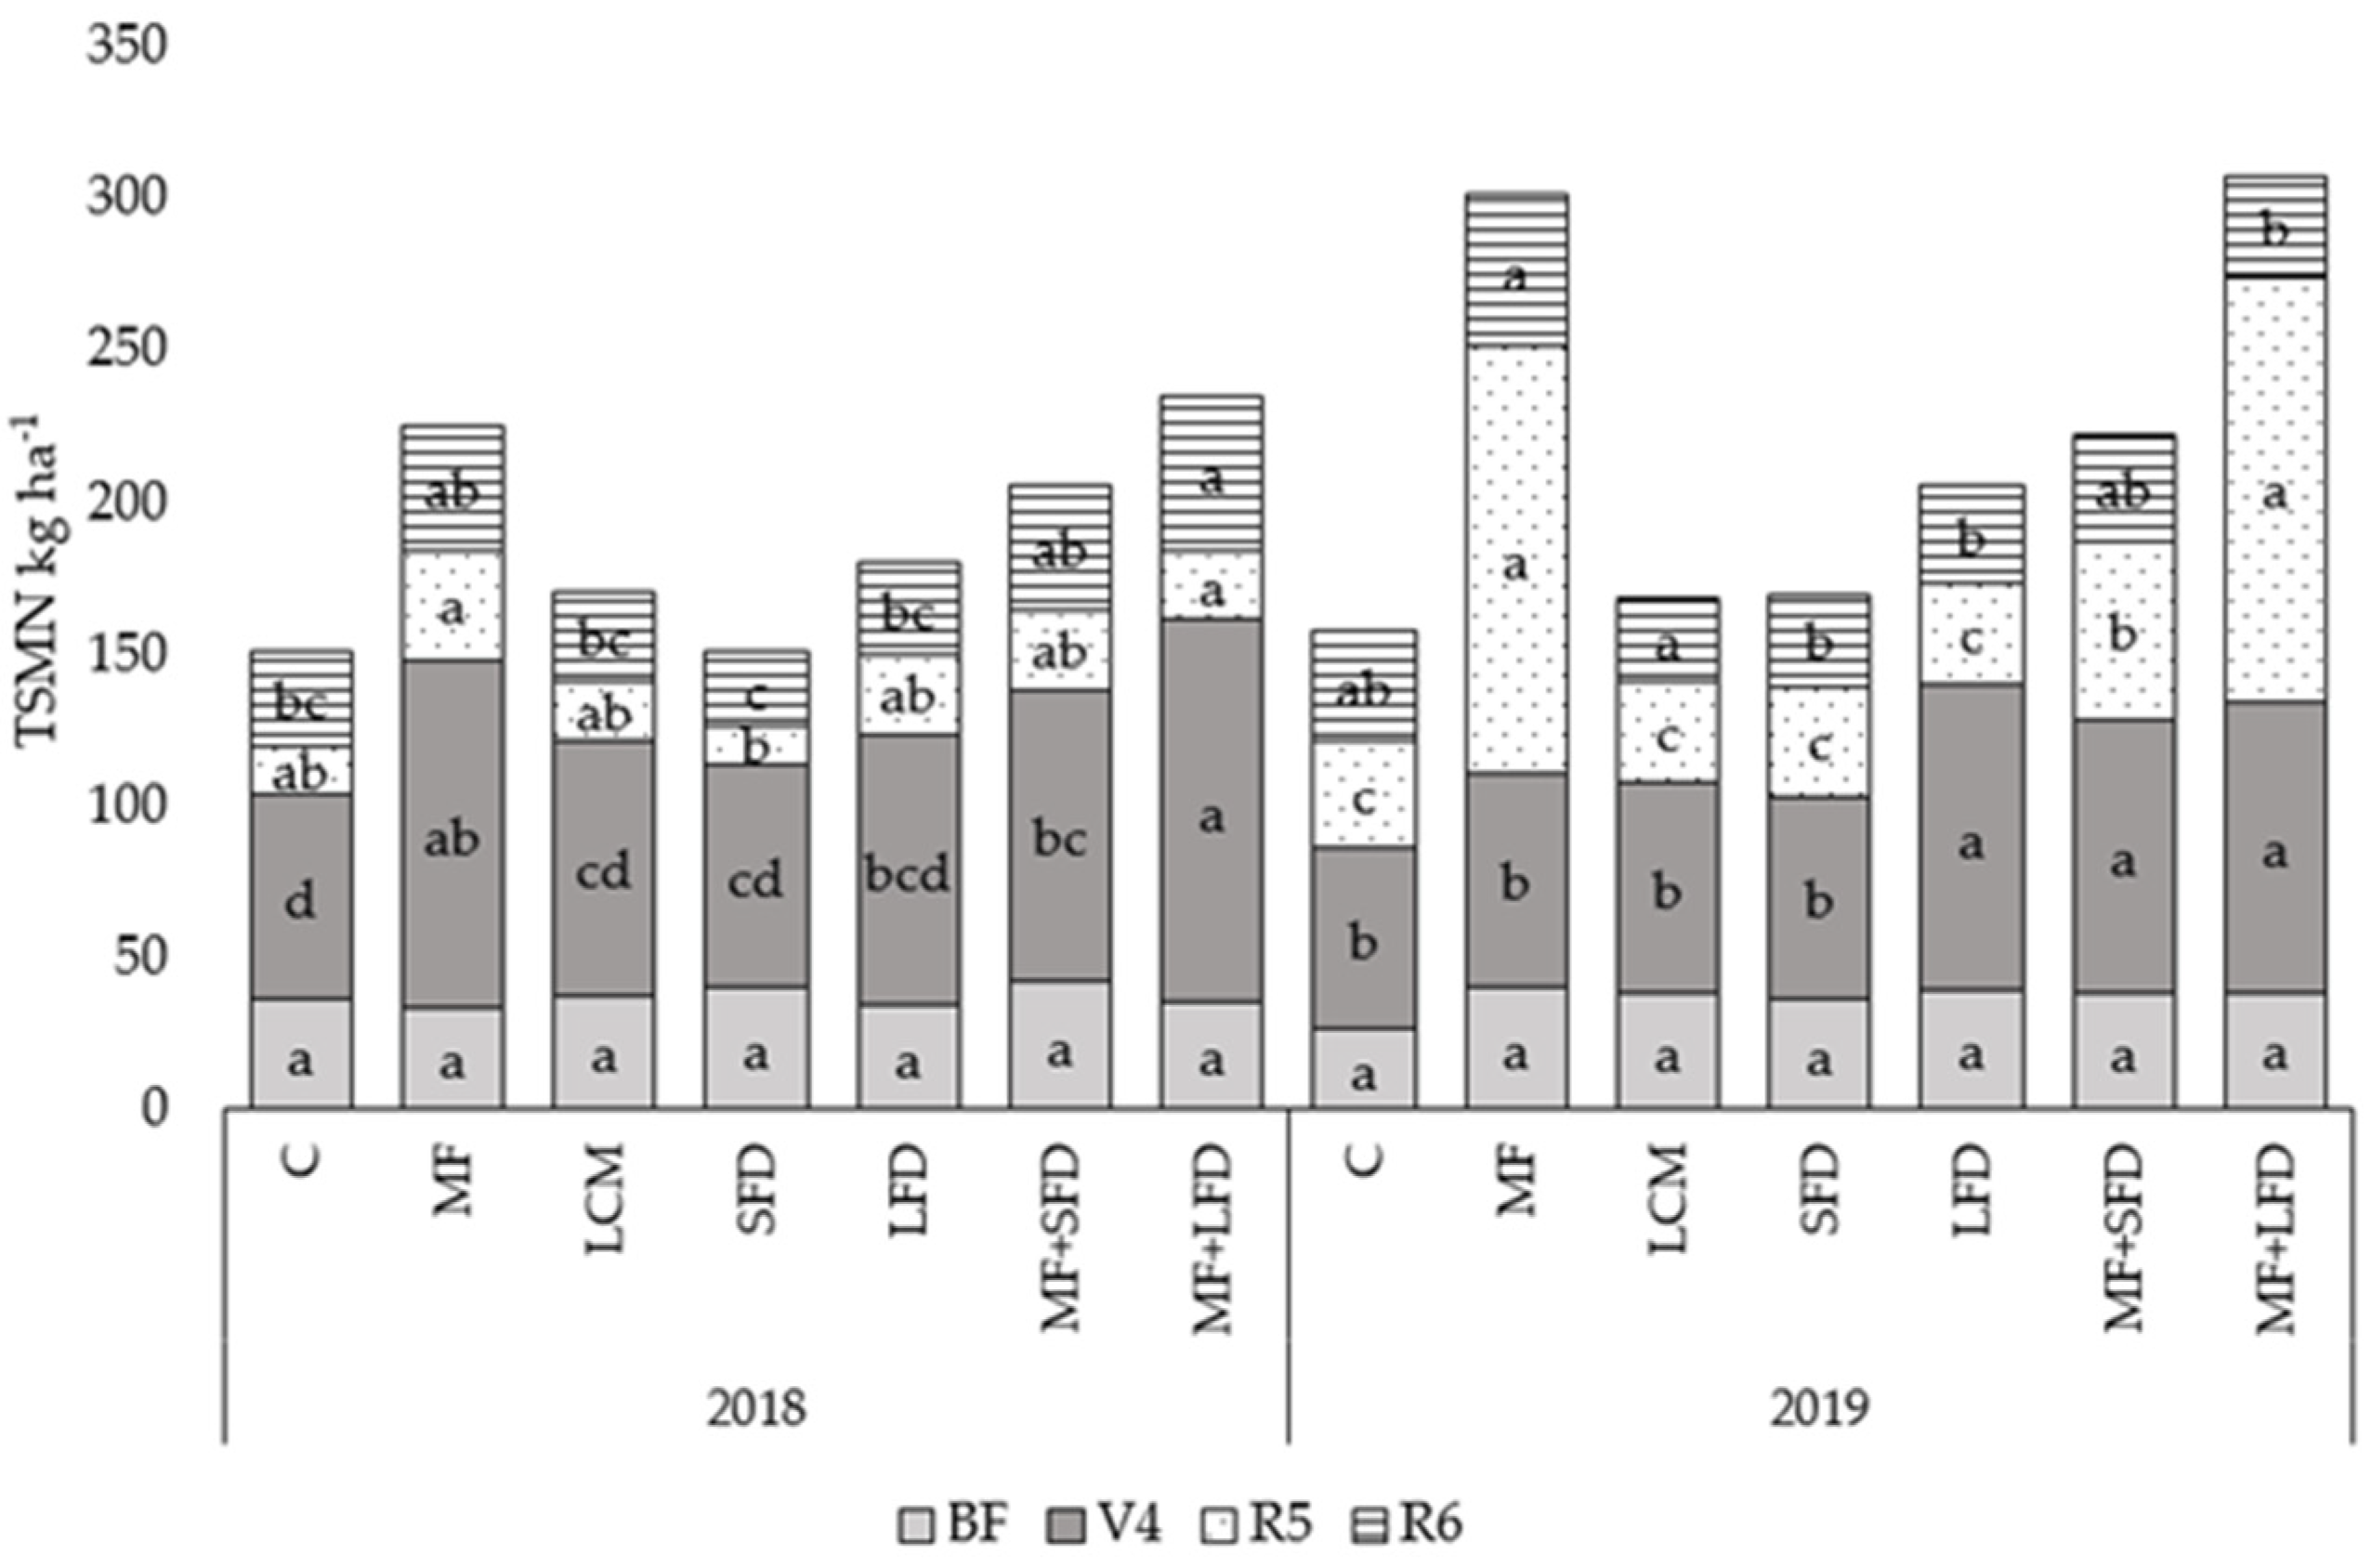
There was a statistically significant interaction between the effects of year and fertilization treatment (p < 0.0012) (Table 7). The simple main effects analysis showed that a higher ANR was obtained in 2019 than in 2018 (p < 0.0001). Moreover, in 2018 statistical significance was recorded for MF and a mixture of MF+LFD treatments compared to other treatments. In 2019, MF, a mixture of MF+SFD and a mixture of MF+LFD treatments also gave significantly higher results compared to the other treatments.
The nitrogen fertilizer replacement value (NFRV) is a well-known means of quantifying the value of organic products as a N fertilizer and is a helpful tool for estimating correct N application rates. The NFRV is commonly defined as the extent to which organic fertilizer N can replace mineral fertilizer N [55]. The highest NFRV was obtained in both years for MF and a mix of MF+LFD treatments.

3.4. NO3-N Residue and Soil Mineral Nitrogen

One-way ANOVA was conducted to determine the nitrate residue in the soil after harvest for seven different fertilization treatments.
A higher nitrate residue (kg ha−1) was recorded in 2018 compared to 2019. Furthermore, MF, a mixture of MF+SFD and a mixture of MF+LFD showed the statistically highest nitrate residue in 2018 while there was no difference in between treatments for nitrate residue in 2019 (Figure 2).
In both years, there was no significant difference in TSMN between the treatments before fertilization. After fertilization and with plant development (vegetative and reproductive stages), the differences in TSMN concentration become more noticeable. TSMN increased from before sowing to reproductive stage R5 and then strongly decreased to reproductive stage R6 (Figure 3).
The highest TSMN was recorded for MF and a mixture of MF+LFD during vegetative stage V4 in 2018 compared to other treatments. As well, statistical differences occurred among treatments during reproductive stage R5 in 2018 (p > 0.05), with the lowest TSMN for C treatment (Figure 3). Moreover, MF, a mixture of MF+SFD and a mixture of MF+LFD treatments resulted in the highest TSMN in reproductive stage R6 compared to other treatments.
As well, the highest TSMN in 2019 was obtained for LFD, a mixture of MF+SDF and a mixture of MF+LFD treatments during vegetative stage V4, while the highest was found for MF and a mixture of MF+LFD treatments in reproductive stage R5. Additionally, the highest TSMN levels were statistically achieved with the MF treatment, SFD, a mixture of MF+SFD and C treatments.

4. Discussion

4.1. Fertilizer Impact on Maize Production

During a two-year experiment, a significant difference was determined between two growing seasons, treatments and vegetation stages for both fresh weight and dry weight biomass.
The application of digestate fractions to the soil improved soil health, fertility and maize yield. Based on average results the statistically highest fresh and dry weight biomasses were observed in 2019 (p < 0.0001). The average highest fresh biomass was recorded in the treatments where MF and mixtures of MF+SDF and MF+LFD were used. As stated in the Results, reproductive stage R5 and reproductive stage R6 had on average statistically higher results than vegetative stage V4 in all treatments (p < 0.0001).
During fresh biomass yield treatments where MF treatment, a mixture of MF+SDF and a mixture of MF+LFD treatments were utilized, the highest yield was found in comparison to other treatments. Through dry biomass yield again MF treatment, a mixture of MF+SFD and a mixture of MF+LFD had the highest yield compared to the rest of the treatments. The C treatment gave the lowest fresh and dry biomass yield in both R5 and R6 vegetative stages.
In June, the weather caused hail, which may have partly caused the lower green biomass yield during reproductive stage R5 in 2018. Luckily, further on, favorable weather conditions helped maize plant to regenerate. According to Corteva Agriscince [48], the average fresh weight biomass yield during reproductive stage R5 that Croatian farmers achieved was 55.46 t ha−1, while the Croatian Statistical Yearbook (2013–2017) range was from 30.3–41.4 t ha−1 [56] which is in accordance with our results (29.6–37.5 t ha−1).
Additionally, precipitation during the growing season had a significant impact on the relationship between fresh and dry biomass and grain yield. During the R5 stage in 2018, dry weight (DW) was slightly higher compared to 2019. Similarly, in 2018, the R6 stage resulted in an average of 5.5% higher DW across all treatments, likely due to the precipitation levels in June, July and August. According to the literature, high temperatures during these months can lower yields, especially if water or relative air humidity is insufficient [43]. Additionally, drought stress occurred in August of both years. Consequently, DW was lower in 2019, significantly affecting both fresh and dry yields.
As stated by Sigurnjak [55], in a three-year field trial, an average fresh weight biomass yield of 77 t ha−1 in a mineral fertilizer+pig manure treatment was observed, while the liquid fraction of digestate+digestate treatment and liquid fraction of digestate+pig manure treatment resulted respectively in 73.6 t ha−1 and 75.3 t ha−1 while in the present research average fresh weight biomass yield for MF treatment was 69.7 t ha−1, for LCM treatment 59 t ha−1, for SFD 56.2 t ha−1, for LFD 58.1 t ha−1, for mixtures of MF+SFD 64.1 t ha−1 and for mixtures of MF+LFD 64.6 t ha−1, which were lower than those results.
Even though fresh and dry weight biomass yield were statistically higher in 2019, the dry grain yield was highest on average in all treatments during 2018 (10.9 t ha−1) compared to 2019 (9.6 t ha−1). Regardless of the differences in dry grain yield between growing seasons, all treatments followed the same trend. As can be seen from the results, on average, the treatments with MF (12.1 t ha−1) and a mixture of MF+LFD (11.9 t ha−1) were statistically significant.
Production of the dry grain yield can vary in each growing season depending on the weather conditions, soil characteristics and many other factors. If taking each year into consideration separately, the highest dry grain yield in 2018 was recorded for treatments where MF (13.1 t ha−1), a mixture of MF+SFD (11.2 t ha−1) and a mixture of MF+LFD (12.2 t ha−1) were used, the same as in 2019, when treatments with MF (11.1 t ha−1), a mixture of MF+SFD (10.8 t ha−1) and a mixture of MF+LFD (11.5 t ha−1) prodced high yields, but with lower yields than in 2018 for the same treatments. The reason for this could be maize rootworm (Diabrotica virgifera virgifera), which appeared during the reproductive stage R1 of the maize silking. Maize rootworm feeds on the silk, which affects total grain yield. Rootworm adults interrupt pollination by feeding directly on green maize silks and clipping them back to ear tips. The damage reduces grain yield and seed quality of inbred maize grown for production of hybrid seed [57,58]. During this period, drought conditions prevailed from June to August, which can lead to reduced availability of fertilizers for the plants [2]. In addition, fertilization of the florets may not occur, or kernels that have been fertilized may abort during the first few days after fertilization due to stress caused by drought, nutrient deficiency, pests or high plant density [59,60]. The lowest dry grain yield was observed for C treatment in both years.
According to Cvjetićanin [61], from 2013–2017 maize dry grain yield production in Croatia ranged from 6.5–8.5 t ha−1 while average dry grain yield in this experiment for two years for C treatment was 7.9 t ha−1, 12.1 t ha−1 for MF, 9.9 t ha−1 for LCM, 9.4 t ha−1 for SFD and 9.6 t ha−1 for LFD. Chantigny [62] achieved similar dry grain yield during a three-year experiment where MF was compared to the utilization of liquid swine manure and digestate as fertilizers. In their research, the total dose of N was 130 kg ha−1. The average yield over the three-year experiment was 8.4 t ha−1 of dry grain yield for C treatment, 9.6 t ha−1 for MF, 9.7 t ha−1 for raw liquid swine manure and 9.5 t ha−1 for digestate.

4.2. Nutrient Uptake

Due to the acidic reaction of the experimental field (Table 1), the pH value of the soil could have also influenced element uptake (immobilization of elements) in the maize. The critical soil pH range for maize is 5–5.5 [63] and the experimental field had lower pH as shown in Table 1. Considering the very acidic soil and low pH, there is a risk of reduced nutrient uptake due to weaker microbiological activity. The absorption of macronutrients and molybdenum is lower, while the solubility of micronutrients increases. With the application of mineral fertilizers, the oxidation and transition of ammonium nitrogen to nitrate occur quickly, unlike with organic components. For organic components, such as digestate, processes like proteolysis, decomposition, nitrification and ammonification must first occur. Digestate can help increase soil pH, offering a beneficial effect, and thereby enhance nutrient uptake and soil health in the context of microbiological activity.
For all plant species, the uptake of Ca and Mg decreased with a decreasing soil pH [64]. Meanwhile, the total uptake of Zn, Mn and Fe increased in all species with a decreasing soil pH. In general, increasing soil pH decreased the uptake of N, P and K in rice, while the uptake of these elements increased in wheat, maize and common bean [65].
The results showed that the uptake of N, P, Fe, Zn and Cu was better in 2018 than in 2019 (p < 0.0001), while the uptake of Ca, Mg and Mn was better in 2019 (p < 0.0001). In May 2018, the temperature was 19.5 °C, while in May 2019, it was 13.7 °C, resulting in a 5.8 °C difference compared to 2018. This higher temperature in 2018 created more favorable conditions for the mineralization of organic matter and the release of nitrogen, leading to increased availability of phosphorus, iron, zinc and copper. Additionally, precipitation in June 2018 was 127.8 mm, 50 mm more than in June 2019. Thus, weather conditions in 2018 were more conducive to the uptake of these elements compared to 2019. However, significantly higher precipitation in 2019 improved the uptake of calcium and magnesium, which are absorbed through mass flow [66]. Finally, there was no significant difference between the growing seasons in K uptake.
Calculating the percentage increase or decrease in metals for the growing seasons (2018–2019), Ca uptake increased by 43 ± 19% on average for all treatments and Mg uptake increased 24 ± 9% on average for all treatments. Zn uptake decreased on average by 14 ± 6%, while Cu uptake decreased on average by 42 ± 12% in all treatments. The drought which occurred in year 2019 may have caused the lower Cu and Zn uptake, as well as lower soil pH. It is known that a serious lack of water leads to drastic reduction in the activity of microorganisms that help with element uptake [67]. It is stated that the application of biofertilizer leads to a drop in soil pH, subsequently resulting in an increase in available Fe and inorganic N, which occurred in this experiment [68]. Fe uptake increased on average by 27 ± 11% in all treatments from year 2018 to 2019. As Marchner [69] stated, soil properties dictate to a very large degree the responses of crops to nutrient elements. The pH of a soil can determine the extent to which a nutrient is available to plants. The use of digestate improved the physico-chemical properties of highly acidic soils contributing to better nutrient availability and thus a reduction in pH over the course of three years of digestate application [2,70].

4.3. Apparent Nitrogen Recovery (ANR) and Nitrogen Fertilizer Replacement Value (NFRV)

According to Cavalli [39], the efficiency of plants to take up nitrogen from undigested manures and anaerobic digestion by-products (digestates) is usually evaluated via ANR and NFRV calculations.
The lower ANR and NFRV values in all bio-based treatments are likely the result of lower initial NH4-N/total N in tested products [71], especially in 2018 (Table 3). NH4-N/total N was statistically higher in 2019 (p < 0.0001) compared to 2018, probably due to the feedstock input that changed in the biogas plant (more liquid cattle manure was added in 2019). The NFRV increased slightly, but not significantly, for all treatments in 2019. During 2018 the statistically highest ANR was found for the MF treatment and a mixture of MF+LFD treatment (Table 6), while MF and a mixture of MF+LFD treatments were observed as having the highest results of all treatments in NFRV. As in 2019, ANR was highest for treatments with MF, a mixture of MF+SFD and a mixture of MF+LFD. Treatments with MF and mixtures of MF+LFD resulted in the statistically highest NFRV compared to other treatments. The highest NFRV after the MF treatment (100 ± 0) was recorded for MF+LFD (83 ± 9) treatment. During the two years of the experiment, NFRV decreased by 6% in the MF+LFD treatment. The lower ANR and NFRV values in LFD and SFD treatments may be influenced by differences in C:N ratio which may lead to the immobilization of mineral N and the mineralization of organic N in the first and following years after application. Also, there may be losses via ammonia volatilization due to incorporation of the fertilizers within minutes after application and the acidic soil pH [39,72].
As mentioned in the Introduction, the amount of NH4-N/total N depends on the feedstock input of AD and in the end reflects the total NFRV. According to Dai and Karring [73], pig manure contains more N (both organic N and ammonia) than cattle manure. This can lead to higher NFRV in pig manure than in cattle manure. Sigurnjak et al. [55] achieved an NFRV higher than 90% in their research with pig manure, which is lower than our results. Cavalli [39] found higher NFRV for LFD (25–30%) in the second and (75–80%) third year of application compared to SFD (20%) in the second and (20–25%) third year based on cattle manure, while in the present research NFRVs for LFD (48 ± 2%) and SFD (31 ± 6%) were higher in the second year.
In the context of sustainable agriculture and its practical implications for farmers, NFRV is crucial because it enhances nitrogen utilization, positively affecting yield and reducing environmental impact. Additionally, it can reduce the need for mineral fertilizers.

4.4. The Post-Harvested Status of the Soil

Nitrogen that is not taken up by the plant tends to undergo ammonia volatilization, denitrification and leaching, thus causing environmental concerns and problems of NO3-N leaching [55,74]. NO3-N residue in the soil during post-harvest sampling in 2018 and 2019 was taken in order to determine the concentration and the potential risk of NO3-N leaching. The experimental field soil contains 15.4% sand, 67.5% silt and 17.1% clay, and its texture is classified as silt–loam soil. According to Vukadinović [75], soils can be classified into at least five classes: from very light texture to very heavy texture. The soil on which this experiment was established belongs to the class of medium heavy soils, meaning it requires plowing and cultivation at the right time to reduce loss of plant nutrients through leaching.
Statistical differences were observed between treatments in 2018. Treatments with MF and a mixture of MF+LFD resulted in the highest NO3-N residue in the soil post- harvest. The increased risk of nitrate leaching in 2018 was due to improved conditions for mineralization, which significantly amplified the processes of ammonification and nitrification. The precipitation in June 2018, which amounted to 127.8 mm, contributed to increased nitrate leaching. Additionally, the favorable temperatures in May and June promoted better mineralization and nitrification. There was also a larger proportion of total mineral nitrogen in treatments fertilized with MF, as well as in mixtures of MF with digestate fractions, in 2018 compared to 2019. Consequently, these treatments (MF and MF+LFD) positively impacted the soil, resulting in higher mineral nitrogen content. The effect of mineral nitrogen on the soil was not negative and had a beneficial impact on yield. Concentration of NO3-N residue in the soil was further followed by treatment where a mixture of MF+SFD and LCM were used.
During 2019 there was no significant difference between treatments, yet the highest NO3-N residue was recorded for treatments where MF was used. The year 2019 had lower concentrations of NO3-N residue in the soil after harvest.
The results indicate that utilization of SFD and LFD should not additionally increase the risk of nitrate residue or leaching compared to MF.
The research indicates no negative environmental impact, as the negligible amounts of nitrogen leached at a depth of 0–90 cm are insignificant. In soils with low organic matter and low pH, applying organic materials, such as digestates, positively influences the physical and chemical properties of the soil by increasing the amount of organic matter, enhancing microbiological activity and improving nutritional value through the addition of essential nutrients.
The concentration of NO3-N residue in the soil was further followed by the treatment where a mixture of MF+SFD and LCM were used. As can be seen in Figure 2, MF treatment had the highest NO3-N residue in the soil post-harvest. In 2019 there was no significant difference between treatments, but the highest NO3-N residue was recorded in the MF treatment. The year 2019 showed lower concentrations of NO3-N residues in the soil after harvest. The results indicate that utilization of SFD and LFD should not additionally increase the risk of nitrate residues or leaching compared to MF.
As a member of the EU-27, the regulation on maximum allowable levels of nitrates in groundwater and surface water applies to Croatia, which is 50 mg L−1. As already mentioned, the Nitrates Directive (91/676/EEC) prescribes 170 kg N ha−1 as the maximum dosage for total N fertilization on NVZs. In the EU-27, NVZs are quite heterogenous from area to area. Some Member States have decided to ensure the same level of protection throughout their territory, while others have established NVZs [47]. According to Ondrašek et al. [46], the current situation in Croatia shows that nitrate vulnerable zones (NVZs) cover less than 10% of the national land territory.The TSMN dynamic was almost the same in both years at the beginning of the experiment. In 2018 TSMN amounted to 37 ± 3 kg ha−1, while in 2019 it was 38 ± 2 kg ha−1. At the beginning of the experiment, the previous crop on the experimental field was soybean. According to Vratarić and Sudarić [76], soybean enriches the soil with nitrogen at 40–60 kg ha−1, which corresponds to the amount of N present before the start of the experiment. As can be seen from Figure 3, a mixture of MF+LFD treatment had the highest amount of TSMN in vegetative stage V4 in both years, while at reproductive stage R5, MF treatment had the highest amount of TSMN of all treatments in both years. After fertilization, TSMN concentration increased from before sowing to reproductive stage R5 in all treatments and then decreased until reproductive stage R6 in all treatments through 2018 and 2019 (plant uptake). From the dry period from June to August, N uptake was lower (the elements are unreachable because of low precipitations and high temperatures). After the 2018 harvest some of the N remained in the soil and since the same experiment was set up next year, harvest residues from 2018 were ploughed and in time mineralized. Additionally, this was detected after analysis of the soil before the new experiment. A certain amount of TSMN was present in the soil before the 2019 experiment.
The novelty of this research lies in its innovative approach to enhancing the use of various bio-based materials, such as digestate, to improve soil health and its physical, chemical and biological properties over the long term. The results are applicable to different types of crops due to the increase in organic soil matter and nutrient content, which is of great importance for farmers focused on effective soil management.

5. Conclusions

The research indicates that it is possible to reduce the use of mineral fertilizers by incorporating the solid and liquid fractions of digestate. The effectiveness of this reduction largely depends on the input of raw materials (cattle manure, pig manure, chicken manure, energy crops, etc.). The combined use of mineral fertilizer (MF) with solid fraction of digestate (SFD) and liquid fraction of digestate (LFD) treatments proved particularly beneficial. This approach not only decreases the need for mineral fertilizers but it is also assumed that it positively impacts the reduction of greenhouse gas emissions. Additionally, it has a favorable effect on the physical and chemical properties of the soil, which was shown in this research. Also, applied organic N increased the NFRV of the liquid fraction of digestate in consecutive years. It defines the efficiency and productivity in plants and soil.
Utilization of the solid and liquid fractions of digestate did not additionally increase the risk of nitrate residue or leaching compared to mineral fertilizers.
The obtained results will serve as guidelines in fertilization with digestate and its total or partial replacement of mineral N fertilizers.

Author Contributions

Conceptualization, M.Š.V. and L.Č.; methodology, M.Š.V. and Ž.J.; formal analysis, M.Š.V. and B.L.; data curation, M.Š.V. and B.L.; writing—original draft preparation, M.Š.V., L.Č. and E.M.; writing—review and editing, M.Š.V., L.Č., E.M., Ž.J., M.P. and B.L. All authors have read and agreed to the published version of the manuscript.

Funding

The research is done as a part of the Systemic project that receives funding from the European Union’s Horizon 2020 Framework Programme for Research and Innovation under Grant Agreement no. 730400. See www.systemicproject.eu and www.biorefine.eu/projects/systemic for more information. Additionally, from the funds of professional cooperation of the Department of Plant Nutrition of the University of Zagreb Faculty of Agriculture.

Institutional Review Board Statement

Not applicable.

Data Availability Statement

The data that support the findings of this study are available from the corresponding author (M.Š.V.) upon reasonable request.

Acknowledgments

The publication was reviewed by Ivona Sigurnjak, Faculty of Bioscience Engineering, Ghent, Belgium. The publication was supported by the Open Access Publication Fund of the University of Zagreb Faculty of Agriculture.

Conflicts of Interest

The authors declare no conflicts of interest.

References

  1. Croatian Renewable Energy Sources Association. The Survival of Bio-Gas in Croatia Brought into Question. Developed: L33T Digital Agency. 2023. Available online: https://oie.hr/en/upitan-opstanak-bioplina-u-hrvatskoj/#:~:text=Croatia%20has%2048MW%20biogas%20plants,384.000%20MWH%20of%20electric%20power (accessed on 5 April 2024).
  2. Doyeni, M.O.; Stulpinaite, U.; Baksinskaite, A.; Suproniene, S.; Tilvikiene, V. The Effectiveness of Digestate Use for Fertilization in an Agricultural Cropping System. Plants 2021, 10, 1734. [Google Scholar] [CrossRef]
  3. Corden, C.; Bougas, K.; Cunningham, E.; Tyrer, D.; Kreißig, J.; Zetti, E.; Gamero, E.; Wildey, R.; Crookes, M. WOOD. Wood Environment & Infrastructure Solutions. Digestate and Compost as Fertilisers: Risk Assessment and Risk Management Options. European Comission, 2020. Available online: https://ec.europa.eu/environment/chemicals/reach/pdf/40039%20Digestate%20and%20Compost%20RMOA%20-%20Final%20report%20i2_20190208.pdf (accessed on 20 February 2024).
  4. Corden, C.; Bougas, K.; Cunningham, E.; Tyrer, D.; Kreissig, J.; Crookes, M. Digestate abd Compost as Fertilizer: Risk Assessment and Risk Menagement Options; Wood Environment and Infrastructure Solutions UK Limited: Aberdeen, UK, 2019; pp. 121–128. [Google Scholar]
  5. Scarlat, N.; Dallemand, J.F.; Fahl, F. Biogas: Developments and perspectives in Europe. Renew. Energy 2018, 129, 457–472. [Google Scholar] [CrossRef]
  6. Kulišić, B.; Par, V. Agricultural Potential for Biogas Production in Croatia. Agric. Conspec. Sci. 2009, 74, 215–220. [Google Scholar]
  7. European Biogas Association. EBA Statistical Report. Annual Statistical Report of the European Biogas Association Abriged Version; European Biogas Association: Bruxelles, Belgium, 2018. [Google Scholar]
  8. Petravić-Tominac, V.; Nastav, N.; Buljubašić, M.; Šantek, B. Current state of biogas production in Croatia. Sustain. Soc. 2020, 10, 8. [Google Scholar] [CrossRef]
  9. Vukadinović, V.; Jug, I. Adekvatnom Gnojidbom do Prinosa. Agroklub. 2015. Available online: https://www.agroklub.com/ratarstvo/adekvatnom-gnojidbom-do-prinosa/18726/ (accessed on 30 August 2020).
  10. HROTE. Povlašteni Proizvođači s Kojima je HROTE Sklopio Ugovor o Otkupu Električne Energije, a Čija su Postrojenja u Sustavu Poticanja. Electricity Purchase Agreement with Croatian Energy Market Operator; Hrvatski Operator Tržišta Energije, HROTE: Zagreb, Croatia, 2018. [Google Scholar]
  11. OIE HRVATSKA. Upitan Opstanak Bioplina u Hrvatskoj. 2023. Available online: https://oie.hr/upitan-opstanak-bioplina-u-hrvatskoj/ (accessed on 17 June 2024).
  12. Yuan, Z.L.; Gerbens-Leenes, P.W. Biogas feedstock potentials and related water footprints from residues in China and the European Union. Sci. Total Environ. 2021, 793, 148340. [Google Scholar] [CrossRef] [PubMed]
  13. Scarlat, N.; Fahl, F.; Dallemand, J.F.; Monforti, F.; Motola, F. A spatial analysis of biogas potential from manure in Europe. Renew. Sustain. Energy Rev. 2018, 94, 915–930. [Google Scholar] [CrossRef]
  14. Bacenetti, J.; Negri, M.; Fiala, M.; González-García, S. Anaerobic digestion of different feedstocks: Impact on energetic and environmental balances of biogas process. Sci. Total Environ. 2013, 463–464, 541–551. [Google Scholar] [CrossRef] [PubMed]
  15. Ðurđević, D.; Blecich, P.; Lenić, K. Energy potential of digestate produced by anaerobic digestion in biogas power plants: The case study of Croatia. Environ. Eng. Sci. 2018, 35, 1286–1293. [Google Scholar] [CrossRef]
  16. Vaneeckhaute, C.; Meers, E.; Michels, E.; Ghekiere, G.; Accoe, F.; Tack, F.M.G. Closing the nutrient cycle by using bio-digestion waste derivatives as synthetic fertilizer substitutes: A field experiment. Biomass Bioenergy 2013, 55, 175–189. [Google Scholar] [CrossRef]
  17. Passos, F.; Ortega, V.; Donoso-Bravo, A. Thermochemical pretreatment and anaerobic digestion of dairy cow manure: Experimental and economic evaluation. Bioresour. Technol. 2017, 227, 239–246. [Google Scholar] [CrossRef]
  18. Risberg, K.; Cederlund, H.; Pell, M.; Arthurson, V.; Schnürer, A. Comparative characterization of digestate versus pig slurry and cow manure—Chemical composition and effects on soil microbial activity. Waste Manag. 2017, 61, 529–538. [Google Scholar] [CrossRef] [PubMed]
  19. Ebner, J.H.; Labatut, L.A.; Lodge, J.S.; Williamson, A.A.; Trabold, T.A. Anaerobic co-digestion of commercial food waste and dairy manure: Characterizing biochemical parameters and synergistic effects. Waste Manag. 2016, 52, 286–294. [Google Scholar] [CrossRef] [PubMed]
  20. Wallace, P. Digestates: Realising the Fertilizer Benefits for Crops and Grassland; Waste and Resources Action Programme: Banbury, UK, 2011. [Google Scholar]
  21. WRAP. Using Quality Anaerobic Digestate to Benefit Crops; Waste & Resource Action Programme: Banbury, UK, 2012. [Google Scholar]
  22. WRAP. Digestate and Compost Use in Agriculture; WRAP: Banbury, UK, 2016; pp. 1–32. [Google Scholar]
  23. Lund, Z.F.; Doss, B.D. Residual effects of dairy cattle manure on plant growth and soil properties. Agron. J. 1980, 72, 123–130. [Google Scholar] [CrossRef]
  24. Magdoff, F.R.; Amadon, J.F. Yield trends and soil chemical changes resulting from N and manure application to continuous corn. Agron. J. 1980, 72, 161–164. [Google Scholar] [CrossRef]
  25. Görlitz, H.; Herrmann, V.; Jauert, R. Ertrag und Nahrstoffnutzung nach ein- und mehrjahrigen hohen Gullegaben zu Silomais sowie ihre Nachwirkung auf sandigen B€oden. Arch. Acker-Pflanzenb. Bodenk. Berlin 1985, 29, 55–60. [Google Scholar]
  26. Werner, W.; Scherer, H.W.; Drescher, D. Untersuchungen uber den Einfluss langjahriger Gulledungung auf N-Fraktionen und Nnachlieferung des Bodens. Zeitschr. Acker-Pflanzenb. 1985, 155, 137–144. [Google Scholar]
  27. Sommerfeldt, T.G.; Chang, C.; Entz, T. Long-term annual manure applications increase soil organic matter and nitrogen, and decrease carbon to nitrogen ratio. Soil Sci. Soc. Am. J. 1988, 52, 1668–1672. [Google Scholar] [CrossRef]
  28. Dilz, P.; Postmus, J.; Prins, W.H. Residual effect of long term applications of farmyard manure to silage maize maize. Fert. Res. 1990, 26, 249–252. [Google Scholar] [CrossRef]
  29. Czekala, W. Digestate as a Source of Nutrients: Nitrogen and Its Fractions. Water 2022, 14, 406. [Google Scholar] [CrossRef]
  30. Guo, J.H.; Lui, X.J.; Zhang, Y.; Shen, J.L.; Han, W.X.; Zhang, W.F.; Christie, P.; Goulding, K.W.T.; Vitousek, P.M.; Zhang, F.S. Significant Acidification in Major Chinese Croplands. Science 2010, 327, 1008–1010. [Google Scholar] [CrossRef]
  31. Bogunović, M.; Vidaček, Ž.; Racz, Z.; Husnjak, S.; Sraka, M. General Soil Map of Croatia, 1:300 000; University of Zagreb Faculty of Agriculture, Department of Soil Science: Zagreb, Croatia, 1996. [Google Scholar]
  32. Lazarević, B.; Horvat, T.; Poljak, M. Effect of Acid Aluminous Soil on Photosynthetic Parameters of Potato (Solanum tuberosum L.). Potato Res. 2014, 57, 33–46. [Google Scholar] [CrossRef]
  33. Bogunović, I.; Kisić, I. Soil Compaction on Clay Loam Soil in Pannonian Region of Croatia under Different Tillage Systems. J. Agric. Sci. Technol. 2017, 19, 475–486. [Google Scholar]
  34. Biró, B.; Varga, G.; Hartl, W.; Németh, T. Soil quality and nitrate percolation as affected by the horticultural and arable field conditions of organic and conventional agriculture. Acta Agric. Scand. Sect. B Soil Plant Sci. 2005, 55, 111–119. [Google Scholar] [CrossRef]
  35. Alburquerquea, J.A.; de la Fuentea, C.; Campoya, M.; Carrascoa, L.; Nájerab, I.; Baixaulib, C.; Caravacaa, F.; Roldána, A.; Cegarraa, J.; Bernala, M.P. Agricultural use of digestate for horticultural crop production and improvement of soil properties. Eur. J. Agron. 2012, 43, 119–128. [Google Scholar] [CrossRef]
  36. European Commission. The Nitrates Directive 1991. Available online: http://ec.europa.eu/environment/water/water-nitrates/index_en.html (accessed on 25 March 2024).
  37. Reuland, G.; Sigurnjak, I.; Dekker, H.; Michels, E.; Meers, E. The Potential of Digestate and the Liquid Fraction of Digestate as Chemical Fertilizer Substitutes under the RENURE Criteria. Agronomy 2021, 11, 1374. [Google Scholar] [CrossRef]
  38. Schroder, J. Revisiting the agronomic benefits of manure: A correct assessment and exploitation of its fertilizer value spares the environment. Bioresour. Technol. 2005, 96, 253–261. [Google Scholar] [CrossRef] [PubMed]
  39. Cavalli, D.; Cabassi, G.; Borrelli, L.; Geromel, G.; Bechini, L.; Degano, L.; Marino Gallinaa, P. Nitrogen fertilizer replacement value of undigested liquid cattlemanure and digestates. Eur. J. Agron. 2016, 73, 34–41. [Google Scholar] [CrossRef]
  40. Thun, R.; Herrmann, R.; Knickmann, E. Die Untersuchung von Boden. Radebeuel und Berlin; Neumann Verlag: Berlin, Germany, 1955. (In German) [Google Scholar]
  41. DHMZ—Croatian Meteorological and Hydrological Service. Average Temperature and Precipitation for Year 2018; DHMZ: Zagreb, Croatia, 2018. [Google Scholar]
  42. DHMZ—Croatian Meteorological and Hydrological Service. Average Temperature and Precipitation for Year 2019; DHMZ: Zagreb, Croatia, 2019. [Google Scholar]
  43. Pucarić, A.; Ostojić, Z.; Čuljat, M. Proizvodnja Kukuruza; Biblioteka Poljoprivredni Savjetnik: Zagreb, Croatia, 1997. [Google Scholar]
  44. ConsultAre. BPP Bojana. Trg Petra Zrinskog, Vrbovec. Available online: https://www.consultare.hr/hr/projekti/bpp-bojana-cazma (accessed on 24 July 2024).
  45. Gašpar. I. Gnojidba Ratatskih Kultura. Petrokemija.d.d.; Studio Grafičkih Ideja: Zagreb, Croatia, 2000; 40p. (In Croatian) [Google Scholar]
  46. Ondrašek, G.; Bakić Begić, H.; Romić, D.; Brkić, Ž.; Husnjak, S.; Bubalo Kovačić, M. A novel LUMNAqSoP approach for prioritising groundwater monitoring stations for implementation of the Nitrates Directive. Environ. Sci. Eur. 2021, 33, 23. [Google Scholar] [CrossRef]
  47. Ministarstvo Poljoprivrede (NN 60/2017). II. Akcijski Program Zaštite Voda Od Onečišćenja Uzrokovanog Nitratima Poljoprivrednog Podrijetla. Off. Gazette 2017, 1360, 23. Available online: https://narodne-novine.nn.hr/clanci/sluzbeni/2017_06_60_1368.html (accessed on 27 February 2024). (In Croatian).
  48. Corteca agriscience. Catalog Pioneer Seed. Available online: https://www.corteva.hr/proizvodi/sjeme/kukuruz/p0725.html (accessed on 5 May 2024).
  49. Abendroth, L.J.; Elmore, R.W.; Boyer, M.J.; Marlay, S.K. Corn Growth and Development; Iowa State University. University Extension: Ames, IA, USA, 2011; PMR 1009. [Google Scholar]
  50. Bremner, J.M.; Kwwnwy, D.R. Steam destilation methods for determination of ammonium, nitrate and nitrite. Anal. Chim. Acta 1964, 32, 485–495. [Google Scholar] [CrossRef]
  51. European Parliament. EU Fertilising Products. Annex I. Product Function Categories (PFCs) of EU Fertilising Products. Part II. Requirements Related to PFCS; EU: Strasbourg, France, 2019; p. 119. [Google Scholar]
  52. AOAC. Officinal Method of Analysis of AOAC International; AOAC: Gaithersburg, MD, USA, 2015. [Google Scholar]
  53. Keeney, D.R.; Nelson, D.W. Nitrogen—Inorganic Forms from Methods of Soil Analysis; Page, A.I., Miller, R.H., Keeney, D.R., Eds.; American Society of Agronomy and Soil Science Society of America: Madison, WI, USA, 1982; pp. 643–693. [Google Scholar]
  54. JDPZ. Kemijske Metode za Ispitivanje Zemljišta, Priručnik za Ispitivanje Zemljišta; Jugoslovensko Društvo za Proučavanje Zemljišta: Beograd, Serbia, 1966. (In Serbian) [Google Scholar]
  55. Sigurnjak, I.; Vaneeckhaute, C.; Michels, E.; Ryckaert, B.; Ghekiere, G.; Tack, F.M.G.; Meers, E. Fertilizer performance of liquid fraction of digetate as synthetic nitrogen sustitute in silage maize cultivation for three consecutive years. Sci. Total Environ. 2017, 599–600, 1885–1894. [Google Scholar] [CrossRef] [PubMed]
  56. Krištof, M. Statistical Yearbook of the Republic of Croatia; Ostroški, L., Čajkušić, S., Čizmović, Ž., Jukić, D., Lipavić, V., Ostroški, L., Pekeč, M., Primorac Čačić, M., Eds.; Državni zavod za statistiku Republike Hrvatske: Zagreb, Croatia, 2018. [Google Scholar]
  57. Culy, M.D.; Edwards, C.R.; Cornelius, J.R. Effect of Silk Feeding by Western Corn Rootworm (Coleoptera: Chrysomelidae) on Yield and Quality of Inbred Corn in Seed Corn Production Fields. J. Econ. Entomol. 1992, 85, 2440–2446. [Google Scholar] [CrossRef]
  58. Hrgović, S. Osnove agrotehnike proizvodnje kukuruza (Zea mays). Glas. Zaštite Bilja 2007, 30, 48–61. [Google Scholar]
  59. Tollenaar, M.; Dwyer, L.M. Physiology of Maize; Springer: Berlin/Heidelberg, Germany, 1999; pp. 169–204. [Google Scholar]
  60. Westgate, M.E.; Otegui, M.E.; Andrade, F.H. Physiology of the Corn Plant. In Corn: Origin, History, Technology and Production; Smith, C.W., Betrán, J., Runge, E.C.A., Eds.; John Wiley and Sons Inc.: Hoboken, NJ, USA, 2004. [Google Scholar]
  61. Cvjetićanin, P.; Kanižaj, Ž.; Žanić, M.; Šimičević, M.; Štimac, V.; Valentić, M.; Ćališ, D.; Grlica, A. Agriculture, forestry and fishing. In Statistical Yearbook of the Republic of Croatia; Croatia Bureau of Statistics: Zagreb, Croatia, 2017; Available online: https://www.dzs.hr/Hrv_Eng/ljetopis/2017/sljh2017.pdf (accessed on 30 August 2020).
  62. Chantigny, M.H.; Angers, D.A.; Bélanger, G.; Rochette, P.; Eriksen-Hamel, N.; Bittman, S.; Buckley, K.; Massé, D.; Gasser, M.-O. Yield and Nutrient Export of Grain Corn Fertilized with Raw and Treated Liquid Swine Manure. Agron. J. 2008, 100, 1303–1309. [Google Scholar] [CrossRef]
  63. Rhoads, F.M.; Manning, A. Soybean, corn, and wheat yields with variable soil pH on plinthic Acrisols. Fert. Res. 1989, 19, 137–142. [Google Scholar] [CrossRef]
  64. Alam, S.M. Nutrient uptake by plants under stress conditions. In Handbook of Plant and Crop Stress, 2nd ed.; Pessarakli, M., Ed.; Marcel Dekker Inc.: New York, NY, USA, 1999; pp. 285–315. [Google Scholar]
  65. Fageria, N.K.; Zimmermanna, F.J.P. Influence of pH on Growth and Nutrient Uptake by Crop Species in an Oxisol. Commun. Soil Sci. Plant Anal. 1998, 29, 2675–2682. [Google Scholar] [CrossRef]
  66. Bergmann, W. Nutritional Disorders of Plants. Development, Visual and Analytical Diagnosis; Gustav Fisher Verlag Jena: Stuttgard, Germany; New York, NY, USA, 1992; pp. 17–26. [Google Scholar]
  67. Schimel, J.P. Life in dry soils: Effects of drought on soil microbial communities and processes. Annu. Rev. Ecol. Evol. Syst. 2018, 49, 409–432. [Google Scholar] [CrossRef]
  68. Ali, N.S.; Hassan, W.F.; Janno, F.O. Soil iron and nitrogen availability and their uptake by maize plants as related to mineral and bio nitrogen fertilizers application. Agric. Biol. J. N. Am. 2015, 6, 118–122. [Google Scholar]
  69. Marschner, P. Mineral Nutrition of Higher Plants, 3rd ed.; Academic Press: London, UK, 2012; pp. 135–178. [Google Scholar]
  70. Głowacka, A.; Szostak, B.; Klebaniuk, R. Effect of Biogas Digestate and Mineral Fertilisation on the Soil Properties and Yield and Nutritional Value of Switchgrass Forage. Agronomy 2020, 10, 490. [Google Scholar] [CrossRef]
  71. Reijs, J.W.; Sonneveld, M.P.W.; Sørensen, P.; Schils, R.L.M.; Groot, J.C.J.; Lantinga, E.A. Effects of different diets on utilization of nitrogen from cattle slurryapplied to grassland on a sandy soil in The Netherlands. Agric. Ecosyst. Environ. 2007, 118, 65–79. [Google Scholar] [CrossRef]
  72. Sommer, S.G.; Hutchings, N.J. Ammonia emission from field applied manure and its reduction-invited paper. Eur. J. Agron. 2001, 15, 1–15. [Google Scholar] [CrossRef]
  73. Dai, X.; Karring, H. A Determination and Comparison of Urease Activity in Feces and Fresh Manure from Pig and Cattle in Relation to Ammonia Production and pH Changes. PLoS ONE 2014, 9, e110402. [Google Scholar] [CrossRef] [PubMed]
  74. De Vos, J.A.; Hesterberg, D.; Raats, P.A.C. Nitrate Leaching in a Tile-Drained Silt Loam Soil. Soil Sci. Soc. Am. J. 2000, 64, 517–527. [Google Scholar] [CrossRef]
  75. Vukadinović, V.; Vukadinović, V. Ishrana Bilja; Sveučilište Josipa Jurja Strossmayera u Osijeku, Poljoprivredni Fakultet u Osijeku: Osijek, Croatia, 2011. [Google Scholar]
  76. Vratarić, M.; Sudarić, A. Soja; Poljoprivredni institut Osijek: Osijek, Croatia, 2000. [Google Scholar]
Figure 1. Total dry grain yield (TDGY) t ha−1 during two consecutive years. Letters indicate significant differences between treatments (p < 0.001). Key: C—unfertilized control; MF—mineral fertilizer; LCM—liquid cattle manure; SFD—solid fraction of digestate; LFD—liquid fraction of digestate; MF+SFD—a mixture of mineral fertilizer with solid fraction of digestate; MF+LFD—a mixture of mineral fertilizer with liquid fraction of digestate.
Agriculture 14 01243 g001
Figure 2. Nitrate residue kg ha−1 in soil (0–90 cm) after harvest time for the seven different fertilization treatments during two consecutive years. Letters indicate significant differences between groups for 2018 (p < 0.003) and for 2019 (p < 0.79). Key: C—unfertilized control; MF—mineral fertilizer; LCM—liquid cattle manure; SFD—solid fraction of digestate; LFD—liquid fraction of digestate; MF+SFD—a mixture of mineral fertilizer with soild fraction of digestate; MF+LFD—a mixture of mineral fertilizer with liquid fraction of digestate.
Agriculture 14 01243 g002
Figure 3. Total soil mineral nitrogen (TSMN) (0–30 cm) kg NO3 ha−1 before fertilization and after fertilization for two consecutive years during maize growth. Different letters represent significantly different values according to Tukey’s test, p ≤ 0.05. The non-letter values are not significantly different. Key: C—unfertilized control; MF—mineral fertilizer; LCM—liquid cattle manure; SFD—solid fraction of digestate; LFD—liquid fraction of digestate; MF+SFD—a mixture of mineral fertilizer with soild fraction of digestate; MF+LFD—a mixture of mineral fertilizer with liquid fraction of digestate. BF—soil sampling before fertilization; V4—soil sampling during vegetative stage V4; R5—soil sampling during reproductive stage R5; R6—soil sampling after harvest time.
Agriculture 14 01243 g003
Table 1. Physico-chemical properties of the soil from the experimental field (0–30 cm layer).
Depth cmpH DWNmin FW
kg ha−1 of Soil
P2O5 DW
mg 100 g−1 of Soil
K2O DW
mg 100 g−1 of Soil
YearH2OKCl
20180–305.47 ± 0.114.21 ± 0.0937.34 ± 3.1316.68 ± 1.0621.63 ± 1.46
20190–305.26 ± 0.083.93 ± 0.1138.45 ± 1.5514.13 ± 1.6718.53 ± 1.07
Note. DW—dry weight; FW—fresh weight.
Table 2. Weather conditions of average air temperature (°C) and precipitations (mm) during the maize growing season in 2018, 2019 [41,42] and 70-year period [43].
Month
Temperature °CAprilMayJuneJulyAugustSeptemberOctober
70-year period *11.315.919.421.120.416.211.0
201816.119.521.422.523.717.713.7
201912.413.723.822.923.517.213.2
Precipitation mm
70-year period *61.578.097.280.887.089.375.9
201865.868.7127.885.240.759.088.6
201981.1147.770.876.856.7150.142.3
Note. * 70-year period on average.
Table 3. Physico-chemical characterization of liquid cattle manure (LCM), solid fraction of digestate (SFD) and liquid fraction of digestate (LFD) per year.
ParametersLCMSFDLFDLCMSFDLFD
Year20182019
Dry matter (%)8.9 ± 0.120.3 ± 0.54.9 ± 0.29.3 ± 0.728.8 ± 0.95.4 ± 0.1
Organic matter (g kg−1)71.8 ± 2.487.3 ± 0.069.5 ± 0.177.6 ± 0.288.1 ± 0.269.6 ± 0.1
Organic carbon (g kg−1)41.5 ± 1.450.5 ± 0.040.2 ± 0.144.8 ± 0.150.9 ± 0.140.2 ± 0.1
pH6.6 ± 0.08.7 ± 0.07.7 ± 0.07.0 ± 0.08.9 ± 0.07.7 ± 0.0
EC (mS cm−1)13.0 ± 0.11.3 ± 0.015.2 ± 0.213.4 ± 0.21.5 ± 0.117.7 ± 0.2
N total (g kg−1)4.1 ± 0.612.7 ± 2.28.1 ± 0.43.9 ± 0.76.9 ± 0.44.0 ± 0.8
NH4-N (g kg−1)0.6 ± 0.00.6 ± 0.00.8 ± 0.01.3 ± 0.01.3 ± 0.01.7 ± 0.0
N organic (g kg−1)3.5 ± 0.012.1 ± 0.07.3 ± 0.02.6 ± 0.05.6 ± 0.02.3 ± 0.0
P total (g kg−1)2.0 ± 0.03.4 ± 0.01.2 ± 0.00.7 ± 0.02.2 ± 0.00.7 ± 0.1
K total (g kg−1)3.5 ± 0.02.8 ± 0.03.5 ± 0.02.8 ± 0.12.6 ± 0.33.3 ± 0.0
Ca total (g kg−1)4.4 ± 0.62.5 ± 0.11.9 ± 0.04.4 ± 0.13.0 ± 0.21.1 ± 0.0
Mg total (g kg−1)0.8 ± 0.01.4 ± 0.00.9 ± 0.00.9 ± 0.01.6 ± 0.00.6 ± 0.0
Fe total (mg kg−1)104.0 ± 2.1193.6 ± 7.0135.6 ± 4.982.7 ± 6.3195.7 ± 12.879.1 ± 1.9
Zn total (mg kg−1)14.2 ± 0.215.6 ± 1.811.4 ± 0.319.9 ± 0.222.5 ± 0.214.1 ± 0.3
Mn total (mg kg−1)14.4 ± 0.484.0 ± 2.312.6 ± 0.023.6 ± 1.337.0 ± 0.621.7 ± 0.8
Cu total (mg kg−1)18.7 ± 0.620.7 ± 2.517.6 ± 0.55.7 ± 0.113.2 ± 0.97.5 ± 0.2
C/N total10.1 ± 0.04.0 ± 0.05.0 ± 0.011.5 ± 0.07.4 ± 0.010.1 ± 0.0
C/N organic11.9 ± 0.04.2 ± 0.05.5 ± 0.017.2 ± 0.09.1 ± 0.017.5 ± 0.0
N/P2.0 ± 0.03.8 ± 0.07.0 ± 0.05.8 ± 0.03.2 ± 0.05.9 ± 0.0
NH4-N/N total0.2 ± 0.00.1 ± 0.00.1 ± 0.00.3 ± 0.00.2 ± 0.00.4 ± 0.0
N organic/N total0.9 ± 0.01.0 ± 0.00.9 ± 0.00.7 ± 0.00.8 ± 0.00.6 ± 0.0
Note. LCM—liquid cattle manure; SFD—solid fraction of digestate; LFD—liquid fraction of digestate, mean values ± standard deviations are presented (n = 3).
Table 4. Dosage of total nitrogen (kg ha−1) applied for the seven different fertilization treatments; P2O5 and K2O were brought to the field via application of original fertilization regime of total nitrogen; additional application of mineral CAN (kg ha−1) in order to satisfy mineral fertilization.
TreatmentYearBF bNPKCANLCMSFDLFDTotal NN-NH4N-NO3P2O5 ContributionK2O Contribution
kg N ha−1
Added to the Soil
kg ha−1kg ha−1
Added to the Soil
C201830-----30
201930-----30
MF a2018307070---14079617070
2019307070---14075657070
LCM201830--140--14020-12068
201930--140--14047-10024
SFD201830---140-1407-3136
201930---140-14026-5344
LFD201830----14014014-6021
201930----14014060-11724
MF+SFD a20183070--70-14047268588
20193070--70-14053309792
MF+LFD a20183070---70140512610080
20193070---70140693012982
Note. a 50% of total N (140 kg N ha−1) from NPK and 50% of N from CAN were added to the soil; 50% of total N (140 kg N ha−1) from SFD and 50% of N from NPK were added to the soil; 50% of total N (140 kg N ha−1) from LFD and 50% of N from NPK were added to the soil. b Total N that was determined in the soil before fertilization. C—unfertilized control; MF—mineral fertilizer (NPK—ammonium-nitrate-based fertilizer + CAN—calcium-ammonium-nitrate-based fertilizer); LCM—liquid cattle manure; SFD—solid fraction of digestate; LFD—liquid fraction of digestate; MF+SFD—a mixture of mineral fertilizer with solid fraction of digestate; MF+LFD—a mixture of mineral fertilizer with liquid fraction of digestate.
Table 5. ANOVA table with p values for fresh and dry weight of aboveground biomass yield during three vegetative stages of maize growth.
SourceDfFW Yield t ha−1DW Yield t ha−1
p Value
Year1<0.0001<0.0001
Treatment6<0.0001<0.0001
Year × treatment60.07140.1810
Vegetative stage2<0.0001<0.0001
Year × vegetative stage2<0.0001<0.0001
Treatment × vegetative stage12<0.0001<0.0001
Year × treatment × vegetative stage120.57100.7514
Note. FW—fresh weight of aboveground biomass yield; DW—dry weight of aboveground biomass yield.
Table 6. Total average maize nutrient uptake for the seven different fertilization treatments (2018–2019).
ParametersCMFLCMSFDLFDMF+SFDMF+LFD
Total N (kg ha−1)153.1 d271.9 a201.7 c194.6 c209.7 c231.8 b249.3 b
Total P (kg ha−1)56.2 b70.7 a67.3 a67.3 a65.0 ab68.0 a70.6 a
Total K (kg ha−1)141.6 b181.9 a165.7 ab179.7 a167.5 ab181.6 a189.6 a
Total Ca (kg ha−1)27.4 b43.5 a35.2 ab34.2 ab35.5 ab37.5 ab41.3 a
Total Mg (kg ha−1)21.0 c29.3 a25.6 b25.6 b25.1 b26.3 ab28.4 ab
Total Fe (kg ha−1) *3.53.43.33.63.13.73.7
Total Zn (g ha−1) **0.360.400.410.390.380.410.40
Total Mn (g ha−1)0.57 b0.77 a0.62 ab0.66 ab0.68 ab0.78 a0.76 ab
Total Cu (g ha−1)0.07 d0.12 a0.09 bc0.08 cd0.09 bc0.10 ab0.10 ab
Note. * No statistical difference between treatments (p < 0.7216); ** no statistical difference between treatments (p < 0.1197). Different letters represent significantly different values according to Tukey’s test, p ≤ 0.05. The non-letter values are not significantly different. Key: C—unfertilized control; MF—mineral fertilizer (NPK—ammonium-nitrate-based fertilizer + CAN—calcium-ammonium-nitrate-based fertilizer); LCM—liquid cattle manure; SFD—solid fraction of digestate; LFD—liquid fraction of digestate; MF+SFD—a mixture of mineral fertilizer with solid fraction of digestate; MF+LFD—a mixture of mineral fertilizer with liquid fraction of digestate.
Table 7. Apparent nitrogen recovery (ANR) and nitrogen fertilizer replacement value (NFRV) table for the seven different fertilization treatments.
TreatmentANRNFRV %
2018201920182019
C----
MF0.77 ± 0.080.93 ± 0.08100 ± 0100 ± 0
LCM0.32 ± 0.040.38 ± 0.0941 ± 1041 ± 5
SFD0.30 ± 0.040.29 ± 0.0639 ± 731 ± 6
LFD0.36 ± 0.010.45 ± 0.0647 ± 748 ± 2
MF+SFD0.41 ± 0.060.72 ± 0.0953 ± 1077 ± 8
MF+LFD0.60 ± 0.070.77 ± 0.0978 ± 1083 ± 9
Note. C—unfertilized control; MF—mineral fertilizer (NPK—ammonium-nitrate-based fertilizer + CAN—calcium-ammonium-nitrate-based fertilizer); LCM—liquid cattle manure; SFD—solid fraction of digestate; LFD—liquid fraction of digestate; MF+SFD—a mixture of mineral fertilizer with solid fraction of digestate; MF+LFD—a mixture of mineral fertilizer with liquid fraction of digestate.
Disclaimer/Publisher’s Note: The statements, opinions and data contained in all publications are solely those of the individual author(s) and contributor(s) and not of MDPI and/or the editor(s). MDPI and/or the editor(s) disclaim responsibility for any injury to people or property resulting from any ideas, methods, instructions or products referred to in the content.

