Article

Nitrogen Rate Assessment for Greenhouse Gas Emission Mitigation and Quality Maintenance in Sustainable Turf Management

1
Department of Agriculture, Food, Environment and Forestry, University of Florence, Piazzale delle Cascine 18, 50144 Florence, Italy
2
Department of Agriculture, Food and Environment, University of Pisa, Via del Borghetto 80, 56124 Pisa, Italy
*
Author to whom correspondence should be addressed.
Agriculture 2024, 14(8), 1244; https://doi.org/10.3390/agriculture14081244 (registering DOI)
Submission received: 18 June 2024 / Revised: 23 July 2024 / Accepted: 25 July 2024 / Published: 27 July 2024
(This article belongs to the Section Ecosystem, Environment and Climate Change in Agriculture)

Abstract

:
Turfgrass systems hold significant climate change mitigation value, but their management often negates the beneficial effects due to the intense adoption of external inputs. The research objective in this paper was to assess the nitrogen fertilization rate able to maintain the ideal esthetic characteristics of Zoysia turfgrass, reducing the environmental impacts associated with greenhouse gas (GHG) emissions. A two-year open field experiment was conducted. Nitrogen was added to the soil at six rates (0, 50, 100, 150, 200, and 250 kg ha−1). The GHG emissions were monitored using a portable gas analyzer and the static chamber methodology. Cumulative environmental impacts were calculated from the inclusion of CO2, CH4, and, N2O using the Global Warming Potential (GWP). The quality assessment of the turf was assessed through a visual and instrumental approach. Higher CO2 and N2O fluxes were linked to high nitrogen rates, ranging from 83.55 to 87.50 and from 0.046 to 0.047 g N-N2O ha−1 day−1 for 200 and 250 kg N ha−1, respectively. CH4 emissions were not correlated to nitrogen rates. Higher GWP impacts were linked to high N rate treatments. A rate of 100 kg N ha−1 is recommended as the best strategy to reduce GHG emissions while maintaining high turf quality.

1. Introduction

Anthropogenic emissions are the main contributors to climate change. Agriculture, and related activities, are responsible for a relevant quantity of greenhouse gas (GHG) emissions [1]. More than carbon dioxide (CO2), methane (CH4), and nitrous oxide (N2O) are two important GHGs with a Global Warming Potential (GWP) of 27–30 and 273, respectively, over a lifespan of 100 years [2]. Despite intense research efforts into GHG emission dynamics from agricultural lands, research into turfgrass land uses is scarce [3,4,5]. Townsend-Small and Czimczik [6] reported comparable emissions of N2O from both turfgrass and agricultural soils, highlighting the importance of including this land use within the regional budget assessment of N2O. Moreover, due to the variability of data on CH4 dynamics from turfgrasses, the requisite to focus on studies involving turfgrasses was emphasized [5].
Turfgrasses have a crucial role in rural and urban systems, providing countless ecosystem services including environmental, social, and economic benefits. The positive effect of turfgrasses is amplified in urban areas where anthropogenic activities have the highest negative impacts. Turfgrasses predominantly serve as urban islands to moderate temperatures and mitigate heat effects [7]. Turfgrasses play a key role in the improvement of living conditions in urban areas as they collectively contribute to decreasing pollution and increasing carbon (C) sequestration, and soil biodiversity [6,8]. The esthetical, recreational, social, and psychological/physiological benefits of turfs have been well documented during recent decades. All these aspects have direct economic benefits for urban and, indirectly, rural communities [7]. Turfgrass management has also highlighted some controversial aspects that are mainly linked to resource depletion and external input uses. Nevertheless, between turfgrass species, Zoysia spp., a popular warm season turfgrass used worldwide for sports fields and ornamental lawns, is well recognized for its stress and pest tolerance and for its low input requirements [9,10]. The role of agricultural activities that are not directly connected with food production represent a crucial aspect that have to be considered within the agricultural system.
In light of climate change, involving increased dry periods, high water consumption is a serious issue. The intense adoption of fertilizers increases the risk of GHG emissions, especially when combined with over-irrigation [8]. Indeed, fertilization is one of the driving factors of N2O emissions from turfgrass, although other factors including irrigation, types of N-based fertilizers, and spreading technique may significantly affect N2O fluxes [11]. In this sense, the evaluation of the environmental impacts of turfgrass management is a crucial aspect to be considered. A recent study [12] in the USA reported average emissions of 0.361 g CO2-C m−2 h−1 and 14.4 µg N2O-N m−2 h−1 from an input of 150 kg N ha−1 for typical C4 turf species (bermudagrass and zoysiagrass). Once again using 150 kg N ha−1 but in the Mediterranean region, Brandani et al. [13] observed 0.230 g CO2-C m−2 h−1 and 0.537 µg CH4-C m−2 h−1 from tall fescue, and 0.214 g CO2-C m−2 h−1 and 0.405 µg CH4-C m−2 h−1 from bermudagrass, respectively. Similar to croplands, in order to reduce the environmental pressure of turfs, innovative fertilizers are starting to be applied. A recent study reported an average reduction of 20% of N2O emissions from a coated urea compared to urea on turfs [14]. More specifically, urea was shown to be the most impactful N-based fertilizer, showing higher emissions (around 10%) than non-urea-based fertilizers.
Thus, the role of turfs on global emission dynamics in the last decades is increasing because of the rapid expansion of this type of land use in urban environments [15]. In order to maximize the intrinsic performance, both ornamental and sport turfs require high amounts of external inputs (fertilizers and water). On the one hand, the intensive use of N-based fertilizers and increased water usage enhance the growth of the turf and its potential to store organic C. On the other hand, the aforementioned factors increase soil GHG emissions [6].
Nitrogen (N) fertilization on turfgrass is an important practice in maintaining the green color, density, and recovery from stresses, and ensuring optimal turfgrass quality [16,17,18]. Previous studies have focused on implementing indirect sensing tools (chlorophyll meters, reflectance measurements, color analysis), to obtain a near-optimal quality whilst reducing N inputs and N losses to a minimum [17,19]. This approach, which is the basis of Precision Agriculture (PA), involves the combined use of vegetation indices and vegetation parameters [20,21]. Among the indices, the Normalized Difference Vegetation Index (NDVI) is the most widely used. It is a reflectance-based indicator of plant stress [16]. The NDVI is positively correlated with turfgrass quality and ranges from 0 to 1, with higher values indicating improved plant health [22,23]. An alternative to the spectroradiometric approach, involving the use of the NDVI, is the Dark Green Color Index (DGCI) proposed by Karcher and Richardson [24]. Through the use of a smartphone or tablet application called FieldScout GreenIndex+ Turf (Spectrum Technologies, Inc., Aurora, IL, USA) (Spectrum Technologies, Inc. 2018), the operator can capture pictures, calculate the DGCI, and immediately produce a visual rating of turfgrass quality [18,25].
The present study aims to evaluate the effects of N fertilization on soil GHG emissions and the quality performance of zoysia turfgrass to define the optimal N rate for reducing environmental impacts while maintaining the ideal esthetic characteristics of turfgrass. Implementing management practices based on a more efficient fertilization strategy, which ensures high turfgrass quality with lower GHG emissions, would enhance the agroecological value of turfgrasses and reduce their impact on urban environments.

2. Materials and Methods

The experiment was carried out from June to September in both 2019 and 2020 at the Centre for Research on Turfgrass for Environment and Sports—CeRTES (43°40′ N, 10°19′ E, 6 m a.s.l.), Department of Agriculture, Food and Environment, University of Pisa (Pisa, Italy). The experiment was conducted on a mature stand of Zoysia matrella (L.) Merr. ‘Zeon’ cultivated on a calcaric fluvisol-type soil (Table 1). This study was conducted over a 4-month period, corresponding to the plant’s main vegetation period. In fact, Zoysia is a warm season grass that undergoes the majority of its growth during the summer months, entering dormancy in the fall and winter.

2.1. Experimental Design

The experiment was organized in a randomized complete block design with three blocks and one replicate per fertilization treatment within blocks (Figure 1). Six fertilization treatments (a total of 18 plots) with different N rates were tested to evaluate both the GHG emissions and the quality performances of the turf. Plot dimensions were 1.5 m × 1.5 m (surface of 2.25 m2 each). Treatments were organized as follows: (i) control with 0 kg of N ha−1 (0 N), (ii) 50 kg of N ha−1 (50 N), (iii) 100 kg of N ha−1 (100 N), (iv) 150 kg of N ha−1 (150 N), (v) 200 kg of N ha−1 (200 N), and (vi) 250 kg of N ha−1 (250 N). Except for 0 N, ammonium sulphate (21-0-0) was manually spread in a single application at the beginning of the experiment, simulating a rotary spreader. After the fertilization, 5 mm of water was applied to incorporate the fertilizer into the soil.
On a weekly basis, a walk-behind lawnmower (John Deere 20SR7, Moline IL, USA) equipped with a rear clippings bagger was used for mowing to maintain a turf height of 2.0 cm. Irrigation was carried out when needed using a sprinkler system to prevent drought stress and encourage turf growth. No weed or pest control was necessary during the trial. Minimum, maximum, and average temperatures, as well as precipitation levels, were monitored from a weather station from the Regional Hydrological Service of Tuscany, located next to the field trial in S. Piero a Grado (PI, Italy) (Figure 2).

2.2. Monitoring Greenhouse Gas Emissions and Assessment of Global Warming Potential

GHG emissions were measured using the static chamber methodology approach [26]. The chambers consisted of an anchor system and a lid. The anchor system was made up of a PVC cylinder with a diameter of 20 cm and a height of 15 cm, which was inserted into the soil at a depth of approximately 10 cm to support the lid. The lid of the chamber was composed of a PVC cylinder with a diameter of 20 cm and a height of 25 cm, as well as a PVC stopper that was sealed using silicon glue. To minimize the impact of solar radiation on the internal temperature of the chamber, a reflective Mylar tape was applied to the exterior surface of the lid. A vent port was organized on the wall of the chamber using a quick connector and a non-steady-state pipe of 9 cm to avoid any risk of gas saturation inside the chamber. To allow for gas sampling, a hole with a diameter of 13.2 mm was drilled into the top of the lid, which was covered with a butyl rubber septum with a diameter of 20 mm. The connection between the anchor and the lid was made hermetic by sealing a strip of tire tube measuring 7 cm in length onto the bottom of the lid using silicon glue. During the measurements, the part of the strip that extended beyond the lid (about 50% of the strip) was folded down over the anchor system.
GHG measurements were carried out with a portable gas analyzer (Madur Sensonic X-CGM 400 (Zgierz, Poland) using non-dispersive infrared (NDIR) technology with an accuracy of ± 1 ppm for both CO2 and CH4. The connection between the chambers and the gas analyzer was made using a PFTE pipe system equipped with a needle.
Gas measurements were taken by inserting the needle into the butyl rubber septum of the chamber for a duration of one minute. Air was then pumped into the gas analyzer and then released outside after the analysis was completed. The gas concentrations, measured in ppm, were obtained directly from the analyzer. Two gas samples were collected per chamber. The first sample was taken immediately after the chamber was closed and the second after one hour of gas accumulation inside the sealed chamber, according to the method of Parkin and Venterea [26] and Verdi et al. [27]. The difference between the two samples represented the internal gas concentration of the chamber. GHG fluxes were obtained by using the following parameters: internal gas concentration, internal air temperature, surface of area covered by chambers (314 cm2), chamber volume (9420 cm3), and the molar weight of each gas to convert data from ppm to Kg-C ha−1. As described by Parkin and Venterea [26] and Verdi et al. [27], the measurements were carried out in the mid-morning (between 9.00 and 11.00 a.m.), as this period was shown to align more closely with the daily average temperature, on a bi-weekly basis. Measurements lasted for 82 and 86 days in 2019 and 2020, respectively [from Day of the Year (DOY) 154 to 240 in 2019 and from DOY 164 to 246 in 2020]. Thus, in both years, six samplings were carried out starting from day 1 (D1) at fertilization to day 6 (D6) at the end of the growing season.
The Global Warming Potential (GWP) was computed by applying the CO2 equivalent (CO2eq) values of 27 and 273 for CH4 and N2O, respectively, as defined by the IPCC [2].

2.3. Visual and Instrumental Turf Quality Measurements

The present focus was on urban and periurban turf used for recreational and esthetic purposes rather than for grazing livestock. Consequently, the assessment of C emissions involved quantifying fluxes, as outlined by many authors [6,28,29,30,31]. Dry matter production and the quantity of C sequestered in the production process were not taken into consideration.
On the same days in which GHG measurements were carried out, general turfgrass parameters were visually assessed [32]:
-
Color intensity: 1 = very light green; 6 = acceptable green; 9 = very dark green.
-
Turf quality: 1 = poor; 6 = acceptable; 9 = excellent.
On the same day of the visual assessments, instrumental ground-based measurements were also collected. The ground-based instrument used to obtain the NDVI values was a Handheld Crop Sensor (HCS) (GreenSeeker, Model HSC-100, Trimble Navigation Unlimited, Sunnyvale, CA, USA). The DGCI values were collected using the application FieldScout GreenIndex + Turf (Spectrum Technologies, Inc., Aurora, IL, USA).

2.4. Statistical Analysis

The statistical analyses were carried out using the CoStat 6.400 software (Co Hort, Monterey, CA, USA; CoStat 2008). A one-way analysis of variance (ANOVA) was conducted to analyze the turfgrass vegetation index and CO2, CH4, and N2O emissions at the different N fertilization rates. The post hoc Tukey’s test was used to detect the differences between means (p ≤ 0.05). The relationships among GHG emissions and N fertilization rates were studied using the Pearson’s correlation coefficient (r).

3. Results

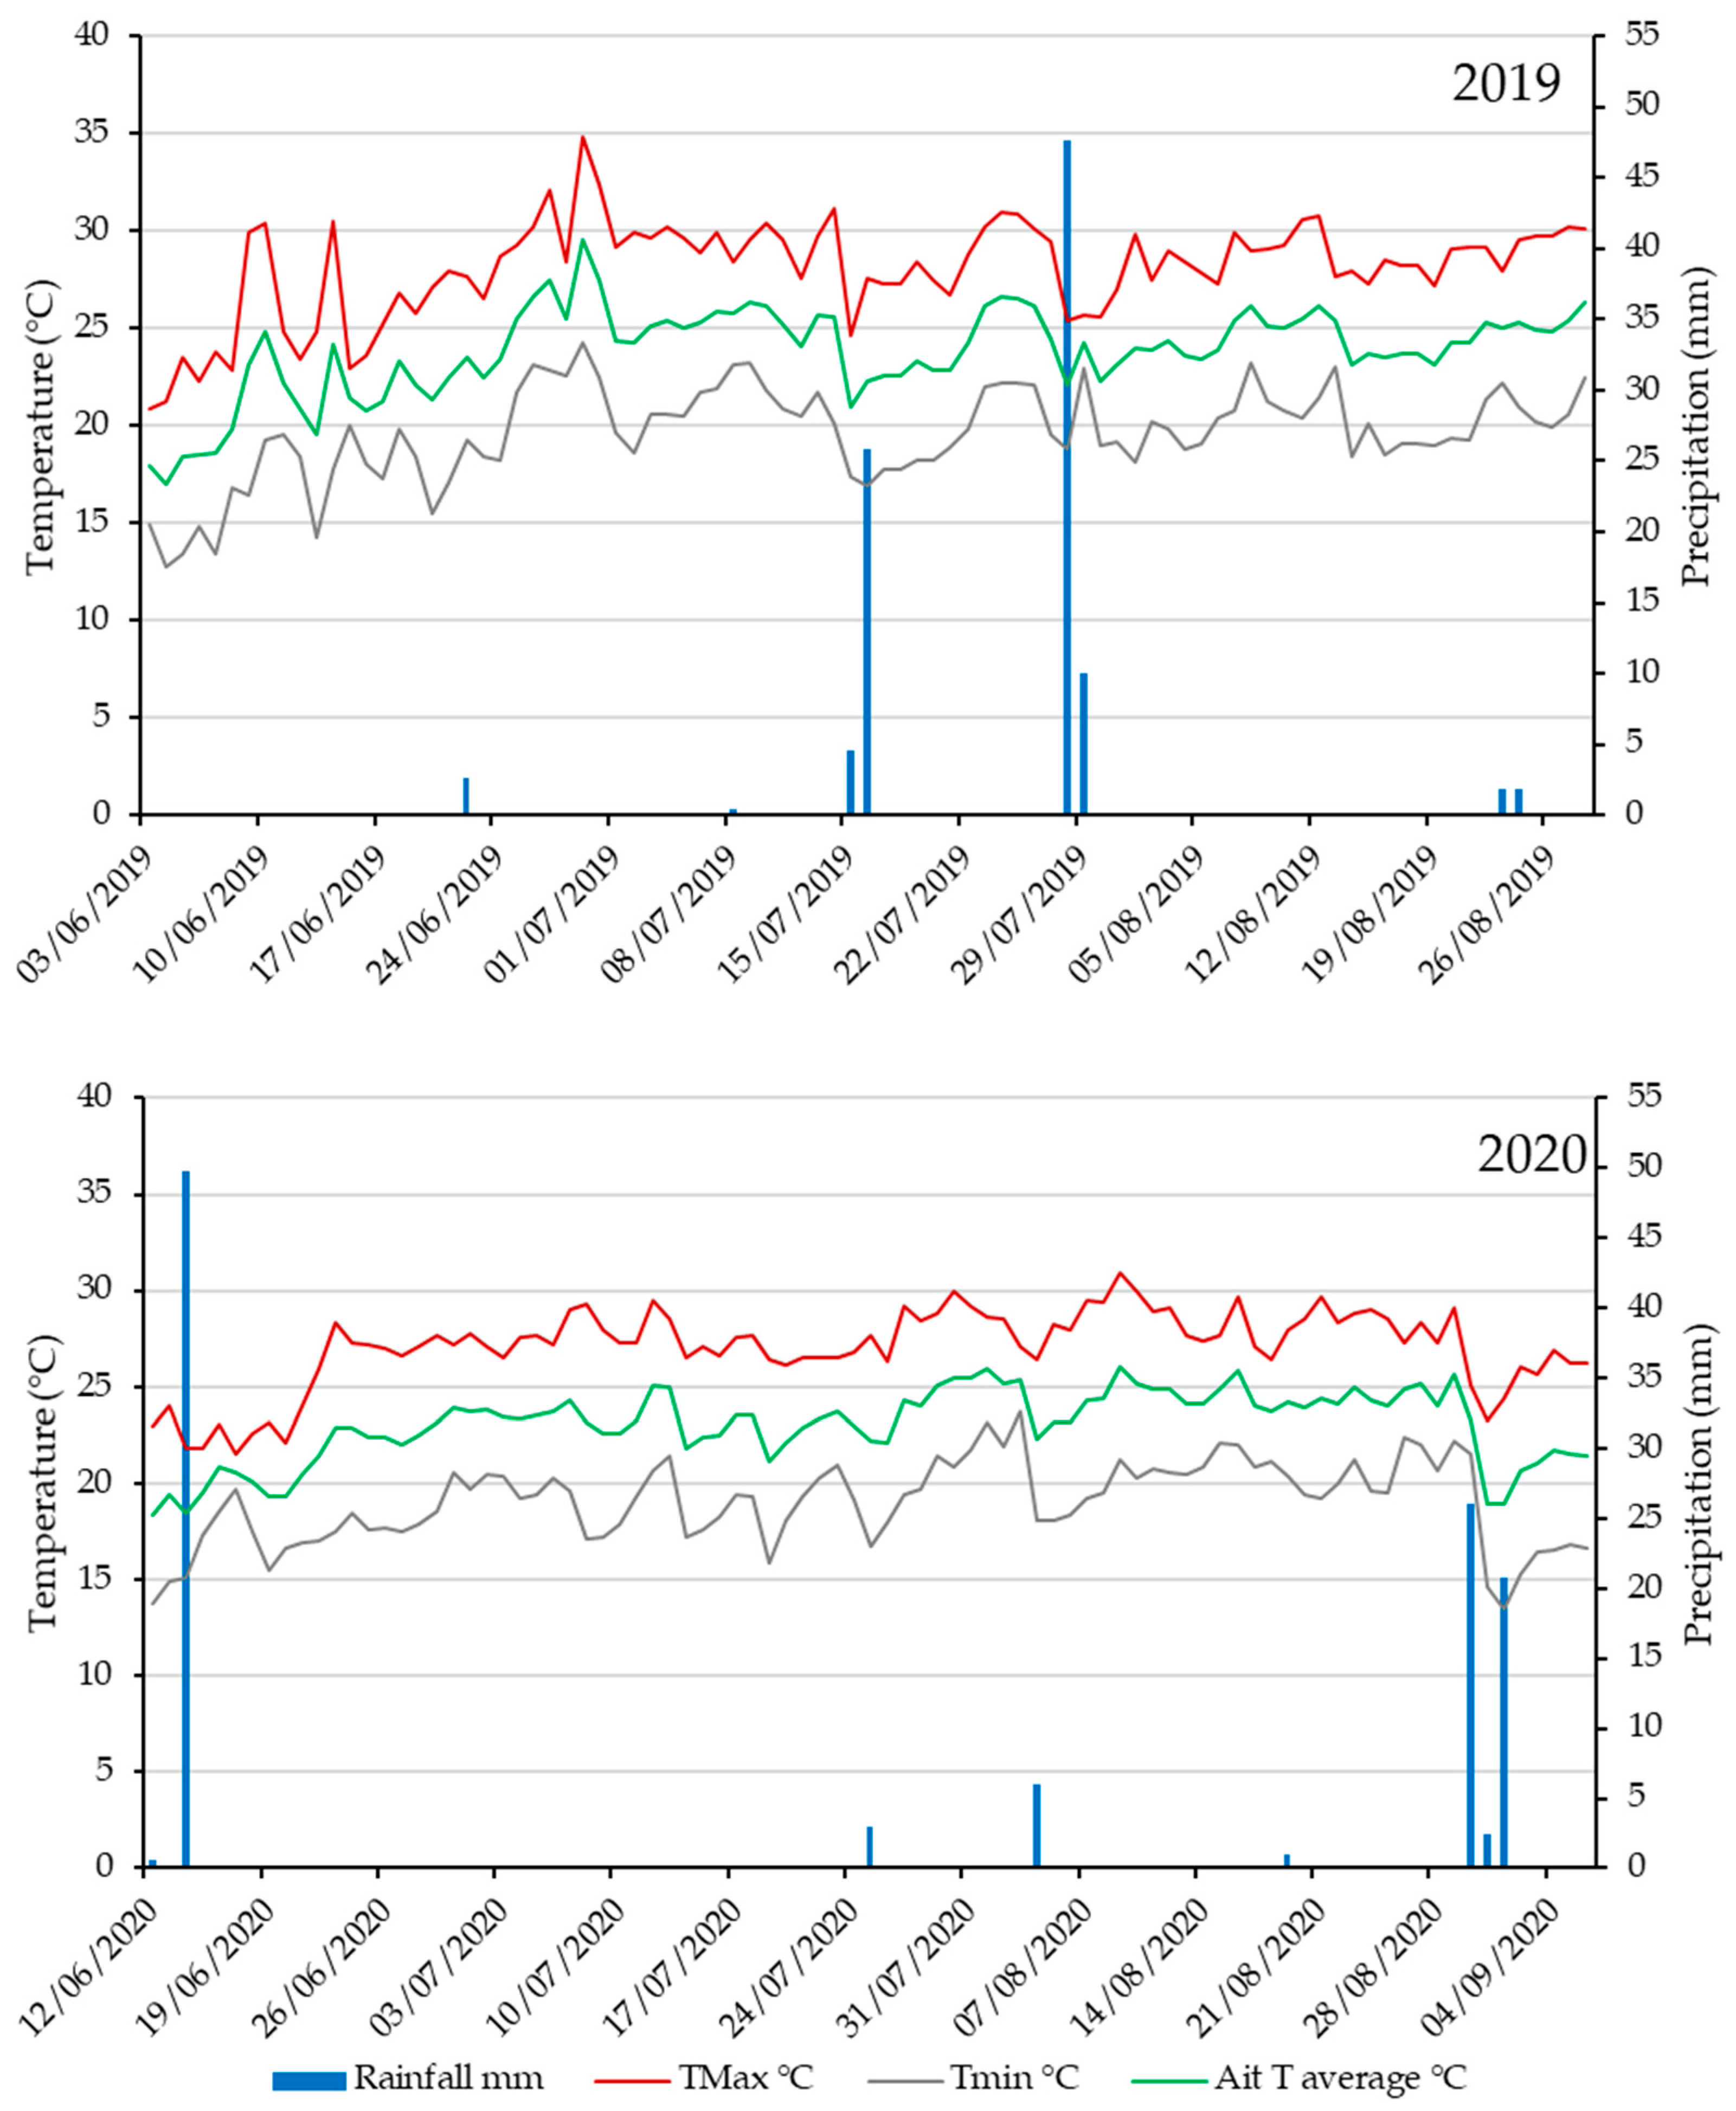
3.1. Agrometeorological Trends

The minimum and maximum temperatures showed the same trend over each of the two years, with average values of 23.85 °C and 23.04 °C in 2019 and 2020, respectively (Figure 2). Rainfall occurrence was distributed differently during the growing seasons (Figure 2), but the overall precipitation levels were similar, with 94.80 and 109.8 mm in the first and second year, respectively. In 2019, precipitation occurred mainly in July. Instead, in 2020, the maximum precipitation periods were recorded at the beginning (June) and at the end (September) of the experiment. In both years, one relevant precipitation event close to 35 mm was observed. However, irrigation was carried out regularly to ensure that water availability was not a limiting factor in maintaining the turfgrass in the best condition.

3.2. Carbon Dioxide Emissions

Carbon dioxide emissions during the two-year experiment followed similar trends, with increasing emissions corresponding to the higher N rate (R2 = 0.949 and R2 = 0.929 in 2019 and 2020, respectively). The average emissions were 433.89 and 439.31 kg C-CO2 ha−1 in 2019 and 2020, respectively (Table 2). The average emissions showed no significant differences, confirming the comparability of the fluxes between the years (p ≤ 0.05). Generally, we observed lower and higher emissions in the control and 250 N, respectively (Table 2). In 2019, 50 N and 100 N produced similar emissions. CO2 fluxes from 200 N and 250 N were equivalent and significantly higher than those produced at 50 N and 100 N. Similarly, in 2020, CO2 emissions from 50 N and 100 N were both equivalent and lower than treatments with higher N rates. In contrast to 2019, 150 N and 200 N in 2020 produced lower CO2 emissions than 250 N, which was the treatment that emitted the most quantity of CO2 (Table 2). The control (0 N) produced significantly lower emissions than 50 N only in 2020. This indicates that some background respiration activity occurred in the absence of fertilization.
In both years, soil CO2 emissions were similar between treatments immediately after fertilization (D1) and started to differentiate at D2 (Figure 3). For all treatments and both years, a clear decrease in CO2 emissions was observed at D2. From the third monitoring period, in correspondence to the increase of vegetative growth, N-fertilized treatments were shown to have increased the CO2 emissions, especially from 200 N and 250 N (Figure 3). At the end of the experiment, corresponding to a decrease in the metabolic activity of the turfgrass, soil CO2 emissions decreased at similar levels observed at the beginning of the experiment with no differences (p ≤ 0.05) between treatments (Figure 3).

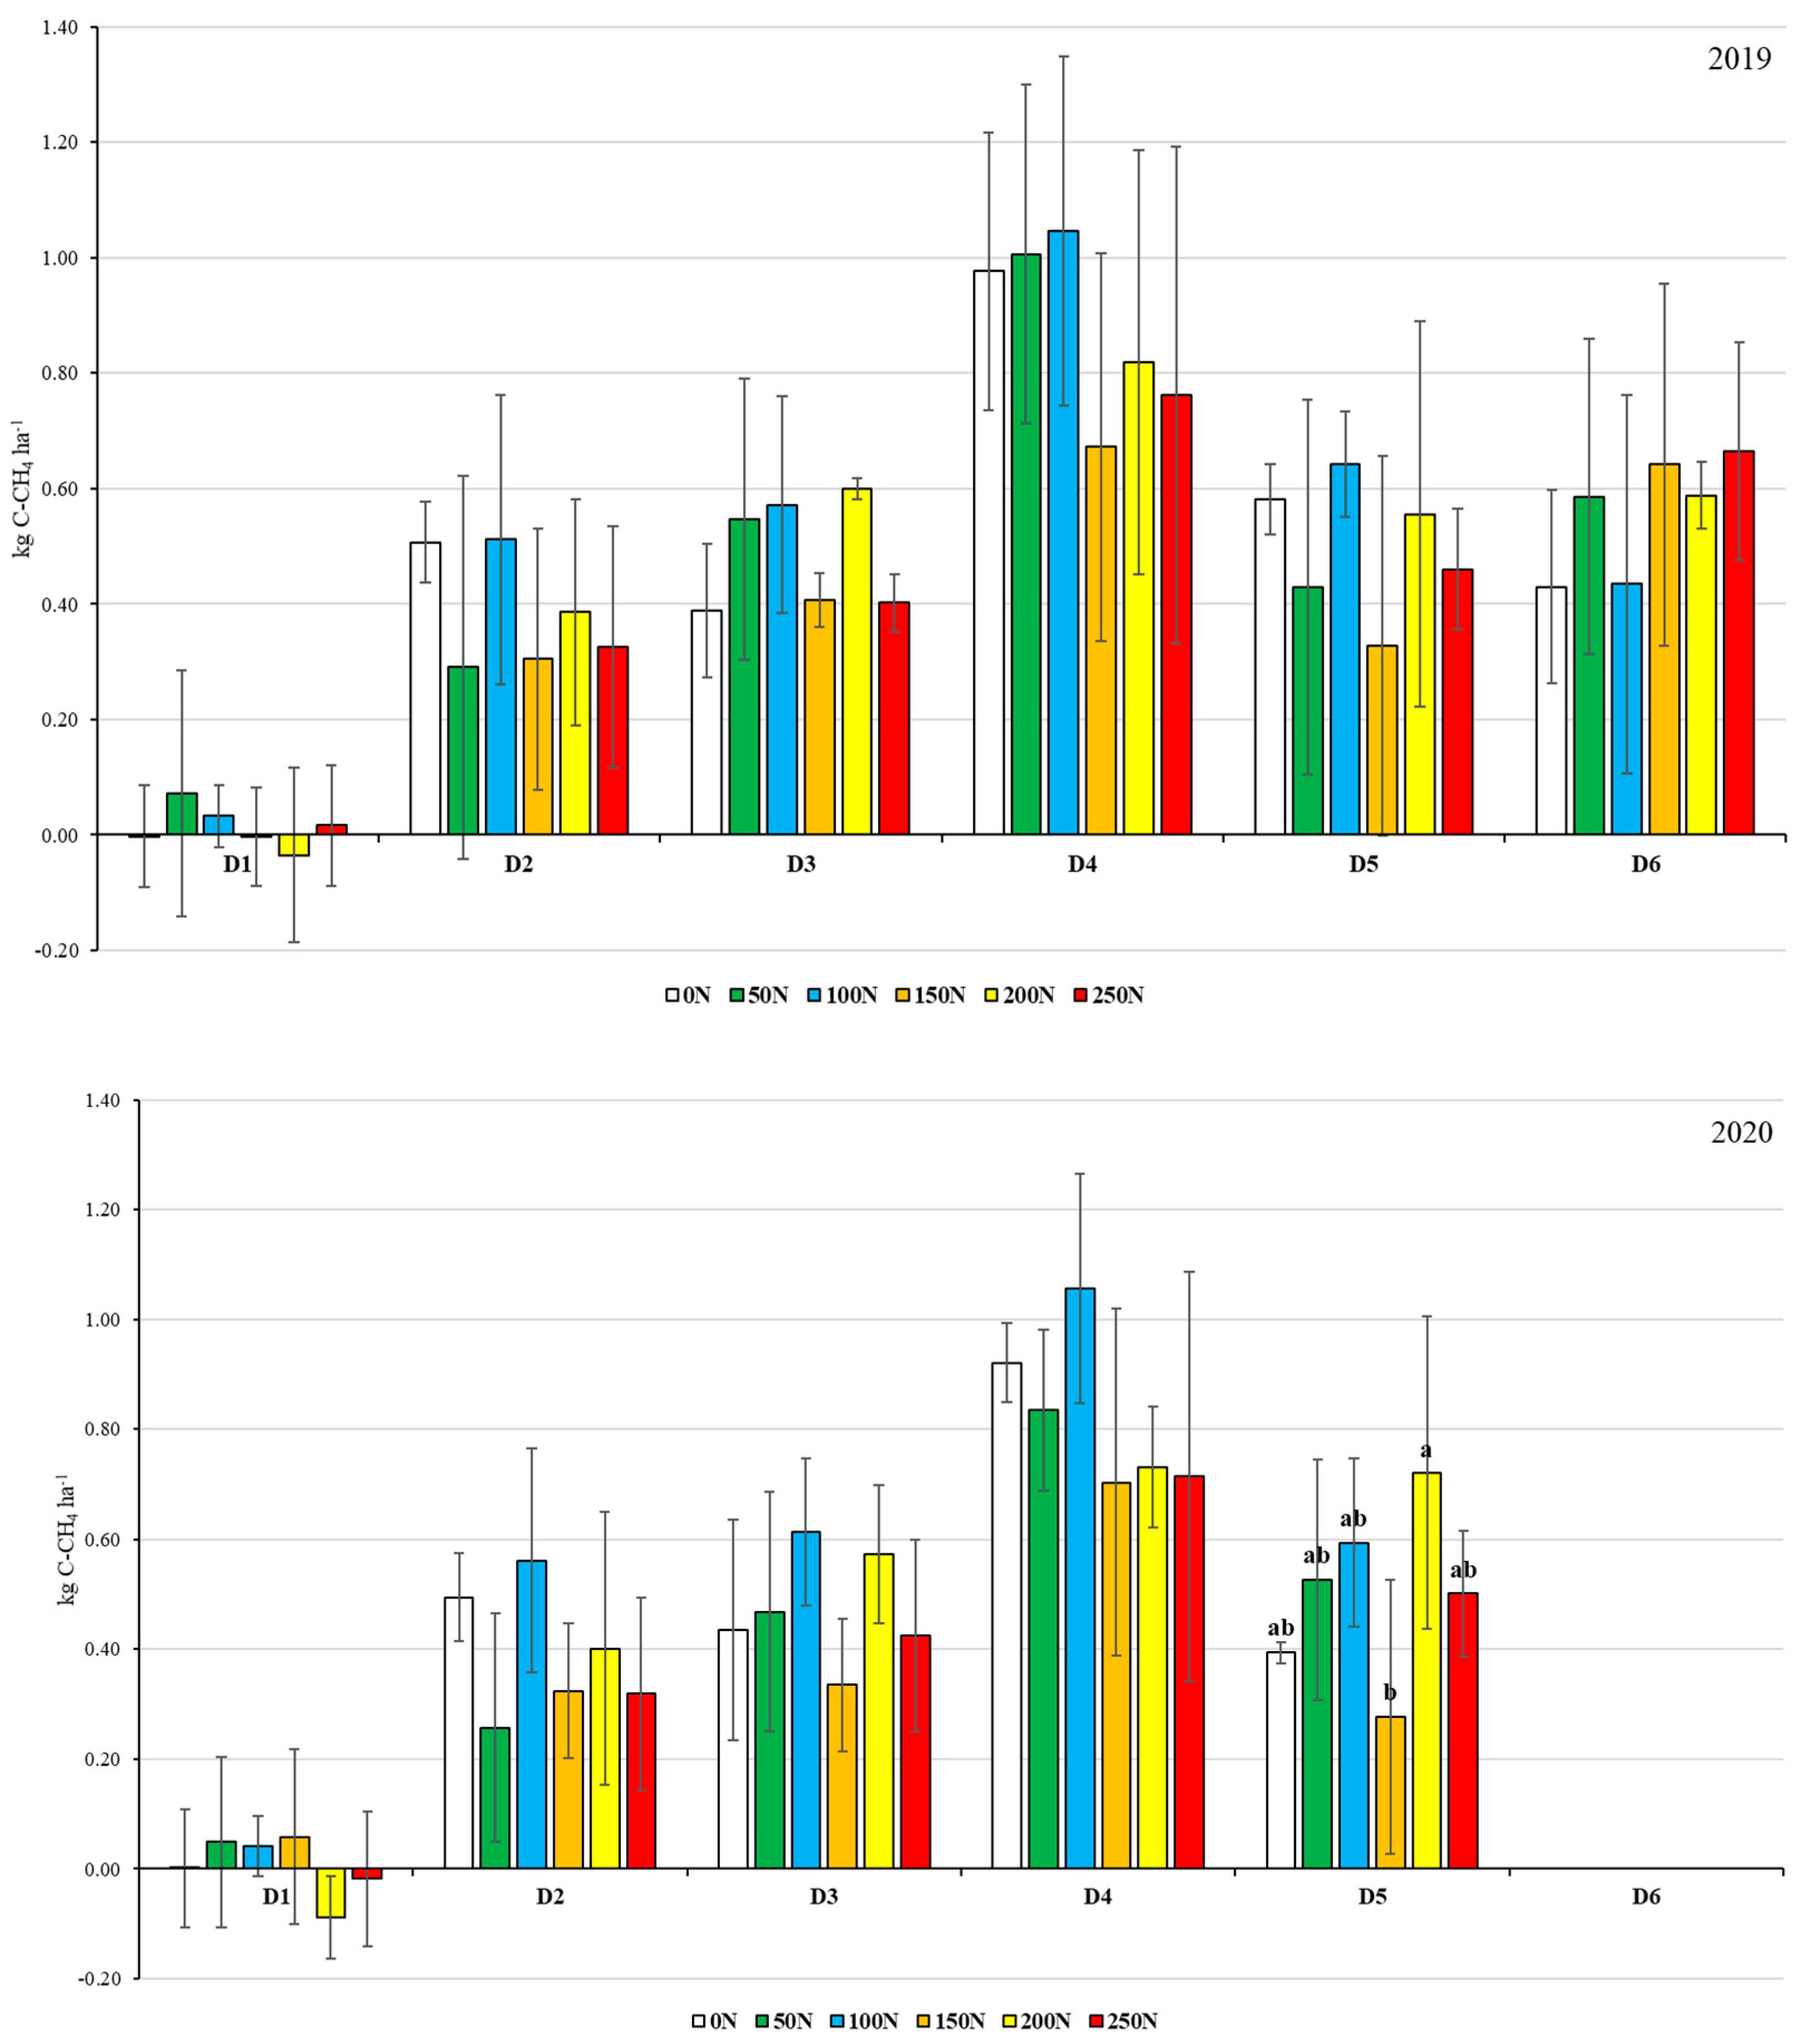
3.3. Methane Emissions

In contrast to CO2 emission trends, a clear effect of N rate on CH4 fluxes was not observed (Table 2). In 2019, based on a high variability, the cumulative emissions showed no relationship (either positive or negative) between the N rate and CH4 fluxes (Table 2). In 2020, the variability decreased, but differences between treatments were not correlated to a high/low N fertilization rate (Table 2). In 2020, we observed differences between the treatments only on D5 (Figure 4). There was a general reduction in CH4 fluxes (p ≤ 0.05) in 2020, corresponding to 2.25 kg C-CH4 ha−1 compared to that of 2.82 kg C-CH4 ha−1 in 2019.
Regardless of the year and treatment, there was a slight tendency towards CH4 consumption during D1, especially at the high N rate (Figure 4). However, in both years, turfgrass was a net source of CH4. Generally, CH4 fluxes increased from D2 to D4 in all treatments, and then decreased again until D6 and D5 in 2019 and 2020, respectively. Emissions ceased earlier in 2020, with CH4 fluxes being below the detectability limits of the gas analyzer on D6 (Figure 4).

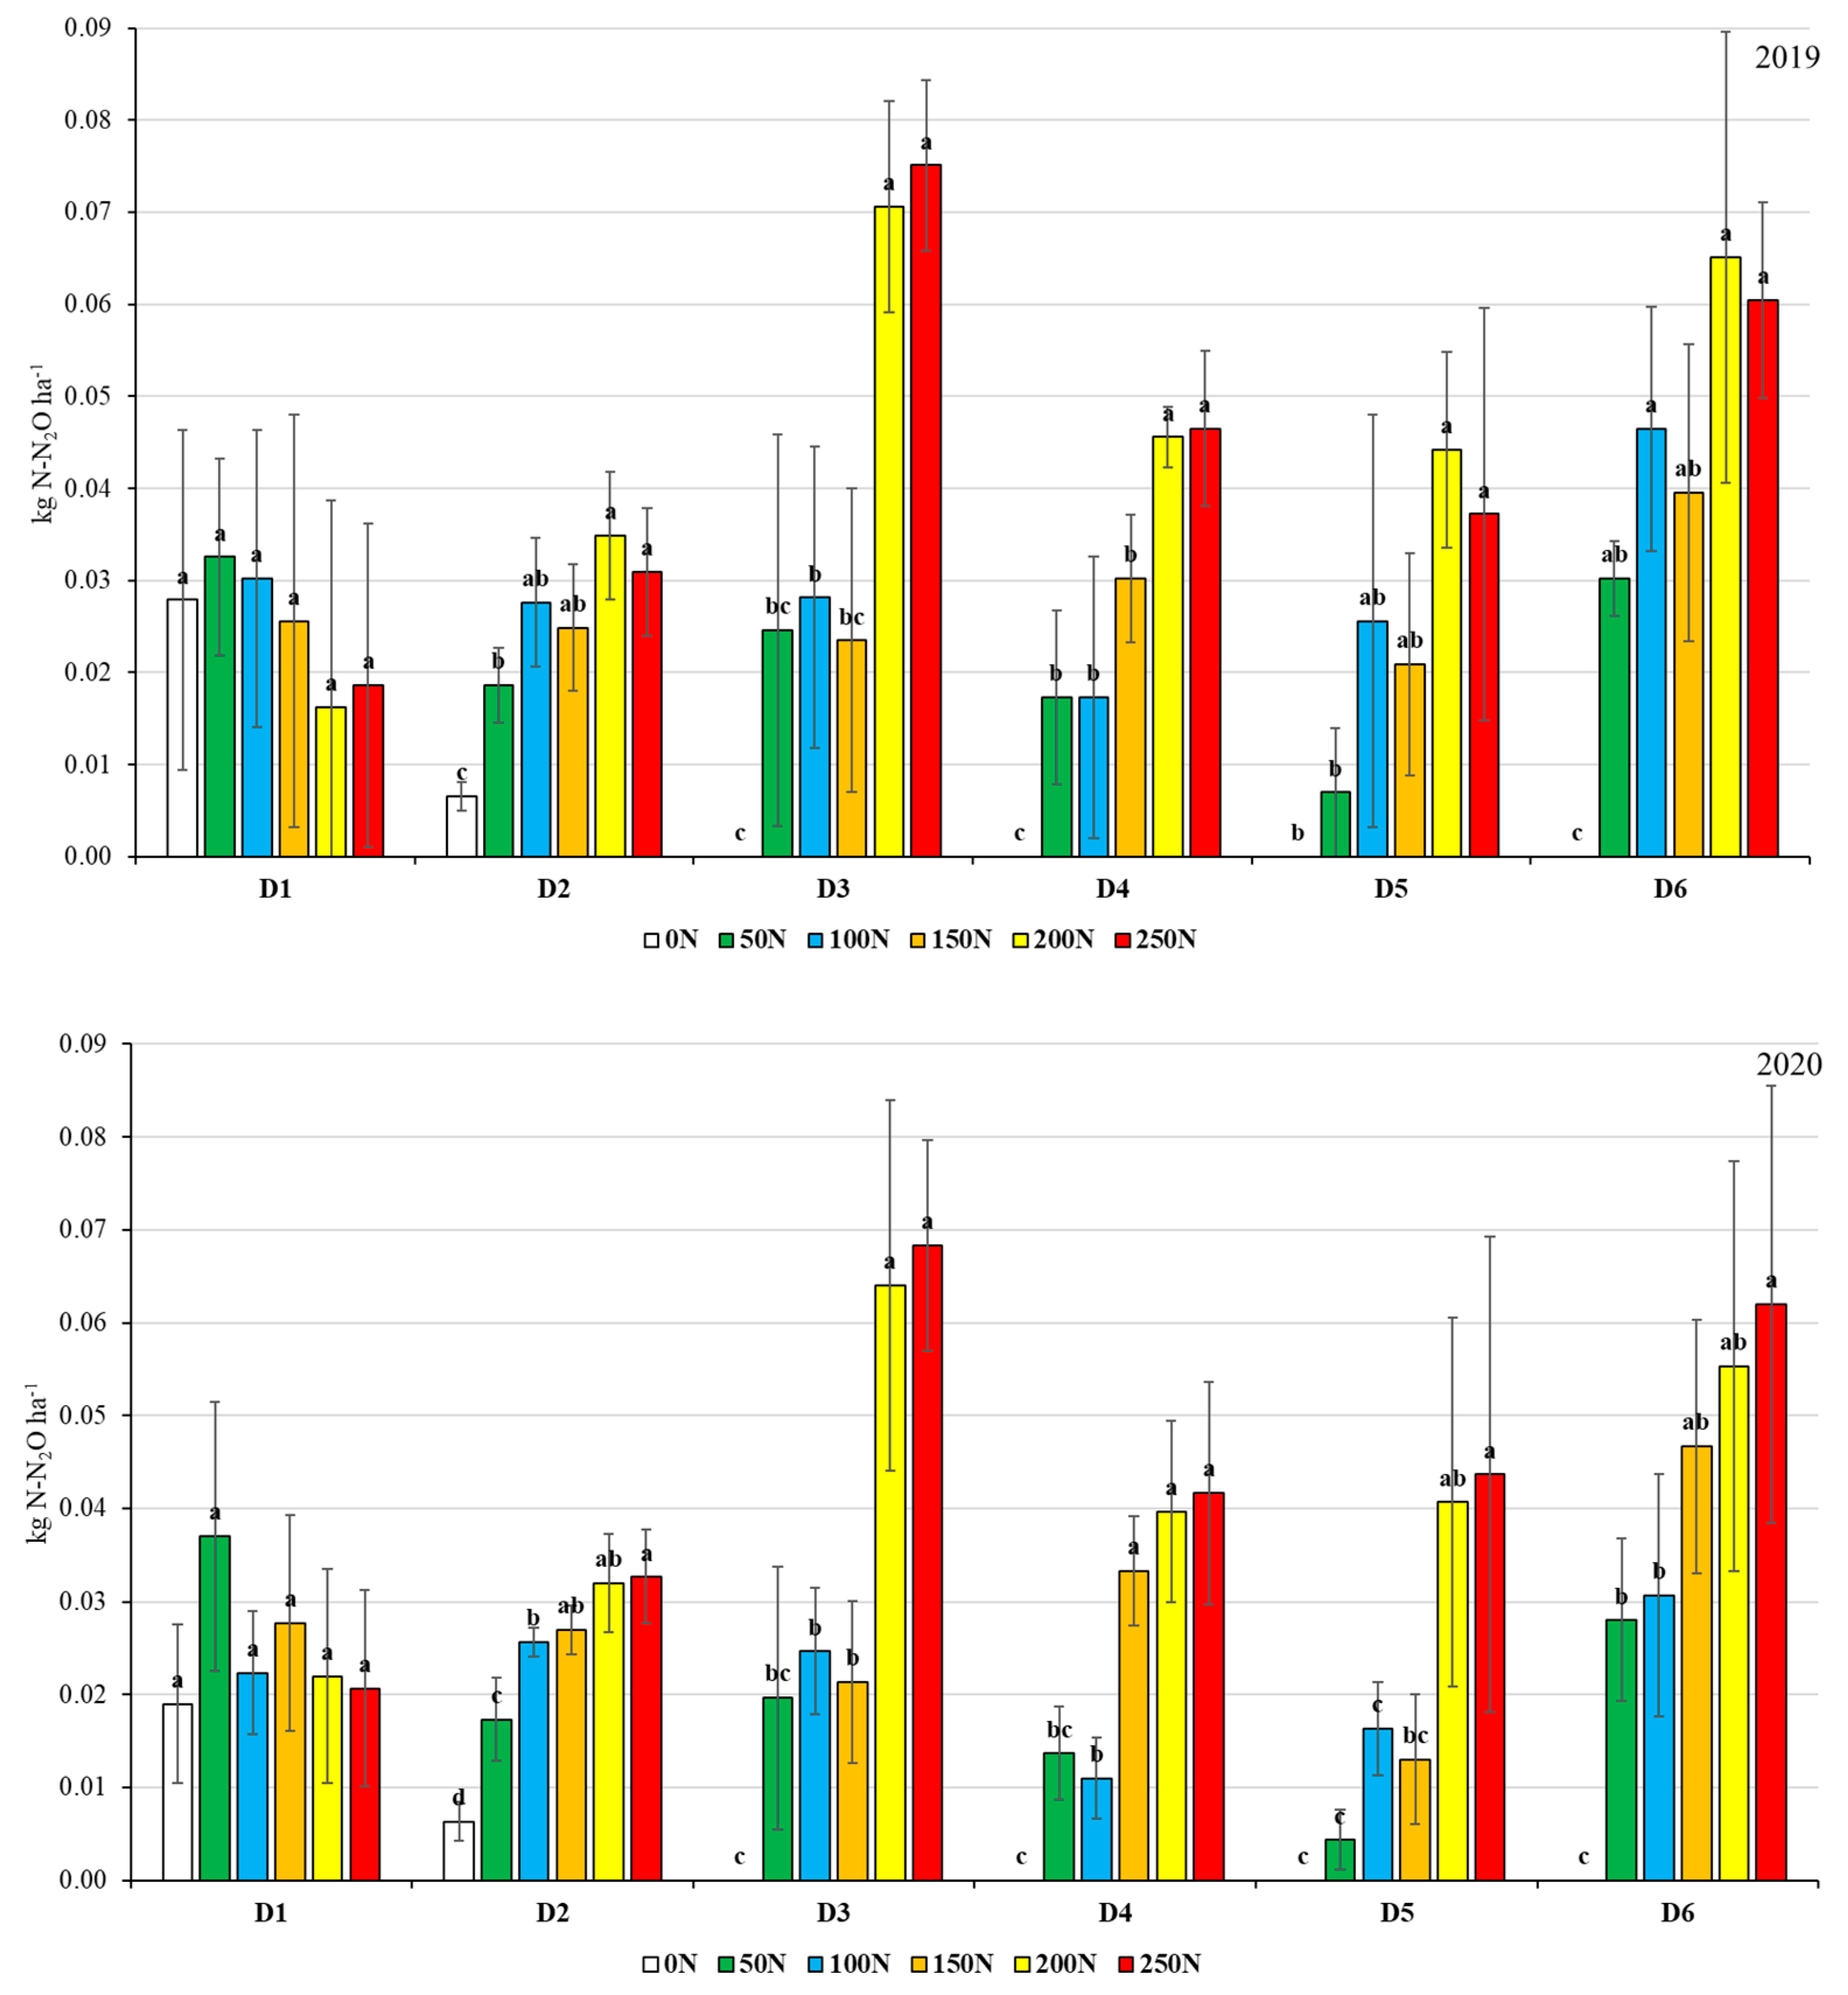
3.4. Nitrous Oxide Emissions

N2O fluxes were positively correlated to the N fertilization rate (R2 = 0.892 and R2 = 0.858 in 2019 and 2020, respectively). Lower N2O fluxes were observed in the control (0 N), which did not receive N fertilization (Table 2). N2O emissions had similar trends (p ≤ 0.05) between years, and the average fluxes were 0.175 and 0.170 kg N-N2O ha−1 in 2019 and 2020, respectively. Greater emissions were observed in 200 N and 250 N over both years (Table 2). The 50 N, 100 N, and 150 N resulted in similar emissions that were significantly higher than 0 N and lower than 200 N and 250 N, respectively (Table 2). In 2019, three distinct groups based on the N2O emission results were observed. The control treatment had the lower emissions and 200 N and 250 N had the highest, whilst 50 N, 100 N, and 150 N were mid-range. Instead, in 2020, there was higher variability between 50 N, 100 N, and 150 N, which exhibited a less uniform trend compared to 2019 (Table 2). In both years, during the first sampling event (D1), N2O fluxes were similar with negligible differences between treatments (Figure 5). Starting from D2, the N rate began to exhibit effects on N2O fluxes. The emission peaks were observed at D3 in both years for both 200 N and 250 N (Figure 5). In contrast, 0 N displayed emissions only at D1 and D2, after which they ceased.

3.5. Global Warming Potential

The emission data of CO2, CH4, and N2O were used to calculate the GWP for each treatment. For CO2 and especially N2O, cumulative emissions expressed as kg CO2 eq ha−1 were positively correlated with the N rate (R2 = 0.916 and R2 = 0.939 in 2019 and 2020, respectively). GWP trends were similar between years (p ≤ 0.05) and the average impacts were 557.98 and 580.41 kg CO2 eq ha−1 for 2019 and 2020, respectively. Similar to N2O emissions, the GWP in 2020 was shown to form three distinctive groupings, with the lowest impact from 0 N, larger impacts from 200 N and 250 N, and average impacts from 50 N, 100 N, and 150 N, respectively (Table 2). Instead, in 2019, the mid-range N treatments (50 N, 100 N, and 150 N) showed higher variability and as a result any distinctive differences between the remaining treatments were reduced compared to that observed in 2020. By analyzing the effects of the N rate, without differentiation between the two years, a distinct positive effect on the GWP is clearly observed (Table 2).

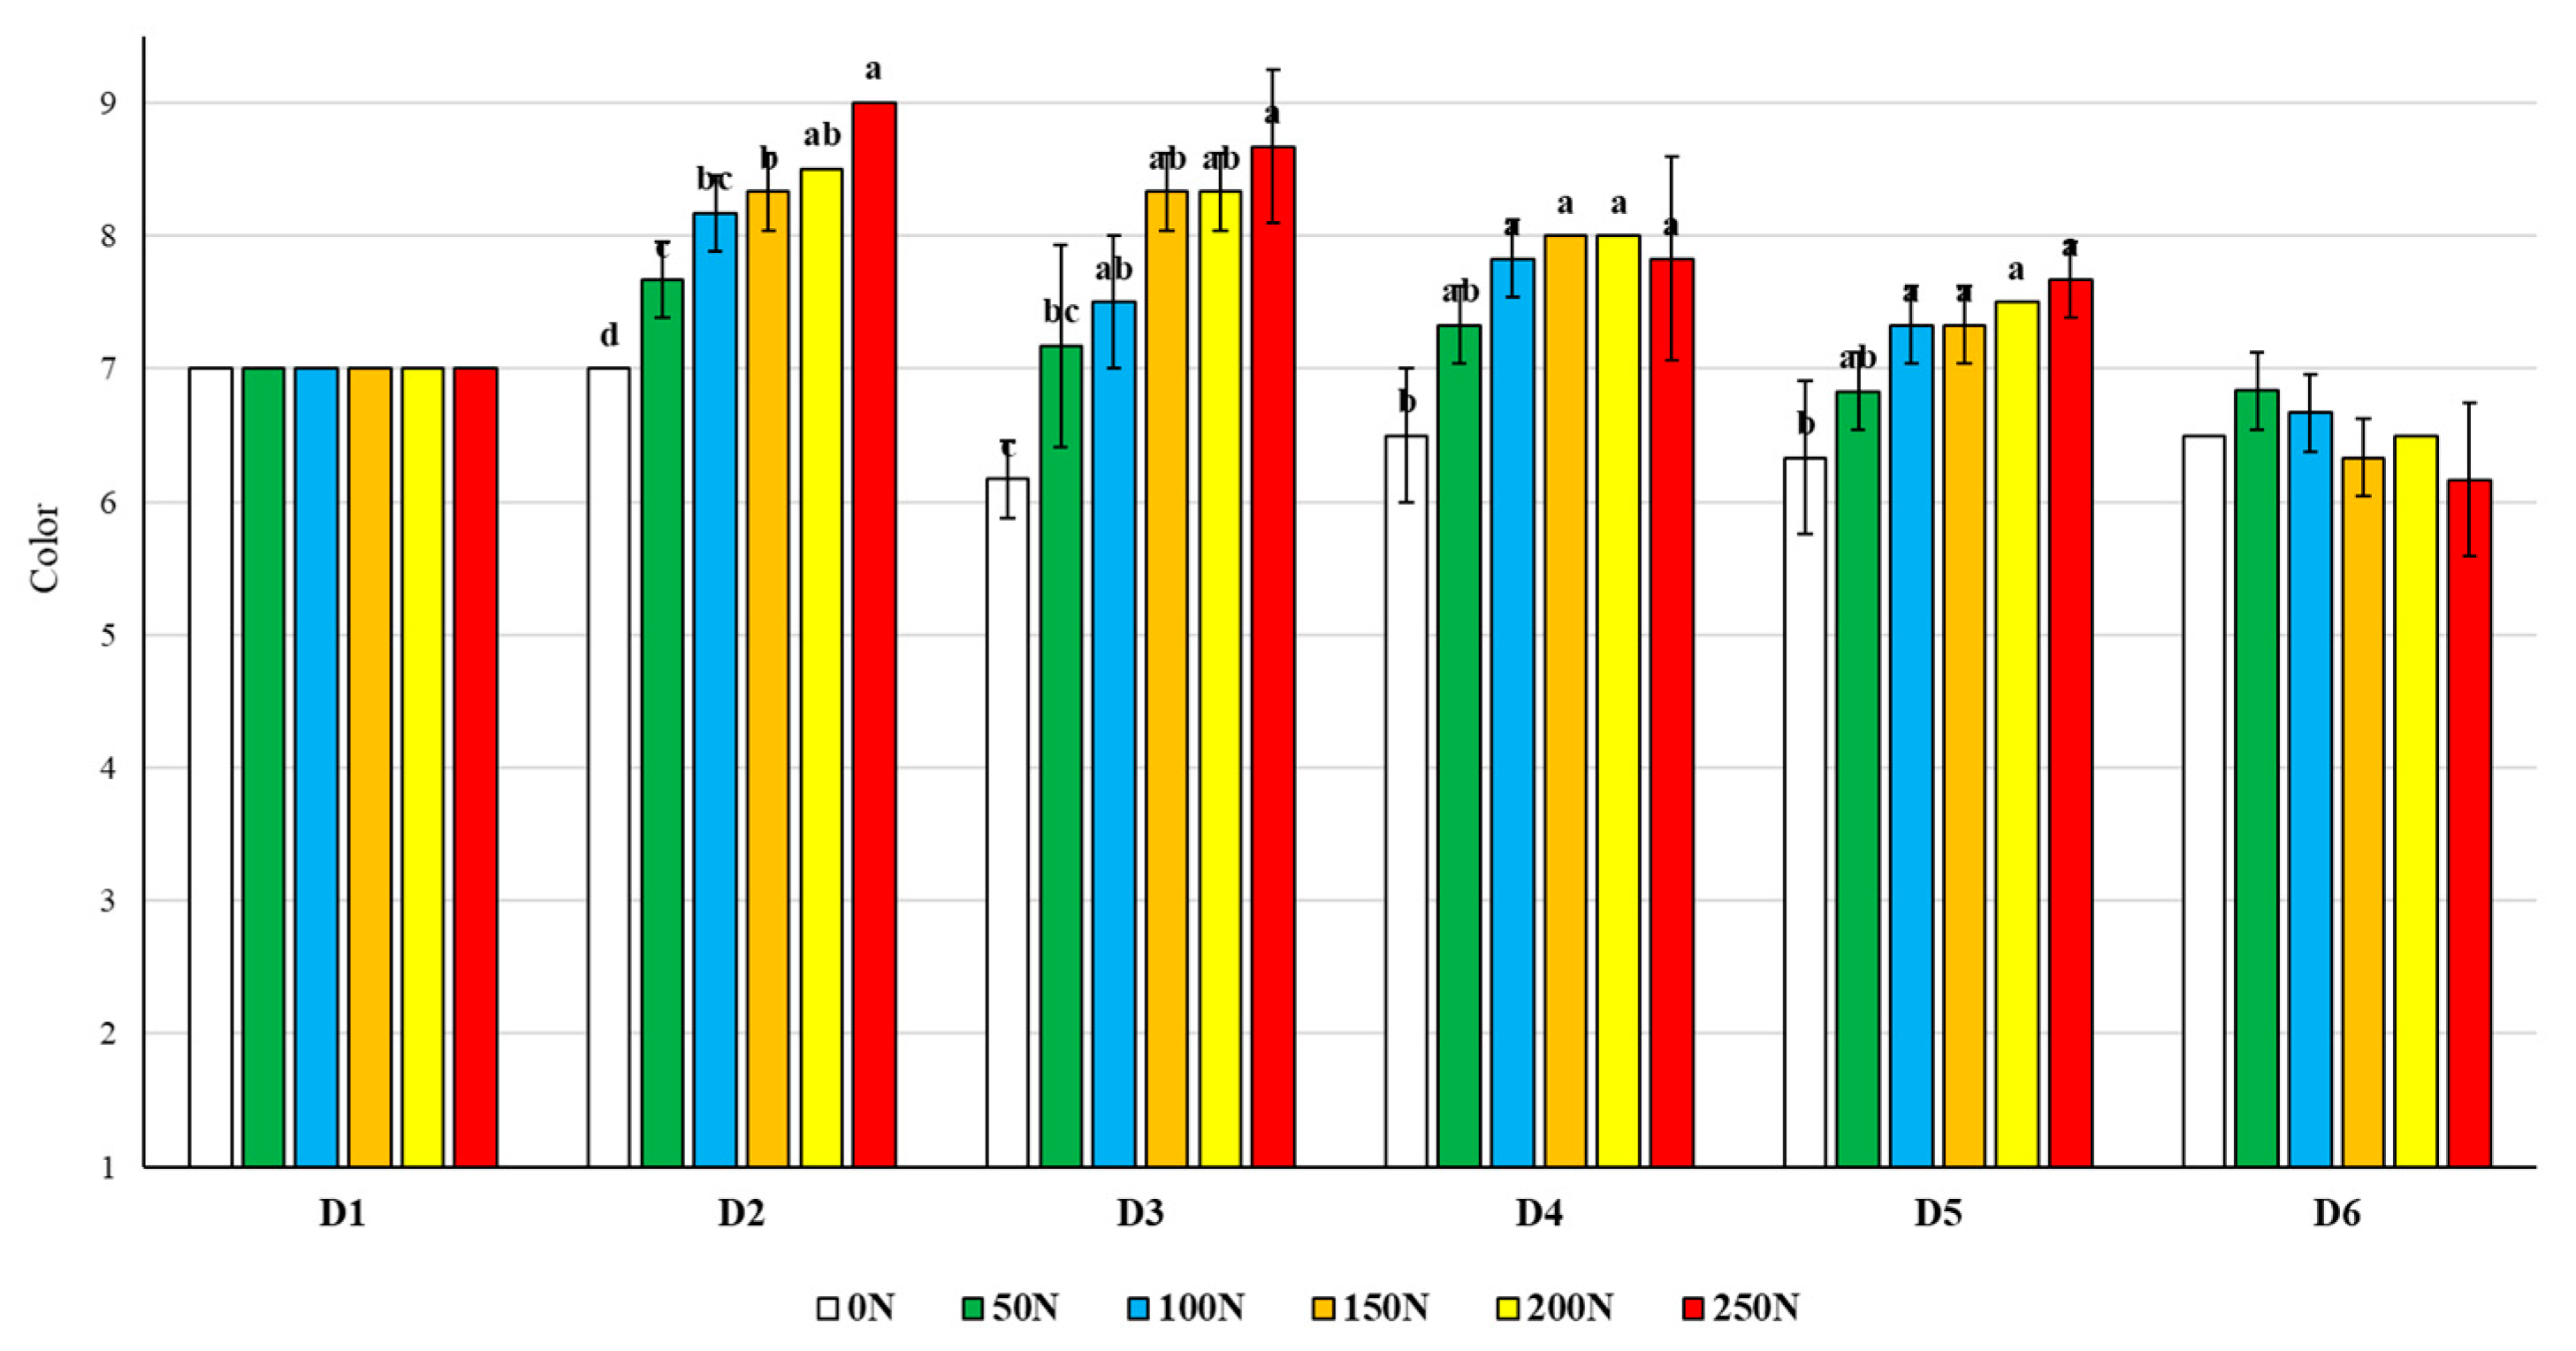
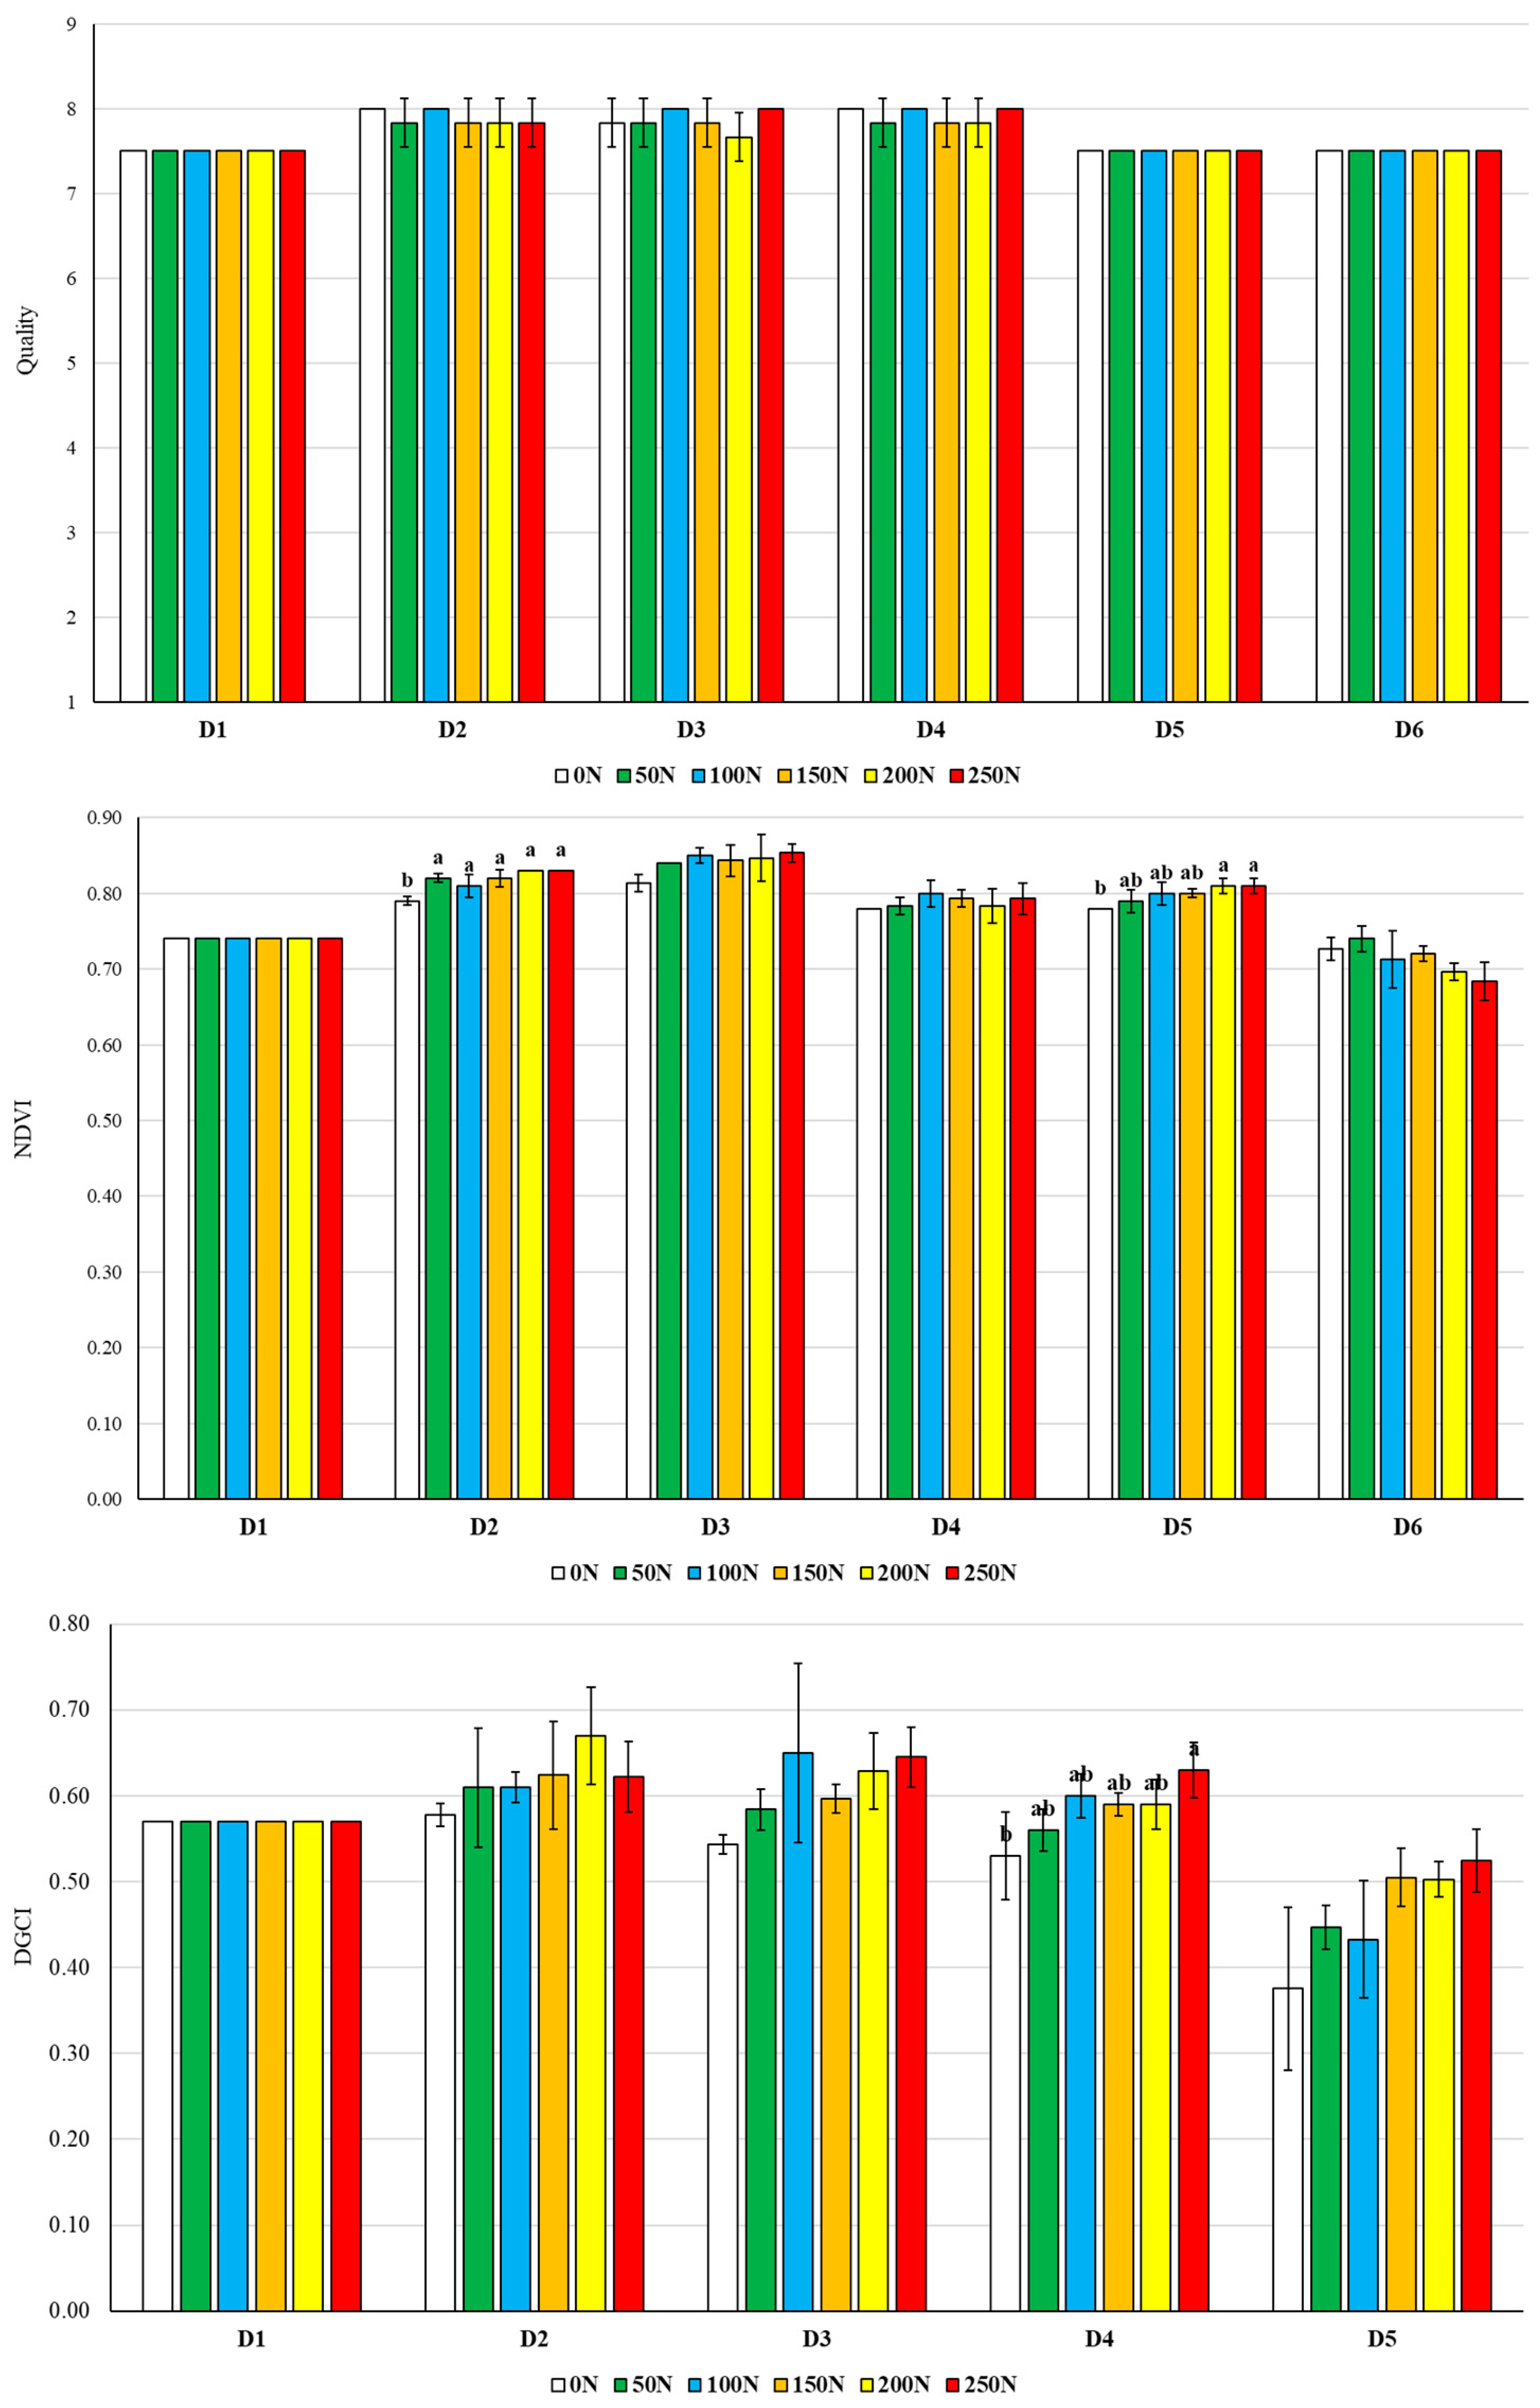
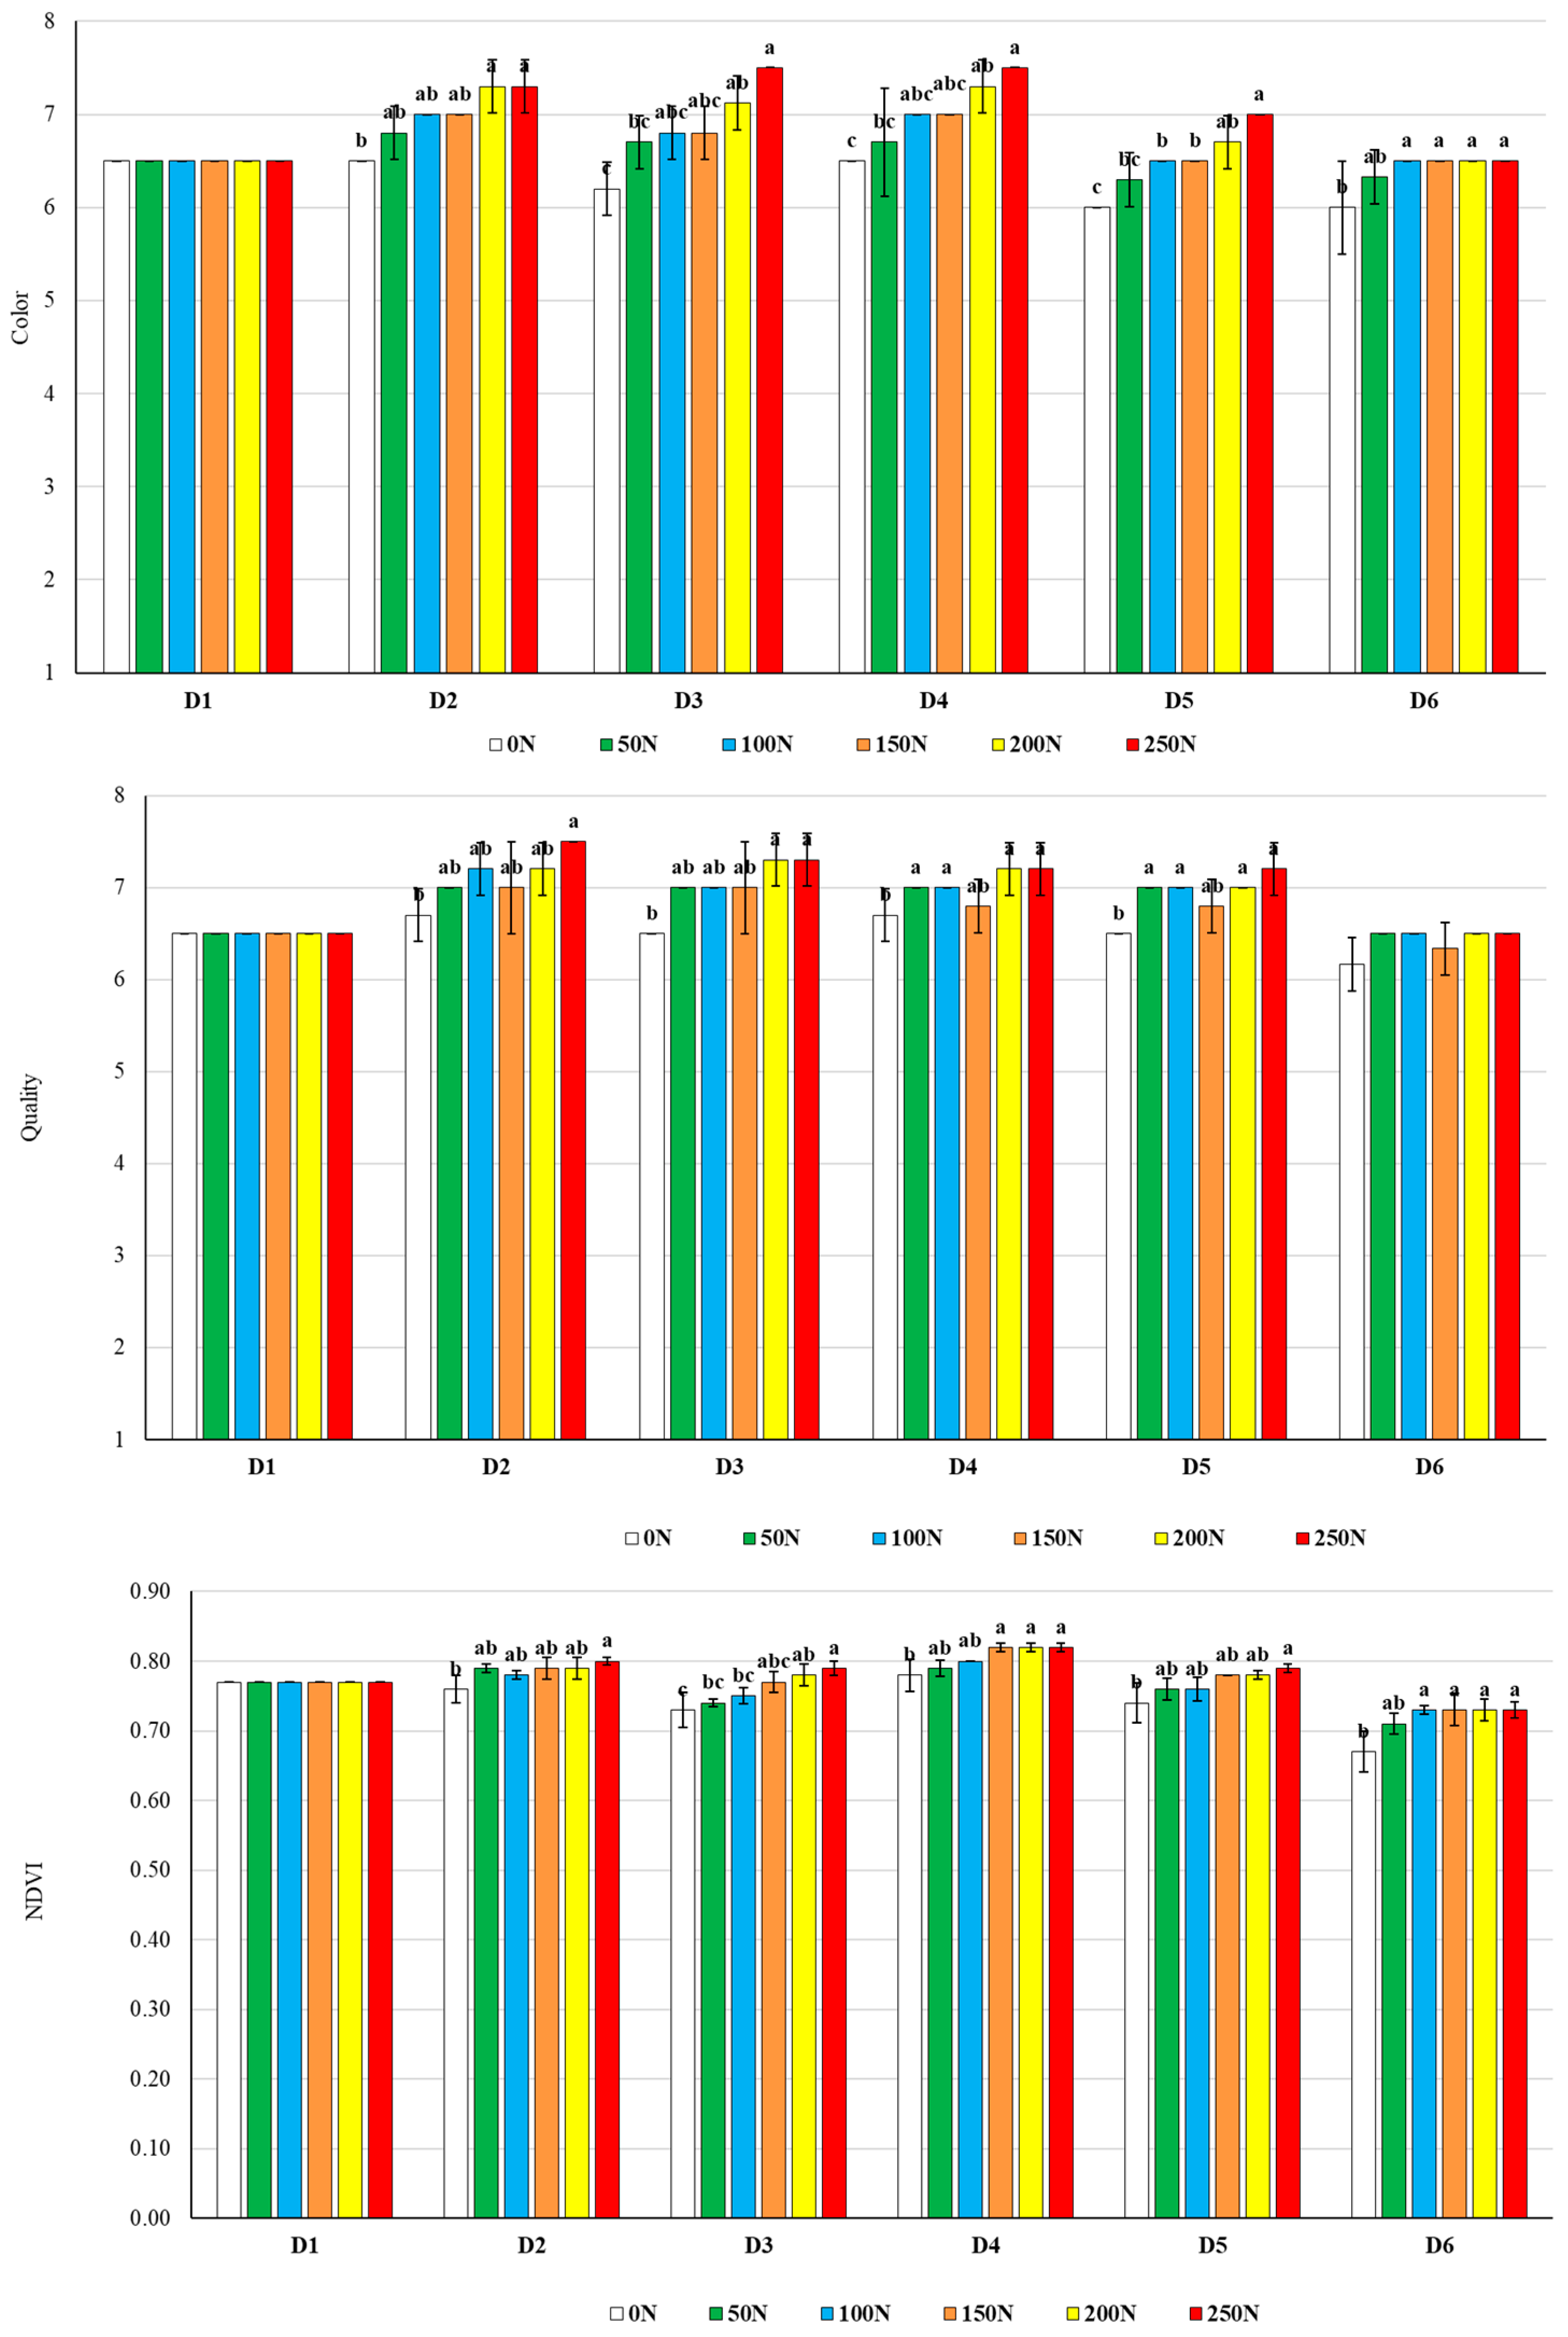
3.6. Turfgrass Health and Quality Assessment

From the bi-weekly monitoring that was carried out during the experiment, the effect of the N fertilization rate on the qualitative parameters was apparent (Figure 6 and Figure 7). In 2019, the color and NDVI were the only parameters influenced by N fertilization. Regarding color, differences between the control (0 N) and treatments were observed, starting from D2 (from 50 N to 250 N) to D5 (from 100 N to 250 N). For the NDVI, differences from control were observed at D2 (starting from 50 N) and at D5 (starting from 200 N) (Figure 6). In 2020, N fertilization positively influenced the color and NDVI of Zoysiagrass up to D6, while the quality and DGCI were influenced up to D5. During these periods, 250 N always demonstrated better results than 0 N for all the parameters investigated. Regarding the color, a significantly more intense color (compared to 0 N) was observed from the beginning of the experiment at the two highest rates, and from 100 N at D5 and D6. At 150 N, higher DGCI values (compared to 0 N) were recorded at D3 and D5. The NDVI was affected by the N rate, from 100 N up to D6 when significantly higher values than 0 N were observed (Figure 7).
Table 3 and Table 4 report the average value of color intensity, turf quality, NDVI, and DGCI during the growing cycle. Turf color visual assessment ranges from 1 to 9, with higher values indicating a greener turf. In both years, compared to 0 N, a significant improvement in turf color was observed, starting from 50 N. The highest rating was attained at the highest N rate (250 N). In 2019, no differences in turf color were observed between 100 N and the higher doses, whilst in 2020, differences were observed between 50 N and 200 N and between 200 N and 250 N, respectively (Table 3 and Table 4). Turf quality visual ratings also range from 1 to 9, with the higher values representing better turf quality. In 2019, all treatments induced improvements in turf quality in comparison with the control, although no significant differences were observed between treatments (Table 3). In the second year, a significant improvement in turf quality, in comparison with the control, was observed with the maximum N rate (Table 4).
The NDVI was shown to be positively associated with N distribution. Differences between the control and the N treatments were observed in both years. Nevertheless, the amount of N does not seem to affect the NDVI values (Table 3 and Table 4).
The DGCI is an additional index of turf color, specifically focusing on the dark green color intensity. Similar to turf color, higher values signify a more intense dark green color. In 2019, no differences in DGCI values were observed between treatments, but differences between 0 N were observed starting from 200 N (Table 3). In 2020, differences between 0 N were observed starting from 100 N, and higher DGCI values were recorded at 200 N and 250 N (Table 4).

4. Discussion

4.1. Carbon Dioxide Emissions

Turfgrasses are widely used as recreational and decorative surfaces for sports, relaxation, and enjoyment, thus differing in use from fodder crops. Consequently, in the present study, the assessment of C emissions focused solely on quantifying fluxes, without taking into consideration dry matter production or the quantity of C sequestered in the production process [6,13,29,30,31]. In this study, CO2 peaks were associated with the warmer periods in both years (D3 and D4, that corresponded to July). Soil CO2 emissions were previously shown to be correlated to soil temperature, attributable to favorable conditions for the root system and for the soil microbial community [33]. Moreover, the present results corroborated those showing a similar trend in a similar experiment on Zoysia in Japan [34]. Thereafter, CO2 fluxes were slightly decreased during the D5 and D6 growing season (corresponding to mid-August/September) and were similar to those observed at the beginning of the experiment, also observed by Brandani et al. [13].
The N rate positively affected soil CO2 emissions following crop development. The latter results in an increase in aboveground biomass, and thus root respiration. In both years, we observed a significant increase in soil CO2 fluxes associated with the increasing N rate (Table 2; Figure 3). At the highest fertilization rates, 200 N and 250 N, CO2 emissions nearly doubled compared to the control (0 N). This increase in CO2 fluxes was consistent with a previous study conducted by our research group in the same area using different species [13]. While the results of this experiment demonstrated an increasing CO2 impact, it is important to note that we did not account for the potential C storage capacity of the turfgrass cover. Indeed, an increase in vegetation vigor raises the levels of atmospheric CO2 sequestration within the biomass through the photosynthesis of the turfgrass cover, as observed by Dhital et al. [34]. The average daily CO2 emissions from our experiment accounted for 72.32 and 73.22 kg C-CO2 ha−1 day−1, for 2019 and 2020, respectively, similar to those observed previously [34,35]. In particular, an average soil CO2 flux of about 65 kg C-CO2 ha−1 day−1 on Zoysia japonica turfgrass was reported [34].

4.2. Methane Emissions

The variability in the CH4 fluxes of turfgrass was higher over time compared to fluxes of the remaining gases. Similar to previous studies [12,15], Zoysia acted as a net CH4 source. This corroborated the available literature reporting the higher tendency of C4 crops to be CH4 sources than C3 crops, which normally act as CH4 sinks. In the present study, soil CH4 emissions were not related to either N rate or air temperature, supporting previous findings by Livesley et al. [36] on other C4 species. This can be due to the fact that turfgrass often acts as weak sinks or weak sources of CH4. The main driving factor of these types of emissions is water availability and soil moisture [37]. In our case, the experiment was conducted on relatively well draining soils. This hindered the risk of the formation of anaerobic conditions, which significantly promote CH4 emissions from the soil.
Despite the high variability and the absence of a relationship between the N rate and CH4 fluxes, higher emissions were recorded in the present study compared to those recorded previously. Livesley et al. [36] observed an average flux of 0.072 kg C-CH4 ha−1 day−1, while average fluxes in this experiment were 0.47 and 0.38 kg C-CH4 ha−1 day−1 for 2019 and 2020, respectively. Correspondingly to our results, Law et al. [12] reported the absence of a correlation between the N rate and CH4 emissions on C4 species, highlighting the importance of further research focused on the CH4 dynamics of these species.
Water management was implemented to maintain the turfgrass in optimum condition, but care was taken to avoid waterlogging. For this reason, we did not observe any CH4 peaks associated with irrigation events. In fact, irrigation was not applied after relevant precipitation events (Figure 4). As reported by Riches et al. [15], waterlogging is a key factor in CH4 production, and avoiding such a condition represents an effective strategy for reducing the environmental impact of turfgrass.

4.3. Nitrous Oxide Emissions

Soil N2O fluxes were clearly affected by the N rate (Table 2), and this corroborated the findings from recent studies on Zoysia [14]. The same authors also reported the effect of irrigation on N2O emissions from the soil. In the present study, the same irrigation management strategy was adopted to avoid the risk of water being the limiting factor. Nevertheless, there is limited understanding regarding the possibility of utilizing irrigation management techniques, including deficit irrigation and specific irrigation timing following N fertilization occurrences, to mitigate N2O emissions in turfgrass [3]. The delay in which differences between treatments became evident was primarily attributed to the time required for fertilizer degradation. In D1, N2O fluxes were similar between treatments in both years, and differences only became apparent starting from D2. Interestingly, soil N2O emission fluxes were observed even from the control (0 N) in the absence of fertilization. This may be attributed to the initial soil N content that triggered N2O emissions, although low and only detectable until D2. The average N2O fluxes were 29.16 and 28.39 gr N-N2O ha−1 day−1, which were in accordance with Riches et al. [15]. In contrast to previous studies, in which multiple fertilizer applications were implemented, in the present study, all the fertilizers were administered in one application. The highest emissions were from 200 N and 250 N, with average rates of 45.44 and 47.05 gr N-N2O ha−1 day−1, similar or even lower than what has been observed in other experiments using similar N doses and several fertilization events [15,38]. The choice of the species and genetic selection could be fundamental in ensuring the success of the turf, in enhancing resource use efficiency, and in reducing environmental impacts. However, this must be combined with appropriate agronomic management strategies (rational fertilizer use, slow-release fertilizers, smart irrigation strategies), as described by Braun and Bremer [14], in order to achieve the best results towards mitigating N2O emissions.

4.4. Global Warming Potential

The analysis of the GWP for each fertilization strategy permitted the evaluation of the entire impact generated from turfgrass management (N fertilization). This information contributes to the understanding of climate change mitigation dynamics from agricultural activities and activities connected to agriculture. Indeed, the cultivation and management of turfgrass (ornamental, sport, recreational, etc.) significantly contribute to the carbon and nitrogen cycles. Due to the lack of correlation between N rate and CH4 fluxes, under the experimental conditions of the present study, this gas did not provide relevant information to suggest environmental impact reduction strategies. In contrast, CO2 and N2O were the main drivers affecting GWP results and thus environmental impacts on turfgrass management. It was evident that the application of 50, 100, and 150 kg N ha−1 caused higher impacts than the control (0 N), but were also significantly lower compared to the two higher doses (200 N and 250 N) (Table 2). As mentioned for CO2, in this study, we did not include the amount of C storage inside the biomass, which would have reduced the GWP, and thus the environmental impacts. If CO2 fluxes are predominantly related to natural and biological processes (i.e., root respiration), then N2O fluxes could be reduced by applying better agricultural management strategies [14,15,30]. Indeed, by applying a N rate equivalent to 50 N, 100 N, and 150 N, reductions in environmental impacts (GWP) of 24.10, 15.31, and 14.99% were achieved compared to the application of higher N rates (200 N and 250 N). Through the definition of the best turfgrass management strategy, it is possible to improve the sustainability of agricultural activities not directly connected with food production, but that can still contribute to either mitigating or worsening climate change.

4.5. Turfgrass Health and Quality Assessment

Nitrogen is the main mineral nutrient in plants. It is fundamental for maintaining green color, density, and uniformity, as well as recovery from drought and disease stresses, which are all important towards ensuring good turf quality. For these reasons, N fertilization is one of the key factors influencing the esthetic characteristics of turfgrasses [39,40,41,42]. However, excessive N applications may lead to environmental pollution without improving turf quality.
Our findings generally indicated that Z. matrella turf color, quality, and visual appearance increased upon increasing N fertilization. These results corroborated those found previously on seashore paspalum turf and in a cool season turfgrass mixture [43,44]. The increase in turf greenness and turf quality with an increasing N rate can be attributed to the role of N in promoting chlorophyll production, which contributes to a darker and greener turf color [45,46].
In both 2019 and 2020, the NDVI values remained statistically consistent across the different N rates, suggesting that the amount of N does not have a substantial impact on the overall NDVI of the turf. At the same time, the difference in the NDVI between the control and other treatments inferred that N was essential in promoting a healthier and denser turf [17,47,48]. In contrast to the NDVI, the DGCI was influenced by N rates. In order to obtain a more intense green color of the turf, N rates greater than 100 kg N ha−1 were shown to be required.
Nonetheless, in order to obtain good-quality turfgrass, a N rate of 100 kg N ha−1 can be suggested based on the results of the present study.

5. Conclusions

Turfgrasses are often associated with ornamental, sport, recreational, and enjoyment purposes, requiring high quality standards. Moreover, they serve as a valuable strategy for mitigating climate change and improving urban life quality. Achieving these standards involves intensive N fertilization, which impacts the global atmospheric GHG balance. Defining the best agronomic management strategies for maintaining high esthetic performances of turfgrass, while reducing environmental impacts, is crucial. The results from this experiment indicated that a fertilization rate of 100 kg N ha−1 on Zoysia turfgrass in a Mediterranean area was effective in limiting the environmental impact while maintaining high esthetic characteristics, although these results may not occur in other areas, even if the selected species is Zoysia grass. Maintaining high quality parameters is a crucial aspect to consider in order to ensure the provision of numerous ecosystem services by the turfgrass. An important aspect to consider is the seasonal trend that can strongly affect the emission patterns of certain gases. Future research should focus on the adoption of innovative agronomic management strategies such as the use of slow- or controlled-release fertilizers or precision farming techniques. Furthermore, the selection of the best species to achieve the desired visual appearance, quality, and overall plant health while minimizing the environmental impacts is preferred. Lastly, the evaluation of GHG emission trends should be made throughout the year, including crop dormancy periods when the soil microbiological component remains active.

6. Patents

Project partially funded under the National Recovery and Resilience Plan (NRRP), Mission 4 Component 2 Investment 1.3—Call for tender No. 1561 of 11.10.2022 of Ministero dell’Università e della Ricerca (MUR); funded by the European Union—NextGenerationEU. Project title “Network 4 Energy Sustainable Transition—NEST”; project code PE0000021.

Author Contributions

Conceptualization, L.V., L.C. and A.B.; methodology, L.V., L.C. and S.M.; formal analysis, L.V., L.C., S.M. and A.B.; investigation, S.M. and A.B.; resources, M.V., A.D.M. and S.O.; data curation, L.V., L.C., S.M. and A.B.; writing—original draft preparation, L.V., L.C. and A.B.; writing—review and editing, L.V., L.C., S.M. and A.B.; supervision, M.V., A.D.M. and S.O. All authors have read and agreed to the published version of the manuscript.

Funding

This research was partially funded under the National Recovery and Resilience Plan (NRRP), Mission 4 Component 2 Investment 1.3—Call for tender No. 1561 of 11.10.2022 of Ministero dell’Università e della Ricerca (MUR); and funded by the European Union—NextGenerationEU, Project code PE0000021, Concession Decree No. 1561 of 11.10.2022, CUP—I53C22001450006, Project title “Network 4 Energy Sustainable Transition—NEST”.

Institutional Review Board Statement

Not applicable.

Data Availability Statement

Dataset available on request from the authors.

Conflicts of Interest

The authors declare no conflicts of interest.

References

  1. Verdi, L.; Mancini, M.; Napoli, M.; Violi, R.; Pardini, A.; Orlandini, S.; Marta, A.D. Soil carbon emissions from maize under different fertilization methods in an extremely dry summer in Italy. Ital. J. Agrometeorol. 2019, 2, 3–10. [Google Scholar] [CrossRef]
  2. Intergovernmental Panel on Climate Change (IPCC). (Ed.) Climate Change 2022—Mitigation of Climate Change: Working Group III Contribution to the Sixth Assessment Report of the Intergovernmental Panel on Climate Change; Cambridge University Press: Cambridge, UK, 2023. [Google Scholar] [CrossRef]
  3. Braun, R.C.; Bremer, D.J. Nitrous oxide emissions in turfgrass systems: A review. Agron. J. 2018, 110, 2222–2232. [Google Scholar] [CrossRef]
  4. Bekken, M.A.H.; Soldat, D.J. Estimated energy use and greenhouse gas emissions associated with golf course turfgrass maintenance in the Northern USA. Int. Turfgrass Soc. Res. J. 2022, 14, 58–75. [Google Scholar] [CrossRef]
  5. Braun, R.C.; Straw, C.M.; Soldat, D.J.; Bekken, M.A.H.; Patton, A.J.; Lonsdorf, E.V.; Horgan, B.P. Strategies for Reducing Inputs and Emissions in Turfgrass Systems. Crop Forage Turfgrass Mgmt. 2023, 9, e20218. [Google Scholar] [CrossRef]
  6. Townsend-Small, A.; Czimczik, C.I. Carbon sequestration and greenhouse gas emissions in urban turf. Geophys. Res. Lett. 2010, 37, L02707. [Google Scholar] [CrossRef]
  7. Wang, Z.-H.; Zhao, X.; Yang, J.; Song, J. Cooling and energy saving potentials of shade trees and urban lawns in a desert city. Appl. Energy 2016, 161, 437–444. [Google Scholar] [CrossRef]
  8. Monteiro, J.A. Ecosystem services from turfgrass landscapes. Urban For. Urban Green. 2017, 26, 151–157. [Google Scholar] [CrossRef]
  9. Patton, A.J.; Schwartz, B.M.; Kenworthy, K.E. Zoysiagrass (Zoysia spp.) history, utilization, and improvement in the United States: A review. Crop Sci. 2017, 57, S-37. [Google Scholar] [CrossRef]
  10. Magni, S.; Pompeiano, A.; Gaetani, M.; Caturegli, L.; Grossi, N.; Minelli, A.; Volterrani, M. Zoysiagrass (Zoysia spp. Willd.) for European lawns: A review. Ital. J. Agron. 2017, 12, 395–402. [Google Scholar] [CrossRef]
  11. Dutt, N.; Tanwar, T. Nitrous oxide emissions from turfgrass lawns as a result of fertilizer application: A meta-analysis of available literature. Curr. Sci. 2020, 115, 1219. [Google Scholar] [CrossRef]
  12. Law, Q.D.; Trappe, J.M.; Braun, R.C.; Patton, A.J. Greenhouse gas fluxes from turfgrass systems: Species, growth rate, clipping management, and environmental effects. J. Environ. Qual. 2021, 50, 547–557. [Google Scholar] [CrossRef] [PubMed]
  13. Brandani, G.; Baldi, A.; Caturegli, L.; Gaetani, M.; Grossi, N.; Magni, S.; Pardini, A.; Volterrani, M.; Orlandini, S.; Verdi, L. Carbon dioxide and methane emissions by urban turfgrasses under different nitrogen rates: A comparison between tall fescue (Festuca arundinacea Schreb.) and hybrid bermudagrass (Cynodon dactylon [L.] Pers. var. dactylon × Cynodon transvaalensis Burtt-Davy. Appl. Ecol. Environ. Res. 2021, 19, 1–12. [Google Scholar] [CrossRef]
  14. Braun, R.; Bremer, D. Nitrous oxide emissions from turfgrass receiving different irrigation amounts and nitrogen fertilizer forms. Crop Sci. 2018, 58, 1762–1775. [Google Scholar] [CrossRef]
  15. Riches, D.; Porter, I.; Dingle, G.; Gendall, A.; Grover, S. Soil greenhouse gas emissions from Australian sports fields. Sci. Total Environ. 2020, 707, 134420. [Google Scholar] [CrossRef]
  16. Magni, S.; Gaetani, M.E.; Grossi, N.; Caturegli, L.; Bella, S.L.; Leto, C.; Virga, G.; Tuttolomondo, T.; Lulli, F.; Volterrani, M. Bermudagrass adaptation in the Mediterranean climate: Phenotypic traits of 44 accessions. Adv. Hort. Sci. 2014, 28, 29–34. [Google Scholar]
  17. Caturegli, L.; Corniglia, M.; Gaetani, M.; Grossi, N.; Magni, S.; Migliazzi, M.; Angelini, L.; Mazzoncini, M.; Silvestri, N.; Fontanelli, M.; et al. Unmanned Aerial Vehicle to Estimate Nitrogen Status of Turfgrasses. PLoS ONE 2016, 11, e0158268. [Google Scholar] [CrossRef] [PubMed]
  18. Caturegli, L.; Gaetani, M.; Volterrani, M.; Magni, S.; Minelli, A.; Baldi, A.; Brandani, G.; Mancini, M.; Lenzi, A.; Orlandini, S.; et al. Normalized Difference Vegetation Index versus Dark Green Colour Index to estimate nitrogen status on bermudagrass hybrid and tall fescue. Int. J. Remote Sens. 2020, 41, 455–470. [Google Scholar] [CrossRef]
  19. Rorie, R.L.; Purcell, L.C.; Morteza, M.; Karcher, D.E.; King, C.A.; Marsh, M.C.; Longer, D.E. Association of “greenness” in corn with yield and leaf nitrogen concentration. Agron. J. 2011, 103, 529–535. [Google Scholar] [CrossRef]
  20. Jiang, Y.; Carrow, R.N. Broadband spectral reflectance models of turfgrass species and cultivars to drought stress. Crop Sci. 2007, 47, 1611–1618. [Google Scholar] [CrossRef]
  21. Vergara-Díaz, O.; Zaman-Allah, M.A.; Masuka, B.; Hornero, A.; Zarco-Tejada, P.; Prasanna, B.M.; Cairns, J.E.; Araus, J.L. A novel remote sensing approach for prediction of maize yield under different conditions of nitrogen fertilization. Front. Plant Sci. 2016, 7, 666. [Google Scholar] [CrossRef]
  22. Fitz-Rodríguez, E.; Choi, C. Monitoring turfgrass quality using multispectral radiometry. Trans. ASAE 2002, 45, 865–867. [Google Scholar] [CrossRef]
  23. Leinauer, B.; Van Leeuwen, D.M.; Serena, M.; Schiavon, M.; Sevostianova, E. Digital image analysis and spectral reflectance to determine turfgrass quality. Agron. J. 2014, 106, 1787–1794. [Google Scholar] [CrossRef]
  24. Karcher, D.E.; Richardson, M.D. Quantifying turfgrass color using digital image analysis. Crop Sci. 2003, 43, 943–951. [Google Scholar] [CrossRef]
  25. Karcher, D.E.; Richardson, M.D. Digital image analysis in turfgrass research. Turfgrass Biol. Use Manag. 2013, 56, 1133–1149. [Google Scholar] [CrossRef]
  26. Parkin, T.B.; Venterea, R.T. USDA-ARS GRACEnet Project Protocols, Chapter 3. Chamber-Based Trace Gas Flux Measurements; Sampling Protocols: Beltsville, MD, USA, 2010; pp. 1–39. [Google Scholar]
  27. Verdi, L.; Mancini, M.; Ljubojevic, M.; Orlandini, S.; Marta, A.D. Greenhouse gas and ammonia emissions from soil: The effect of organic matter and fertilisation method. Ital. J. Agron. 2018, 13, 260–266. [Google Scholar] [CrossRef]
  28. Kaye, J.P.; Burke, I.C.; Mosier, A.R.; Pablo Guerschman, J. Methane and nitrous oxide fluxes from urban soils to the atmosphere. Ecol. Appl. 2004, 14, 975–981. [Google Scholar] [CrossRef]
  29. Kong, L.; Shi, Z.; Chu, L.M. Carbon emission and sequestration of urban turfgrass systems in Hong Kong. Sci. Total Environ. 2014, 473–474, 132–138. [Google Scholar] [CrossRef] [PubMed]
  30. Van Delden, L.; Larsen, E.; Rowlings, D.; Scheer, C.; Grace, P. Establishing turf grass increases soil greenhouse gas emissions in peri-urban environments. Urban Ecosyst. 2016, 19, 749–762. [Google Scholar] [CrossRef]
  31. Shchepeleva, A.S.; Vasenev, V.I.; Mazirov, I.M.; Vasenev, I.I.; Prokhorov, I.S.; Gosse, D.D. Changes of soil organic carbon stocks and CO2 emissions at the early stages of urban turf grasses’ development. Urban Ecosyst. 2017, 20, 309–321. [Google Scholar] [CrossRef]
  32. Morris, K.N.; Shearman, R.C. NTEP Turfgrass Evaluation Guidelines. In NTEP Turfgrass Evaluation Workshop 2008, 1–5, Beltsville, MD. Available online: http://www.ntep.org/cooperator.htm (accessed on 17 December 2023).
  33. Dhital, D.; Muraoka, H.; Yashiro, Y.; Shizu, Y.; Koizumi, H. Measurement of net ecosystem production and ecosystem respiration in a Zoysia japonica grassland, central Japan, by the chamber method. Ecol. Res. 2010, 25, 483–493. [Google Scholar] [CrossRef]
  34. Dhital, D.; Yashiro, Y.; Ohtsuka, T.; Noda, H.; Shizu, Y.; Koizumi, H. Carbon dynamics and budget in a Zoysia japonica grassland, central Japan. J. Plant Res. 2010, 123, 519–530. [Google Scholar] [CrossRef]
  35. Li, H.-J.; Yan, J.-X.; Yue, X.-F.; Wang, M.-B. Significance of soil temperature and moisture for soil respiration in a Chinese mountain area. Agric. For. Meteorol. 2008, 148, 490–503. [Google Scholar] [CrossRef]
  36. Livesley, S.J.; Dougherty, B.J.; Smith, A.J.; Navaud, D.; Wylie, L.J.; Arndt, S.K. Soil-atmosphere exchange of carbon dioxide, methane and nitrous oxide in urban garden systems: Impact of irrigation, fertiliser and mulch. Urban Ecosyst. 2010, 13, 273–293. [Google Scholar] [CrossRef]
  37. Snyder, C.; Bruulsema, T.; Jensen, T.; Fixen, P. Review of greenhouse gas emissions from crop production systems and fertilizer management effects. Agric. Ecosyst. Environ. 2009, 133, 247–266. [Google Scholar] [CrossRef]
  38. Gillette, K.L.; Qian, Y.; Follett, R.F.; Del Grosso, S. Nitrous oxide emissions from a golf course fairway and rough after application of different nitrogen fertilizers. J. Environ. Qual. 2016, 45, 1788–1795. [Google Scholar] [CrossRef]
  39. Christians, N.; Patton, A.; Law, Q. Fundamentals of Turfgrass Management; John Wiley & Sons, Inc.: Hoboken, NJ, USA, 2017. [Google Scholar]
  40. Volterrani, M.; Grossi, N.; Foschi, L.; Miele, S. Effects of nitrogen nutrition on bermudagrass spectral reflectance. Int. Turfgrass Soc. Res. J. 2005, 10, 1005–1014. [Google Scholar]
  41. Frank, K.W.; Guertal, E.A. Nitrogen research in turfgrass. In Turfgrass: Biology, Use, and Management; Stier, J.C., Horgan, B.P., Bonos, S.A., Eds.; American Society of Agronomy Soil Science Society of America Crop Science Society of America, Inc.: Madison, WI, USA, 2013; pp. 457–491. [Google Scholar] [CrossRef]
  42. Knot, P.; Hrabe, F.; Hejduk, S.; Skladanka, J.; Kvasnovsky, M.; Hodulikova, L.; Caslavova, I.; Horky, P. The impacts of different management practices on botanical composition, quality, colour and growth of urban lawns. Urban For. Urban Green. 2017, 26, 178–183. [Google Scholar] [CrossRef]
  43. Trenholm, L.E.; Carrow, R.N.; Duncan, R.R. Wear tolerance, growth, and quality of seashore paspalum in response to nitrogen and potassium. HortScience 2001, 36, 780–783. [Google Scholar] [CrossRef]
  44. Kopp, K.L.; Guillard, K. Clipping management and nitrogen fertilization of turfgrass. Crop Sci. 2002, 42, 1225–1231. [Google Scholar] [CrossRef]
  45. Caturegli, L.; Lulli, F.; Foschi, L.; Guglielminetti, L.; Bonari, E.; Volterrani, M. Monitoring turfgrass species and cultivars by spectral reflectance. Eur. J. Hortic. Sci. 2014, 79, 97–107. [Google Scholar]
  46. Caturegli, L.; Lulli, F.; Foschi, L.; Guglielminetti, L.; Enrico Bonari, E.; Volterrani, M. Turfgrass spectral reflectance: Simulating satellite monitoring of spectral signatures of main C3 and C4 species. Precis. Agric. 2014, 16, 297–310. [Google Scholar] [CrossRef]
  47. Bremer, D.J.; Lee, H.; Su, K.; Keeley, S.J. Relationships between Normalized Difference Vegetation Index and Visual Quality in Cool-Season Turfgrass: II. Factors Affecting NDVI and its Component Reflectances. Crop Sci. 2011, 51, 2219–2227. [Google Scholar] [CrossRef]
  48. Baldi, A.; Caturegli, L.; Gaetani, M.; Brandani, G.; Pardini, A.; Grossi, N.; Magni, S.; Orlandini, S.; Volterrani, M. A comparison of remote and proximity sensing techniques in the monitoring of nitrogen status of turfgrasses. In Proceedings of the 2019 IEEE International Workshop on Metrology for Agriculture and Forestry (MetroAgriFor), Naples, Italy, 24–26 October 2019; pp. 344–349. [Google Scholar] [CrossRef]
Figure 1. Graphical representation of the experimental design.
Agriculture 14 01244 g001
Figure 2. Meteorological trends (maximum, minimum, and average temperatures, and precipitations) during the experimental period in 2019 (above) and 2020 (below).
Agriculture 14 01244 g002
Figure 3. Daily soil CO2 emissions (kg C-CO2 ha−1) in the two years of experimentation (2019 and 2020) at different N rates with 0 N (control), 50 N (50 kg of N ha−1), 100 N (100 kg of N ha−1), 150 N (150 kg of N ha−1), 200 N (200 kg of N ha−1), and 250 N (250 kg of N ha−1). D represents the monitoring events from D1 at fertilization until D6 at the end of the experiment. Measurements were carried out on a bi-weekly basis. Error bars represent the standard deviations for each treatment. Different letters indicate significant differences according to the post hoc Tukey test (p < 0.05).
Agriculture 14 01244 g003
Figure 4. Daily soil CH4 emissions (kg C- CH4 ha−1) in the two years of experimentation (2019 and 2020) at different N rates with 0 N (control), 50 N (50 kg of N ha−1), 100 N (100 kg of N ha−1), 150 N (150 kg of N ha−1), 200 N (200 kg of N ha−1), and 250 N (250 kg of N ha−1). D represents the monitoring events from D1 at fertilization until D6 at the end of the experiment. Measurements were carried out on a bi-weekly basis. Error bars represent the standard deviations for each treatment. Different letters indicate significant differences according to the post hoc Tukey test (p < 0.05). Sampling moments (D) without letters indicate a lack of significance at the 5% probability level using the Tukey test.
Agriculture 14 01244 g004
Figure 5. Daily soil N2O emissions (kg N-N2O ha−1) in the two years of experimentation (2019 and 2020) at different N rates with 0 N (control), 50 N (50 kg of N ha−1), 100 N (100 kg of N ha−1), 150 N (150 kg of N ha−1), 200 N (200 kg of N ha−1), and 250 N (250 kg of N ha−1). D represents the monitoring events from D1 at fertilization until D6 at the end of the experiment. Measurements were carried out on a bi-weekly basis. Error bars represent the standard deviations for each treatment. Different letters indicate significant differences according to the post hoc Tukey test (p < 0.05).
Agriculture 14 01244 g005
Figure 6. Turf color, turf quality, NDVI, and DGCI trends during 2019 at different N rates with 0 N (control), 50 N (50 kg of N ha−1), 100 N (100 kg of N ha−1), 150 N (150 kg of N ha−1), 200 N (200 kg of N ha−1), and 250 N (250 kg of N ha−1). D represents the monitoring events from D1 at fertilization until D6 at the end of the experiment. Measurements were carried out on a bi-weekly basis. Error bars represent the standard deviations for each treatment. Different letters indicate significant differences according to the post hoc Tukey test (p < 0.05). Sampling moments (D) without letters indicate a lack of significance at 5% probability level using the Tukey test. Due to the sensor malfunction, it was not possible to carry out the sampling at D6.
Agriculture 14 01244 g006aAgriculture 14 01244 g006b
Figure 7. Turf color, turf quality, NDVI, and DGCI trends during 2020 at different N rates with 0 N (control), 50 N (50 kg of N ha−1), 100 N (100 kg of N ha−1), 150 N (150 kg of N ha−1), 200 N (200 kg of N ha−1), and 250 N (250 kg of N ha−1). D represents the monitoring events from D1 at fertilization until D6 at the end of the experiment. Measurements were carried out on a bi-weekly basis. Error bars represent the standard deviations for each treatment. Different letters indicate significant differences according to the post hoc Tukey test (p < 0.05). Sampling moments (D) without letters indicate a lack of significance at 5% probability level using the Tukey test.
Agriculture 14 01244 g007aAgriculture 14 01244 g007b
Table 1. Physical and chemical properties of the soil.
PropertiesMeasure UnitValue
Sand%28
Silt%55
Clay%17
Organic matterg kg−121
Total nitrogeng kg d.m.−11
Available phosphorusmg kg−112
Exchangeable potassiummg kg−1126
pH 7.7
Cation exchange capacitymeq 100 g−19.8
Electric conductivitymS cm−10.2
Table 2. Cumulative greenhouse gas emissions and Global Warming Potential (GWP) during the growing seasons in 2019 and 2020.
CO2CH4N2OGWP
kg/hakg/hakg/hakg CO2eq
20190319.78 (±23.63) d2.88 (±0.45) a0.03 (±0.02) c410.71 (±24.92) c
50382.94 (±20.76) cd2.93 (±1.12) a0.13 (±0.02) b503.84 (±53.59) bc
100425.75 (±52.48) bc3.24 (±0.40) a0.17 (±0.08) b568.65 (±64.32) ab
150459.57 (±57.32) ab2.35 (±1.01) a0.16 (±0.07) b574.42 (±91.48) ab
200508.73 (±44.23) a2.91 (±0.89) a0.28 (±0.03) a672.71 (±28.37) a
250506.56 (±25.28) a2.63 (±0.72) a0.27 (±0.06) a660.32 (±30.42) a
***ns******
20200339.37 (±26.59) d2.24 (±0.40) ab0.02 (±0.01) d409.77 (±39.37) c
50443.25 (±36.75) c2.39 (±0.25) b0.12 (±0.03) c546.05 (±42.40) bc
100469.68 (±13.41) c2.30 (±0.10) a0.13 (±0.02) bc573.43 (±6.79) b
150483.02 (±10.53) bc2.14 (±0.38) b0.18 (±0.01) b596.37 (±5.20) b
200528.86 (±33.46) b2.15 (±0.39) ab0.27 (±0.03) a670.53 (±36.73) a
250582.14 (±26.97) a2.30 (±0.57) b0.29 (±0.04) a733.44 (±14.08) a
**********
The different letters indicate significant differences according to the post hoc Tukey test (p < 0.05). Statistical differences according to the ANOVA analysis are reported as follows: ns, not significant; *, significant at probability level p < 0.1; ***, significant at probability level p < 0.001.
Table 3. Average results of turf color (1–9), turf quality (1–9), Normalized Difference Vegetation Index (NDVI), and Dark Green Color Index (DGCI) determined in 2019. The N rate (kg of N ha−1) was the main effect.
2019
N Rate
(kg N ha−1)
Turf Color
(1–9)
Turf Quality
(1–9)
NDVIDGCI
06.6 (±0.43) c7.6 (±0.26) b0.77 (±0.03) b0.52 (±0.09) b
507.1 (±0.45) b7.7 (±0.24) a0.79 (±0.04) a0.55 (±0.07) ab
1007.4 (±0.58) ab7.7 (±0.26) a0.79 (±0.05) a0.57 (±0.09) ab
1507.6 (±0.78) a7.7 (±0.24) a0.79 (±0.05) a0.58 (±0.05) ab
2007.6 (±0.74) a7.7 (±0.23) a0.79 (±0.06) a0.59 (±0.07) a
2507.7 (±1.06) a7.8 (±0.26) a0.79 (±0.06) a0.60 (±0.05) a
(p < 0.05)******
The different letters indicate significant differences according to the post hoc Tukey test (p < 0.05). Statistical differences according to the ANOVA analysis are reported as follows: *, significant at probability level p < 0.1; **, significant at probability level p < 0.05.
Table 4. Average results of turf color (1–9), turf quality (1–9), Normalized Difference Vegetation Index (NDVI), and Dark Green Color Index (DGCI) determined during 2020. The N rate (kg of N ha−1) was the main effect.
2020
N Rate
(kg N ha−1)
Turf Color
(1–9)
Turf Quality
(1–9)
NDVIDGCI
06.3 (±0.34) d6.5 (±0.24) b0.74 (±0.04) b0.54 (±0.05) c
506.6 (±0.34) c6.8 (±0.24) ab0.76 (±0.03) a0.56 (±0.06) bc
1006.7 (±0.26) bc6.9 (±0.29) ab0.76 (±0.03) a0.57 (±0.06) b
1506.7 (±0.26) bc6.8 (±0.39) ab0.78 (±0.03) a0.58 (±0.06) b
2006.9 (±0.43) b6.9 (±0.38) ab0.78 (±0.03) a0.59 (±0.07) a
2507.1 (±0.45) a7.0 (±0.44) a0.79 (±0.03) a0.61 (±0.06) a
(p < 0.05)****
The different letters indicate significant differences according to the post hoc Tukey test (p < 0.05). Statistical differences according to the ANOVA analysis are reported as follows: *, significant at probability level p < 0.1.
Disclaimer/Publisher’s Note: The statements, opinions and data contained in all publications are solely those of the individual author(s) and contributor(s) and not of MDPI and/or the editor(s). MDPI and/or the editor(s) disclaim responsibility for any injury to people or property resulting from any ideas, methods, instructions or products referred to in the content.

