Abstract
Biochar is a soil amendment that has the potential to effectively improve soil salinization. However, there is a paucity of studies on sodium adsorption using biochar, and the adsorption mechanism remains unclear. To better understand the adsorption mechanism of Na+ on the surface of biochar, both pyrochar and hydrochar were produced at different temperatures. The capacity and influencing factors of Na+ adsorption in biochar were analyzed via batch adsorption experiments. Pore filling dominated the Na+ adsorption in the concentration of the NaCl solution when it was ≤100 mg/L, where wheat straw pyrochar (WB, 3.95–4.94 mg/g Na) and poplar wood chip pyrochar (PB, 0.62–0.70 mg/g Na) presented the release and adsorption of Na+, respectively. When the concentration of the NaCl solution was >100 mg/L, the adsorption capacity of WB (25.44–36.45 mg/g) was significantly higher than PB (4.46–6.23 mg/g). Both the adsorption and release of Na+ in hydrochar was insufficient. In a high concentration of NaCl solution, ion exchange became the key mechanism determining the adsorption of Na+ in pyrochar, in which K+ contributed to more than 94% of the Na+ adsorption. The findings proposed strategies for the structural design of biochar used for Na adsorption. These will promote the utilization of solid biowaste for sodium adsorption and the potential of soil salinization amendment for agriculture in arid lands.
1. Introduction
Soil salinization occurs on more than 833 million hectares of global land worldwide [1], severely impacting crop yields and posing a threat to global food security. Sodium ion is the critical factor causing soil salinization. Currently, numerous techniques have been developed for the elimination of excessive sodium ions in saline soils, including chemical, biological, agricultural and irrigation engineering methods [2,3,4,5,6].
Biochar is a carbonaceous porous material obtained using biomass pyrolysis under oxygen-limit conditions [7]. Biochar is prepared from a variety of raw materials, for instance, agricultural waste [8], sludge [9] and manure [10], which leads to different physical and chemical properties [11]. To date, it has been shown that biochar is able to improve soil nutrient utilization [12], enhance carbon sequestration [13] and reduce pollutant bioavailability [14]. Adsorption ability is an essential function of biochar for environmental remediation. The adsorption effect of biochar is related to its well-developed pore structure, large specific surface area, abundant functional groups, etc. [15,16,17]. The strong adsorption capacity of biochar for organic pollutants and heavy metals has been substantially reported [18,19,20,21]; however, few studies have discussed the adsorption of sodium ions using biochar and its application in arid regions.
Biochar significantly reduces soil salinity and alleviates salt stress in plants. It has been reported that pyrolysis biochar (pyrochar) and hydrothermal biochar (hydrochar) can effectively amend saline soil and promote plant growth [22,23,24,25,26]. In soda saline alkali land, where the soil pH was 8.48 and its salt content was 0.82%, the application of 20 ton/ha corn straw biochar resulted in a reduction in Na+ by approximately 33.70% and 47.47% in 0–20 cm soil at the seed and harvest stages, respectively, and this ultimately promoted maize growth [22]. In the saline alkali soil of the western Songnen Plain, China, the application of 15 ton/ha acidic corn stalk biochar resulted in a reduction in Na+ in the soil by 18.23% and 41.42% at the seed and harvest stages, respectively, while simultaneously increasing sorghum yield [23]. In saline soil with a pH of 8.8 and a total salt content of 8.1 mg/kg, the application of biochar resulted in a significant reduction in Na+ levels in the soil, with a 2.8–5.5 fold decrease observed [25]. This led to a notable alleviation of the adverse effects of salt on the growth of Miscanthus. The application of rice straw biochar resulted in a significant reduction in Na+ uptake by cotton, with a range of 8.21~39.47% observed in saline soil from Xinjiang with a pH of 8.54 and conductivity of 6061 μS/cm [24]. The application of biochar derived from different pyrolysis temperatures resulted in a reduction of 5.26–9.47% of exchangeable Na+ in saline soil with a pH of 9.06 and an exchangeable Na+ content of 1.10 cmol/kg [26]. This approach effectively mitigated yield reduction caused by salinity. In short, the abovementioned studies using biochar to diminish Na+ in saline soil expanded biochar application in saline soil remediation, improving saline soil and agricultural development. Nevertheless, the precise mechanism through which biochar improves saline soils and alleviates salt stress remains unclear. Consequently, further research is required to elucidate the adsorption mechanism of biochar in relation to Na+, with the aim of enhancing the ameliorative effect of biochar and mitigating the adverse effects of salinity on crops.
The reduction in Na+ might be as a result of the adsorption of Na+ by biochar. Nguyen et al. [27] found that the Na+ adsorption capacity of the biochars derived from rice husk, corn stalks, longan branch and coconut coir are 33.9, 30.9, 17.9 and 15.1 mg/g, respectively. Yu et al. [28] demonstrated that the Na+ adsorption capacity of pristine and sulfuric acid-modified corn cob biochar exhibits a Na+ adsorption capacity of 20.6 and 67.7 mg/g, respectively. The nature of biochar, e.g., functional groups, is an important factor affecting the adsorption capacity [28]. Pore filling and ion exchange may be the main mechanism of Na+ adsorption by biochar [27,28,29]. However, the quantitative research for the adsorption mechanism is still lacking in arid land.
To deeply understand the adsorption mechanism of Na+ in biochar, our study aimed (1) to investigate biochar’s adsorption capacity of Na+ with different physical structures and chemical properties; (2) to seek the key factors influencing adsorption behaviors and quantitatively understand the adsorption mechanism of Na+ in biochar. Wheat straw and poplar wood chips were used as raw materials for the preparation of pyrochar at 350, 550 and 750 °C and hydrochar at 180 and 220 °C. The rate and capacity of Na+ adsorption in biochar were observed by adsorption kinetics and isotherms experiments. The pH effect and ion-exchange experiments were applied to find out the influencing factors of Na+ adsorption. The structure–activity of Na+ adsorption in biochar was discussed to fill in the knowledge gap of the quantitative mechanism of Na+ adsorption. The mechanism of Na+ adsorption proposed in our study sheds new light on biochar application in saline soil.
2. Materials and Methods
2.1. Experimental Materials and Reagents
To establish the structure–effect of Na+ adsorption in biochar, the biochar with a significant difference in both structure and composition should be used. Since it is known that the feedstock influences the physiochemical properties, wheat straw (Figure S1c) and poplar wood chips (Figure S1d) were selected as the raw materials used for the preparation of biochar. The wheat straws and poplar wood chips were collected from Fukang, Xinjiang and Kaifeng, Henan, China, respectively. The raw materials were dried in an oven at 60 °C for 12 h, then crushed to pass through a 100-mesh sieve. The sieved biomasses were sealed in bags for further usage.
The main chemical reagents used in this study were sodium chloride (99.5%, Solarbio, Beijing, China), hydrochloric acid (36.0–38.0%, Kelong, Jiande, China), ammonia solution (30.0%, CNW, Frankfurt, Germany), and potassium hydroxide (99.9%, Macklin, Shanghai, China). The ultra-pure water that was used was from a water purifier (SO-K1-20TY, Saiouhuachuang, Beijing, China).
2.2. Biochar Preparation
In this study, two distinct types of biochar were prepared using disparate preparation conditions: pyrochar (pyrolysis biochar) and hydrochar (hydrothermal biochar). The pyrochar was prepared based on the pyrolysis method [30]: each sieved biomass was pyrolyzed at the target temperature (i.e., 350, 550 and 750 °C) for 6 h under oxygen-limited conditions in a muffle furnace (KSL-1200X-M, Kejing, Shenyang, China) (Figure S1a). The rate of temperature increase in the muffle furnace was 5 °C/min. At different temperatures, wheat straw pyrochar (WB) was labeled as WB350, WB550 and WB750, and poplar wood chips pyrochar (PB) was labeled as PB350, PB550 and PB750.
The hydrochar was obtained using the hydrothermal method [31]: each sieved biomass was added to a 100 mL stainless-steel autoclave (Figure S1b) with deionized water in the ratio of 1:10 (w:w) and hydrothermally charred at the aimed temperatures (i.e., 180 and 220 °C) for 6 h. The rate of temperature rise in the muffle furnace was 5 °C/min. Vacuum filtration was used to separate the hydrochar from the mixture in the hydrothermal reaction. The hydrochar was oven-dried after several rinses and again passed through a 100-mesh sieve. Wheat straw hydrochar (HWB) at different temperatures was denoted as HWB180 and HWB220, respectively; the poplar wood chips hydrochar (HPB) was denoted as HPB180 and HPB220, respectively.
2.3. Biochar Characterization
The Brunauer–Emmett–Teller (BET) surface area and pore volume of biochar were measured using a fully automated physical adsorption instrument (NOVA2000e, Quantachrome, Drive Boynton Beach, FL, USA). The pH of biochar was measured using a pH meter (SevenExcellence, Mettler Toledo, Greifensee, Switzerland) with a ratio of biochar to water of 1:20 (w:w) [32,33]. The ash content was measured using mass balance after calcination at 800 °C for 4 h [34]. The elemental contents of C, H, N and S were measured using an elemental analyzer (Vario EL cube, Elementar, Langenselbold, Germany). The O content was calculated using mass balance on an ash-free condition [35,36]. The elemental contents of Na, K, Ca and Mg of the biochar were measured using an Inductively Coupled Plasma Mass Spectrometer (ICP-MS, ICAP RQ, ThermoFisher Scientific, Waltham, MA, USA) after microwave digestion (Mars6, CEM, Charlotte, NC, USA). In addition, the elemental composition of the biochar surface was measured using Energy Dispersive Spectroscopy (EDS, X-Flash SDD 5010, Bruker, Ettlingen, Germany). The crystal structure of biochar was measured using X-ray Diffraction Spectroscopy (XRD, D8-ADVANCE, Bruker, Germany).
2.4. Batch Adsorption Experiments
2.4.1. Adsorption Kinetics
The adsorption kinetics of WB and PB were carried out by adding 20 mg pyrochar and 8 mL 5 mg/L Na+ solution in glass vials. The mixture was shaken for 20 min, 1, 3, 6, 12, 24, 48, 72, 96 and 120 h at 25 ± 2 °C. For HWB and HPB, 20 mg hydrochar and 8 mL 1 mg/L Na+ solution was added to glass vials. The same approach of shaking was the same as for pyrochar, while the setup time was 24, 48, 72, 120 and 168 h. In addition, owing to the Na in pristine biochar, to distinguish the dynamic of the release of internal Na and the adsorption of external Na in biochar, the release kinetics of internal Na from pristine biochar to water were set as the control. In the release kinetics, the ratio of solid to water and the shaking duration of each biochar were the same as the adsorption kinetics. All the treatments were conducted in duplicate. The solution was separated from the mixture using a 0.45 μm filter. The Na+ concentration in the filtrate was measured using ion meter (PXSJ-227L, REX, Shanghai, China) with a sodium ion selective electrode (972207, REX, Shanghai, China). The standard curves of the ion meter at different Na+ concentration intervals are shown in Figure S2. To maintain the sensitivity of the electrode, a 0.1 mL ammonia solution was added to the filtrate to keep the pH higher than 10.0. The amount of Na+ adsorbed or released per unit mass of biochar was calculated using Equations (1) and (2).
where qe (mg/g) and qr (mg/g) are the equilibrium amounts of adsorption and release, respectively; C0 (mg/L) and Ce (mg/L) are the initial and equilibrium concentrations of Na+ in solution; V (L) is the volume of the solution; m (g) is the mass of biochar. The change in adsorption capacity of Na+ by biochar over time was analyzed using the pseudo-first-order (Equation (3)) and pseudo-second-order (Equation (4)) kinetic models [37].
where qt (mg/g) is the adsorption capacity at time t; t (h) is the duration of the adsorption reaction; k1 (1/h) and k2 (g/mg/h) are the rate constants.
2.4.2. Adsorption Isotherm
The isothermal adsorption experiments were carried out by weighing 10 mg pyrochar and 8 mL Na+ solution of concentrations ranging from 10 to 2500 mg/L in glass vials. The isothermal adsorption equilibrium time was 96 h based on the adsorption kinetics. The Langmuir (Equation (5)) [27], Freundlich (Equation (6)) [38] and Dubinin–Ashtakhov (D–A) (Equation (7)) [39,40] model were utilized to fit the curve of adsorption isotherms.
where qmax (mg/g) is the maximum adsorption capacity; KL (L/mg) represents the affinity coefficient; KF (mg(1−n)∙Ln/g) represents the Freundlich affinity coefficient; n is the Freundlich linearity constant; ε (kJ/mol) = RTln(Sw/Ce) is the effective adsorption potential; R [8.314 × 10⁻³ kJ/(mol∙K)] is the universal gas constant; T (K) is the absolute temperature; Sw (mg/L) is the water solubility of adsorbents; Q0 (mg/g) is the adsorption capacity; E (kJ/mol) is the characteristic adsorption energy; and b is a fitting factor.
2.4.3. Effect of Solution Equilibrium pH on Na+ Adsorption
The effect of pH on Na+ adsorption in pyrochar was investigated by adding 50 mg WB and PB with 8 mL 250 and 100 mg/L Na+ solutions, respectively, to glass vials, and shaking for 96 h. The equilibrium pH of the Na+ solutions was maintained at approximately 2.0, 4.0, 6.0, 8.0, 10.0 and 12.0. In order to achieve the desired equilibrium pH, the volumes of HCl and KOH solution were calculated based on the results of a preliminary experiment. This ensured that the equilibrium pH remained within the specified range throughout the course of the experiment. The Na+ concentration in the filtrate was measured using a sodium ion composite electrode as described above.
2.4.4. Ion Exchange of Na+ on the Surface of Pyrochar
To clarify the contribution of different ions to Na+ exchange adsorption, ion release experiments with pyrochar in sodium solution and deionized water were setup. The mixture of 50 mg pyrochar and 8 mL 250 mg/L Na+ solution was shaken for 96 h. The mixture of pyrochar and deionized water was set as the control. The concentrations of metal ions in the filtrate were measured using inductively coupled plasma mass spectrometry (ICP-MS, ICAP RQ, ThermoFisher Scientific, USA), and the concentration of H+ was calculated from the filtrate pH. In the Na+ adsorption process, the relative contribution of ions in the pyrochar was calculated using Equation (8).
where i presents an individual element of K+, Ca2+, Mg2+ and H+; qi (mg/g) is the concentration difference in an individual element from NaCl solution to deionized water; qK, qCa, qMg and qH are the concentration differences in K+, Ca2+, Mg2+ and H+ from the NaCl solution to deionized water, respectively.
3. Results and Discussion
3.1. Characterization of Biochar
3.1.1. Surface Area and Pore Volume of Pyrochar and Hydrochar
The surface area and pore volume of pyrochar gradually increased with the increasing temperature (Table 1, Figures S3 and S4), as the higher temperature can promote the development of the pore structure of pyrochar [41,42,43]. The surface areas of WB750 (417.34 m2/g) and PB750 (601.90 m2/g) were 90.14 and 5.52 times higher than those of WB350 (4.63 m2/g) and PB350 (109.05 m2/g), respectively. At the same temperature, the surface area of PB was significantly higher than that of WB. Consequently, both temperature and feedstock are critical factors affecting the pore structure of biochar [44]. In addition, the surface area and pore volume of the hydrochar were smaller than those of the pyrochar, which may be attributed to the lower temperatures causing in a lower degree of pyrolysis [43].

Table 1.
Physicochemical properties of pyrochar and hydrochar.
3.1.2. Chemical Properties of Pyrochar and Hydrochar
With higher temperatures leading to higher ash content (Table 1), WB750 (26.91%) and PB750 (1.95%) had a higher ash content than WB350 (19.71%) and PB350 (0.45%), respectively. Moreover, at the same temperature, straw-derived biochar (WB) had a higher ash content than the wood-derived biochar (PB). The ash content of the biochar would affect the pH due to the presence of alkaline mineral oxides [45], which explains the reason that the pH of WB is much lower than PB (Table 1), although the lowest pH among pyrochar was found in PB350 with a pH of 6.0 which is still higher than all of the hydrochars. Compared to pyrochar, the lower pH (≤4.6) of hydrochar may be due to the dissolution of alkaline functional groups during the preparation.
The contents of Na, K, Ca and Mg elements in pyrochar had a tendency to rise with increasing temperature (Table 2). Moreover, the Na and K contents were significantly higher in WB compared to PB. The Na and K contents of WB750 were 7.97 and 11.22 times higher than those of PB750 (Table 2), respectively, demonstrating that the feedstock determines the amounts of Na and K in biochar [45]. The above findings were similar to the relative elemental content of biochar measured using EDS (Table S2). Additionally, the crystal phase of KCl in WB was observed in the XRD analysis (Figure S5). It was inferred that abundant K was mainly distributed on the WB surface in the form of KCl. Compared to the pyrochar, the hydrochar contained a relatively lower amount of Na (i.e., <0.80 mg/g), which could be caused by using pyrolysis in an aqueous environment (Table S1).
Table 2.
The elemental content of Na, K, Ca and Mg in pyrolyzed biochar.
3.2. Adsorption Kinetics of Na+ in Biochar
For WB, the majority of Na+ was released rather than adsorbed (Figure S6a), while the adsorption capacity of PB increased rapidly in the first 10 h and stabilized after 96 h (Figure S6c). It is clear to see that PB released a much lower amount of Na+ than WB (Figure S6b,d), which was consistent with the less internal Na that was observed in PB (Table 2). The abundant amount of internal Na in WB may lead to the substantial release of Na+. The adsorption and release of Na+ in HWB and HPB were insufficient (Table 2, Figure S6e,f); thus, hydrochar was not involved in any further adsorption analyses in our study. From the fitting parameters (Table 3), both the pseudo-first-order model and the pseudo-second-order model could not explain the adsorption behaviors well, revealing that the internal Na release could impact the adsorption of Na+ in biochar. In this case, the exact influence of internal Na on the adsorption of Na+ needs further exploration in our study.
Table 3.
Kinetics parameters of Na+ adsorption on PB fitted to the pseudo-first-order model and pseudo-second-order model.
3.3. Adsorption Isotherms of Na+ in Pyrochar
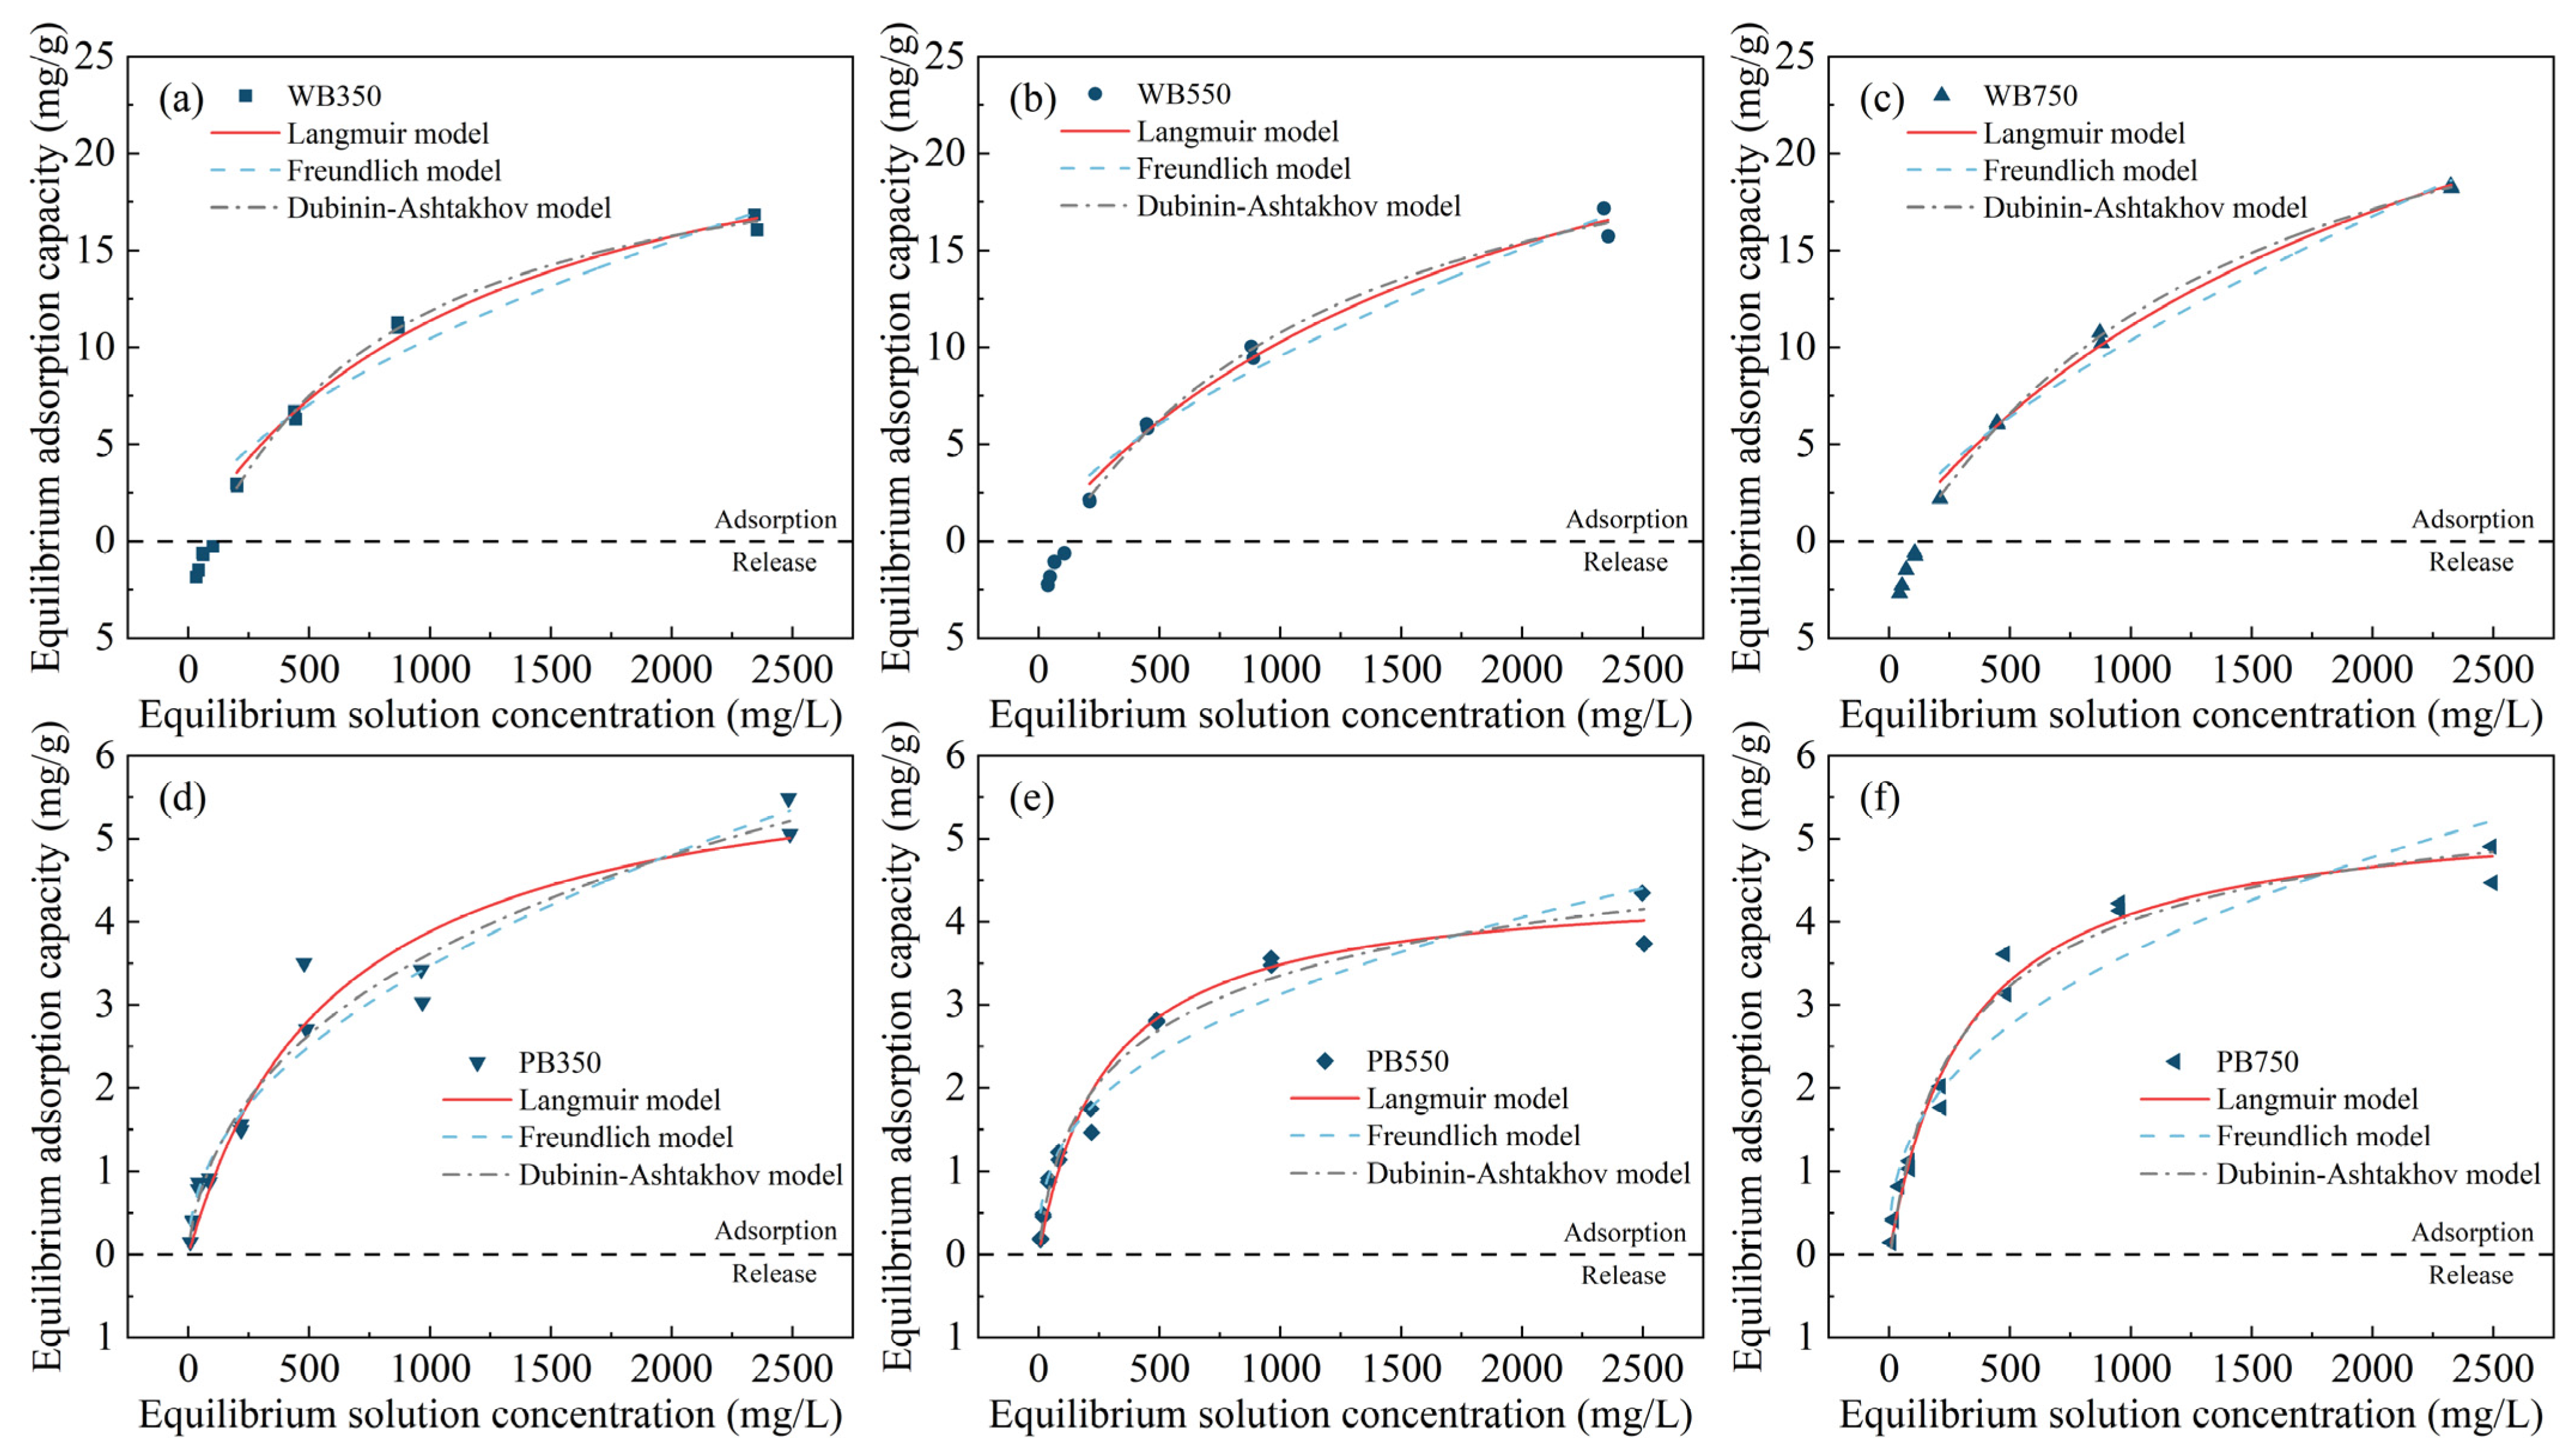
The fitting curves of Na+ adsorption in pyrochar using the Langmuir, Freundlich and D–A models are depicted in Figure 1. When the Na+ solution concentration was low (≤100 mg/L), the WB showed obvious Na+ release, which was consistent with the kinetic results (Figure S6). It confirmed that when the external Na is low, the internal Na of biochar would largely affect the adsorption and release behaviors of Na+. The fitting parameters of Na+ adsorption on the surfaces of WB and PB based on the three models are listed in Table 4. The Langmuir and D–A models were better fitted with adsorption data rather than the Freundlich model according to R2. This demonstrated that the adsorption of Na+ in pyrochar is nonlinear, thus, the parameters of the Langmuir and D–A models are primarily focused on in our further discussion. The adsorption capacity represented by the qmax or Q0 of WB increased with the pyrolysis temperature, implying that the Na+ adsorption may relate to the surface area increment and metal ion enrichment. Considering the well-accepted adsorption mechanisms, this suggests that the adsorption of Na+ on WB is most likely based on either pore filling or ion exchange [27]. The saturated adsorption capacity of WB350 was 4.18 times higher than that of PB350, while the surface area of WB350 was 4.24% of that of PB350. Although PB has a significantly larger surface area compared to WB, its adsorption capacity for Na+ was notably smaller. This indicated that pore filling cannot be the dominant mechanism for Na+ adsorption in pyrochar.
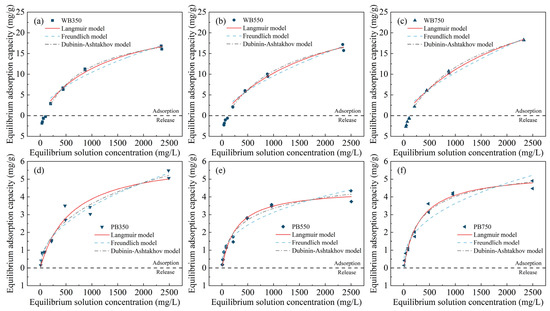
Figure 1.
Adsorption isotherm data and fitting results of the Langmuir, Freundlich and D–A models for Na+ on (a) WB350, (b) WB550, (c) WB750, (d) PB350, (e) PB550 and (f) PB750.
Table 4.
Isothermal parameters of Na+ adsorption on WB and PB fitted to the Langmuir, Freundlich and D–A models.
3.4. Effect of Equilibrium pH on Na+ Adsorption in Pyrochar
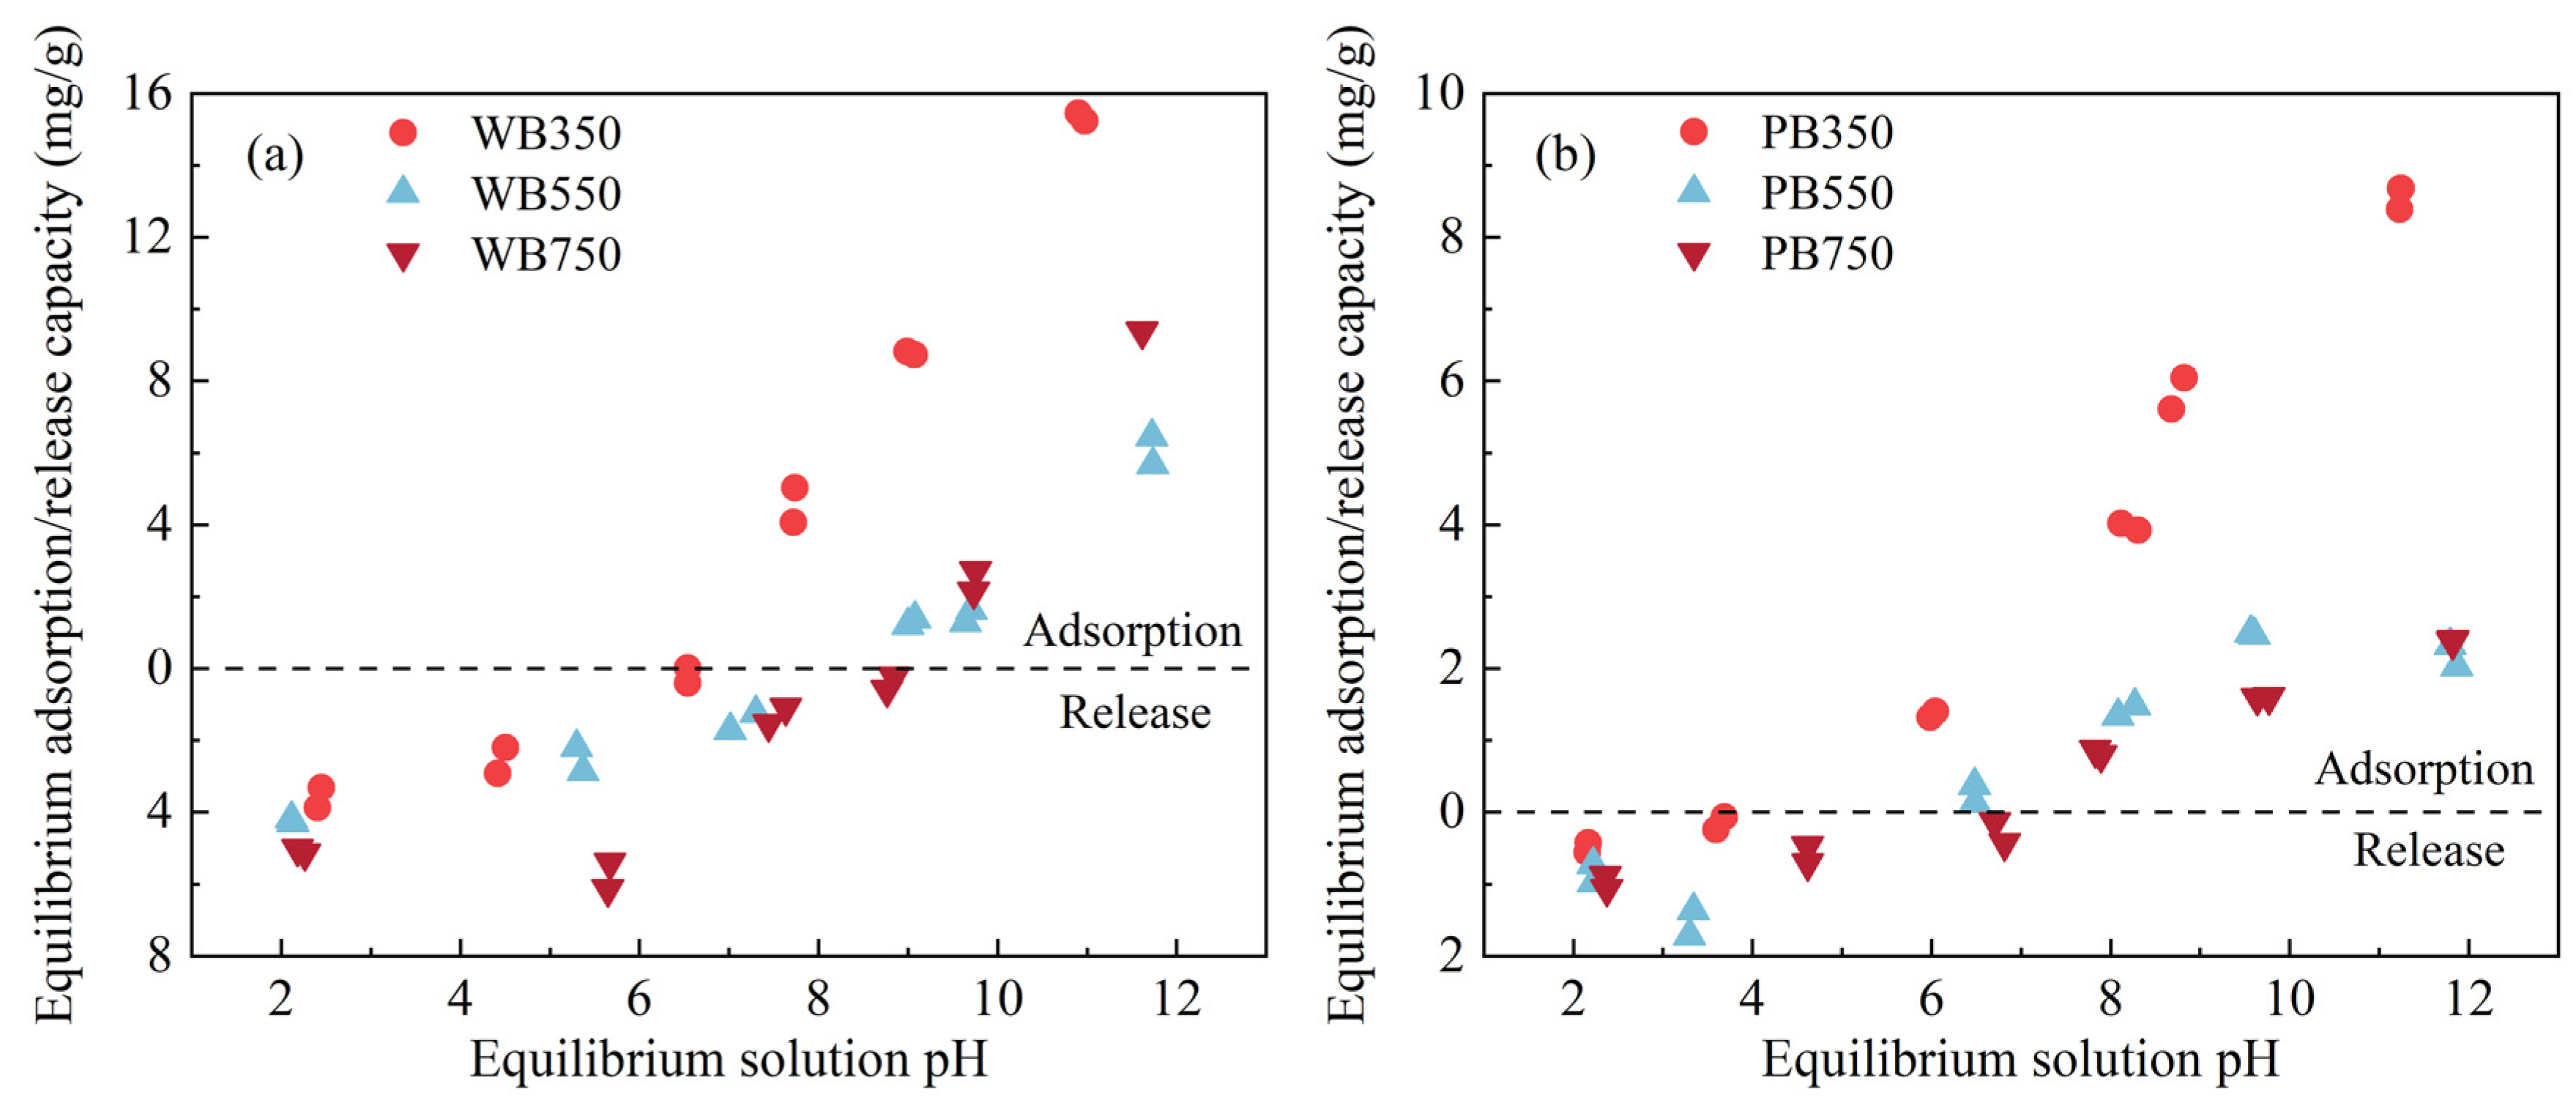
At a pH range of 2 to 12, the adsorption and release behaviors of Na+ in pyrochar were significantly different. The behaviors of WB and PB in Na+ solution changed from releasing Na+ to adsorbing Na+ with an increasing equilibrium pH (Figure 2). At an acidic condition, Na+ was released from both WB and PB, suggesting electrostatic repulsion between Na+ and H+ in the solution and the competitive effect of H+ on the adsorption site [46,47]. In the alkaline condition, both WB and PB exhibited Na+ adsorption. In particular, the low-temperature pyrochar showed greater adsorption than the pyrochar from the higher temperature, although the pore volume of the low-temperature pyrochar was much lower than the higher-temperature pyrochar. The detailed causes of this phenomenon are not yet understood and need to be further researched. The specific surface area and pore volume of PB decreased after impregnation in an alkaline (pH = 12.0) solution (Table S6). This suggests that the pore volume does not determine the Na+ adsorption capacity of pyrochar under alkaline conditions. The strong electrostatic attraction of deprotonated functional groups may favor the adsorption of Na+ in biochar [48,49].
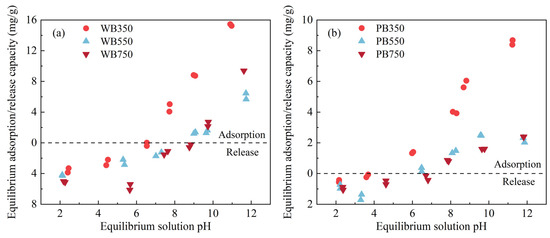
Figure 2.
Effect of equilibrium solution pH on Na+ adsorption on (a) WB and (b) PB.
3.5. Ion Exchange of Na+ in Pyrochar
Since it was proved that pore filling does not predominantly determine the Na+ adsorption in pyrochar, we hypothesized that ion exchange might be the key mechanism in Na+ adsorption. As can be seen in Figure 3., K+ had a highest relative contribution (>94%) to the Na+ adsorption for WB, while both K+ and Ca2+ contributed to the Na+ adsorption for PB, indicating that K+ was the main metal ion undergoing ion exchange with Na+. This suggests that the significantly higher Na+ adsorption of WB compared to PB is most likely attributed to the higher K content of WB. Therefore, the metal (e.g., K) in biochar that causes ion-exchange interaction is the predominant mechanism of Na+ adsorption.
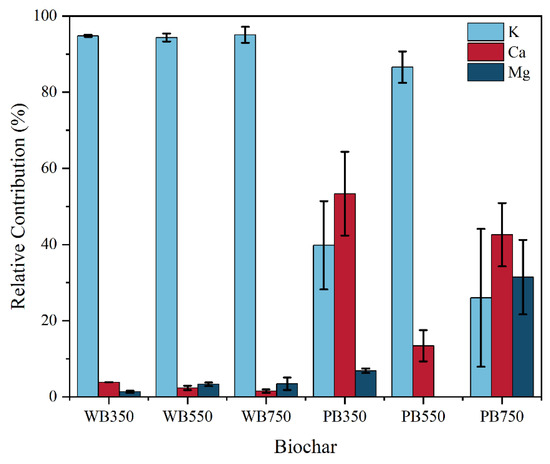
Figure 3.
The relative contribution of K+, Ca2+ and Mg2+ on the Na+ adsorption in pyrochar.
3.6. Mechanism of Na+ Adsorption in Biochar
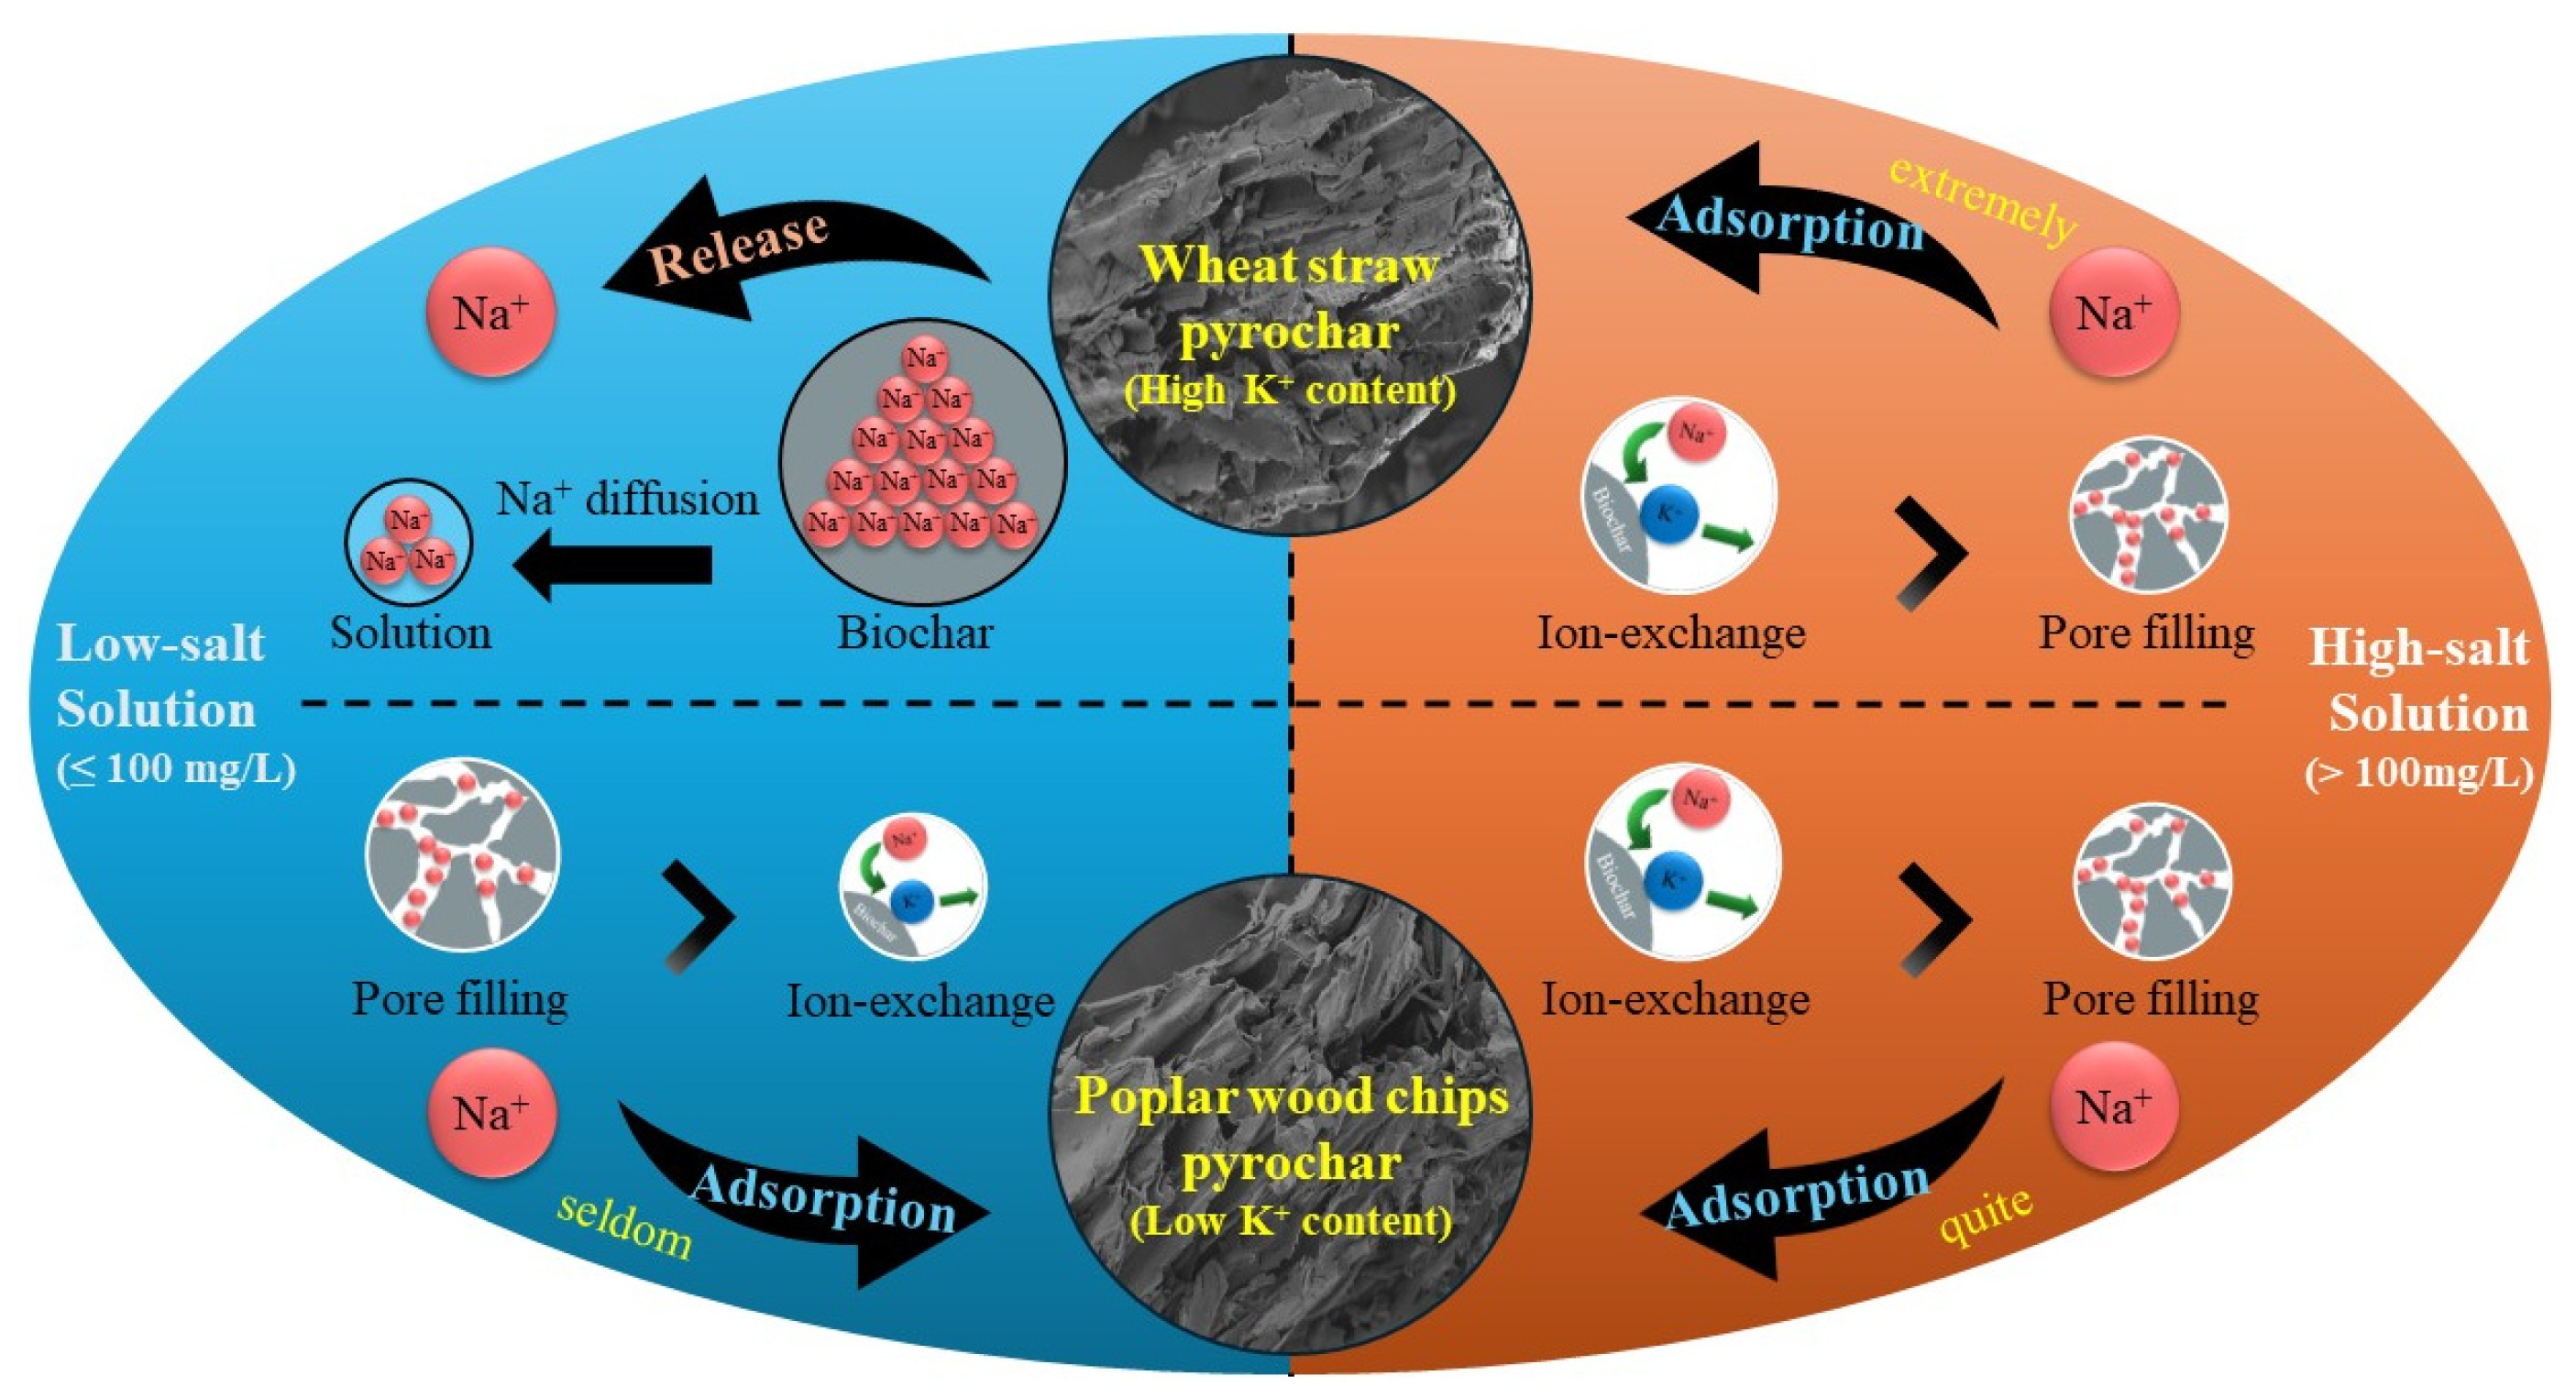
Pore filling and ion exchange are the main mechanisms of Na+ adsorption in biochar [27,28,29]. Nguyen et al. [27] revealed that ion exchange occurred through Na+ adsorption by altering the amount of metal ions released from biochar. Yu et al. [28] improved the adsorption capacity of biochar for Na+ by increasing the amount of H+ exchanging with Na+. Besides ion-exchange interaction, pore filling also determined the Na+ adsorption in biochar. For biochar prepared from various feedstocks, the contributions of pore filling and ion exchange to Na+ adsorption were different. Based on our findings summarized in Figure 4, when the external Na is low (≤100 mg/L), pore filling is the dominant mechanism of Na+ adsorption in biochar. When the external Na was higher (>100 mg/L), ion exchange became the main mechanism of Na+ adsorption. The susceptibility to ion exchange between the metal ion (K+) and Na+ may be due to their binding to functional groups through electrostatic interactions [20,37,50,51].

Figure 4.
Mechanisms and constitutive relationships of Na+ adsorption in biochar.
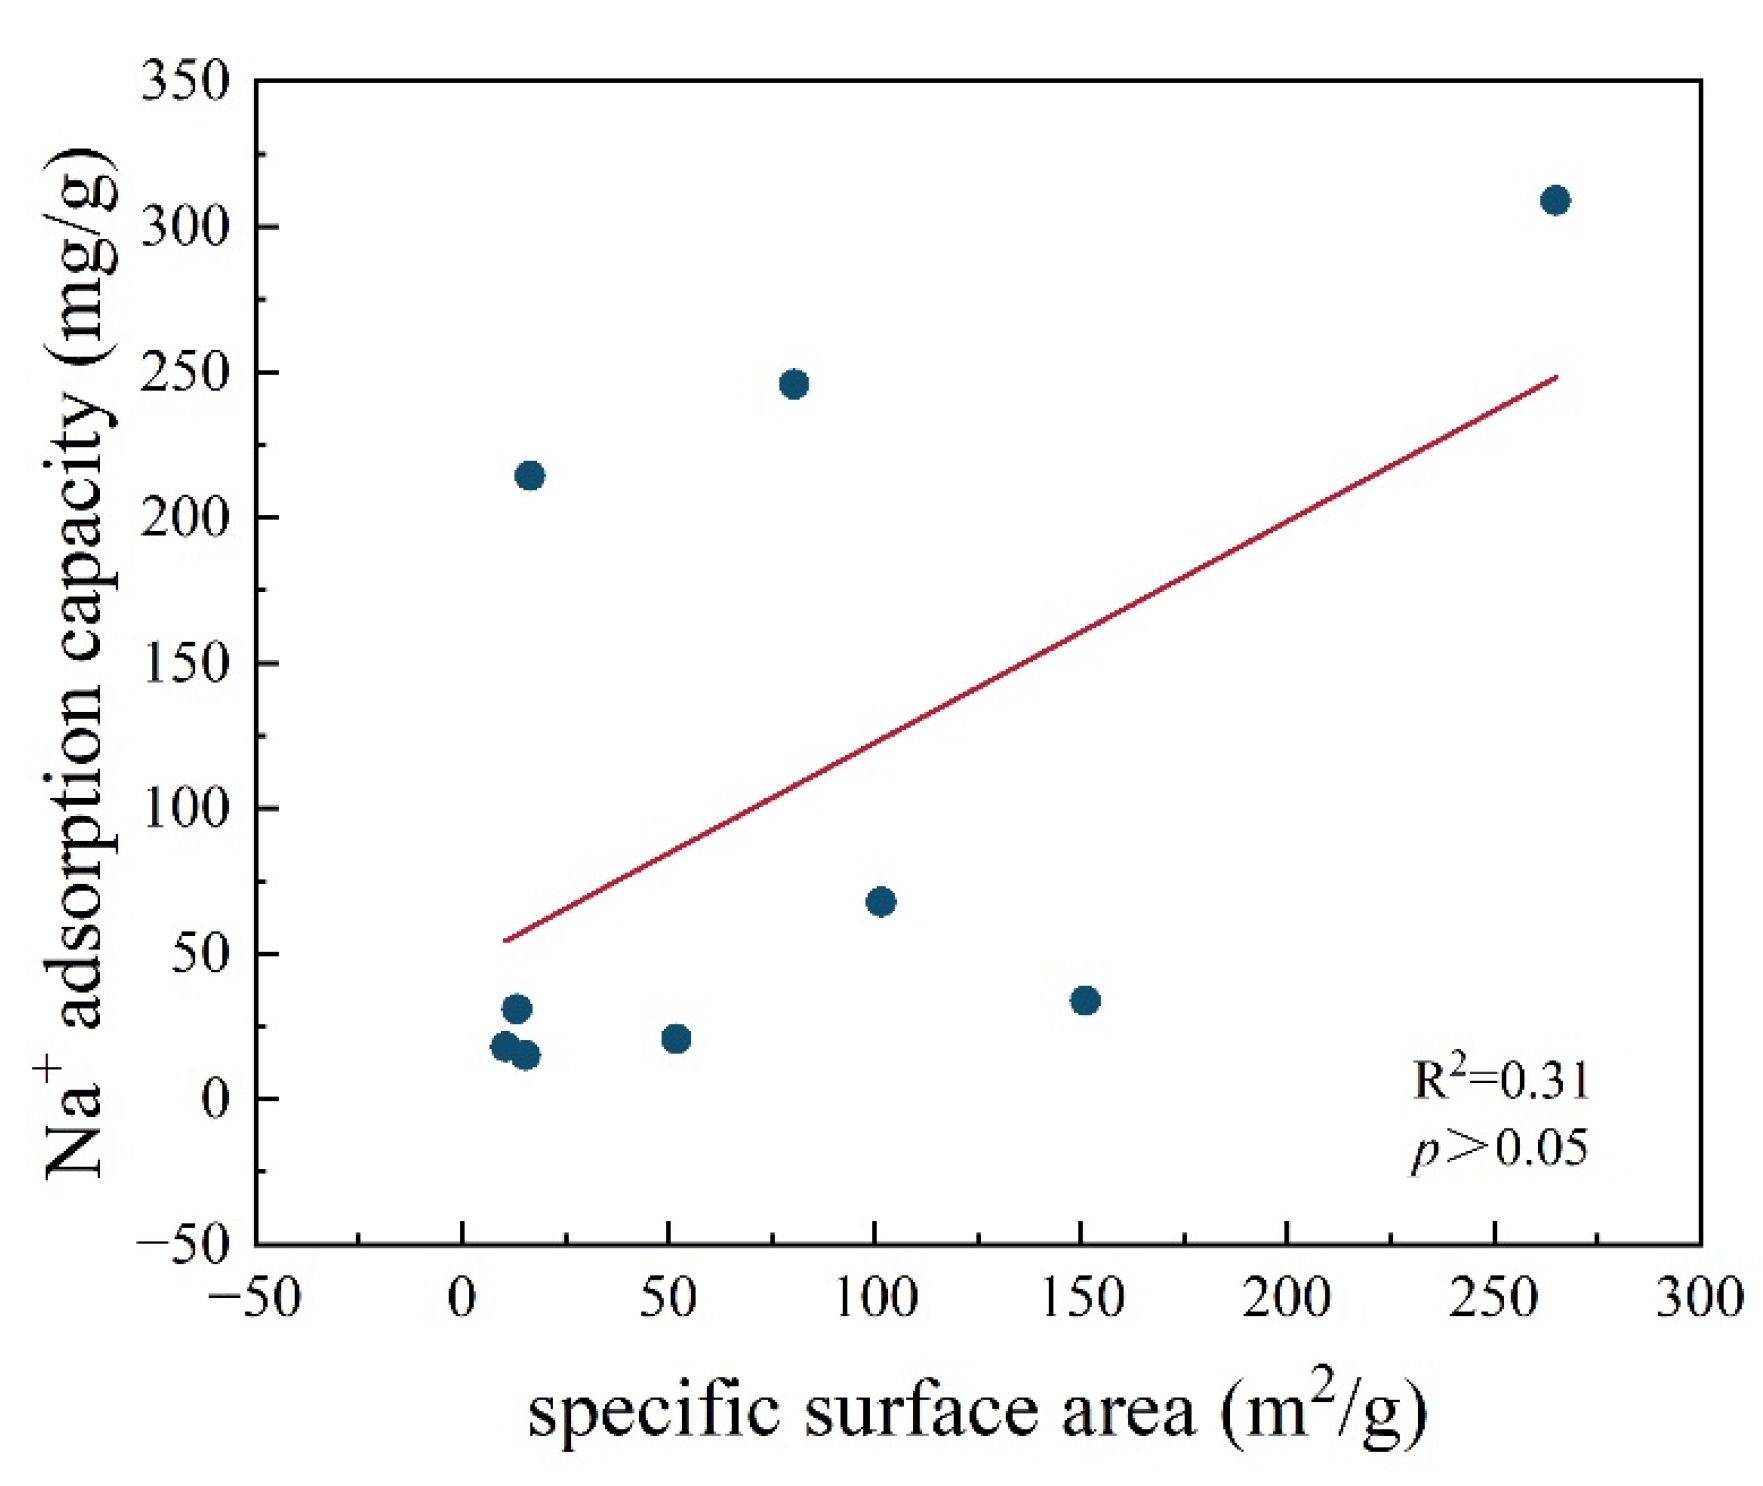
In our study, the specific surface area and pore volumes of PB were greater than that of WB; however, WB had a higher adsorption capacity than PB, which further suggested that ion exchange may have a greater contribution to adsorption than pore filling. The adsorption capacity of Na+ was extracted from previous studies, in which the concentrations of external Na were all higher than 200 mg/L in these studies. The fitting (R2 = 0.31, p > 0.05) between the adsorption capacity of Na+ and the surface area in the literature [27,28,52] was performed (Figure 5), which again demonstrated that surface area was not an important factor influencing the adsorption capacity of biochar for Na+. It is worth noting that this contradicts the result where there was a strong positive relationship between the surface area of the adsorbent and the adsorption capacity of the adsorbent (e.g., Cd2+) [53].
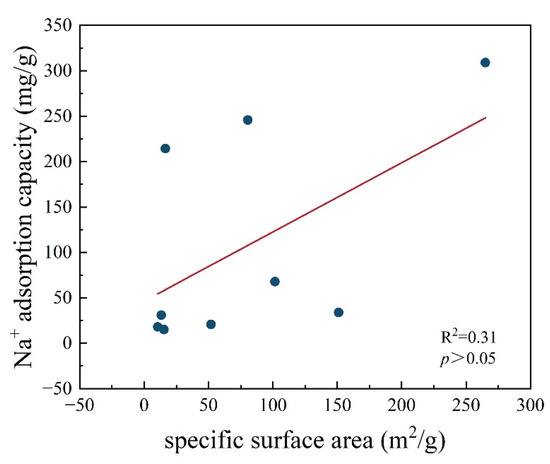
Figure 5.
The relationship between Na+ adsorption capacity and specific surface area of biochar in the literature [27,28,52].
4. Conclusions
In this study, the Na in the pristine pyrochar and NaCl solution were defined as internal Na and external Na, respectively. (1) When the external Na is low (≤100 mg/L), the pyrochar with a higher amount of internal Na would release Na. While the concentration of internal Na was low, the pyrochar exhibited the ability of Na adsorption; pore filling is the dominant mechanism of Na+ adsorption in pyrochar. (2) When the external Na is higher (>100 mg/L), the adsorption capacity of Na does not significantly relate to the surface area of the pyrochar. This demonstrated that pore filling is not the dominant adsorption mechanism, where instead ion exchange becomes the main mechanism of Na+ adsorption. The capacity of metal ions (specifically K+) to engage in ion exchange with Na+ through electrostatic interactions determined the adsorption capacity of Na in pyrochar. Strategies were proposed for the structural design of biochar used for Na adsorption. Pore structure development should be emphasized when the external Na is ≤ 100 mg/L; in contrast, the biochar with abundant Na-exchangeable ions should be selected for Na adsorption when the external Na is >100 mg/L.
This study confirmed that the internal Na of pyrochar substantially affects the adsorption and release behavior of Na in pyrochar. Consequently, further research would be more comprehensible if the ratio of internal and external Na in biochar were considered to evaluate the adsorption behavior of biochar. Different procedures should be applied to increase the adsorption capacity of Na: (1) feedstock with high amounts of metal ions should be selected when the content of external Na is high; (2) when the content of external Na is low, it is crucial to select suitable feedstocks that exhibit well-developed pores, or alternatively, to conduct processes of pore structure enhancement during biochar preparation.
Supplementary Materials
The following supporting information can be downloaded at: https://www.mdpi.com/article/10.3390/agriculture14081246/s1, Figure S1: Muffle furnace (a), autoclave (b), wheat straw biomass (c) and poplar wood chips biomass (d) used in the study; Figure S2: The operating curve of the ion meter at different Na+ concentration intervals; Figure S3: N2 adsorption and desorption curves in BET tests; Figure S4: Pore size distribution of biochar with DFT method; Figure S5: XRD pattern of biochar; Figure S6: Adsorption kinetics data of Na+ on (a) WB, (b) PB and (c) HBC and release kinetics data of Na+ on (a) WB, (b) PB and (c) HBC; Figure S7: Adsorption isothermal data and fitting results of biochar in different solution concentration intervals; Table S1: The elemental content of Na in hydrothermal biochar; Table S2: Relative elemental content of biochar measured using EDS; Table S3: Isothermal parameters of the D–A model for Na+ adsorption on PB350, PB550 and PB750 at different solution concentration intervals; Table S4: pKa, content and main types of surface groups of WB and PB; Table S5: The adsorption of Na+ using WB and PB in solutions with different K+ contents; Table S6: The specific surface area and pore volume of PB350 and PB750 before and after the alkaline (pH = 12.0) solution [54,55,56].
Author Contributions
K.Y.: Investigation, formal analysis, writing—original draft. W.J.: investigation, formal analysis. J.W. and K.Z. (Kaizhao Zhang): resources. Y.L. and M.X.: writing—review and editing. K.Z. (Kun Zhang) and J.M.: conceptualization, writing—review and editing, supervision, funding acquisition. All authors have read and agreed to the published version of the manuscript.
Funding
This research was funded by Natural Science Foundation of Xinjiang Uygur Autonomous Region, grant number 2021D01C048, the Key Research and Development Program of Xinjiang Uygur Autonomous Region, grant number 2023B02002 and Tianshan Talent Training Program, grant number 2023TSYCCX0080.
Institutional Review Board Statement
Not applicable.
Data Availability Statement
Data sharing is available upon request.
Conflicts of Interest
The authors declare no conflicts of interest.
References
- FAO: Global Map of Salt Affected Soils Version 1.0. 2021. Available online: https://www.fao.org/soils-portal/data-hub/soil-maps-and-databases/global-map-of-salt-affected-soils/en/ (accessed on 5 May 2024).
- Fang, S.B.; Tu, W.R.; Mu, L.; Sun, Z.L.; Hu, Q.Y.; Yang, Y. Saline alkali water desalination project in Southern Xinjiang of China: A review of desalination planning, desalination schemes and economic analysis. Renew. Sustain. Energy Rev. 2019, 113, 109268. [Google Scholar] [CrossRef]
- Heng, T.; He, X.L.; Yang, L.L.; Xu, X.; Feng, Y. Mechanism of Saline-Alkali land improvement using subsurface pipe and vertical well drainage measures and its response to agricultural soil ecosystem. Environ. Pollut. 2022, 293, 118583. [Google Scholar] [CrossRef]
- Liu, M.L.; Wang, C.; Liu, X.L.; Lu, Y.C.; Wang, Y.F. Saline-alkali soil applied with vermicompost and humic acid fertilizer improved macroaggregate microstructure to enhance salt leaching and inhibit nitrogen losses. Appl. Soil Ecol. 2020, 156, 103705. [Google Scholar] [CrossRef]
- Xia, J.B.; Ren, J.Y.; Zhang, S.Y.; Wang, Y.H.; Fang, Y. Forest and grass composite patterns improve the soil quality in the coastal saline-alkali land of the Yellow River Delta, China. Geoderma 2019, 349, 25–35. [Google Scholar] [CrossRef]
- Zhang, C.; Zhou, X.H.; Wang, X.Y.; Ge, J.P.; Cai, B.Y. Elaeagnus angustifolia can improve salt-alkali soil and the health level of soil: Emphasizing the driving role of core microbial communities. J. Environ. Manag. 2022, 305, 114401. [Google Scholar] [CrossRef]
- Pan, X.Q.; Gu, Z.P.; Chen, W.M.; Li, Q.B. Preparation of biochar and biochar composites and their application in a Fenton-like process for wastewater decontamination: A review. Sci. Total Environ. 2021, 754, 142104. [Google Scholar] [CrossRef]
- Yuan, J.H.; Xu, R.K.; Zhang, H. The forms of alkalis in the biochar produced from crop residues at different temperatures. Bioresour. Technol. 2021, 102, 3488–3497. [Google Scholar] [CrossRef]
- Chen, T.; Zhang, Y.X.; Wang, H.T.; Lu, W.J.; Zhou, Z.Y.; Zhang, Y.C.; Ren, L.L. Influence of pyrolysis temperature on characteristics and heavy metal adsorptive performance of biochar derived from municipal sewage sludge. Bioresour. Technol. 2014, 164, 47–54. [Google Scholar] [CrossRef]
- Cantrell, K.B.; Hunt, P.G.; Uchimiya, M.; Novak, J.M.; Ro, K.S. Impact of pyrolysis temperature and manure source on physicochemical characteristics of biochar. Bioresour. Technol. 2012, 107, 419–428. [Google Scholar] [CrossRef]
- Ahmed, M.B.; Zhou, J.L.; Ngo, H.H.; Guo, W.S. Insight into biochar properties and its cost analysis. Biomass Bioenergy 2016, 84, 76–86. [Google Scholar] [CrossRef]
- Van Zwieten, L.; Kimber, S.; Morris, S.; Chan, K.Y.; Downie, A.; Rust, J.; Joseph, S.; Cowie, A. Effects of biochar from slow pyrolysis of papermill waste on agronomic performance and soil fertility. Plant Soil 2010, 327, 235–246. [Google Scholar] [CrossRef]
- Woolf, D.; Amonette, J.E.; Street-Perrott, F.A.; Lehmann, J.; Joseph, S. Sustainable biochar to mitigate global climate change. Nat. Commun. 2010, 1, 56. [Google Scholar] [CrossRef]
- He, L.Z.; Fan, S.L.; Müller, K.; Hu, G.T.; Huang, H.G.; Zhang, X.K.; Lin, X.M.; Che, L.; Wang, H.L. Biochar reduces the bioavailability of di-(2-ethylhexyl) phthalate in soil. Chemosphere 2016, 142, 24–27. [Google Scholar] [CrossRef]
- Guo, Z.J.; Chen, X.; Hang, J.C.; Li, Z.Z.; Zhong, C.H.; Sun, A.H.; Li, J.H.; Xu, S.Y. Oxidative magnetization of biochar at relatively low pyrolysis temperature for efficient removal of different types of pollutants. Bioresour. Technol. 2023, 387, 129572. [Google Scholar] [CrossRef]
- Tang, Y.Q.; Wang, C.; Holm, P.E.; Hansen, H.C.B.; Brandt, K.K. Impacts of biochar materials on copper speciation, bioavailability, and toxicity in chromated copper arsenate polluted soil. J. Hazard. Mater. 2023, 459, 132067. [Google Scholar] [CrossRef]
- Ma, R.; Nie, D.Y.; Sang, M.; Wang, W.W.; Nie, G.Z. Adsorption of Rhodamine B and Pb(II) from aqueous solution by MoS2 nanosheet modified biochar: Fabrication, performance, and mechanisms. Bioresour. Technol. 2023, 386, 129548. [Google Scholar] [CrossRef]
- Ahmad, M.; Lee, S.S.; Dou, X.M.; Mohan, D.; Sung, J.K.; Yang, J.E.; Ok, Y.S. Effects of pyrolysis temperature on soybean stover- and peanut shell-derived biochar properties and TCE adsorption in water. Bioresour. Technol. 2012, 118, 536–544. [Google Scholar] [CrossRef]
- Fan, S.S.; Wang, Y.; Wang, Z.; Tang, J.; Tang, J.; Li, X.D. Removal of methylene blue from aqueous solution by sewage sludge-derived biochar: Adsorption kinetics, equilibrium, thermodynamics and mechanism. J. Environ. Chem. Eng. 2017, 5, 601–611. [Google Scholar] [CrossRef]
- Lu, H.L.; Zhang, W.H.; Yang, Y.X.; Huang, X.F.; Wang, S.Z.; Qiu, R.L. Relative distribution of Pb2+ sorption mechanisms by sludge-derived biochar. Water Res. 2012, 46, 854–862. [Google Scholar] [CrossRef]
- Chen, X.C.; Chen, G.C.; Chen, L.G.; Chen, Y.X.; Lehmann, J.; McBride, M.B.; Hay, A.G. Adsorption of copper and zinc by biochars produced from pyrolysis of hardwood and corn straw in aqueous solution. Bioresour. Technol. 2011, 102, 8877–8884. [Google Scholar] [CrossRef]
- Zhao, W.; Zhou, Q.; Tian, Z.Z.; Cui, Y.T.; Liang, Y.; Wang, H.Y. Apply biochar to ameliorate soda saline-alkali land, improve soil function and increase corn nutrient availability in the Songnen Plain. Sci. Total Environ. 2020, 722, 137428. [Google Scholar] [CrossRef]
- Zhou, Z.X.; Li, Z.Y.; Zhang, Z.Q.; You, L.R.; Xu, L.F.; Huang, H.Y.; Wang, X.P.; Gao, Y.; Cui, X.J. Treatment of the saline-alkali soil with acidic corn stalk biochar and its effect on the sorghum yield in western Songnen Plain. Sci. Total Environ. 2021, 797, 149190. [Google Scholar] [CrossRef]
- Wang, X.L.; Riaz, M.; Xia, X.Y.; Babar, S.; El-Desouki, Z.; Li, Y.X.; Wang, J.Y.; Jiang, C.C. Alleviation of cotton growth suppression caused by salinity through biochar is strongly linked to the microbial metabolic potential in saline-alkali soil. Sci. Total Environ. 2024, 922, 171407. [Google Scholar] [CrossRef]
- He, K.; He, G.; Wang, C.P.; Zhang, H.P.; Xu, Y.; Wang, S.M.; Kong, Y.Z.; Zhou, G.K.; Hu, R. Biochar amendment ameliorates soil properties and promotes Miscanthus growth in a coastal saline-alkali soil. Appl. Soil Ecol. 2020, 155, 103674. [Google Scholar] [CrossRef]
- Tang, J.W.; Zhang, S.D.; Zhang, X.T.; Chen, J.H.; He, X.Y.; Zhang, Q.Z. Effects of pyrolysis temperature on soil -plant -microbe responses to Solidago canadensis L.-derived biochar in coastal saline-alkali soil. Sci. Total Environ. 2020, 731, 138938. [Google Scholar] [CrossRef]
- Nguyen, B.T.; Dinh, G.D.; Dong, H.P.; Le, L.B. Sodium adsorption isotherm and characterization of biochars produced from various agricultural biomass wastes. J. Clean. Prod. 2022, 346, 131250. [Google Scholar] [CrossRef]
- Yu, J.; Chang, J.S.; Guo, H.L.; Han, S.; Lee, D.J. Sodium ions removal by sulfuric acid-modified biochars. Environ. Res. 2023, 235, 116592. [Google Scholar] [CrossRef]
- Awan, S.; Ippolito, J.A.; Ullman, J.L.; Ansari, K.; Cui, L.Q.; Siyal, A.A. Biochars reduce irrigation water sodium adsorption ratio. Biochar 2021, 3, 77–87. [Google Scholar] [CrossRef]
- Zhang, K.; Mao, J.F.; Chen, B.L. Reconsideration of heterostructures of biochars: Morphology, particle size, elemental composition, reactivity and toxicity. Environ. Pollut. 2019, 254, 113017. [Google Scholar] [CrossRef]
- Prasannamedha, G.; Kumar, P.S.; Mehala, R.; Sharumitha, T.J.; Surendhar, D. Enhanced adsorptive removal of sulfamethoxazole from water using biochar derived from hydrothermal carbonization of sugarcane bagasse. J. Hazard. Mater. 2021, 407, 124825. [Google Scholar] [CrossRef]
- Inyang, M.; Gao, B.; Yao, Y.; Xue, Y.W.; Zimmerman, A.R.; Pullammanappallil, P.; Cao, X.D. Removal of heavy metals from aqueous solution by biochars derived from anaerobically digested biomass. Bioresour. Technol. 2012, 110, 50–56. [Google Scholar] [CrossRef]
- Xue, Y.W.; Gao, B.; Yao, Y.; Inyang, M.; Zhang, M.; Zimmerman, A.R.; Ro, K.S. Hydrogen peroxide modification enhances the ability of biochar (hydrochar) produced from hydrothermal carbonization of peanut hull to remove aqueous heavy metals: Batch and column tests. Chem. Eng. J. 2012, 200, 673–680. [Google Scholar] [CrossRef]
- Mao, J.F.; Zhang, K.; Chen, B.L. Linking hydrophobicity of biochar to the water repellency and water holding capacity of biochar-amended soil. Environ. Pollut. 2019, 253, 779–789. [Google Scholar] [CrossRef]
- Guo, S.Q.; Dong, X.Y.; Wu, T.T.; Shi, F.J.; Zhu, C.X. Characteristic evolution of hydrochar from hydrothermal carbonization of corn stalk. J. Anal. Appl. Pyrolysis 2015, 116, 1–9. [Google Scholar] [CrossRef]
- Chen, Y.D.; Lin, Y.C.; Ho, S.H.; Zhou, Y.; Ren, N.Q. Highly efficient adsorption of dyes by biochar derived from pigments-extracted macroalgae pyrolyzed at different temperature. Bioresour. Technol. 2018, 259, 104–110. [Google Scholar] [CrossRef]
- Zhang, Z.L.; Li, Y.; Zong, Y.M.; Yu, J.; Ding, H.; Kong, Y.L.; Ma, J.Y.; Ding, L. Efficient removal of cadmium by salts modified-biochar: Performance assessment, theoretical calculation, and quantitative mechanism analysis. Bioresour. Technol. 2022, 361, 127717. [Google Scholar] [CrossRef]
- Chen, T.; Wei, Y.F.; Yang, W.J.; Liu, C.B. Highly efficient As(III) removal in water using millimeter-sized porous granular MgO-biochar with high adsorption capacity. J. Hazard. Mater. 2021, 416, 125822. [Google Scholar] [CrossRef]
- Yang, K.; Yan, X.X.; Xu, J.L.; Jiang, L.; Wu, W.H. Sorption of organic compounds by pyrolyzed humic acids. Sci. Total Environ. 2021, 781, 146646. [Google Scholar] [CrossRef]
- Yang, K.; Xing, B.S. Adsorption of Organic Compounds by Carbon Nanomaterials in Aqueous Phase: Polanyi Theory and Its Application. Chem. Rev. 2010, 110, 5989–6008. [Google Scholar] [CrossRef]
- Qi, G.D.; Pan, Z.F.; Zhang, X.Y.; Miao, X.D.; Xiang, W.; Gao, B. Effect of ball milling with hydrogen peroxide or ammonia hydroxide on sorption performance of volatile organic compounds by biochar from different pyrolysis temperatures. Chem. Eng. J. 2022, 450, 138027. [Google Scholar] [CrossRef]
- Zhang, X.Y.; Gao, B.; Zheng, Y.L.; Hu, X.; Creamer, A.E.; Annable, M.D.; Li, Y.C. Biochar for volatile organic compound (VOC) removal: Sorption performance and governing mechanisms. Bioresour. Technol. 2017, 245, 606–614. [Google Scholar] [CrossRef]
- Sun, Y.N.; Gao, B.; Yao, Y.; Fang, J.N.; Zhang, M.; Zhou, Y.M.; Chen, H.; Yang, L.Y. Effects of feedstock type, production method, and pyrolysis temperature on biochar and hydrochar properties. Chem. Eng. J. 2014, 240, 574–578. [Google Scholar] [CrossRef]
- Zhao, L.; Cao, X.D.; Masek, O.; Zimmerman, A. Heterogeneity of biochar properties as a function of feedstock sources and production temperatures. J. Hazard. Mater. 2013, 256, 1–9. [Google Scholar] [CrossRef] [PubMed]
- Fan, R.M.; Chen, C.L.; Lin, J.Y.; Tzeng, J.H.; Huang, C.P.; Dong, C.D.; Huang, C.P. Adsorption characteristics of ammonium ion onto hydrous biochars in dilute aqueous solutions. Bioresour. Technol. 2019, 272, 465–472. [Google Scholar] [CrossRef] [PubMed]
- Tan, X.F.; Liu, Y.G.; Zeng, G.M.; Wang, X.; Hu, X.J.; Gu, Y.L.; Yang, Z.Z. Application of biochar for the removal of pollutants from aqueous solutions. Chemosphere 2015, 125, 70–85. [Google Scholar] [CrossRef] [PubMed]
- Tao, Q.Q.; Zhang, X.; Huang, D.J.; Huang, G.L.; Fan, J.L.; Peng, H.; Dai, Y.; Prabaharan, K. Copper hexacyanoferrate nanoparticle-decorated biochar produced from pomelo peel for cesium removal from aqueous solution. J. Radioanal. Nucl. Chem. 2019, 322, 791–799. [Google Scholar] [CrossRef]
- Jiang, T.Y.; Jiang, J.; Xu, R.K.; Li, Z. Adsorption of Pb(II) on variable charge soils amended with rice-straw derived biochar. Chemosphere 2012, 89, 249–256. [Google Scholar] [CrossRef] [PubMed]
- Wu, L.P.; Wei, C.B.; Zhang, S.R.; Wang, Y.D.; Kuzyakov, Y.; Ding, X.D. MgO-modified biochar increases phosphate retention and rice yields in saline-alkaline soil. J. Clean Prod. 2019, 235, 901–909. [Google Scholar] [CrossRef]
- Cui, X.Q.; Fang, S.Y.; Yao, Y.Q.; Li, T.Q.; Ni, Q.J.; Yang, X.E.; He, Z.L. Potential mechanisms of cadmium removal from aqueous solution by Canna indica derived biochar. Sci. Total Environ. 2016, 562, 517–525. [Google Scholar] [CrossRef]
- Deng, Y.Y.; Huang, S.; Dong, C.Q.; Meng, Z.W.; Wang, X.G. Competitive adsorption behaviour and mechanisms of cadmium, nickel and ammonium from aqueous solution by fresh and ageing rice straw biochars. Bioresour. Technol. 2020, 303, 122853. [Google Scholar] [CrossRef]
- Medynska-Juraszek, A.; Alvarez, M.L.; Bialowiec, A.; Jerzykiewicz, M. Characterization and Sodium Cations Sorption Capacity of Chemically Modified Biochars Produced from Agricultural and Forestry Wastes. Materials 2021, 14, 4714. [Google Scholar] [CrossRef]
- Saeed, A.A.H.; Harun, N.Y.; Sufian, S.; Bilad, M.R.; Nufida, B.A.; Ismail, N.M.; Zakaria, Z.Y.; Jagaba, A.H.; Ghaleb, A.A.S.; Al-Dhawi, B.N.S. Modeling and Optimization of Biochar Based Adsorbent Derived from Kenaf Using Response Surface Methodology on Adsorption of Cd2+. Water 2021, 13, 999. [Google Scholar] [CrossRef]
- Chen, Z.M.; Xiao, X.; Chen, B.L.; Zhu, L.Z. Quantification of Chemical States, Dissociation Constants and Contents of Oxygen-containing Groups on the Surface of Biochars Produced at Different Temperatures. Environ. Sci. Technol. 2015, 49, 309–317. [Google Scholar] [CrossRef]
- Gilli, P.; Pretto, L.; Bertolasi, V.; Gilli, G. Predicting Hydrogen-Bond Strengths from Acid-Base Molecular Properties. The pKa Slide Rule: Toward the Solution of a Long-Lasting Problem. Accounts Chem. Res. 2009, 42, 33–44. [Google Scholar] [CrossRef]
- Wang, J.M.; Teng, X.J.; Wang, H.; Ban, H. Characterizing the metal adsorption capability of a class F coal fly ash. Environ. Sci. Technol. 2004, 38, 6710–6715. [Google Scholar] [CrossRef]

Disclaimer/Publisher’s Note: The statements, opinions and data contained in all publications are solely those of the individual author(s) and contributor(s) and not of MDPI and/or the editor(s). MDPI and/or the editor(s) disclaim responsibility for any injury to people or property resulting from any ideas, methods, instructions or products referred to in the content. |
© 2024 by the authors. Licensee MDPI, Basel, Switzerland. This article is an open access article distributed under the terms and conditions of the Creative Commons Attribution (CC BY) license (https://creativecommons.org/licenses/by/4.0/).