Article

Simulation and Optimization of the Throttle Releaser in Aerated Irrigation Systems

1
College of Mechanical and Electrical Engineering, Henan Agricultural University, Zhengzhou 450002, China
2
Institute of Farmland Irrigation of CAAS, Key Laboratory of High-Efficient and Safe Utilization of Agriculture Water Resources, Chinese Academy of Agricultural Sciences, Xinxiang 453003, China
3
Zhumadian Seed Industry Development Center, Zhumadian 463000, China
*
Authors to whom correspondence should be addressed.
These authors contributed equally to this work.
Agriculture 2024, 14(8), 1248; https://doi.org/10.3390/agriculture14081248 (registering DOI)
Submission received: 3 July 2024 / Revised: 25 July 2024 / Accepted: 26 July 2024 / Published: 29 July 2024

Abstract

:
Aerated irrigation is an emerging and efficient irrigation technique, and the throttle-squeeze releaser (TS releaser) is a commonly used key component in aerated irrigation devices. However, it has issues such as large bubble size, uneven distribution, and low dissolved-oxygen content in the irrigation water. Given these problems, this study optimized the valve chamber and throat structure of the releaser based on the TS releaser, designing three different types of releasers with W-shaped valve chamber, arc-shaped valve chamber, and multi-throat W-shaped valve chamber. The simulation results, obtained using the Fluent module with grid division in ANSYS 2022, show that high-pressure regions are formed inside the releaser with V-shaped and arc-shaped valve chambers that are detrimental to the formation of microbubbles in high-pressure dissolved-air water, while the fluid pressure reduction and energy dissipation are more balanced inside the releasers with a W-shaped valve chamber. Compared to a single-throat design, the multi-throat design allows high-pressure fluid to enter the valve chamber more uniformly, which aids in maximizing the functionality and performance of the valve chamber. To determine the effects of throat size, outlet size, and valve chamber angle on the pressure field, turbulent flow field, velocity field, and air-phase distribution within the multi-throat W-shaped valve chamber releaser, simulation interaction experiments were conducted. The results showed that the optimized releaser performed best when the throat diameter was 1 mm, the outlet size was 2 mm, and the valve chamber angle was 80°. Finally, a comparative performance evaluation between the conventional TS diffuser and the optimized multi-throat W-valve chamber releaser reveals that the latter achieves a maximum dissolved-oxygen content of 6.36 mg/L in the treated irrigation water, representing an approximately 3.5% improvement over the 6.14 mg/L recorded by the traditional releaser. Furthermore, when considering the thresholds of irrigation flow rates above 950 L/h and dissolved-oxygen levels exceeding 5.9 mg/L, the multi-throat W-valve chamber diffuser exhibits a broader operational range characterized by high flow rates and dissolved-oxygen levels.

1. Introduction

Aerated irrigation is an emerging irrigation technology that has been put into use in the cultivation of various crops [1]. Aerated irrigation refers to the addition of gas (usually air or oxygen) into irrigation water to promote the growth and development of crops by supplying gas near the crop roots [2,3,4]. Research has proven that aerated irrigation can, to a certain extent, loosen the soil [5], reduce soil compaction [6], improve soil permeability and water retention, facilitate the growth and activity of soil microorganisms [7], and enhance the conversion and utilization of soil nutrients [8]. It plays a promoting role in increasing crop yield and quality, reducing crop stress under adversity, and reducing the loss of water and fertilizer, which is of great significance to the sustainable development of agriculture [9,10,11,12].
Figure 1 shows the aerated irrigation device and its working principle used in this article. This equipment adopts the method of dissolving and releasing air to obtain aerated irrigation water. Specifically, it pressurizes the irrigation water and air to dissolve air into the irrigation water to form high-pressure dissolved-air water. Then, the high-pressure dissolved-air water passes through a throttle releaser, where it undergoes drastic changes in pressure and velocity, and the air dissolved in the water precipitates to form microbubbles [13,14,15,16]. In this system, air is pumped in through an air pump and enters an air–liquid mixing pump through a flowmeter. The air–liquid mixing pump initially mixes the water and air and sends it into a high-pressure tank. Inside the high-pressure tank, the air dissolves into the water to form high-pressure dissolved-air water. The high-pressure dissolved-air water flows out of the tank and enters the releaser through a pipeline. The irrigation water flows out of the releaser and enters a circulation pipeline, which is equipped with a proportional valve and a check valve. The generated irrigation water can be recirculated into the air–liquid mixing pump through the entire system to further increase the microbubble density and dissolved-oxygen content. In this system, the pressure inside the high-pressure tank is constant at 0.5 MPa, and the outlet pressure is constant at 0.1 MPa. Adjusting the air–liquid volume ratio and the proportional circulation valve can affect the dissolved-oxygen content and flow rate of the final irrigation water. As the air ratio and circulation ratio increase, the dissolved-oxygen content of the irrigation water increases, but the irrigation flow rate decreases accordingly. Additionally, the practical constraints of the air–liquid mixing pump’s performance dictate that the gas proportion cannot be infinitely increased. Exceeding a critical threshold results in the emergence of large bubbles within the system, precipitating a drastic reduction in the irrigation flow rate. Through rigorous experimentation, it has been determined that the critical air–liquid volume ratio for this equipment lies at approximately 15%, beyond which the adverse effects on system performance become pronounced.
The releaser serves as a pivotal component in the dissolved-air flotation (DAF) process for the production of bubbly water, primarily categorized into three types, a throttle-vibrate (TV) releaser, a throttle-jet (TJ) releaser, and a throttle-squeeze (TS) releaser. These releasers typically adopt a single-inlet, single-chamber structure nested within piping systems. Leveraging the Venturi principle, they create a substantial pressure differential between the inlet and outlet ends [17,18,19,20]. As high-pressure dissolved-air water traverses through, its velocity abruptly increases while pressure sharply decreases, fostering turbulence within the valve chamber. This drastic variation in velocity and pressure prompts the continuous fragmentation and reaggregation of the incoming high-pressure dissolved-air water, ultimately leading to the liberation of microbubbles from the dissolved air in the liquid [21,22]. Among the three releaser types, TV and TJ releasers, owing to their relatively large sizes, are unsuitable for small-scale aerated irrigation equipment. Consequently, the present equipment employs the TS-type dissolved-air releaser. However, experimental observations have revealed issues with this configuration, including the generation of coarse microbubbles, uneven bubble distribution, low dissolved-oxygen content in the aerated water, and consequently, reduced irrigation efficiency [23,24,25]. To address these challenges, this study introduces modifications to the TS releaser by altering the number of throat sections and the valve chamber structure, resulting in three distinct releaser designs. Subsequently, a novel releaser was optimized through a combination of Fluent simulation analysis and interactive experimentation, aimed at enhancing performance and overcoming the aforementioned limitations.

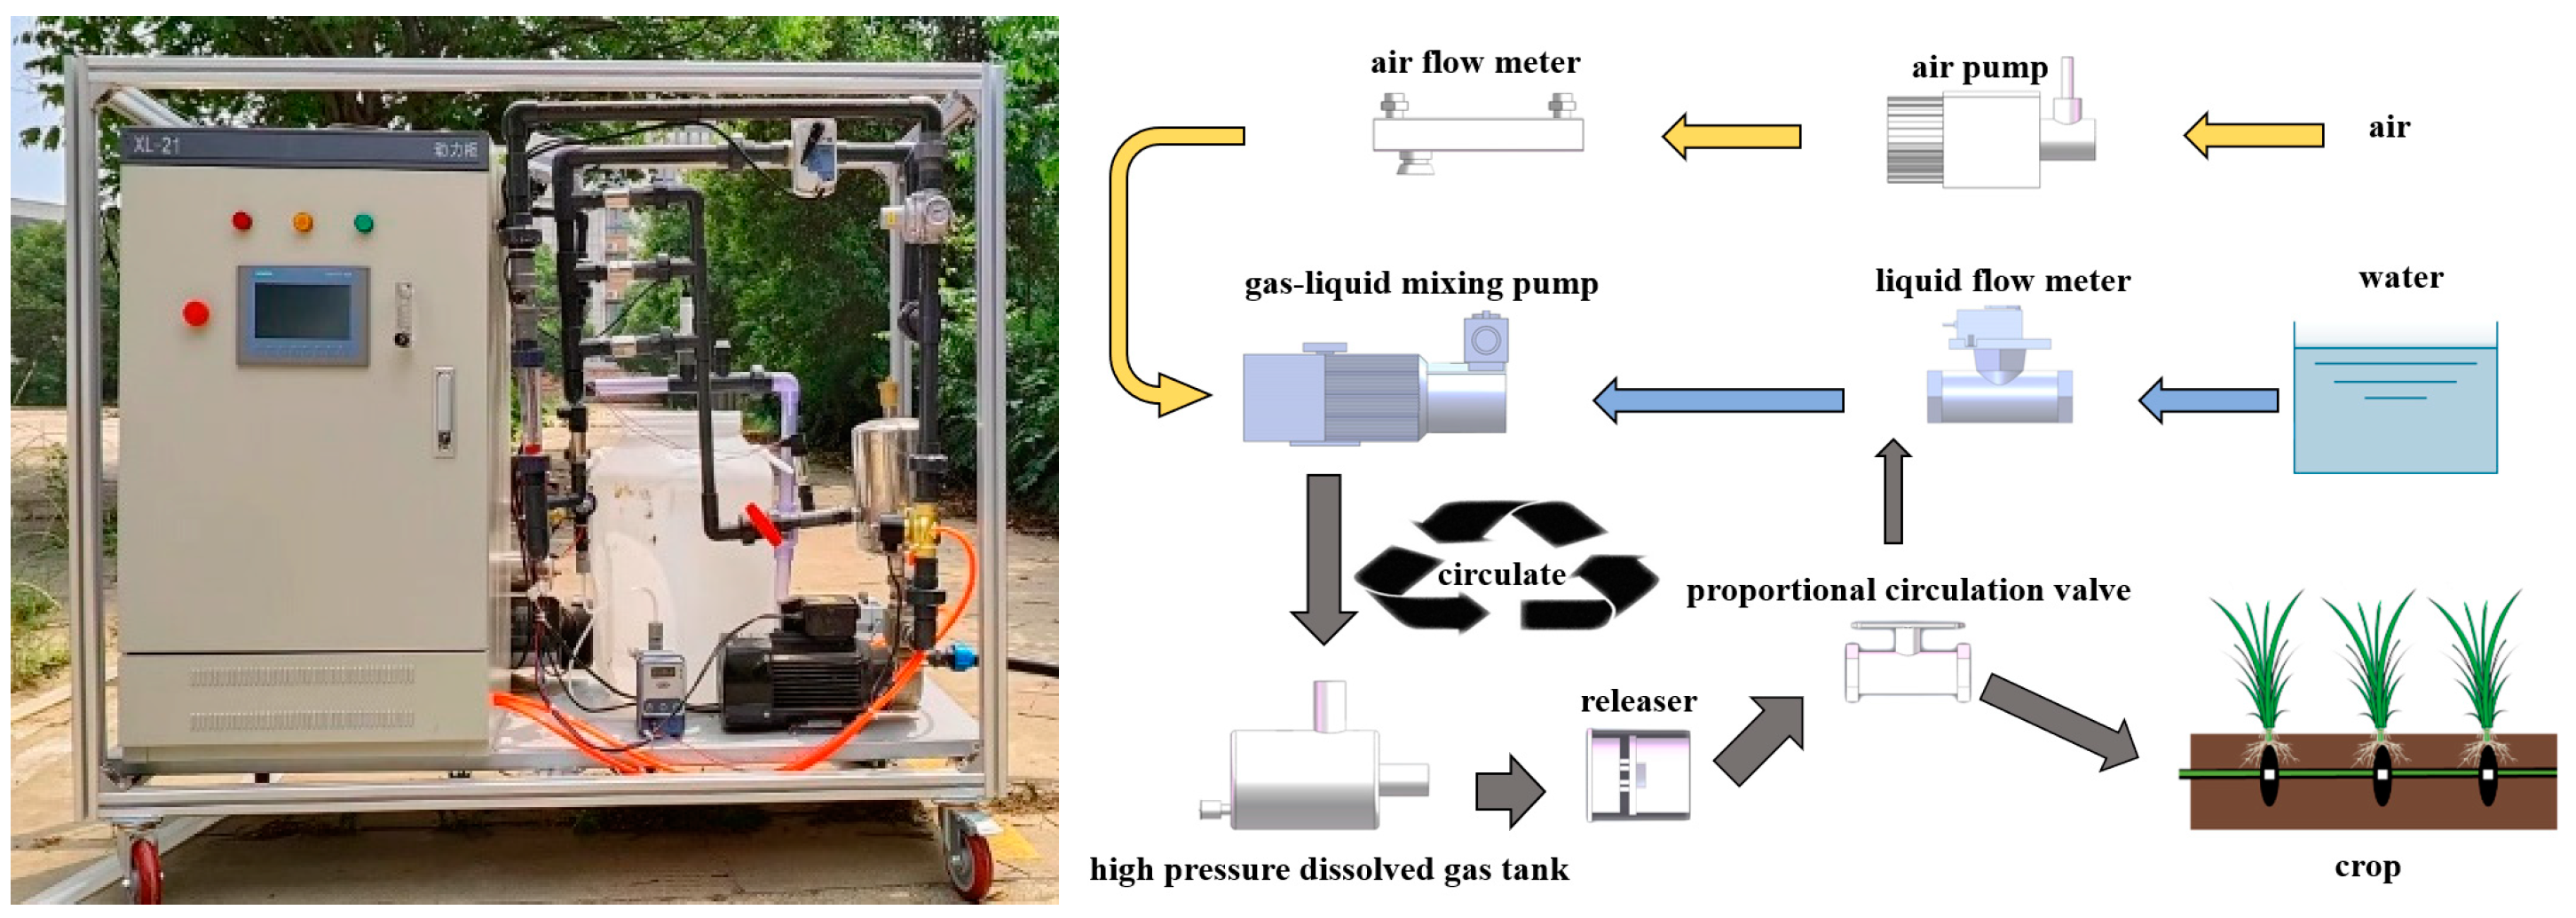
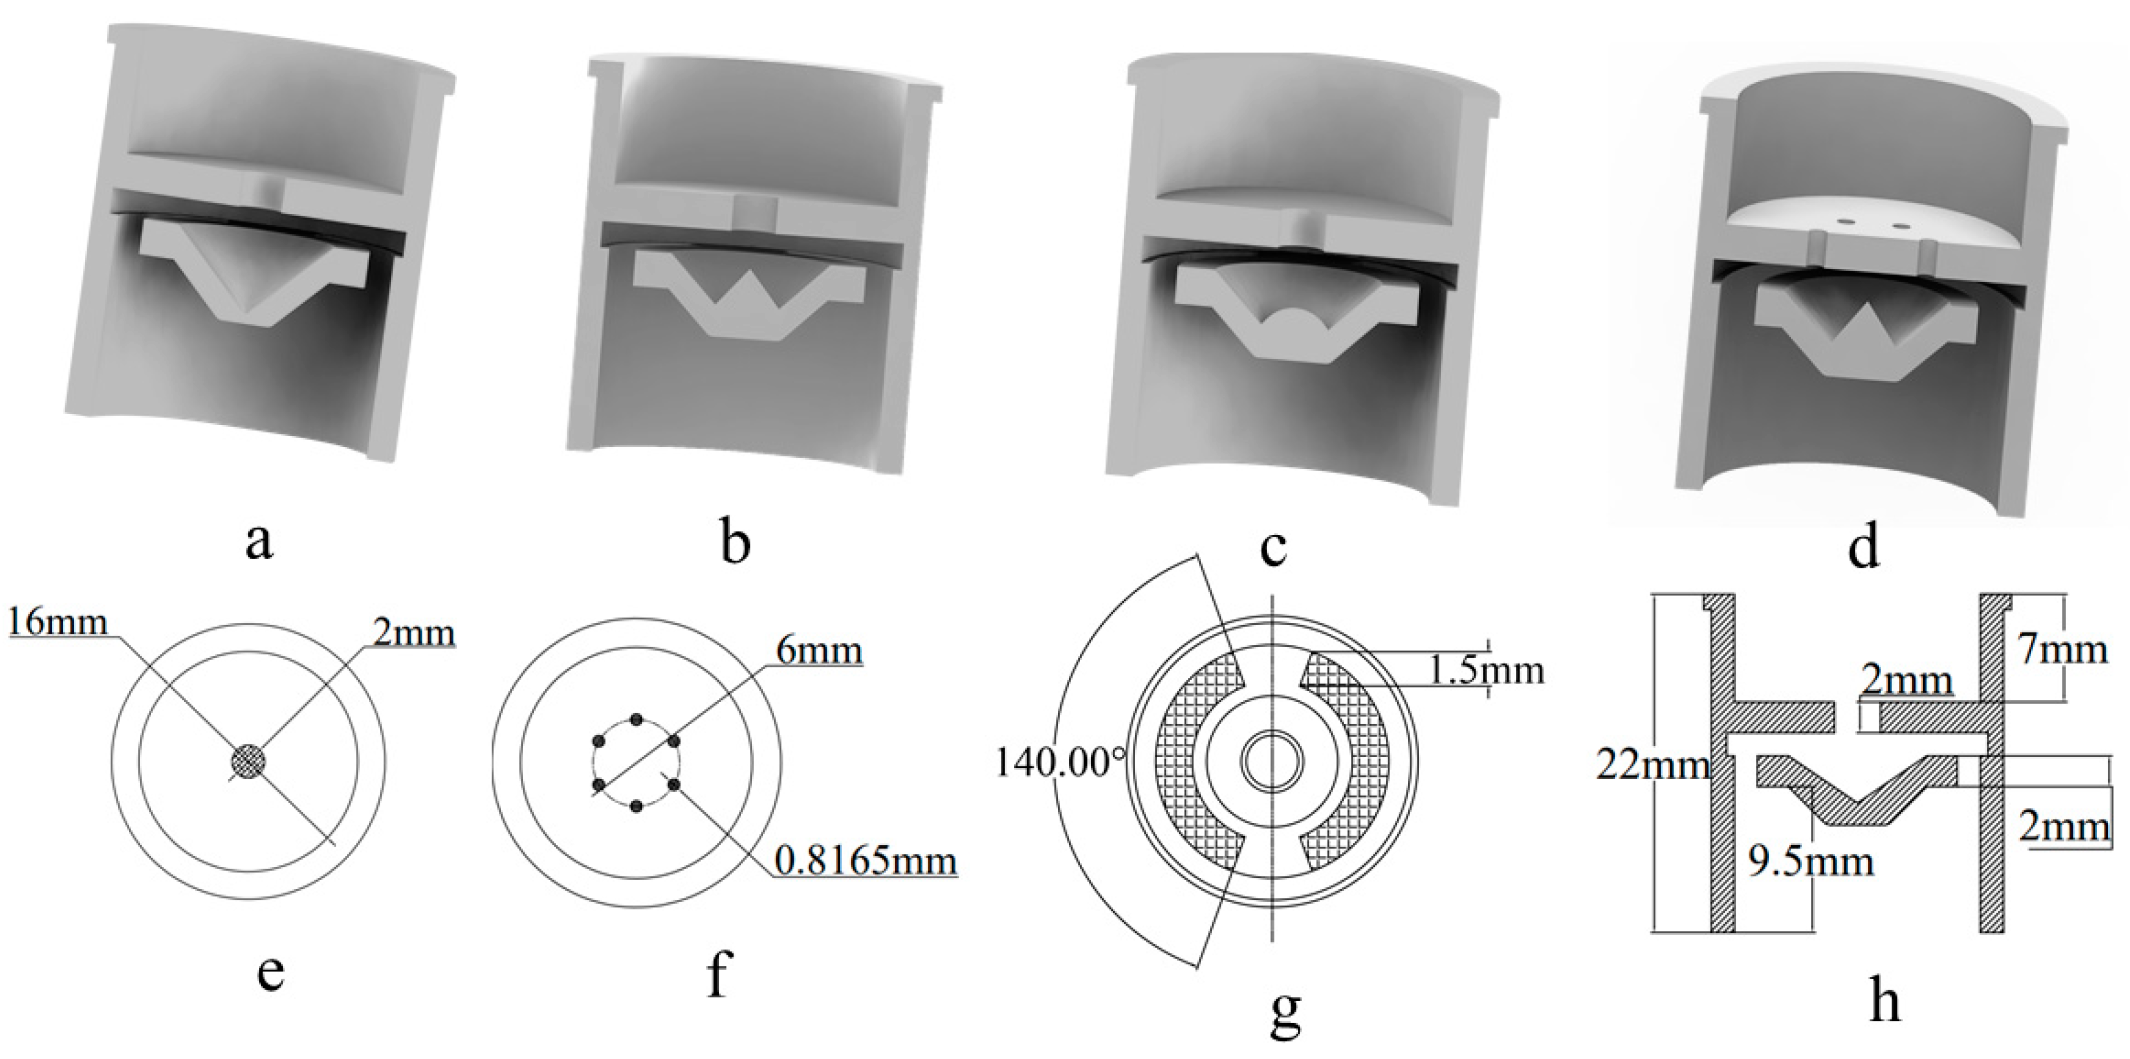
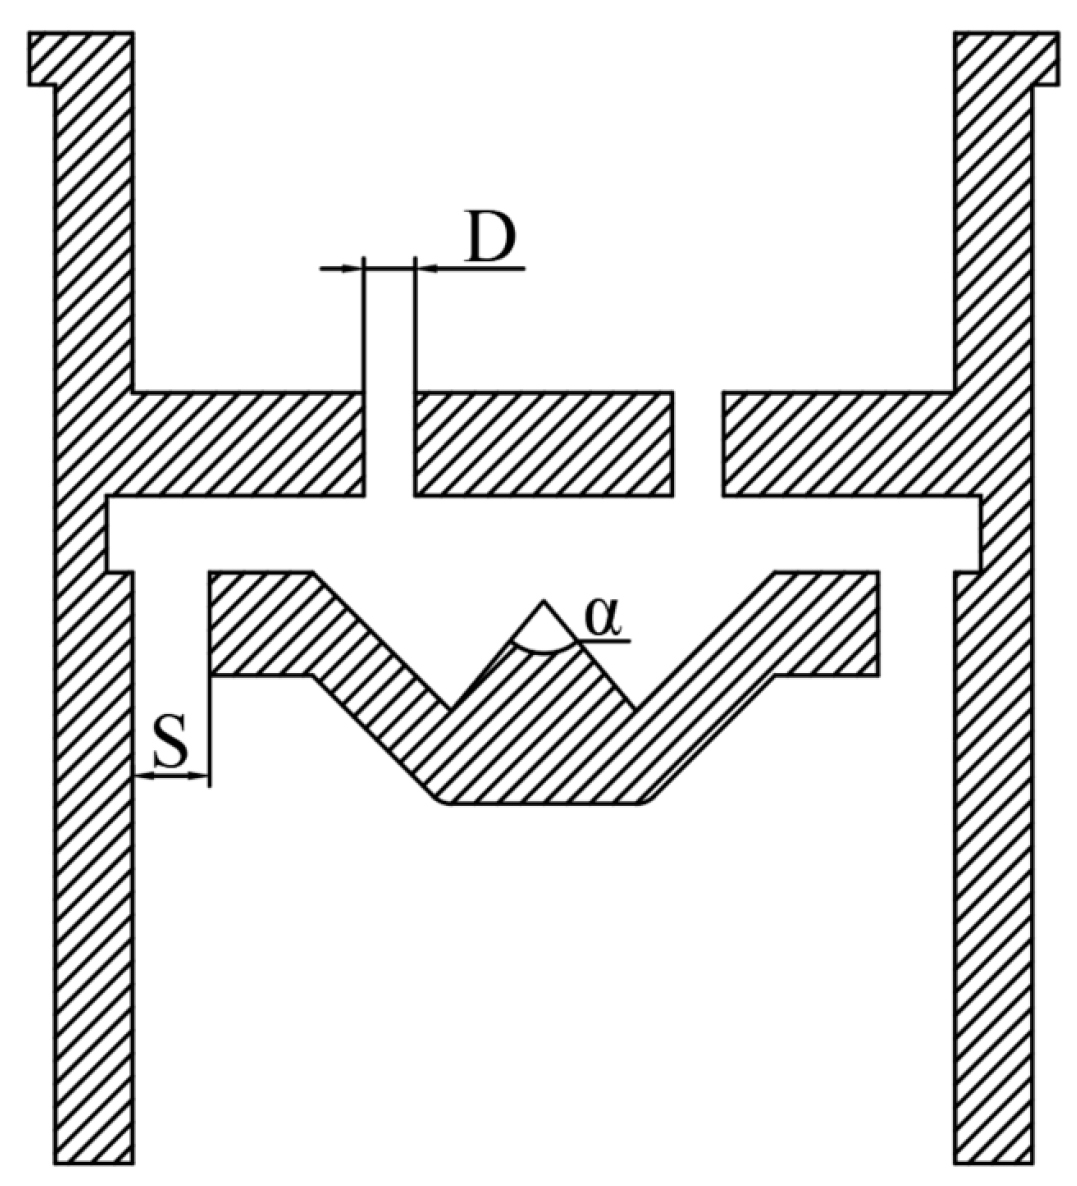
2. Materials and Methods

In light of the aforementioned issues, three types of throttling releasers with distinct internal structures—arc-shaped valve chamber, W-shaped valve chamber, and multi-throat W-shaped valve chamber—were designed based on a thorough understanding of the existing TS releaser configurations. The cross-sectional views of these designs are illustrated in Figure 2. When constructing the simulation models, the dimensions of the releasers were determined by referencing prior research, the fundamental structure of existing TS releasers, and the specific requirements of the equipment used in this experiment. Notably, all releasers maintained uniformity in external dimensions, featuring an outlet size of 1.5 mm. While the inlet diameters of the conventional TS releaser, arc-shaped valve chamber releaser, and W-shaped valve chamber releaser were standardized at 2 mm, the multi-throat W-shaped valve chamber releaser incorporated six inlets, each measuring 0.8165 mm in diameter and evenly spaced at 60° intervals. This configuration ensured that all four releasers possessed identical outlet sizes, with the total inlet area of the multi-throat releaser differing by merely 0.0008375% from the others, significantly minimizing flow field variations attributable to disparities in flow rates. This design facilitated a straightforward examination of how variations in internal structures among different releaser types impacted the flow field distribution.
During grid division, increasing the number of grids can lead to more accurate calculation results, but an excessive number of grids will waste significant computational resources, severely reducing computational efficiency. After conducting a grid independence test, the final grid parameters are presented in Table 1. For the simulation model, the mixture model, which is suitable for bubble flow in multiphase flow, was selected. Subsequently, the standard wall function and realizable k–ε turbulence model, which are appropriate for high Reynolds numbers, were employed [26,27,28,29,30]. The SIMPLE pressure-velocity coupling algorithm and steady-state flow field were used for solving, with the residual set to 10−4. The number of iterations affects the final simulation results, as more iterations generally lead to more precise results, but an excessive number of iterations can result in lengthy computational time, reducing efficiency. Through experimentation, the optimal number of iterations was determined to be 600 steps. When setting the boundary conditions, referring to the actual working conditions of the aerated irrigation system mentioned above, the pressures are set as the conditions at the inlet and outlet of the releaser, with the total inlet pressure of the releaser set to 0.5 MPa and the outlet pressure set to 0.1 MPa. The primary phase of the mixture is defined as water, and the secondary phase as air, with the volume fraction of air set to 15%. The boundary parameter settings of all simulation models remain consistent. The simulation software used is the fluent module with grid division in ANSYS 2022.

3. Simulation Analysis

Under the conditions of maintaining the same inlet pressure, outlet pressure, and air volume fraction, simulation analyses were conducted on releasers with different structures, and changes in the pressure field, velocity field, turbulent energy field, and gas phase distribution within the releasers were observed. The impacts of different structures on the performance of the releasers were analyzed. During the simulation process, the residual error of the model converges stably. Meanwhile, by comparing the outlet section flow rate in the simulation results with the actual flow rate, the error is within 5%, indicating that the simulation results have high credibility and good accuracy. In the following analysis, in order to facilitate a comprehensive observation of the fluid distribution within the releaser, the YZ cross-sectional plane passing through its central axis was selected for detailed discussion.

3.1. Analysis of Pressure Field Variations

The pressure contour maps inside the four different types of releasers, as shown in Figure 3, reveal the pressure variation trends of high-pressure fluids within releasers of various structures. It can be seen that as the high-pressure fluid enters the releaser from the inlet the pressure drops sharply when passing through the throat, even forming negative pressure in local areas. After entering the chamber, the pressure fields of releasers with different structures undergo different changes. For the releaser with a traditional structure, its minimum cross-sectional pressure reaches −14,569.13 Pa, significantly lower than the other three types of releasers. However, at the sharp corners of the chamber, the pressure increases rapidly, forming a large high-pressure area with a pressure exceeding 400,000 Pa. This uneven pressure distribution is not conducive to the pressure reduction and energy dissipation of high-pressure fluids [31]. The releaser with an arc-shaped chamber structure has a minimum cross-sectional pressure of −36,693.79 Pa. Although there is also a high-pressure area at the top of the chamber, compared to the traditional structure, the range of the high-pressure area is reduced. Meanwhile, the releasers with W-shaped chamber structure and multi-throat structure have minimum cross-sectional pressures of −51,530.33 Pa and −48,101.56 Pa, respectively, and the overall pressure field distribution is relatively uniform, which is more conducive to generating uniformly sized microbubbles [32], thus improving the overall performance of the releaser. From this perspective, the W-shaped chamber is more beneficial to the uniform distribution of the flow field pressure inside the releaser.

3.2. Analysis of Velocity Variations

As depicted in Figure 4, the speed variations within the releaser reveal a distinct pattern. All designs of the releasers exhibit a significant increase in velocity within the throat section, reaching a peak speed exceeding 33 m/s. In the velocity field of the traditional releaser, it is observable that the high-pressure fluid directly impacts the sharp corners at the bottom of the chamber after traversing the throat. It then deflects along the chamber walls, forming vortices near the gap, before entering the gap and ultimately exiting through the outlet. In contrast, the high-pressure fluid in the arc-shaped chamber releaser initially reaches the top of the chamber after passing through the throat. It subsequently diverges along the sidewalls of the arcuate aperture, impacting the sharp corners at the chamber bottom, and following a similar flow path to the traditional design. In the W-shaped chamber releaser, the high-pressure fluid initially strikes the inner walls of the W-shaped chamber upon passing through the throat. Upon changing direction, it impacts the bottom corners again, deflects along the chamber sidewalls, enters the gap, and finally exits through the outlet. However, the flow path in the multi-throat releaser is more intricate. After passing through the throat, the high-pressure fluid impacts the sidewalls of the chamber, redirecting itself and then impacting the inner walls. A portion of the fluid directly deflects into the gap and exits, while another portion collides with newly entering high-pressure fluid, entering a cycle of collisions. This results in the formation of two vortices between the inner and sidewalls of the chamber, as well as near the gap in the chamber.
By comparing the velocity-vector diagrams of these four designs, it is evident that the arc-shaped chamber and W-shaped chamber releasers do not form significant vortex flows within the chamber, which is disadvantageous for pressure reduction and energy dissipation of the high-pressure fluid [33]. Conversely, the multi-throat releaser exhibits multiple collisions of the fluid within the chamber, coupled with the formation of two vortex flows within the chamber, indicating its superior performance in pressure reduction and thus favoring the generation of microbubbles.

3.3. Analysis of Turbulent Kinetic Energy Variation

The turbulent energy distribution inside the releaser, as illustrated in Figure 5, reveals a concentrated turbulent energy field within the valve chamber. Notably, the maximum and average turbulent energies of the multi-throat releaser are significantly greater than those of the other three structural types. Inside the valve chamber, the multi-throat releaser exhibits a more extensive high-turbulence energy region, particularly evident when compared to the other three structures. In contrast, the single-throat W-chamber releaser does not demonstrate a significant improvement over the traditional releaser. The magnitude of turbulent energy directly influences the pressure reduction and energy dissipation of high-pressure fluids. Specifically, a higher turbulent energy correlates with a wider effective space for pressure reduction and energy dissipation of high-pressure fluids. Moreover, a more uniform distribution of the turbulent energy field leads to better microbubble formation [34,35]. Consequently, the multi-throat W-type releaser is more conducive to the generation of microbubbles.

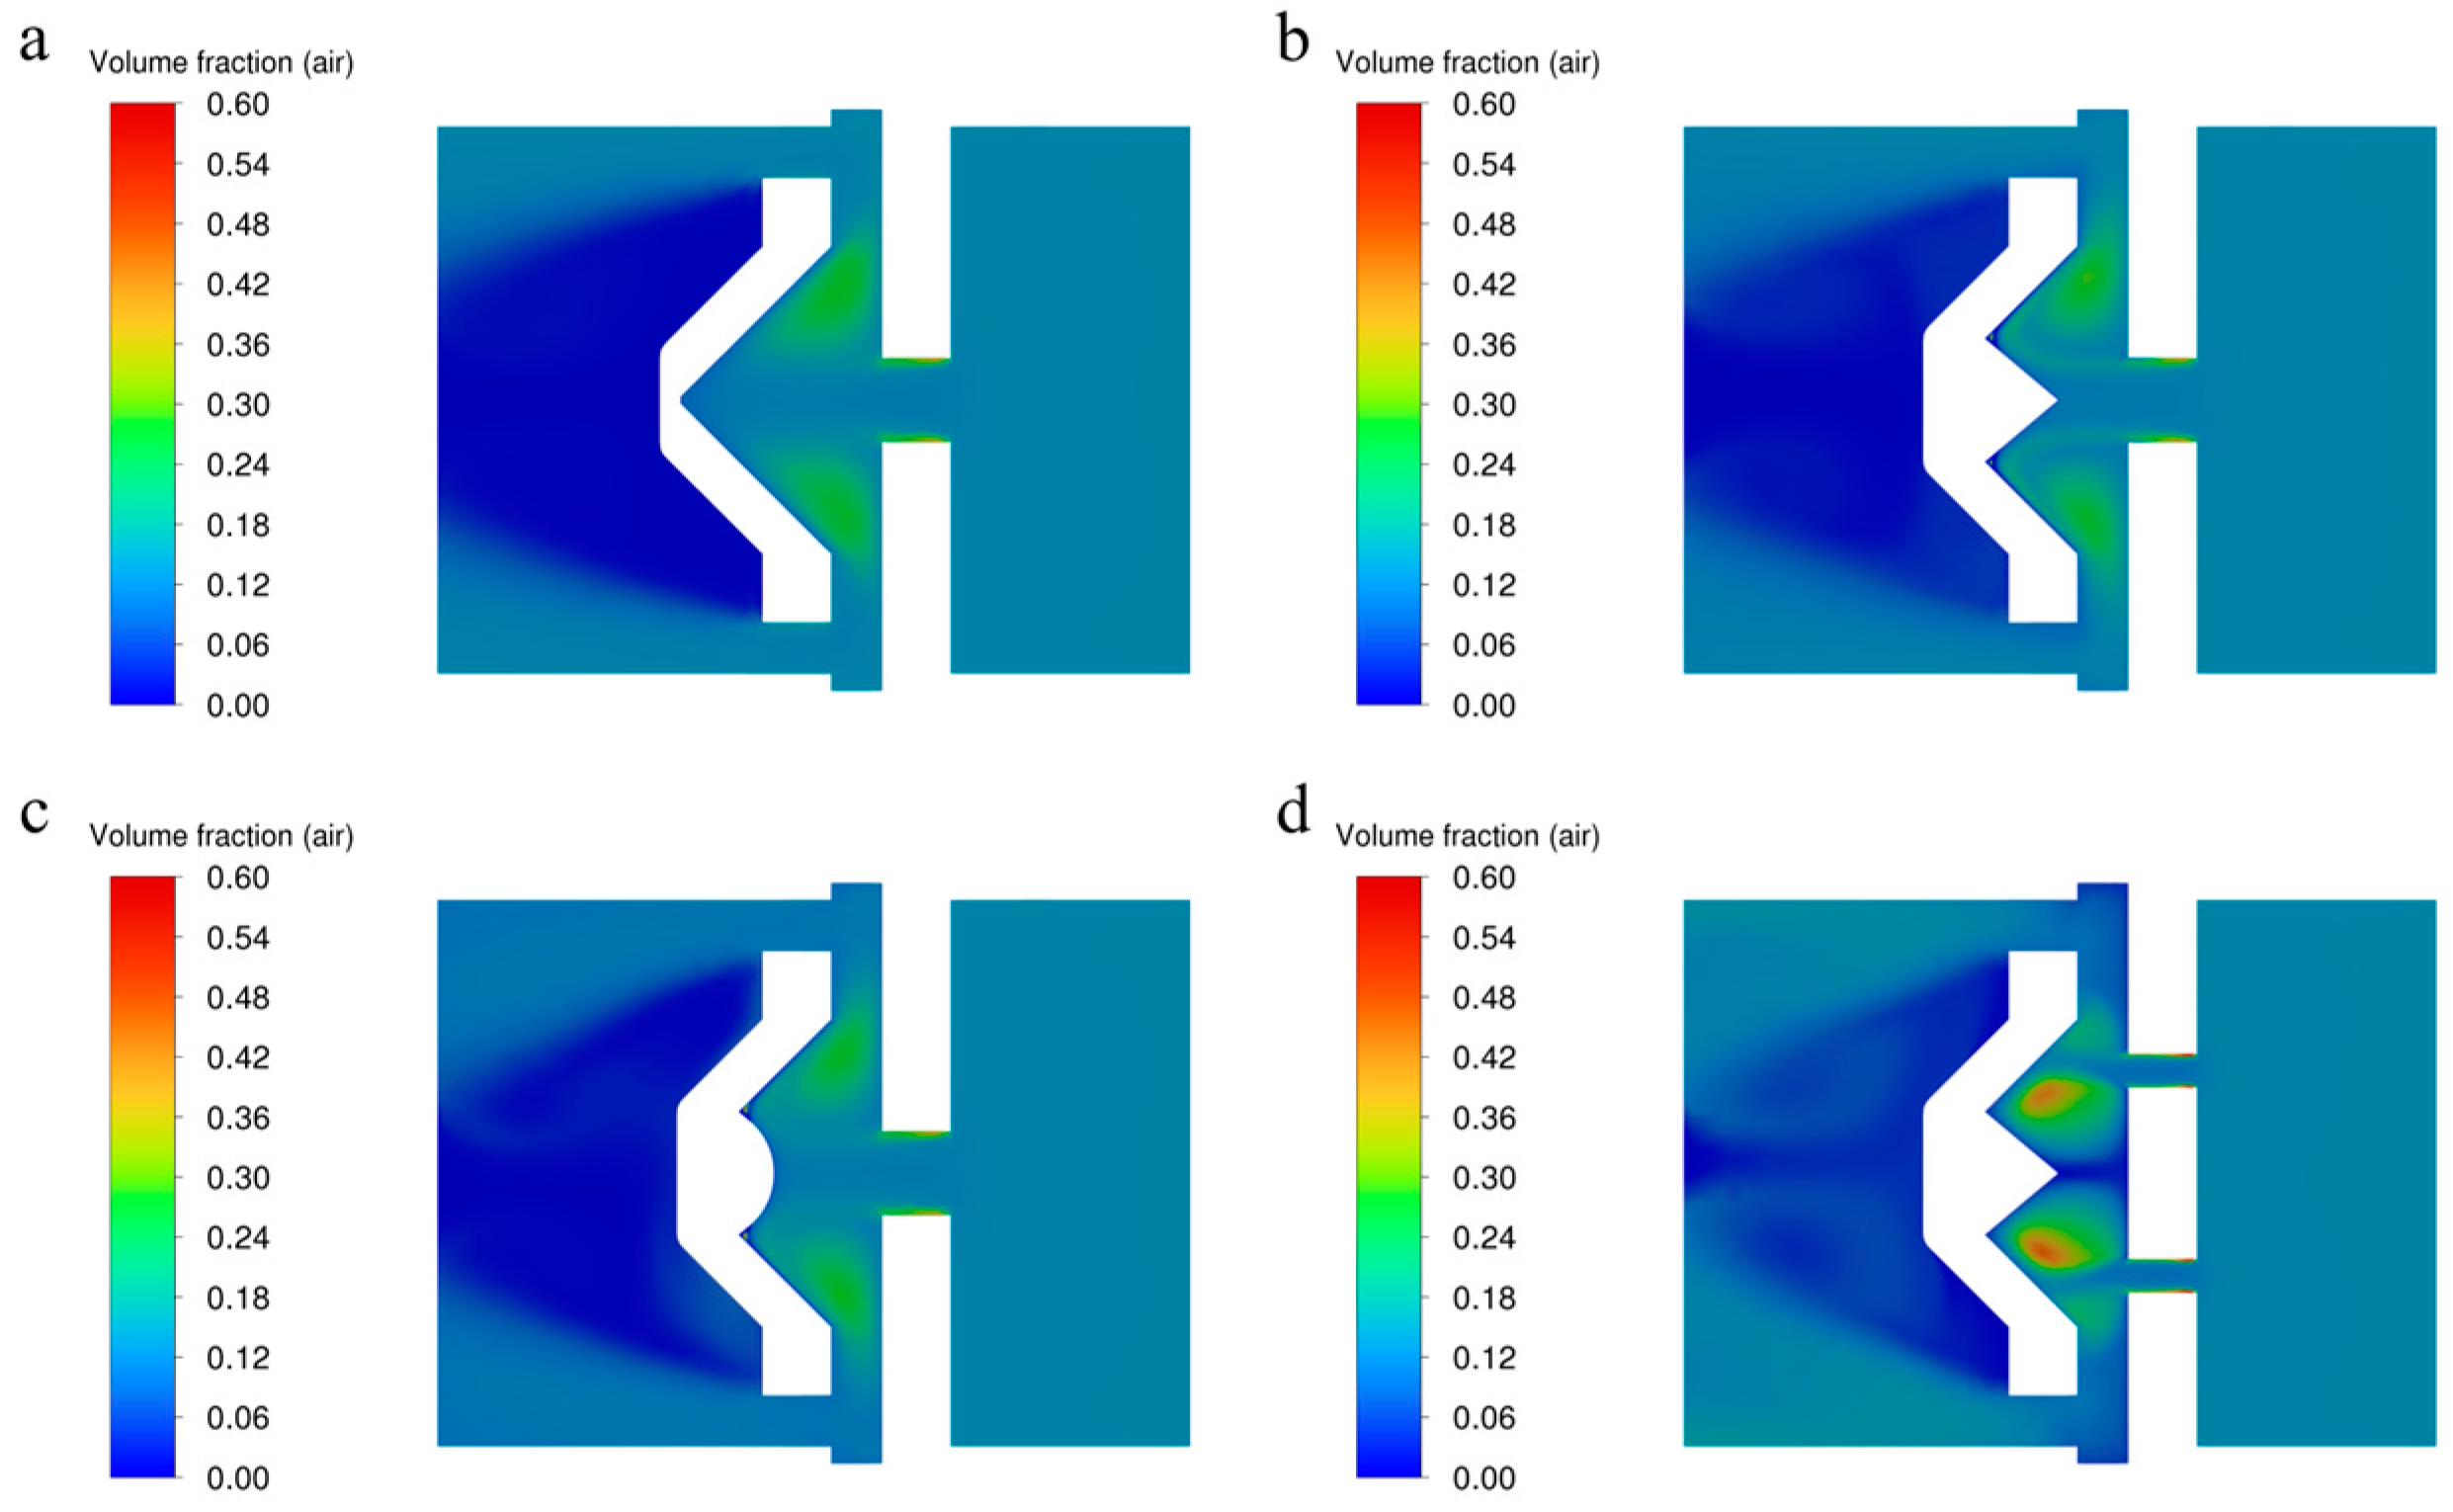
3.4. Analysis of Air-Phase Distribution

As depicted in Figure 6, the air-phase distribution inside the releaser reveals that the area with the highest air content in the valve chamber aligns precisely with the vortex flow and regions of maximum turbulent energy in the turbulent kinetic energy contour, further validating that a higher turbulent energy correlates with a more thorough decompression and energy dissipation process of the high-pressure fluid. There is a distinct trend observed in the air-phase distribution contour maps of releasers with different structures: the closer to the sidewall of the outlet, the higher the proportion of air. By comparing the air-phase distribution contour maps of the four structures, it can be seen that the air-phase distribution at the outlet of the single-throat tube releaser is extremely uneven, exhibiting a characteristic where the air content increases towards the wall surface and decreases towards the center of the pipeline. In contrast, the air-phase distribution at the outlet of the multi-throat tube W-chamber releaser is more balanced, indicating that this design enables a more uniform distribution of high-pressure fluid entering the valve chamber, thereby maximizing the function of the valve chamber.
Through simulation analyses of four different types of releasers, their internal pressure, velocity, turbulent flow field, and air-phase distribution characteristics under identical boundary conditions were comparatively evaluated. The results indicate that the multi-throat W-chamber releaser exhibits significant advantages in terms of pressure field, velocity field, turbulent energy field, and air-phase distribution. Specifically, it achieves more thorough internal energy dissipation, conducive to the generation of uniformly sized and densely packed microbubbles. Furthermore, the multi-throat W-chamber releaser possesses the highest air proportion at the outlet and the lowest maximum air velocity, suggesting optimal air release performance and minimal probability of microbubble coalescence. In contrast, traditional releasers, arc-shaped chamber releasers, and single-throat W-chamber releasers exhibit uneven air-phase or turbulent-energy distributions, significantly affecting their performance. In summary, the multi-throat W-chamber releaser outperforms other structural types in overall performance.

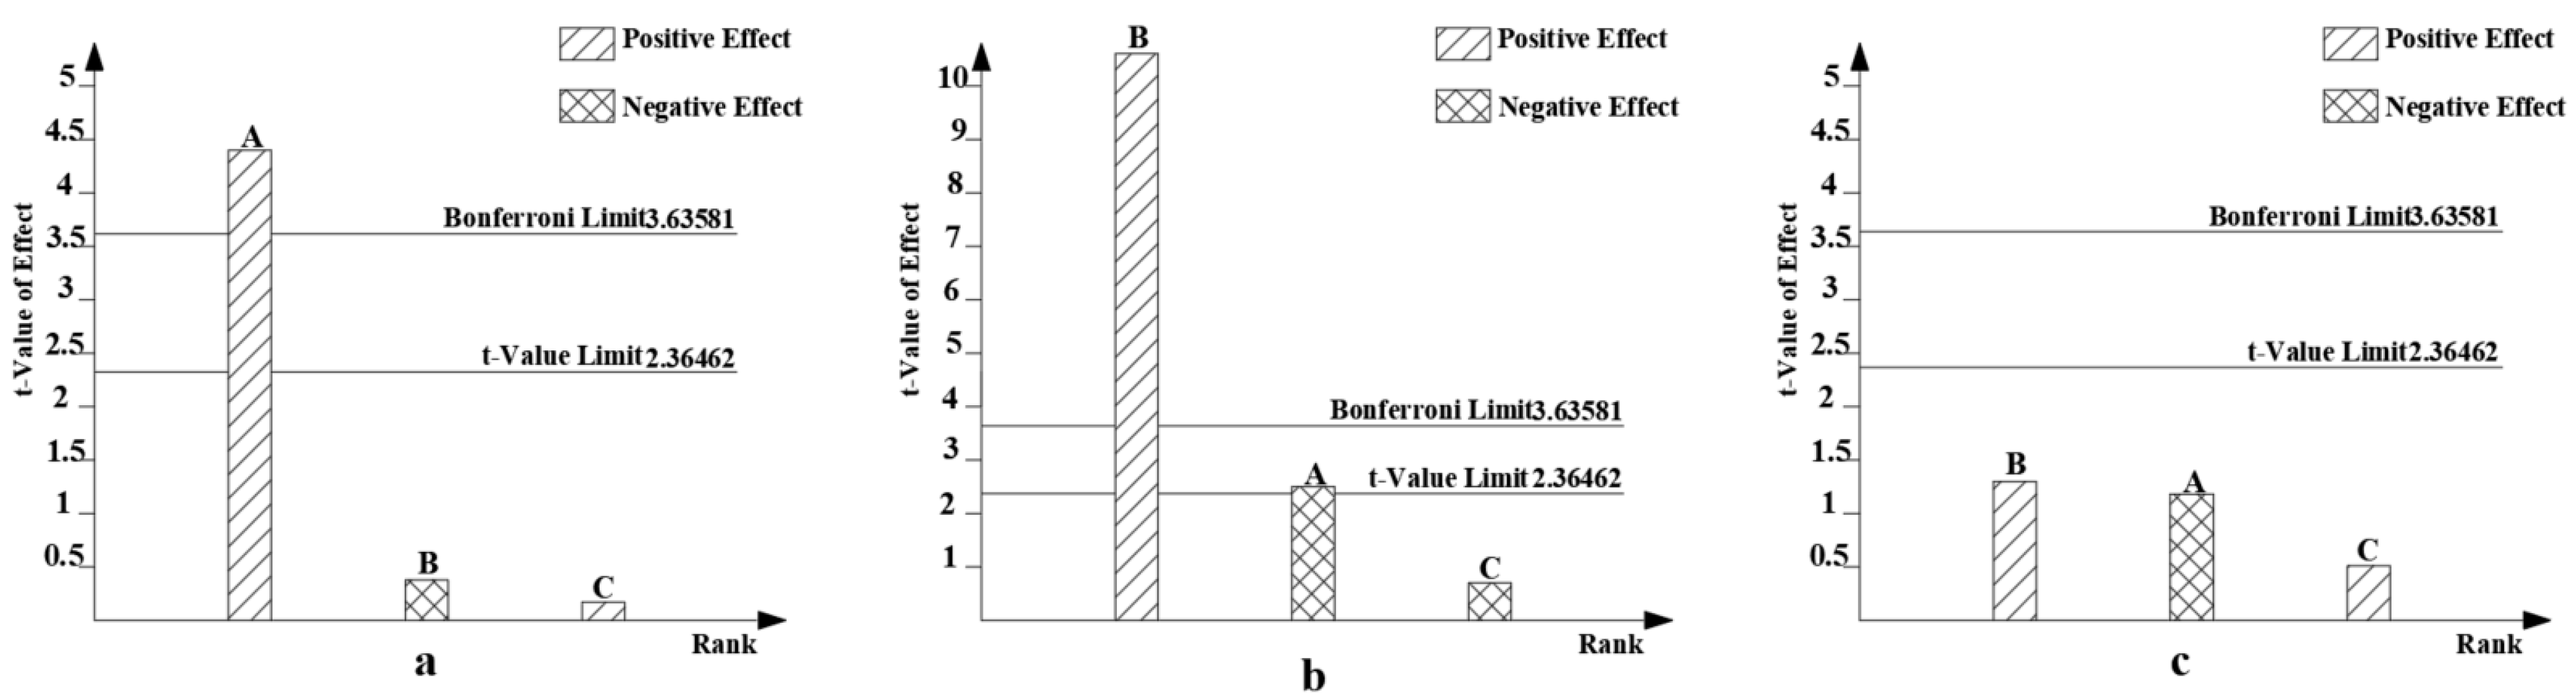
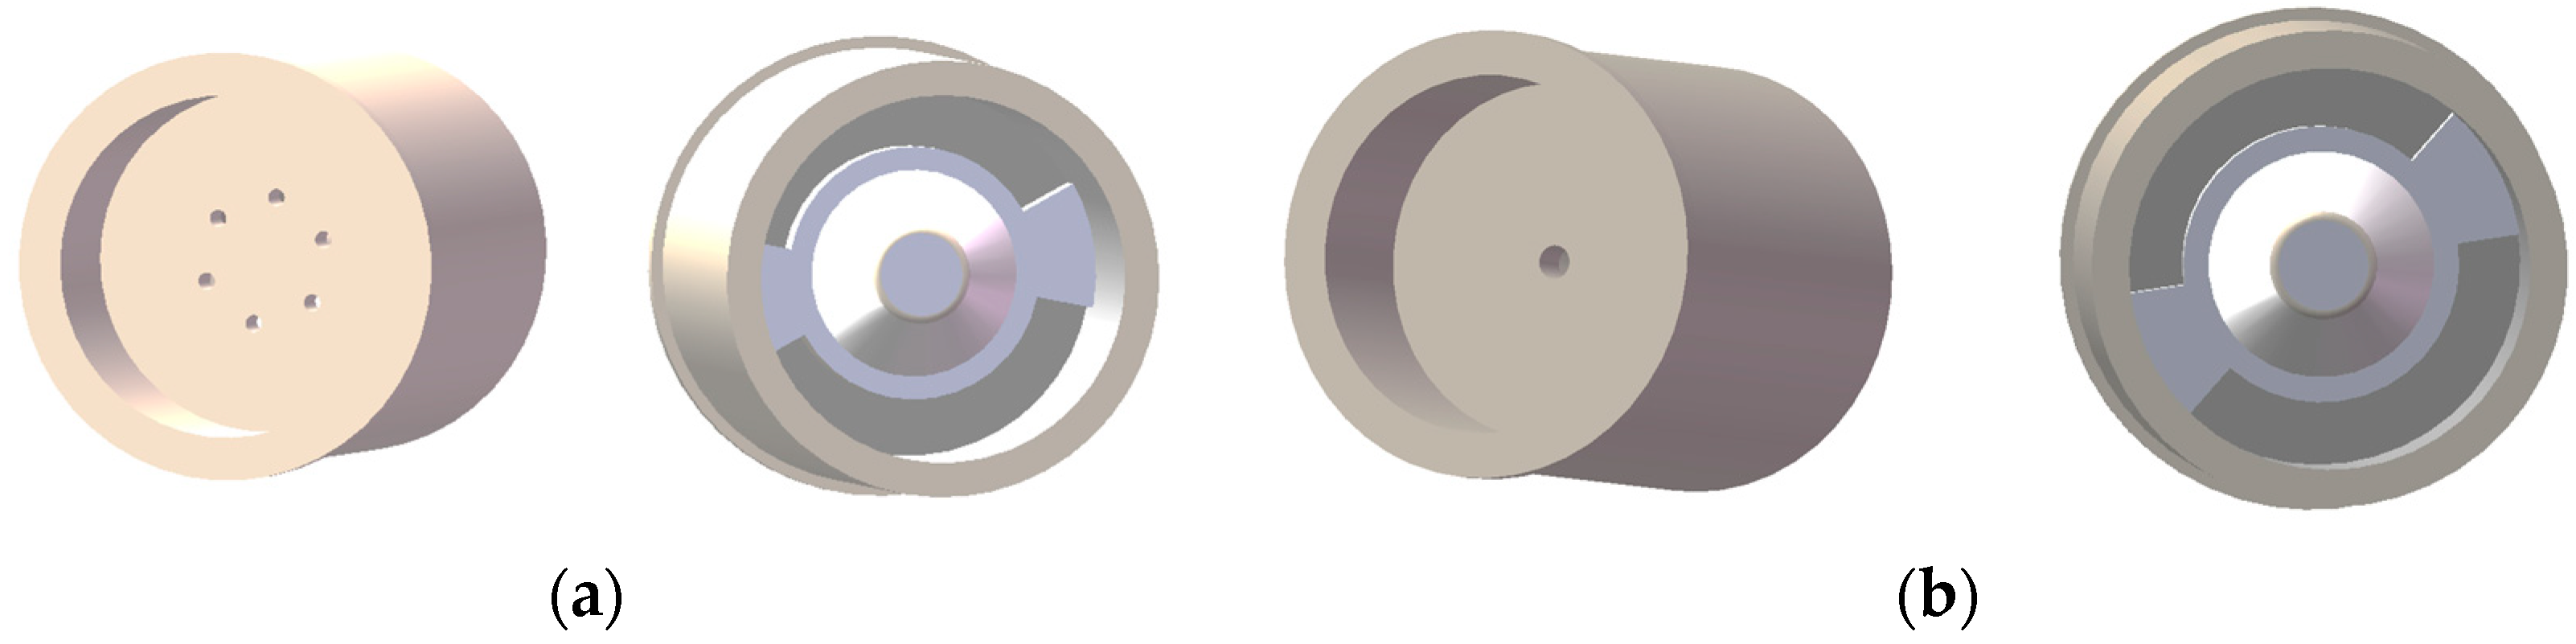
4. Simulation and Optimization of the Multi-Throat W-Chamber Type Releaser

4.1. Simulation and Interactive Experiment of Multi-Throat W-Chamber Type Releaser

In the multi-throat W-chamber type releaser, high-pressure fluid enters the chamber through the throat tubes, forming a turbulent flow field in the chamber. The diameter of the throat tubes, the angle of the chamber, and the outlet size of the releaser directly affect its performance. To investigate the impact of these three factors on the releaser’s performance, CFD simulation and interactive experiments were conducted in this section. The experimental design and results are shown in Table 2. The schematic diagram of the releaser’s throat tube diameter (D), chamber angle (α), and outlet size (S) is illustrated in Figure 7. The grid division and boundary condition settings during the simulation were the same as those mentioned above. The experiments recorded the air-phase proportion at the outlet cross-section, the turbulence intensity at the outlet cross-section, and the turbulence intensity within the entire releaser as the key evaluation indicators. The turbulence intensity at the outlet cross-section affects the coalescence of the generated microbubbles during their subsequent movement. The turbulence intensity within the entire releaser reflects the total turbulent energy in the spatial region of the releaser. The stronger the turbulence intensity within the releaser, the better its air release capability. The air-phase distribution at the outlet cross-section directly reflects the releaser’s performance in generating microbubbles [36,37,38,39].
To understand the impact of chamber angle, throat diameter, and outlet size on the performance of the releaser, a Plackett–Burman analysis was conducted on the experimental data. The analysis results are presented in Table 3 and Figure 8. In the ANOVA table, A represents the outlet size, B represents the throat diameter, and C represents the chamber angle. According to the ANOVA table, the throat diameter has a significant impact on the average turbulent energy and air fraction at the outlet cross-section of the releaser, while the outlet size has a significant impact on the average air fraction at the outlet cross-section.
The Pareto chart shows the influence of each factor on the investigated items. In the chart, a, b, and c represent the influence of the three respective factors on the average air fraction at the releaser outlet surface, the average turbulent kinetic energy at the releaser outlet surface, and the overall turbulent kinetic energy within the releaser, respectively. The X-axis denotes the three distinct influencing factors, while the Y-axis quantifies the magnitude of the influence. A higher Y-value indicates a more severe impact. When the influence value surpasses the t-value limit, it signifies a statistically significant influence. Furthermore, exceeding the Bonferroni limit denotes an extremely significant influence. It can be seen from the chart that only the outlet size has a significant positive impact on the average air fraction at the outlet cross-section, indicating that the larger the outlet size, the higher the air fraction at the outlet cross-section. The average turbulent energy at the outlet cross-section is influenced by both the throat diameter and the outlet size, with the change in throat diameter having a much higher impact on the average turbulent energy intensity than the change in outlet size.
The turbulent flow distribution at the outlet cross-section of the releaser may cause the aggregation of microbubbles that have already been generated. Therefore, when designing the releaser, the turbulent energy at the outlet cross-section should be minimized as much as possible. In this regard, the change in throat diameter has a negative impact on the overall performance of the releaser. However, the overall turbulent energy inside the releaser is not significantly influenced by the changes in chamber angle, throat diameter, or outlet size.
To further enhance the design of the multi-throat W-chamber type releaser and investigate the impact of variations in venturi diameter and outlet size on the turbulence kinetic energy at the releaser’s outlet, a response surface interactive analysis was performed on the experimental data. The variance analysis table and response surface plot are presented in Table 4 and Figure 9, respectively, with A representing the outlet size and B representing the venturi diameter in the variance analysis table. Overall, a larger venturi diameter and a smaller outlet size lead to higher turbulence intensity at the outlet cross-section of the releaser. However, as the venturi diameter decreases, the influence of outlet size variations on the turbulence intensity at the outlet cross-section diminishes. Consequently, reducing the venturi diameter and increasing the outlet size can effectively mitigate the turbulence intensity at the outlet cross-section of the releaser. Nevertheless, in practical applications, an excessively small venturi diameter can significantly compromise the irrigation flow rate, thereby affecting irrigation efficiency. Therefore, considering the balance between irrigation efficiency and releaser performance, the optimized multi-venturi releaser was determined to have a venturi diameter of 1 mm and an outlet size of 2 mm. Comparing the results from the response surface analysis, the turbulence intensity at the outlet cross-section of this configuration is near the minimum critical value.
Based on the previous two rounds of analysis, it seems that changes in the valve chamber angle do not significantly affect the performance of the releaser. However, from the simulation results of four different types of releasers, the valve chamber angle plays a non-negligible role in altering the flow field division by changing the valve chamber structure. The valve chamber can make the turbulent flow field distribution inside the releaser more uniform, thereby promoting more homogeneous mixing of the fluid entering the releaser [40,41,42]. To further analyze the impact of valve chamber angle changes on the degree of fluid mixing uniformity, based on the optimization results of the inlet and outlet dimensions of the multi-venturi releaser in the previous section, the venturi diameter of the multi-venturi releaser is set to 1 mm, and the outlet size is 2 mm. The valve chamber angles of the releaser are varied to 60°, 70°, 80°, 90°, 100°, and 110°, and Fluent simulations are conducted to deeply explore the influence of valve chamber angle changes on the air-phase distribution and pressure changes inside the releaser.

4.2. Analysis of Air-Phase Distribution Cloud Chart Inside the Releaser

Based on the air-phase distribution clouds shown in Figure 10, the air-phase distribution inside the releaser remains largely consistent across different valve chamber angles. However, upon closer inspection, it is noticeable that the air concentration reaches its peak near the throat inlet, close to the throat wall, as well as at the upper and lower sections of the chamber. For releasers with valve chamber angles of 60°, 70°, and 110°, there are areas near the outlet cross-section with relatively low air content, indicating uneven air-phase distribution. In contrast, releasers with valve chamber angles of 90° and 100° exhibit a more uniform air-phase distribution near the outlet cross-section, though there are still some areas on the upper right side of the outlet without air presence. Comparatively, the releaser with a valve chamber angle of 80° demonstrates the most uniform air-phase distribution across the entire outlet area.

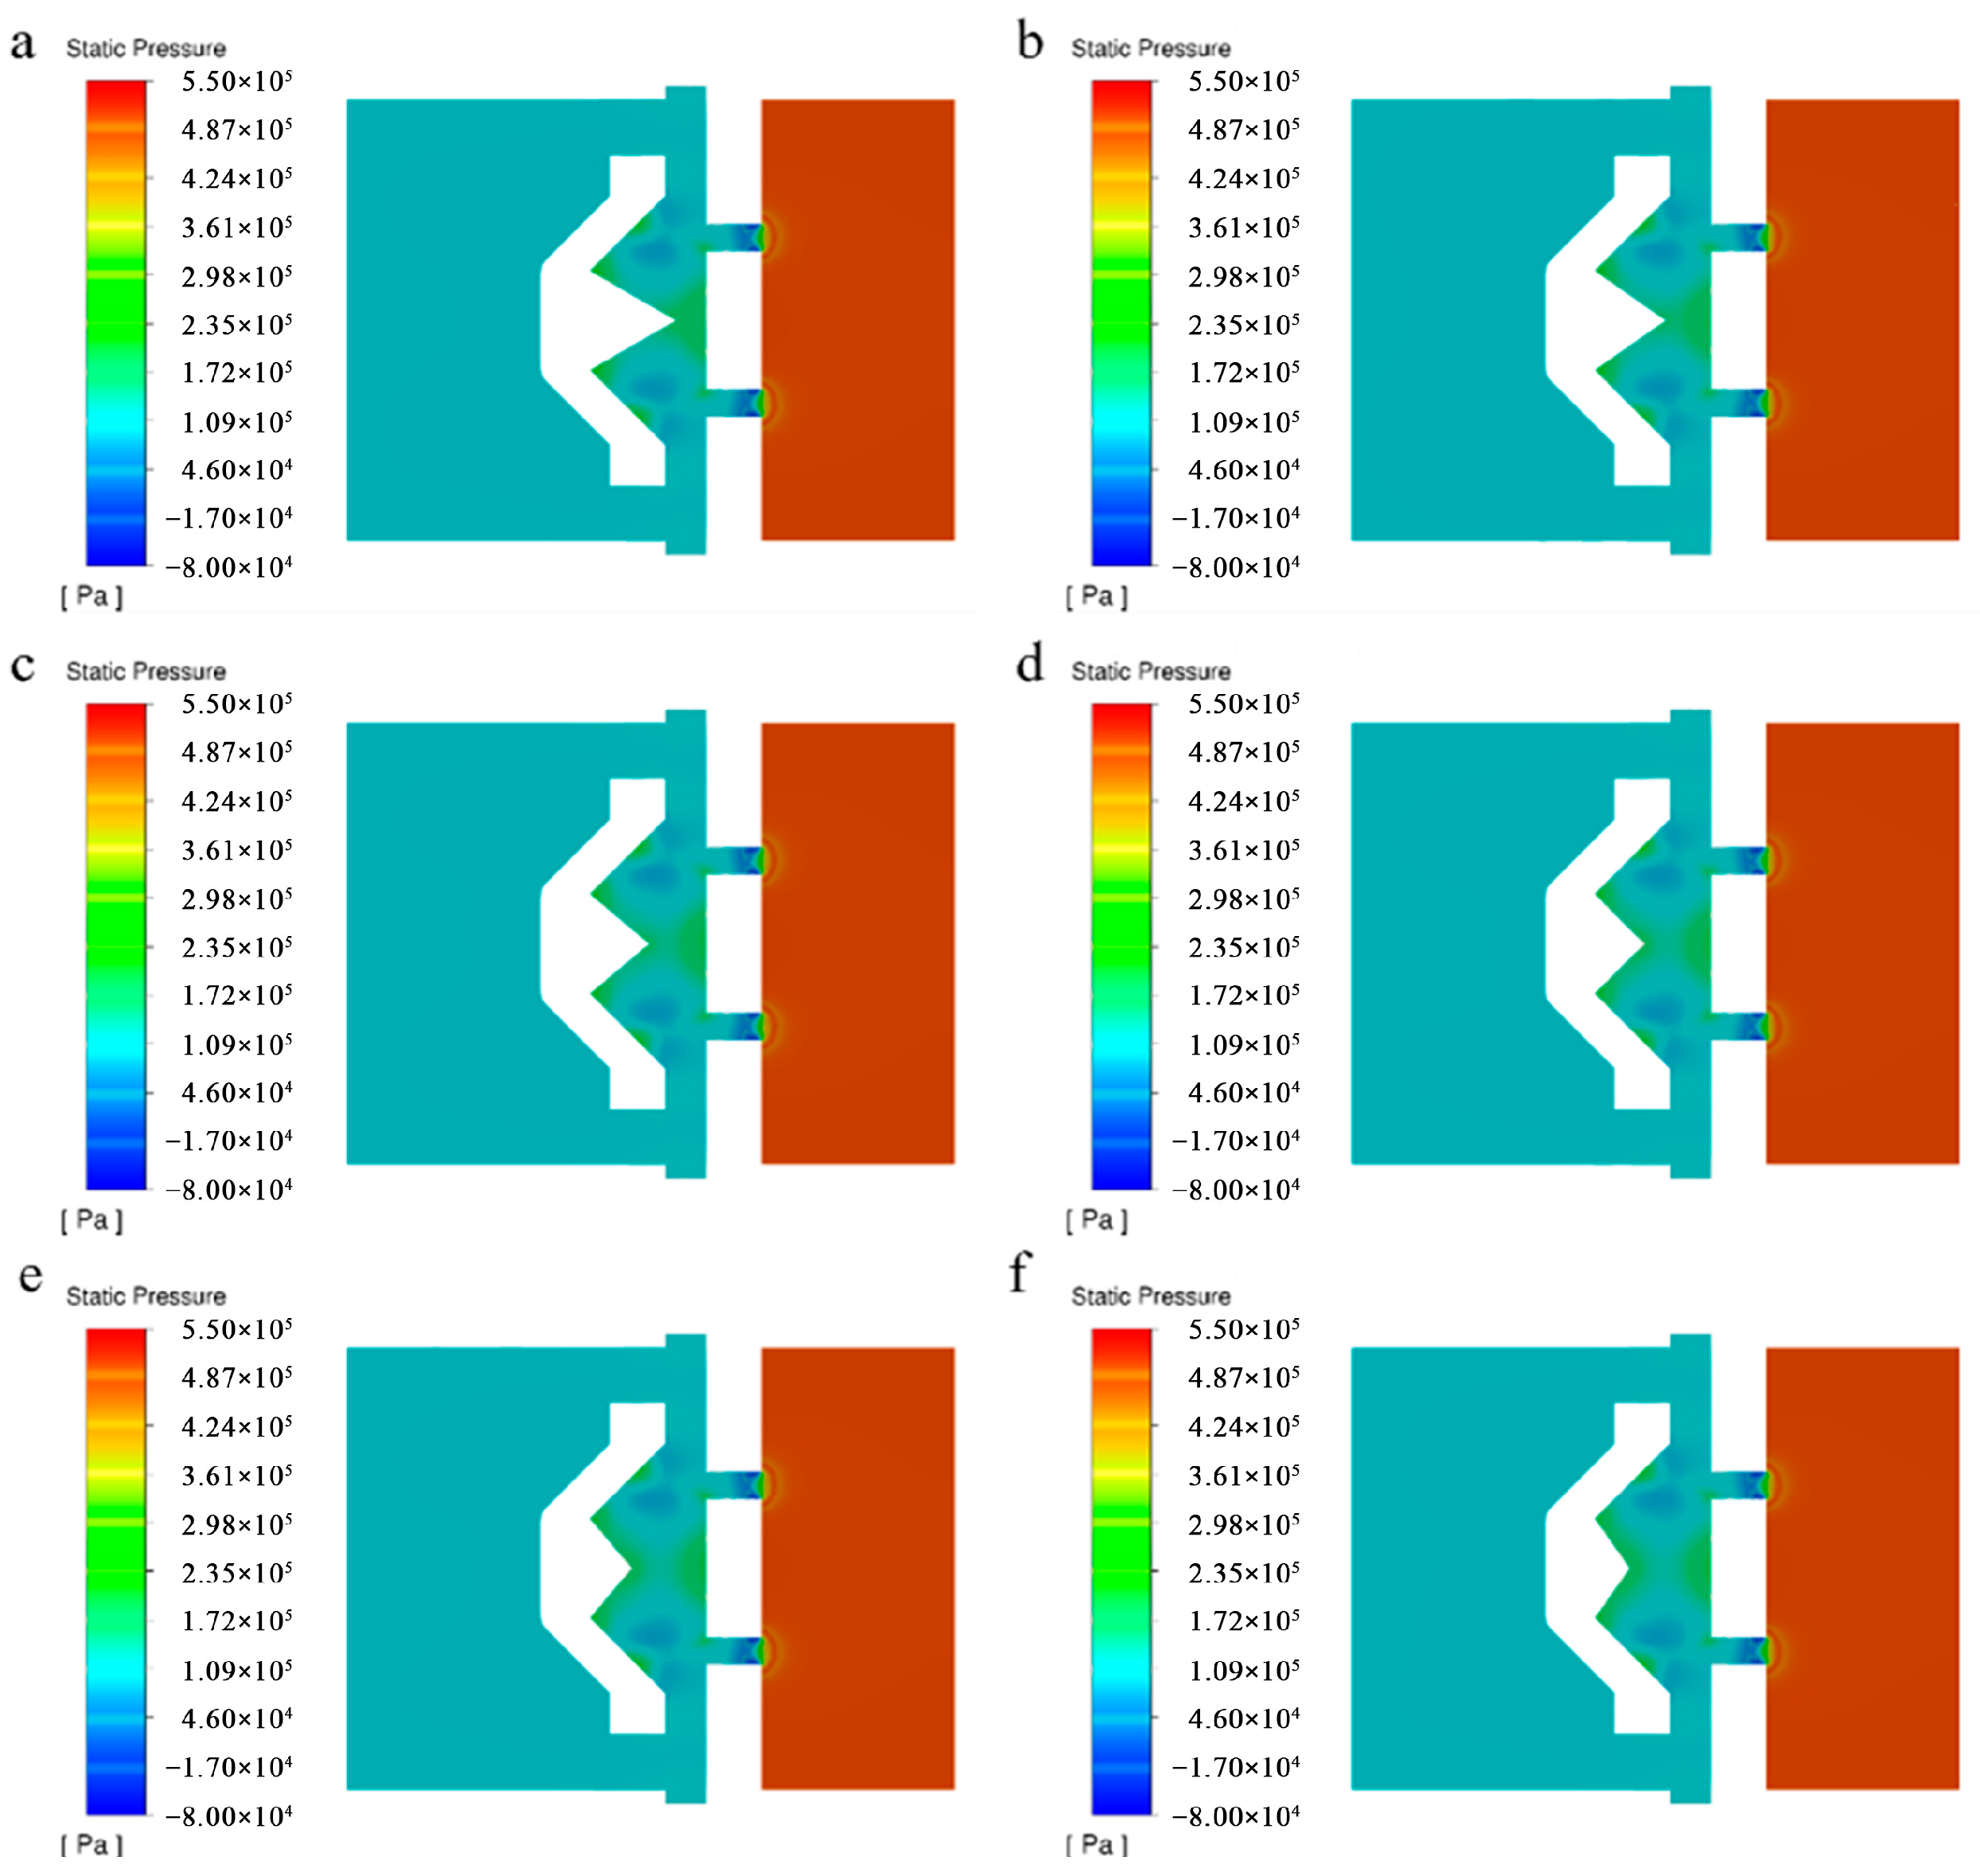
4.3. Analysis of Pressure Variation Cloud Maps within the Releaser

In the pressure cloud maps shown in Figure 11, the variation trend of the pressure field is basically consistent within the multi-venturi releasers with different valve chamber angles. There exists a negative pressure area right at the position where the fluid enters the venturi, and two separate low-pressure areas appear at the upper and lower positions inside the valve chamber. However, variations in the valve chamber angle still have an impact on the internal pressure difference within the multi-venturi releaser. Specifically, when the orifice chamber angle is 100°, the pressure difference within the multi-venturi releaser is the smallest, reaching 542,047.46 Pa. In contrast, when the orifice chamber angle is 80°, the pressure difference reaches its maximum value of 552,404.43 Pa.

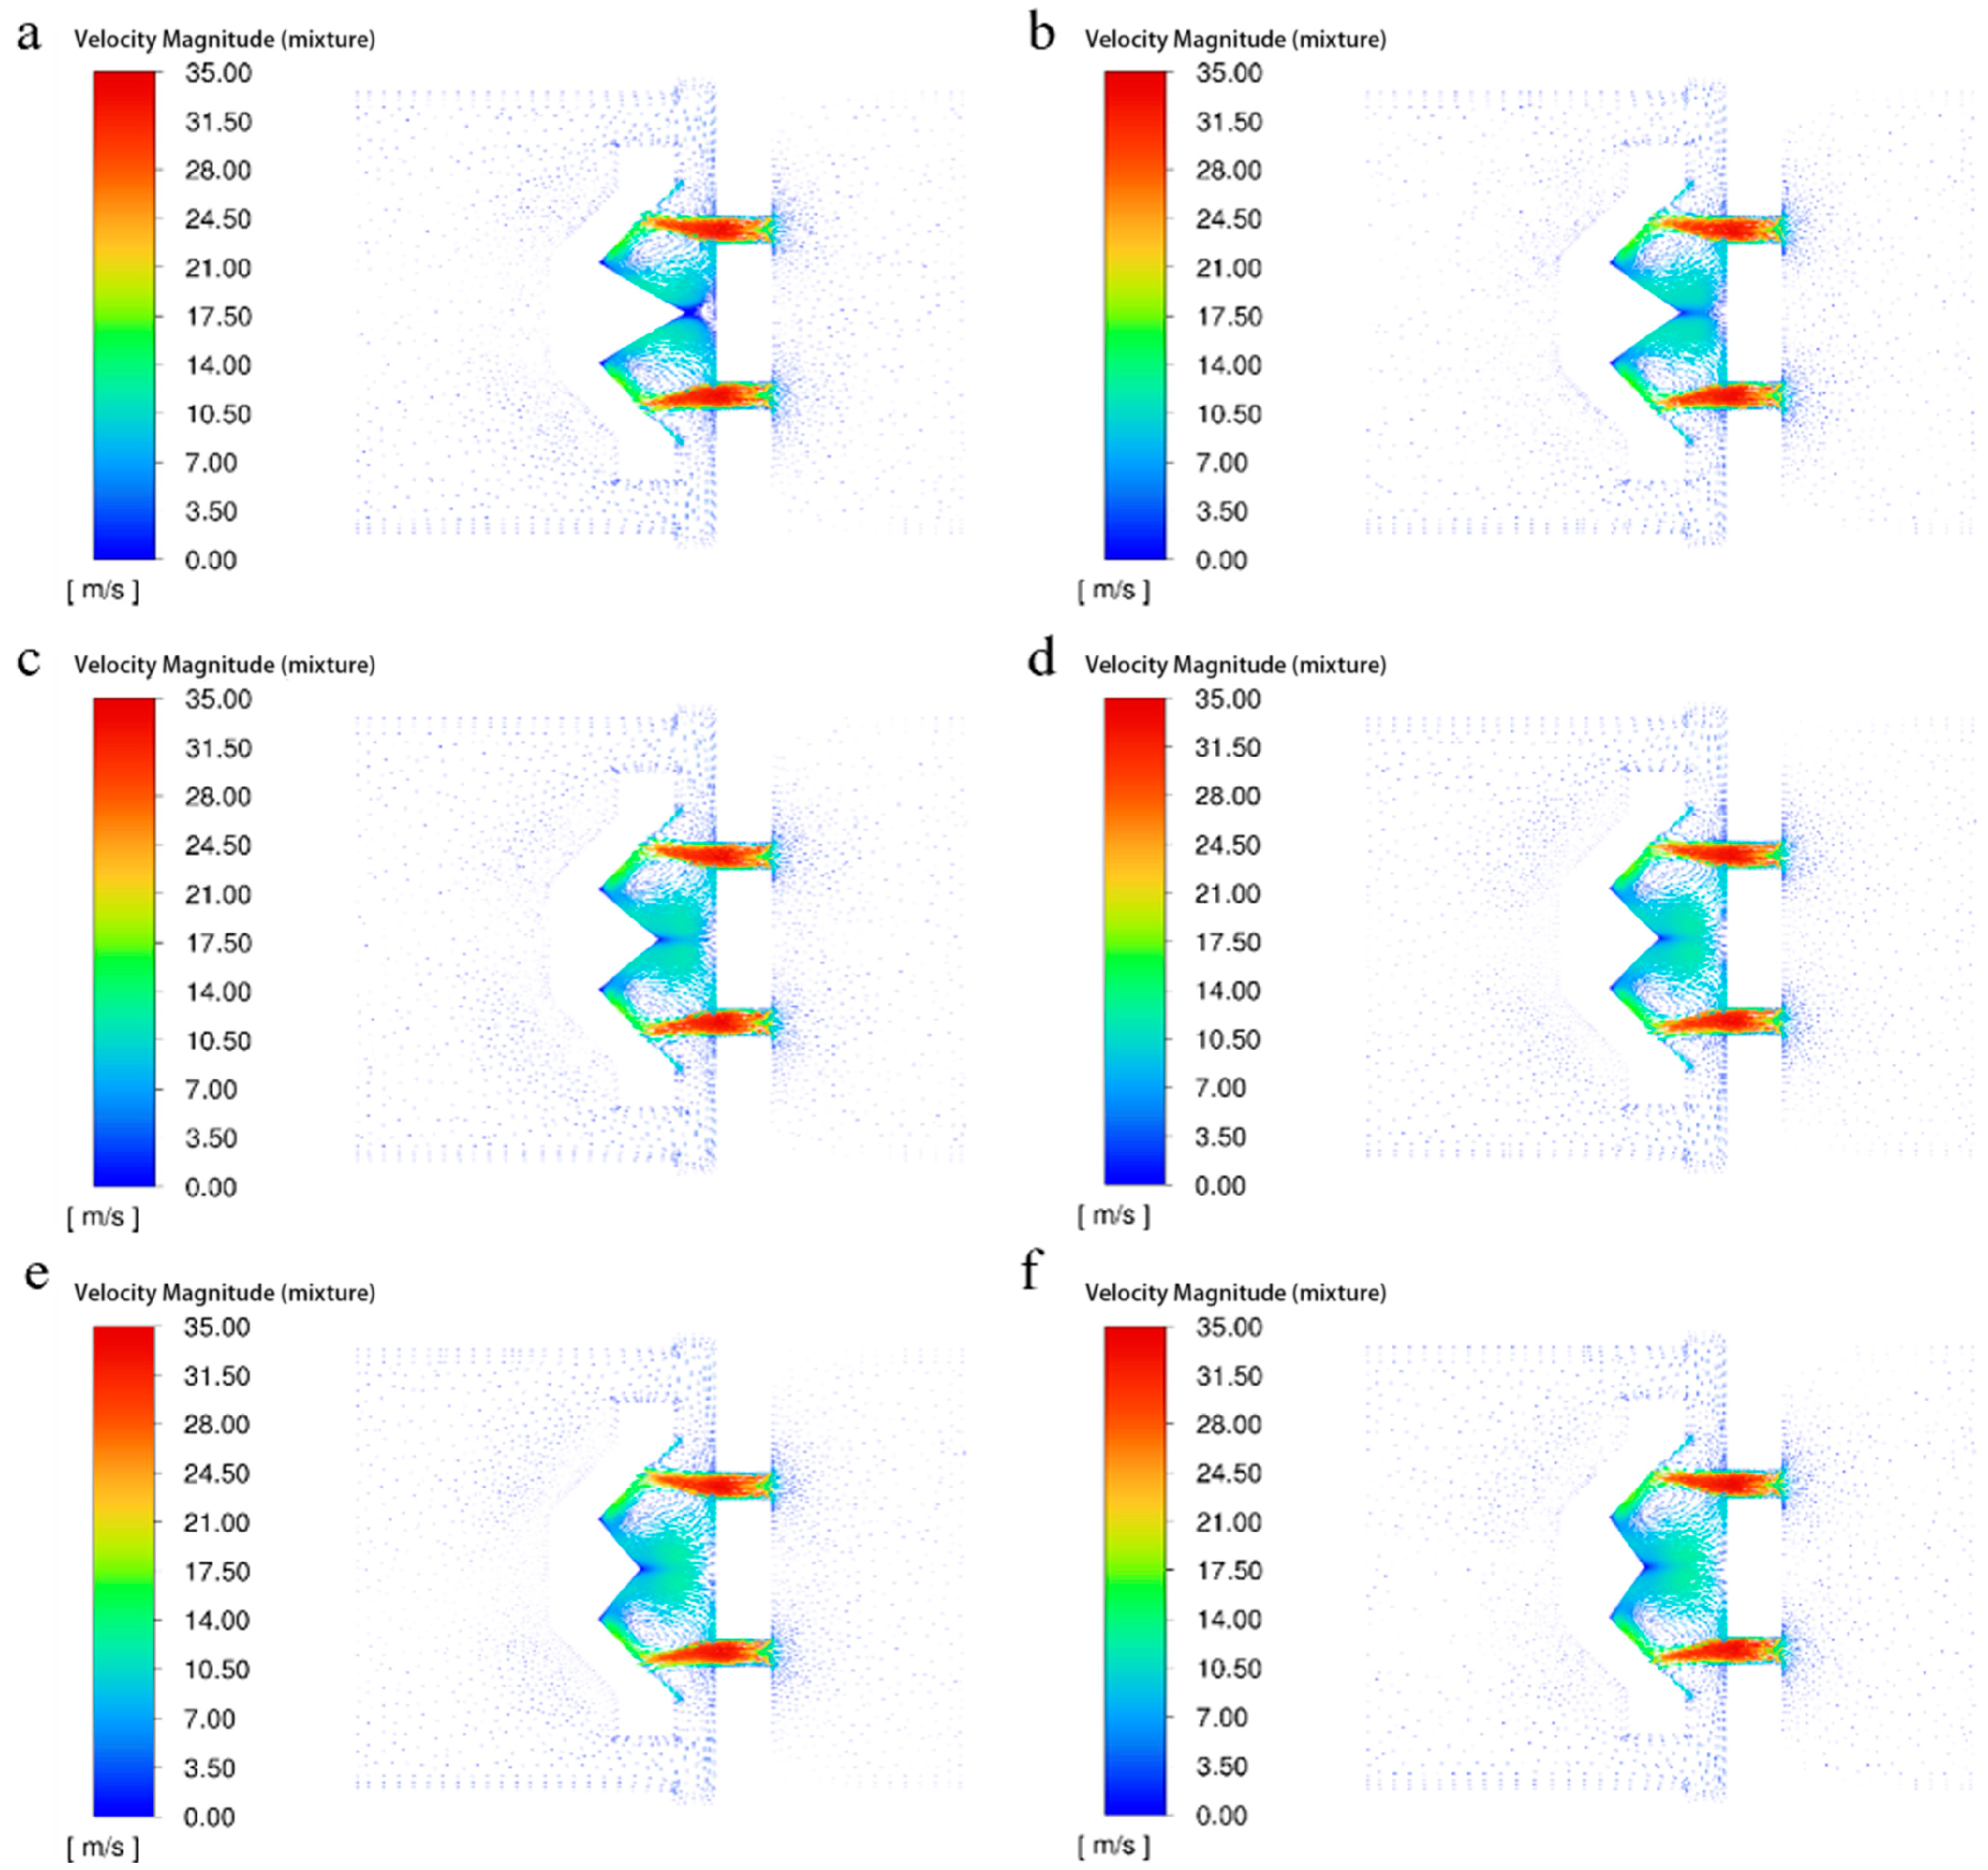
4.4. Analysis of Velocity and Turbulent Kinetic Energy Distribution within the Releaser

Figure 12 and Figure 13, respectively, reflect the changes in turbulence and velocity within the multi-venturi releasers at different angles. Within the multi-venturi releasers with varying valve chamber angles, the fluid velocity and turbulent kinetic energy changes tend to be consistent. The fluid velocity reaches its maximum, approximately 35 m/s, after passing through the venturi, and then the fluid collides with the inner walls of the valve chamber, resulting in a change in velocity direction and the formation of turbulence and vortices within the chamber. During this process, the energy of the high-pressure fluid is released.
From the perspective of the turbulent kinetic energy contour plot, as the valve chamber angle increases, the extent of the turbulent flow field gradually expands. However, with a valve chamber angle of 80° as the watershed, the releasers exhibit an imbalance in the maximum turbulent kinetic energy within the valve chamber, leading to an uneven distribution of energy release of the high-pressure fluid in different valve chambers. This results in an uneven distribution of microbubbles at the outlet of the releaser. Therefore, based on the changes in the turbulent kinetic energy field within the releaser, the releaser with a valve chamber angle of 80° still exhibits optimal performance.
Through the aforementioned simulation analysis, it was found that under various valve chamber angles, the overall differences in air distribution, pressure, velocity, and turbulence variations within the releaser were generally insignificant, validating the Plackett–Burman analysis that changes in valve chamber angle do not significantly impact releaser performance. However, upon closer inspection, the releaser with a valve chamber angle of 80° exhibited the most uniform gas phase distribution in the outlet region, whereas other angles demonstrated localized gas phase unevenness or air deficiency. From the perspective of pressure field variations, the maximum internal pressure difference within the releaser, reaching 552,404.43 Pa, was observed at a valve chamber angle of 80°, indicating that more energy dissipation occurs as the high-pressure dissolved-air water flows through the releaser at this angle. Furthermore, the turbulent kinetic energy contour plots revealed that under the condition of a valve chamber angle of 80°, the turbulent kinetic energy field distribution within the releaser was the most uniform. Based on the above analysis, a valve chamber angle of 80° was ultimately selected for the releaser, as it offers optimal performance in terms of both gas phase distribution and energy dissipation, as well as a uniform turbulent kinetic energy field.

5. Performance Test of the Multi-Throat W-Chamber Type Releaser

Using 3D printing technology, an optimized Multi-Throat W-chamber type releaser was created. To avoid experimental errors caused by different manufacturing accuracies, an identical replica of the traditional TS releaser was also made using 3D printing and based on its structure and dimensions, as shown in Figure 14.
To fully understand the performance differences between the two releasers, interactive experiments were conducted with the device’s air–liquid volume ratios set at 2.4%, 6%, 9.6%, 13.2%, and 16.8%, and the opening degrees of the circulating proportional valve set at 11°, 14°, 17°, 20°, and 23°. The dissolved-oxygen content and irrigation flow rate of the irrigation water were used as evaluation indicators. It is important to note that external factors such as ambient temperature and atmospheric pressure can affect the solubility of air, thereby further influencing the experimental results [43,44,45,46,47,48]. On the day of the experiment, the ambient temperature was 35.6 °C, the atmospheric pressure was 100.8 KPa, and the air humidity was 34%. The initial dissolved-oxygen content of the groundwater used in the experiment was 1.21 mg/L, and the initial water temperature was 23.4 °C. Since the dissolved oxygen in irrigation water dissipates rapidly when exposed to air, it is necessary to ensure the tightness of the measurement device when determining the dissolved-oxygen content of the irrigation water. The detection instrument used for testing was the Hengxin AZ8403 portable dissolved-oxygen meter, and the flow sensor was the Haihui Kemao SUS-6 Hall flow sensor, as shown in Figure 15. During measurement, the dissolved-oxygen meter was first calibrated, and then when the aerated irrigation device operated stably and generated uniform microbubbles in the irrigation water, a conical flask was completely filled with the irrigation water, quickly sealed, and the dissolved-oxygen content of the irrigation water was measured using the aforementioned dissolved-oxygen detector. In the performance test of the releaser, as the air proportion increases, the overall tightness of the device is affected, resulting in the air–liquid mixing pump being unable to draw water due to excessive air, causing a liquid fault in the device. At this time, the irrigation flow rate of the device will drop sharply, and it cannot operate stably. When this happens, the dissolved-oxygen content and flow rate of the irrigation water are recorded as 0.
The experimental results are presented in Table 5. Through the experiments, it can be observed that as the opening degree of the proportional circulation valve increases and the air proportion rises, the irrigation flow rate shows a downward trend, while the dissolved-oxygen content in the irrigation water exhibits an upward trend within a certain range. To visually observe the performance differences between the two releasers, the response surface method was employed to analyze the experimental data. Figure 16 and Figure 17 illustrate the response surfaces of the irrigation water flow rate and dissolved-oxygen content as a function of the air–liquid volume ratio and the proportional circulation valve opening for both releasers. For both releasers, when the air–liquid volume ratio reaches 16.8%, liquid fracture occurs in both releasers due to the presence of large bubbles in the water as the opening degree of the proportional circulation valve increases. Additionally, the impact of increased the air proportion on the dissolved-oxygen content is significantly higher than that of the circulation proportion. Both releasers achieve the maximum dissolved-oxygen content at an air–liquid volume ratio of 13.2%, with the multi-throat W-chamber type releaser achieving a maximum dissolved-oxygen content of 6.36 mg/L in the irrigation water, while the traditional releaser achieves 6.14 mg/L. A horizontal comparison reveals that under most identical experimental conditions, the multi-throat W-chamber type releaser exhibits a certain degree of improvement in both irrigation flow rate and dissolved-oxygen content compared to the traditional TS releaser. Considering an irrigation flow rate above 950 L/h and a dissolved-oxygen content above 5.9 mg/L as the threshold, the multi-throat W-chamber type releaser possesses a wider range of high flow rate and high dissolved-oxygen content, indicating a significant performance enhancement compared to the traditional TS releaser.

6. Conclusions

The optimization strategy presented in this paper for the conventional TS releaser centers around an innovative decomposition of its original single-inlet structure and valve chamber layout. This transformation not only facilitates a more balanced influx of high-pressure fluid into the valve chamber but also enhances the chamber’s effectiveness in pressure reduction and energy dissipation through spatially dispersed inlet design. Consequently, during releaser design, increasing the number of inlets and valve chambers serves as an effective means to disperse pressure accumulation within the releaser, promote the formation of a uniform turbulent flow field, and accelerate the pressure reduction and energy dissipation of pressurized water containing dissolved air. However, the specific design must be closely integrated with practical application scenarios to ensure its scientific rigor and rationality.
The simulation analysis conducted in this study reveals that high-pressure jets tend to form localized high-pressure zones when flowing through the sharp corners of the V-shaped valve chamber of the traditional TS releaser. While this phenomenon may hinder the generation of microbubbles during the gas dissolution and release process, it could potentially offer advantages in handling prone-to-clogging areas, such as emitters in drip irrigation systems. Additionally, constrained by practical manufacturing dimensions, the W-shaped valve chamber designed in this paper was unable to fully allocate dedicated chambers for each inlet jet, thereby limiting its performance optimization to a certain extent. Therefore, further structural optimization research on the multi-throat W-valve chamber releaser remains necessary.
Furthermore, the performance of other components in aerated irrigation equipment significantly impacts irrigation effectiveness, including enhancing the pressure in the aerated tank to increase air solubility in water and optimizing the structure of the gas–liquid mixing pump to improve mixing efficiency. Through the simulation analysis and discussion of releasers in this paper, we aim to contribute to the development of aerated irrigation equipment and, in turn, promote the sustainable development of modern agriculture.

Author Contributions

C.S. and D.W. were primarily responsible for conducting the simulations and experiments, as well as authoring the content of the manuscript, and ensuring a comprehensive and rigorous analysis of the research topic. H.L. took charge of the design and creation of all figures and tables within the manuscript, contributing to the clarity and visual representation of the data and results. Y.X. and B.L. collaborated on the translation of the manuscript, ensuring that the research findings were accurately conveyed in the target language, maintaining the integrity and precision of the original content. W.G. oversaw the meticulous review and refinement of the manuscript. All authors have read and agreed to the published version of the manuscript.

Funding

This research was funded by “the Henan Provincial Natural Science Foundation Project, grant number 242300420603”; “the Scientific and technological project in Henan Province, grant number 232102320127”and “the Key Technology Research Program of the Higher Education Institutes of Henan Province, China, grant number 22A416008”.

Institutional Review Board Statement

Not applicable.

Data Availability Statement

Data are contained within the article.

Conflicts of Interest

The authors declare that they have no conflicts of interest.

References

  1. Xiao, Y.; Sun, C.; Wang, D.; Li, H.; Guo, W. Analysis of Hotspots in Subsurface Drip Irrigation Research Using CiteSpace. Agriculture 2023, 13, 1463. [Google Scholar] [CrossRef]
  2. Du, Y.-D.; Niu, W.-Q.; Gu, X.-B.; Zhang, Q.; Cui, B.-J.; Zhao, Y. Crop yield and water use efficiency under aerated irrigation: A meta-analysis. Agric. Water Manag. 2018, 210, 158–164. [Google Scholar] [CrossRef]
  3. Wang, J.W.; Cui, Y.Q.; Wu, K.L.; Wu, S.Y.; Wu, K.J.; Li, Y.; Wenquan, N. Micro/nanobubble-aerated drip irrigation affects saline soil microenvironments and tomato growth by altering bacterial communities. Soil Tillage Res. 2024, 239, 106034. [Google Scholar] [CrossRef]
  4. Jin, C.C.; Lei, H.J.; Chen, J.; Xiao, Z.Y.; Leghari, S.J.; Yuan, T.Y.; Pan, H.W. Effect of Soil Aeration and Root Morphology on Yield under Aerated Irrigation. Agronomy 2023, 13, 369. [Google Scholar] [CrossRef]
  5. Baram, S.; Weinstein, M.; Evans, J.F.; Berezkin, A.; Sade, Y.; Ben-Hur, M.; Bernstein, N.; Mamane, H. Drip irrigation with nanobubble oxygenated treated wastewater improves soil aeration. Sci. Hortic. 2022, 291, 110550. [Google Scholar] [CrossRef]
  6. Bhattarai, S.P.; Su, N.H.; Midmore, D.J.; Sparks, D.L. Oxygation Unlocks Yield Potentials of Crops in Oxygen-Limited Soil Environments. Adv. Agron. 2005, 88, 313. [Google Scholar] [CrossRef]
  7. Cui, J.P.; Tan, F. PLSR-Based Assessment of Soil Respiration Rate Changes under Aerated Irrigation in Relation to Soil Environmental Factors. Agriculture 2023, 13, 68. [Google Scholar] [CrossRef]
  8. Li, Y.; Zhang, Z.X.; Wang, J.W.; Zhang, M.Z. Soil Aeration and Plastic Film Mulching Increase the Yield Potential and Quality of Tomato (Solanum lycopersicum). Agriculture 2022, 12, 269. [Google Scholar] [CrossRef]
  9. Xiao, Z.Y.; Lei, H.J.; Jin, C.C.; Pan, H.W.; Lian, Y.J. Relationship between the Dynamic Characteristics of Tomato Plant Height and Leaf Area Index with Yield, under Aerated Drip Irrigation and Nitrogen Application in Greenhouses. Agronomy 2023, 13, 116. [Google Scholar] [CrossRef]
  10. Sariyev, A.; Barutcular, C.; Acar, M.; Hossain, A.; El Sabagh, A. Sub-Surface Drip Irrigation in Associated with H2O2 Improved the Productivity of Maize under Clay-Rich Soil of Adana, Turkey. Phyton-Int. J. Exp. Bot. 2020, 89, 519–528. [Google Scholar] [CrossRef]
  11. Zhao, H.; Li, L.; Fan, G.H.; Xie, S.Z.; Li, F.H. Effects of aerated brackish water irrigation on growth of Lycium barbarum seedlings. Sci. Hortic. 2023, 310, 111721. [Google Scholar] [CrossRef]
  12. Seifi, A.; Mirlatifi, S.M. Irrigation Water Use Efficiency and Yield of Pistachio under Aerated Subsurface Drip Irrigation System. J. Agric. Sci. Technol. 2020, 22, 1655–1671. [Google Scholar]
  13. Andinet, T.; Kim, I.; Lee, J.Y. Effect of microbubble generator operating parameters on oxygen transfer efficiency in water. Desalination Water Treat. 2016, 57, 26327–26335. [Google Scholar] [CrossRef]
  14. Parmar, R.; Majumder, S.K. Terminal rise velocity, size distribution and stability of microbubble suspension. Asia-Pacific J. Chem. Eng. 2015, 10, 450–465. [Google Scholar] [CrossRef]
  15. Li, J.; Fan, Y.; Han, J.; Liu, Z. Experimental Study on Generation of Micro-bubble Based on Dissolution of Gas Through Pressurizing. J. Xi’an Shiyou Univ. (Nat. Sci. Ed.) 2018, 33, 122–126. [Google Scholar] [CrossRef]
  16. Yamashita, H.; Aoyagi, H.; Minagawa, H. Enhancement of microbubble generation in a pressurized dissolution process by packing the nozzle with porous ceramics. Water Sci. Technol. 2012, 65, 69–75. [Google Scholar] [CrossRef]
  17. Sun, H. Research progress of microbubble generator. Energy Chem. Ind. 2022, 43, 39–44. [Google Scholar]
  18. Lee, C.H.; Choi, H.; Jerng, D.W.; Kim, D.E.; Wongwises, S.; Ahn, H.S. Experimental investigation of microbubble generation in the venturi nozzle. Int. J. Heat Mass Transf. 2019, 136, 1127–1138. [Google Scholar] [CrossRef]
  19. Wu, M.; Song, H.; Liang, X.; Huang, N.; Li, X. Generation of micro-nano bubbles by self-developed swirl-type micro-nano bubble generator. Chem. Eng. Process.-Process Intensif. 2022, 181, 109136. [Google Scholar] [CrossRef]
  20. Deng, C.; Yang, L.; Chen, H.J.; Yang, M.C.; Zhu, Y.Z. Progresses in Research and Application of Micro-Nano Bubble Generating Device. Petrochem. Technol. 2014, 43, 61–63. [Google Scholar]
  21. Satpathy, K.; Rehman, U.; Cools, B.; Verdickt, L.; Peleman, G.; Nopens, I. CFD-Based process optimization of a dissolved air flotation system for drinking water production. Water Sci. Technol. 2020, 81, 1668–1681. [Google Scholar] [CrossRef]
  22. Schofield, T. Dissolved air flotation in drinking water production. Water Sci. Technol. 2001, 43, 9–18. [Google Scholar] [CrossRef]
  23. Zhang, X.H.; Zhang, X.W.; Liu, Y.P.; Zhang, Q.; Yang, S.P.; He, X.W. Removal of viscous and clogging suspended solids in the wastewater from acrylonitrile-butadiene-styrene resin production by a new dissolved air release device. Process Saf. Environ. Prot. 2021, 148, 524–535. [Google Scholar] [CrossRef]
  24. Liu, Y.; Jiang, C.; Gong, L.; Xie, H.; Gao, J. Discussion on Research Progress of Aerobic Irrigation. J. Agric. Disaster Res. 2023, 13, 61–63. [Google Scholar]
  25. Zabel, T. The advantages of dissolved-air flotation for water treatment. J. Am. Water Work. Assoc. 1985, 77, 42–46. [Google Scholar] [CrossRef]
  26. Yue, P.; Liu, Z. Numerical Simulation of the Inlet Pressure TS Type Affect Release of Dissolved Gas Performance. Guangdong Chem. Ind. 2016, 43, 9–10+3. [Google Scholar]
  27. Fletcher, D.F.; McClure, D.D.; Kavanagh, J.M.; Barton, G.W. CFD simulation of industrial bubble columns: Numerical challenges and model validation successes. Appl. Math. Model. 2017, 44, 25–42. [Google Scholar] [CrossRef]
  28. Alam, H.S.; Sutikno, P.; Soelaiman, T.A.F.; Sugiarto, A.T. CFD-PBM Coupled modeling of bubble size distribution in a swirling-flow nanobubble generator. Eng. Appl. Comput. Fluid Mech. 2022, 16, 677–693. [Google Scholar] [CrossRef]
  29. Arias, S.; Montlaur, A. Influence of contact angle boundary condition on CFD simulation of T-junction. Microgravity Sci. Technol. 2018, 30, 435–443. [Google Scholar] [CrossRef]
  30. Yang, H.; Kong, L.; Chen, J.; Sun, H.; Song, J.; Kong, B.; Ding, G. Gas-Liquid Two-Phase Flow Characteristic Research on Micro Bubble Tubular Gas-Liquid Contactor. J. Petrochem. Univ. 2024, 37, 25–33. [Google Scholar] [CrossRef]
  31. Liew, K.C.S.; Rasdi, A.; Budhijanto, W.; Yusoff, M.H.M.; Bilad, M.R.; Shamsuddin, N.; Nordin, N.A.H.M.; Putra, Z.A. Porous Venturi-Orifice Microbubble Generator for Oxygen Dissolution in Water. Processes 2020, 8, 10. [Google Scholar] [CrossRef]
  32. Nouri, N.M.; Sarreshtehdari, A.; Maghsoudi, E. Improvement of A Microbubble Generator’s Performance via Reliance on Fluid Dynamics Characteristics. J. Mech. 2009, 25, 189–194. [Google Scholar] [CrossRef]
  33. Yun, J.-E. CFD Analysis for the Design of a Venturi Tube-type Air Bubble Generator with Porous Material Throat. Trans. KSME B 2016, 40, 667–672. [Google Scholar] [CrossRef]
  34. Li, X.H.; Su, W.B.; Liu, Y.; Yan, X.K.; Wang, L.J.; Zhang, H.J. Comparison of bubble velocity, size, and holdup distribution between single- and double-air inlet in jet microbubble generator. Asia-Pac. J. Chem. Eng. 2021, 16, e2611. [Google Scholar] [CrossRef]
  35. Pang, M.J.; Wei, J.J.; Yu, B. Study on Liquid Turbulence Modulation by Microbubbles in Different Turbulence Layers. Adv. Mech. Eng. 2014, 6, 647467. [Google Scholar] [CrossRef]
  36. Kitagawa, A.; Hishida, K.; Kodama, Y. Flow structure of microbubble-laden turbulent channel flow measured by PIV combined with the shadow image technique. Exp. Fluids 2005, 38, 466–475. [Google Scholar] [CrossRef]
  37. Guo, X.; Li, Q.; Zhang, J.; Lei, M.; Liu, J.; Zhu, H. Structural Optimization Study of Microbubble Generator. J. Eng. Thermophys. 2023, 44, 1815–1822. [Google Scholar]
  38. Liu, S.; Niu, H.; Yue, P. Effect of Outlet Diameter on Microbubbles Formation in Dissolved Air Releaser. Technol. Dev. Chem. Ind. 2021, 50, 62–65. [Google Scholar]
  39. Wu, Y.X.; Chen, H.; Song, X.F. An investigation on the effect of open hole number and scheme on single-phase flow of a swirl flow bubble generator. Korean J. Chem. Eng. 2023, 40, 754–769. [Google Scholar] [CrossRef]
  40. Zhang, X.; Liu, F.; Wang, W. Mechanism research of bubble fragmentation of Venturi bubble generator. Pet. Refin. Eng. 2023, 53, 9–11+34. [Google Scholar]
  41. Gao, H.; Wei, Z.; Shi, Y.; Xu, H.; Wang, H. Design of the CFD numerical simulation-based bubble generator of jet microbubble flotation cell. Coal Prep. Technol. 2023, 51, 30–37. [Google Scholar] [CrossRef]
  42. Wang, X.Y.; Shuai, Y.; Zhang, H.M.; Sun, J.Y.; Yang, Y.; Huang, Z.L.; Jiang, B.B.; Liao, Z.W.; Wang, J.D.; Yang, Y.R. Bubble breakup in a swirl-venturi microbubble generator. Chem. Eng. J. 2021, 403, 126397. [Google Scholar] [CrossRef]
  43. Li, Q.; Guo, X.; Zhang, J.; Lei, M.; Liu, J.L.; Ming, D.Z.; Fang, L. Mechanism of Microbubbles and Cavitation Effect on Bubble Breakage in a Venturi Bubble Generator. J. Appl. Fluid Mech. 2023, 16, 778–793. [Google Scholar] [CrossRef]
  44. Park, J.S.; Kurata, K. Application of Microbubbles to Hydroponics Solution Promotes Lettuce Growth. Horttechnology 2009, 19, 212–215. [Google Scholar] [CrossRef]
  45. Chen, E.; Zhang, Y.; Lu, S.; Duan, H.; Jin, W. Stability and physicochemical properties of air nanobubbles. Chem. Ind. Eng. Prog. 2022, 41, 4673–4681. [Google Scholar] [CrossRef]
  46. Liu, Y.F.; Wang, G.C.; Zhang, X.N.; Li, H.C.; Si, B.C.; Liu, W.Q.; Zhang, Z.H. Motion Characteristics of Gas–Liquid Two-Phase Flow of Microbubbles in a Labyrinth Channel Used for Aerated Drip Irrigation. Water 2023, 15, 1432. [Google Scholar] [CrossRef]
  47. Roohi, R.; Abedi, E.; Hashemi, S.M.B.; Marszalek, K.; Lorenzo, J.M.; Barba, F.J. Ultrasound-assisted bleaching: Mathematical and 3D computational fluid dynamics simulation of ultrasound parameters on microbubble formation and cavitation structures. Innov. Food Sci. Emerg. Technol. 2019, 55, 66–79. [Google Scholar] [CrossRef]
  48. Lei, H.J.; Liu, H.; Balsys, R.; Midmore, D.J.; Zang, M.; Bhattarai, S. Factors of relevance for improving the uniformity of oxygen distribution in drip irrigation water. Irrig. Drain. 2020, 69, 1133–1145. [Google Scholar] [CrossRef]
Figure 1. Aerated irrigation device and its working principle.
Agriculture 14 01248 g001
Figure 2. Different types of throttling releasers and their basic structures. (a) Traditional TS releaser, (b) W-chamber type releaser, (c) arc-shaped chamber releaser, (d) multi-throat W-chamber type releaser, (e) single-throat releaser inlet, (f) multi-throat releaser inlet, (g) releaser outlet, and (h) basic structure of releaser cross-section.
Agriculture 14 01248 g002
Figure 3. Pressure variation contour maps inside releasers with different designs. (a) Traditional TS releaser, (b) W-chamber type releaser, (c) arc-Shaped chamber releaser, and (d) multi-throat W-chamber type releaser.
Agriculture 14 01248 g003
Figure 4. Diagram of velocity variations inside different releasers. (a) Traditional TS releaser, (b) W-chamber type releaser, (c) arc-shaped chamber releaser, and (d) multi-throat W-chamber type releaser.
Agriculture 14 01248 g004
Figure 5. Turbulent kinetic energy distribution within different releasers. (a) Traditional TS releaser, (b) W-chamber type releaser, (c) arc-shaped chamber releaser, and (d) multi-throat W-chamber type releaser.
Agriculture 14 01248 g005
Figure 6. Air phase distribution within different release devices. (a) Traditional TS releaser, (b) W-chamber type releaser, (c) arc-shaped chamber releaser, and (d) multi-throat W-chamber type releaser.
Agriculture 14 01248 g006
Figure 7. Schematic diagram of the multi-throat W-chamber type releaser structure.
Agriculture 14 01248 g007
Figure 8. Pareto chart for Plackett–Burman analysis. (a) influence of three factors (A, B, C) on the average air fraction at the releaser outlet surface. (b) influence of three factors on the average turbulent kinetic energy at the releaser outlet surface. (c) influence of three factors on the overall turbulent kinetic energy within the releaser. The three factors represented by A, B, and C in the figure are outlet size, throat diameter, and chamber angle.
Agriculture 14 01248 g008
Figure 9. Response surface of average turbulent energy at outlet cross-section with changes in venturi diameter and outlet size.
Agriculture 14 01248 g009
Figure 10. Air-phase distribution inside the releaser at different valve chamber angles. (af) Valve chamber angles of the releaser at 60°, 70°, 80°, 90°, 100°, 110°.
Agriculture 14 01248 g010
Figure 11. Pressure distribution inside the releaser under different valve chamber angles. (af) Valve chamber angles of the releaser at 60°, 70°, 80°, 90°, 100°, 110°.
Agriculture 14 01248 g011
Figure 12. Turbulent energy contour plot within the releaser under different valve chamber angles. (af) Valve chamber angles of the releaser at 60°, 70°, 80°, 90°, 100°, 110°.
Agriculture 14 01248 g012
Figure 13. Velocity change within the releaser under different valve chamber angles. (af) Valve chamber angles of the releaser at 60°, 70°, 80°, 90°, 100°, 110°.
Agriculture 14 01248 g013
Figure 14. Multi-throat W-Chamber type releaser (a) and traditional TS releaser (b).
Agriculture 14 01248 g014
Figure 15. Dissolved-oxygen detector and flow detector used in the experiment.
Agriculture 14 01248 g015
Figure 16. Response surface of dissolved-oxygen content for the multi-throat W-chamber type releaser (a) and the traditional TS releaser (b).
Agriculture 14 01248 g016aAgriculture 14 01248 g016b
Figure 17. Flow rate response surface of the multi-throat W-chamber type releaser (a) and the traditional TS releaser (b).
Agriculture 14 01248 g017
Table 1. Simulation mesh parameter settings.
TypeParameterTraditional ReleaserW-Type
Releaser
Arc-Shaped ReleaserMulti-Throat
W-Type Releaser
Surface meshMinimum size (mm)0.0050.0050.0050.005
Maximum size (mm)0.6250.6250.6250.625
Growth rate1.11.11.11.1
Boundary layers3333
Transition ratio0.2720.2720.2720.272
Growth rate (layers)1.21.21.21.2
Volumetric meshMaximum size (mm)0.60.60.60.6
Growth rate1.11.11.11.1
Table 2. Interactive experimental design and results.
Refα (°)D (mm)S (mm)Air Proportion
(%)
Outlet Turbulence (m2/s2)All Turbulence
(m2/s2)
18510.80.067404870.072570831,697,998
2602.51.20.095966610.16898762,063,751
3851.51.20.07299670.27624252,291,974
4701.7510.10166520.14535211,961,270
5851.751.20.082464820.26947112,316,067
611011.20.060841220.31319382,496,721
79021.20.095290560.27227092,389,501
88511.60.062383340.86578462,491,963
9601.751.60.073088380.76170852,231,241
10601.750.80.082493550.04903713997,251.1
11852.51.60.11384870.64919161,086,193
121101.750.80.077418820.051045681,817,445
131101.751.60.074765430.75966182,920,059
146011.20.061488250.31166851,983,523
151102.51.20.10834480.26792182,604,006
16852.50.80.098867690.047462731,650,695
17901.751.20.087376850.27795252,377,095
Table 3. Plackett–Burman variance analysis table.
ItemTypeMean SquareF Valuep Value
Outlet air proportionA1.999 × 10−323.340.0013
B1.002 × 10−50.120.7411
C1.634 × 10−60.0190.8936
Outlet turbulentA0.0416.220.0373
B0.8120.14<0.0001
C2.283 × 10−30.340.5743
All turbulenceA3.628 × 10111.530.2514
B4.441 × 10111.870.2085
C8.141 × 10100.340.5743
In this table, the p-value reflects the impact of a factor on the result. A p-value less than 0.05 indicates that the factor has a significant impact on the specified metric, whereas a p-value less than 0.0001 suggests an extremely significant impact of the factor on the metric.
Table 4. Response surface variance analysis table.
ItemMean SquareF Valuep Value
A0.02318.130.0013
B1.17919.68<0.0001
AB0.0129.470.0105
2.618 × 10−32.050.18
0.08869.06<0.0001
In this table, the p-value reflects the impact of a factor on the result. A p-value less than 0.05 indicates that the factor has a significant impact on the specified metric, whereas a p-value less than 0.0001 suggests an extremely significant impact of the factor on the metric.
Table 5. Experimental test results of the two releasers.
Air–liquid
Volume Ratios
Circulating Proportional ValveMulti-Throat W-Chamber Type ReleaserTraditional TS Releaser
Flow RateDissolved
Oxygen
Flow RateDissolved
Oxygen
2.4%11°11644.2511084.21
14°11454.5210804.46
17°11154.7310324.76
20°10884.959844.91
23°10025.089124.79
6%11°10805.5610565.46
14°10565.6910205.58
17°10385.8510085.65
20°9965.949515.70
23°9126.028915.73
9.6%11°10425.910325.68
14°10085.9510025.83
17°9815.959765.93
20°9636.059345.81
23°8765.978885.75
13.2%11°9606.239566.09
14°9466.39246.14
17°9246.368765.98
20°8886.348166.01
23°8286.297645.95
16.8%11°8406.118345.83
14°0000
17°0000
20°0000
23°0000
Disclaimer/Publisher’s Note: The statements, opinions and data contained in all publications are solely those of the individual author(s) and contributor(s) and not of MDPI and/or the editor(s). MDPI and/or the editor(s) disclaim responsibility for any injury to people or property resulting from any ideas, methods, instructions or products referred to in the content.

