Article

Effect of Land Use Type on Soil Moisture Dynamics in the Sloping Lands of the Black Soil (Mollisols) Region of Northeast China

1
College of Forestry, The Northeast Forestry University, Harbin 150040, China
2
Soil and Water Conservation Monitoring Center of Songliao Basin, Songliao Water Resources Commission, Changchun 130021, China
3
Mills College, Northeastern University, Oakland, CA 94613, USA
*
Author to whom correspondence should be addressed.
Agriculture 2024, 14(8), 1261; https://doi.org/10.3390/agriculture14081261
Submission received: 24 June 2024 / Revised: 23 July 2024 / Accepted: 30 July 2024 / Published: 31 July 2024
(This article belongs to the Section Agricultural Soils)

Abstract

:
This study investigates the spatial and temporal heterogeneity of soil moisture on slopes of China’s northeastern black soil region, focusing on the effects of terrain adjustment and vegetation. Soil moisture dynamics in the 0–60 cm soil layer were measured at 10 cm intervals using the TRIME-PICO64 TDR® device on slopes with similar gradients representing three land use types: transverse ridge tillage (TRT) farmland, terraced fields (TFs) farmland, and pure forest woodland (WL). The results indicate significant variations in soil moisture content and water storage across different land use types in the order of TF > TRT > WL. The study further identified that soil bulk density, porosity, and water-holding indicators were in the order of WL > TF > TRT, inconsistent with the soil moisture results, indicating that soil quality cannot be the sole reason for the differences in moisture. The moisture differences between farmland types (TRT and TF) and WL are substantial, especially during the rainy season. In the rainy season (0–60 cm) and the dry season (30–60 cm), significant differences in moisture content are observed (p < 0.05). Significant differences in moisture content between farmland types are found at 0–40 cm during the rainy season and at 0–10 cm during the dry season. In the rainy season, soil moisture for TRT and TFs first decreases from 26.76% and 30.85% to 22.44% and 25.38%, then slightly increases to 27.01% and 27.07% along the slope. Meanwhile, WL displays the opposite pattern on upper, relatively steep slopes, with soil moisture increasing from 16.66% to 17.81%, and exhibits a pattern of change similar to TRT and TFs on lower, gentler slopes. TFs consistently show higher soil moisture and water storage at all slope positions than TRT and WL. TFs improve soil quality, reduce erosion and sedimentation, and shift the lowest soil moisture content to a lower slope position. During the dry season, soil moisture differences between slope positions for TRT and WL were small. In general, terracing can effectively modulate moisture distribution along slopes, increasing moisture by an average of 0.26~12.43%, while afforestation, despite improving soil quality, leads to an 18.14~31.13% reduction in soil moisture content, with the impact being particularly significant during the rainy season. These findings provide important insights for optimizing land use and ecological construction, including keeping the balance between soil and water conservation, especially for sub-humid slope terrain areas.

1. Introduction

Moisture is a crucial component of soil, playing a key role in the material and energy cycles of the soil system. It influences plant growth, ecosystem construction, soil erosion, and food production [1,2,3,4]. Soil moisture is influenced by factors such as climate, topography, land use, soil properties, and vegetation [5,6,7], exhibiting considerable spatial variability. Therefore, accurate knowledge of soil moisture variability is crucial for water resource management [8].
Soil physicochemical properties exert a significant influence on soil moisture. Increased soil organic matter (SOM) content enhances soil structure and water retention capacity [9]. Soils with SOM content exceeding 1.5% exhibit 40–60% higher water content compared to typical farmlands, with infiltration rates one-third faster and 16–60% less evaporation [10]. Shi et al. [11] identified soil bulk density as a critical factor influencing soil moisture characteristics. Moradi et al. [12] reported that increased total porosity, water-holding capacity, and saturated hydraulic conductivity enhance soil moisture content.
Topography and land use type are two key factors that influence moisture heterogeneity [13,14,15], controlling water movement and storage through different regulatory mechanisms. Topographic factors such as slope, aspect, and elevation directly regulate water movement and evaporation, whereas land use type further influences water infiltration and storage by altering terrain, surface cover, and soil structure. An in-depth understanding of the impacts of these factors on water distribution is important for scientific management and conservation in regions with limited water resources.
Prior studies show how soil moisture varies systematically on sloping lands. Shen et al. [16,17] found that soil moisture at the upper slopes of artificial Chinese pine forests was higher than at the lower slopes. In the rain-fed farming region of the Loess Plateau, Bai et al. [18] observed a similar pattern in soil moisture distribution across slopes with various vegetation covers. In another study, An et al. [19] confirmed that in artificial Robinia Pseudoacacia forests and abandoned grasslands, soil moisture along the slope gradually increased, with better moisture conditions at the lower slopes compared to the upper slopes. Li et al. [20] found that different land use types along the slope surface exhibit significant differences in soil moisture at different slope positions. In the Black River basin, Yin et al. [21] found that soil moisture was driven by land cover, elevation, and temperature. Guo et al. [14] found that land use, slope, and elevation significantly affected soil moisture at different depths, with the influence of land use type on soil moisture increasing with depth, while the influence of topographic elements (mainly slope and elevation) decreased.
These studies suggest that modifications to agricultural practices and to the terrain itself can be selected for their effects on soil moisture on sloping lands. For example, contour tillage can reduce runoff and soil erosion [22], improve soil physical quality, significantly reduce soil bulk density and permeability, and increase soil moisture content and porosity [23]. In addition, terracing has long been used for this purpose in regions with a wide range of water conditions. In the Loess Plateau, Tang et al. [24] found that terraces can effectively retain water, even during drought years, accounting for 45.2% of the total water storage.
Soil moisture is, of course, closely related to seasonal changes in precipitation, and its spatial heterogeneity across seasons has been a focal point of ecohydrological studies. Traditionally, it has been believed that land use type significantly influences soil moisture in dry seasons when soil moisture content is low, but this influence weakens in rainy seasons and is more likely to be affected by soil properties and vegetation types [25]. However, the dominant factors affecting soil moisture across different seasons remain controversial. For example, Zhu et al. [26] found that soil thickness was the main factor influencing moisture during wet periods, while the topographic moisture index, slope position, and slope orientation were also significant; they also found that the influence of slope orientation on soil moisture diminished during moderately wet and dry periods, while the influence of elevation increased. Yin et al. [21] demonstrated that the main drivers in low moisture months were land cover and elevation, while high moisture months were mainly influenced by vegetation index and surface temperature. Han et al. [27] found that microtopography in dry and hot river valleys had a significant effect on soil moisture variability, especially during the dry season. Fu et al. [28] concluded that the pore structure and mechanical composition of soil properties, as well as precipitation and elevation among environmental factors, were the main factors affecting soil moisture in the dry season in the central Taihang Mountains.
China’s northeastern black soil region is one of the four major black soil regions in the world and serves as a major commercial grain base, playing a crucial role in ensuring the national grain supply [29]. Under the dual influences of human activities and the natural environment, the northeastern black soil region is facing serious problems of soil erosion and ecosystem vulnerability [30,31]. Soil moisture is not only a crucial indicator for evaluating land productivity [32] but also a key factor in controlling the soil erosion processes [33]. Therefore, studying soil moisture in the northeastern black soil zone is essential for promoting rational land use allocation and efficient water resource utilization in the region.
The topography and soil texture of the northeastern black soil region are quite different from those of other regions; thus, the spatial and temporal characteristics of moisture in the area need further analysis. For this study, Keshan County was selected as the study site, and three different land use types on sloping land, namely forest or woodland (WL), transverse ridge tillage (TRT) farmland, and terraced field (TF) farmland, were chosen for analyses. We examined factors such as soil properties, seasonal variations, topographic position, and land management practices to analyze the differences in soil moisture dynamics across the three land use types and explain how water storage varies at different slope positions for each land use type. The results are significant for guiding the optimal allocation of land use in similar areas and for ecological construction efforts.

2. Materials and Methods
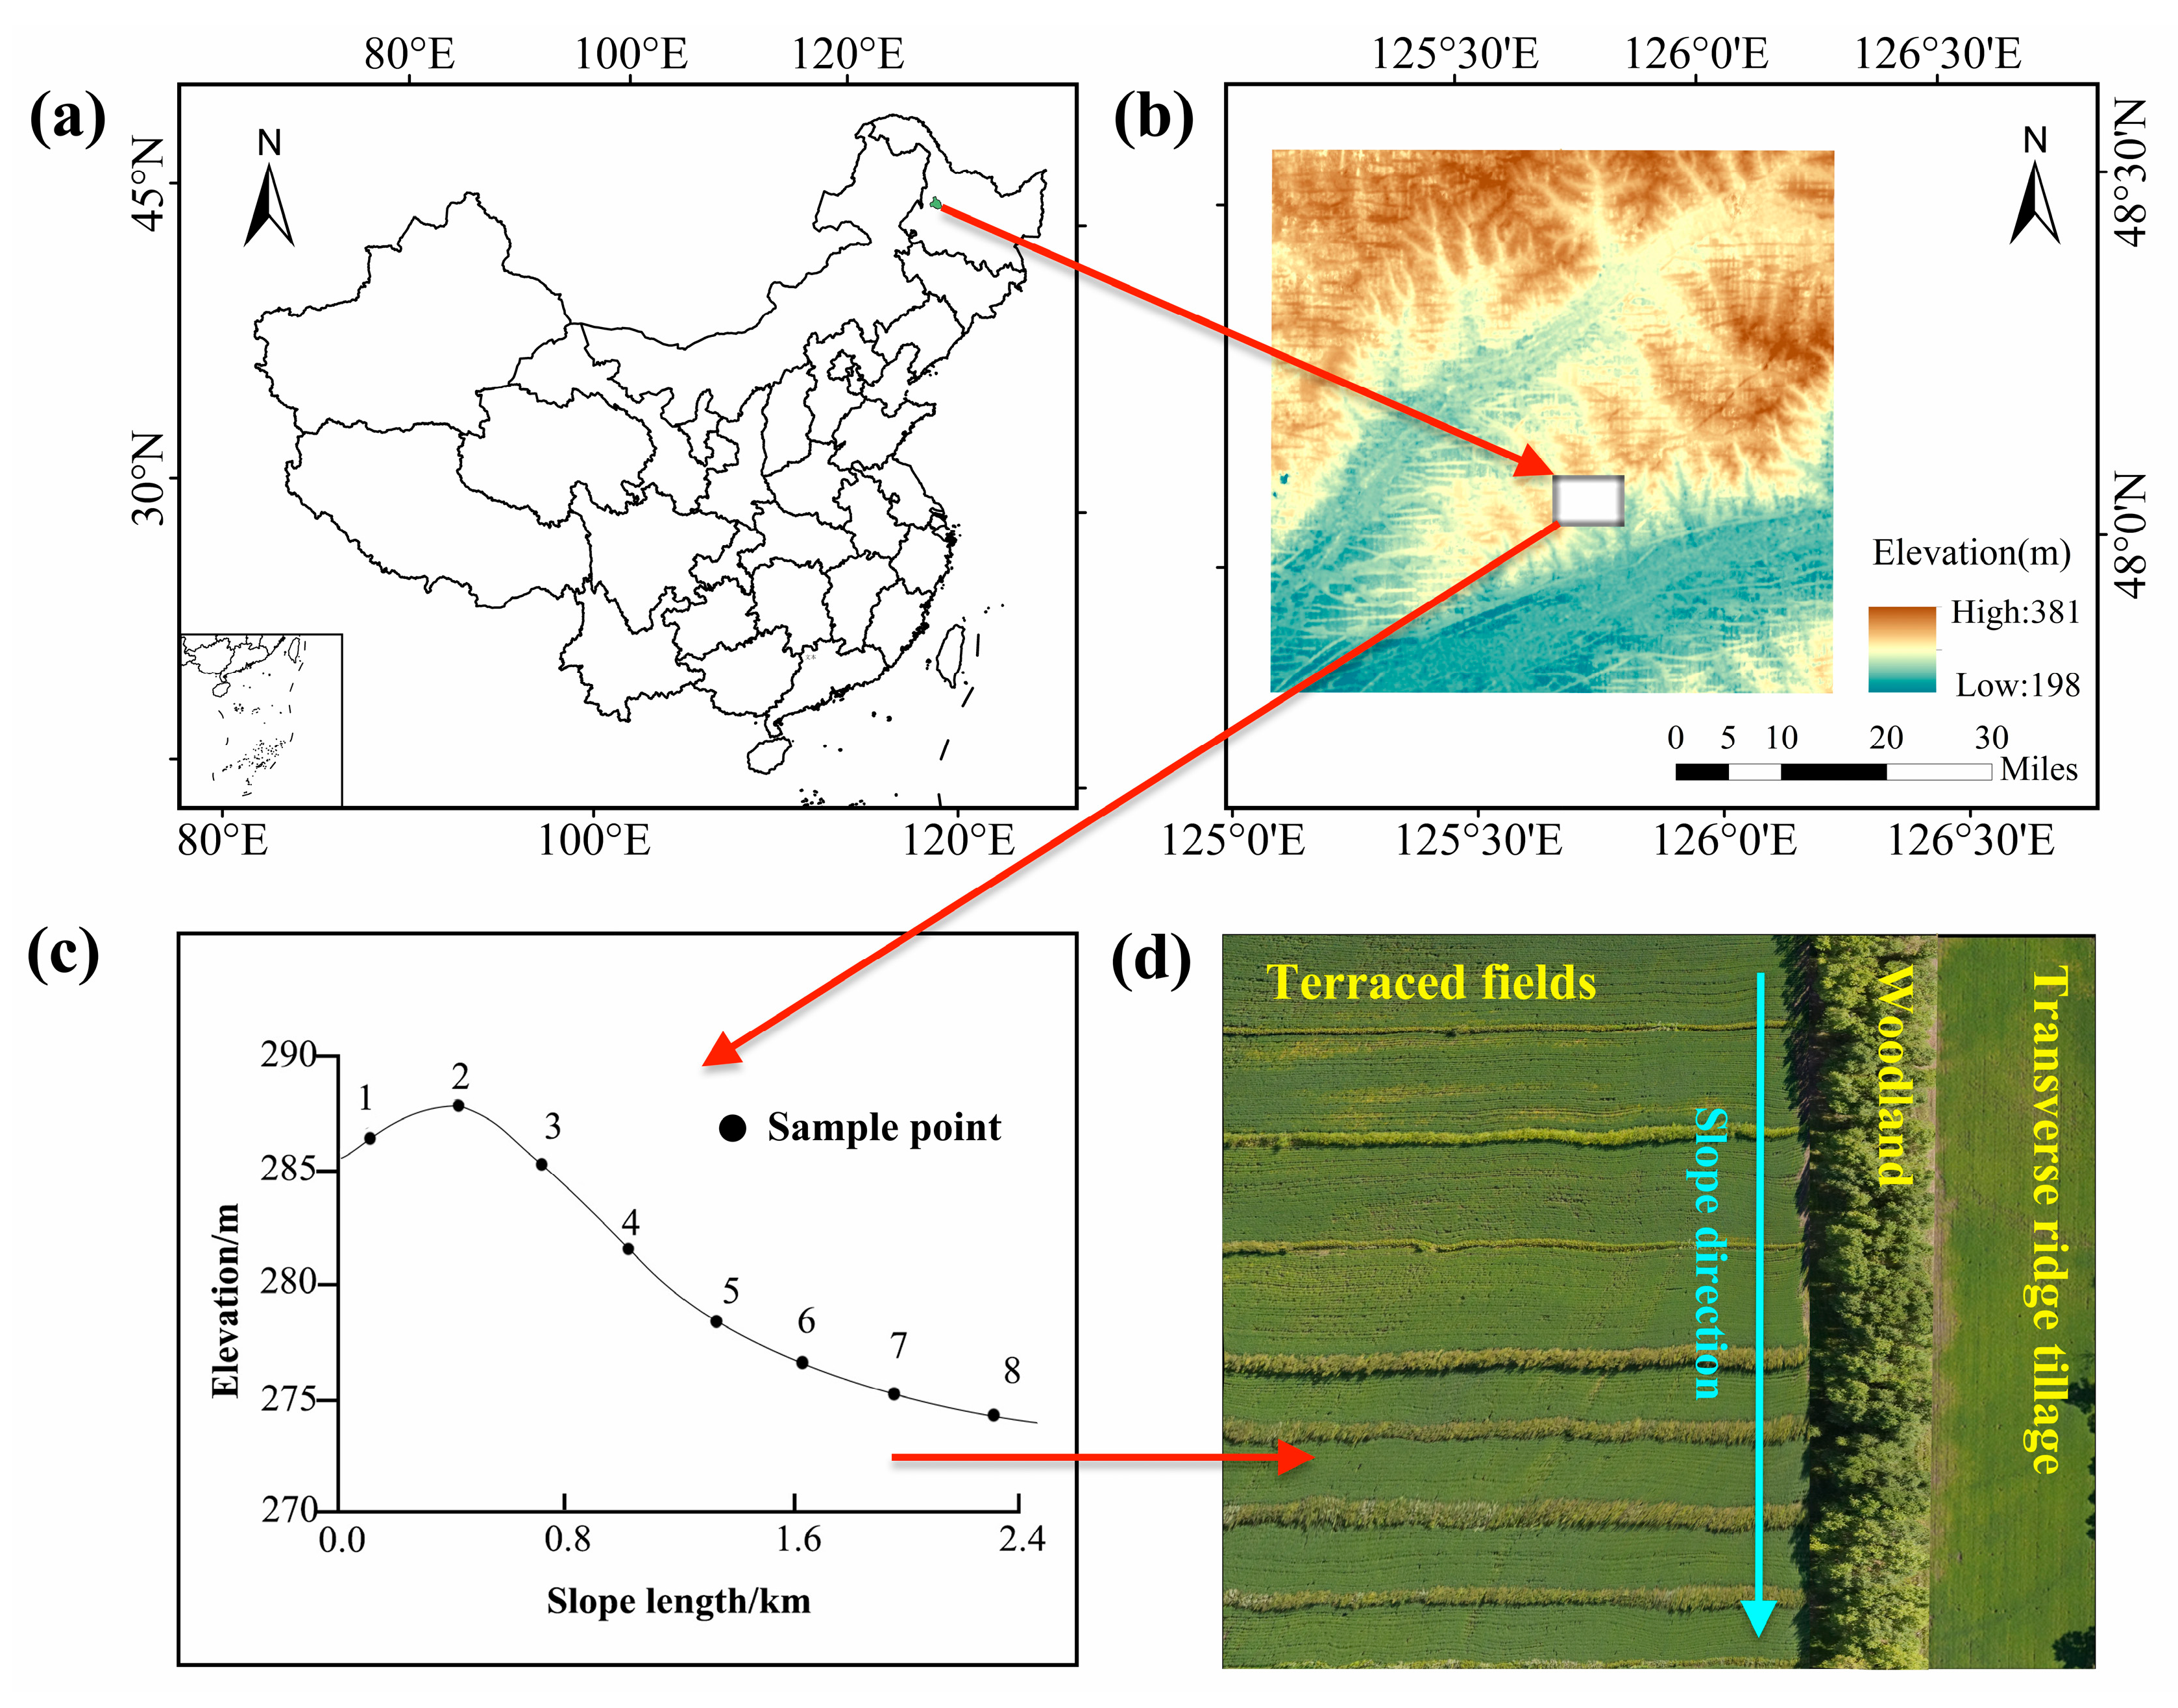
2.1. Study Area

The study area is located in Keshan County, Heilongjiang Province (N 48°30′, E 125°49′) (Figure 1a,b), within the transition zone from the Lesser Xing’an Mountains to the Songnen Plain. The elevation descends from the northwest to the southeast, with elevations ranging from 198 to 381 m. The landscape is dominated by diffuse mountains and hills, characterized by slow and long slopes. The soil type in this area is dominated by phaeozem, which is typical of the black soil region. The study area experiences a cold-temperate continental monsoon climate, with an annual average temperature of 0.9 °C, annual average total precipitation of 501.9 mm, annual average evapotranspiration of 1329 mm, annual average effective cumulative temperature of 2503.6 °C, and a frost-free period of about 115 d. Crops commonly planted include wheat (Triticumaesti-vum), soybean (Glycine max), and maize (Zea mays).

2.2. Research Methods

2.2.1. Experimental Setting and Soil Sampling

The total precipitation in the study area in 2022 was 375.6 mm, lower than the long-term annual average, with most of the precipitation occurring during the rainy season of April to August (310.8 mm, accounting for 82.7% of the annual precipitation). In 2022, the three representative land use types, including soil and water conservation woodland (planted Populus simonii × P. nigra), transverse ridge tillage farmland, and terraced fields farmland, located adjacent to each other with the same slope gradient, slope direction, and slope length were selected (Figure 1d). In both the transverse ridge tillage and terraced fields, crop sowing is aligned with elevation contours, and maize was planted in both. The woodland area retains its natural topography with no measures to alter the shape of the slope.
One sample line with a vertical contour was laid on each selected slope, with eight sampling points set from top to bottom of each sample line of transverse ridge tillage farmland (TRT) and woodland (WL) (Figure 1c,d). Sampling was conducted at equidistant intervals. The elevation range of the slopes is between 274.5 and 288.3 m. To improve the accuracy of terrace slope moisture evaluation, the KTAI method proposed by Xu et al. [34] was used to analyze the spatial variability of soil moisture in gently sloping horizontal terraces. In this study, each slope level of the terraced farmland (TF) was further divided into three subpoints, inner, middle, and outer, based on their distance from the previous level field, with three replicates taken at each subpoint. Thus, a total of 120 sampling points were established, including 72 on the slopes of TF and 24 each on WL and TRT. In the sample points of this study, the slopes of points 1–4 ranged from 5.06° to 6.67°, with point 2 being slightly higher in elevation than point 1 and having the maximum slope gradient; the slopes of points 5–8 had gentler gradients, ranging from 2.46 to 4.11° (Figure 1c).

2.2.2. Meteorological Factors

The period of September to March, when rainfall is scarce, is classified as the dry season. Figure 2 shows the sharp contrast in precipitation between July and October, the two months selected for sampling in the rainy and dry seasons, respectively. July, with higher temperatures as well as the greatest precipitation, is a period of vigorous growth for vegetation, while October, with lower temperatures and much-reduced precipitation, signals the ending of plant growth, the yellowing of tree leaves, and the harvesting of crops.

2.2.3. Soil Property Sampling and Analysis

Soil moisture was measured using the TRIME-PICO64 TDR® (IMKO Micromodultechnik GmbH, Ettlingen, Germany) during the 2022 rainy season (22 July, 24 July, 26 July) and the dry season (6 October, 8 October, 10 October). The sampling depth was 60 cm, with measurements taken at each 10 cm interval. Daily measurements of soil moisture were conducted at each point and depth within the fields, with each measurement repeated three times to ensure accuracy. The average soil moisture content for each period and depth was calculated based on these nine measurements. To ensure sufficient representativeness of the measurements, each measurement was completed before noon on a single date. Undisturbed soil samples were collected using a 100 cm3 ring cutter. The samples were collected at each sampling point using the quartering method, repeated three times for each soil layer, and brought back to the laboratory for analysis.
The soil bulk density, field capacity, capillary water capacity, and soil saturated water content were measured based on the ring cutter method. The mass of the ring cutter (M) was weighed on a balance, and the weight of the wet soil (M0) of each soil sample was measured using a digital balance. The ring cutter with wet soil was removed from the upper and lower covers, leaving only the perforated bottom cover padded with filter paper. It was placed in a flat-bottomed basin filled with water, with the water surface kept level with the upper edge of the ring cutter, and left to soak for 12 h. By that point, all the pores in the soil within the ring cutter were filled with water. The ring cutter was removed horizontally, dried, and immediately weighed to obtain mass M1. The ring cutter with mass M1 was then placed without the bottom cover in a flat-bottomed tray filled with dry sand for 2 h to remove non-capillary water from the soil. The bottom cover was replaced, and the ring cutter was weighed again to obtain mass M2. The ring cutter with mass M2 was then placed in a flat-bottomed tray filled with dry sand for 4 to 5 days to continuously remove moisture from the soil. The bottom cover was replaced, and the ring cutter was weighed again to obtain mass M3. Finally, a representative portion of soil (mass M4, about 20 g) was taken from the middle of the soil in the ring cutter with mass M3 and placed in an aluminum box with a known mass. It was immediately weighed on an analytical balance, dried in an oven at 105 °C ± 2 °C to a constant mass, and weighed again to obtain mass M5.
According to the parameters M, M0, M1, M2, M3, M4, M5, Formula (1) calculates the moisture conversion coefficient K [35], Formula (2) calculates the saturated water capacity [36] (SW, %), Formula (3) calculates the saturated capillary water capacity [37] (CW, %), Formula (4) calculates field water capacity [36] (FW, %), Formula (5) calculates soil bulk density [38] (BD, g/cm3), and Formulas (6) and (7) calculate soil capillary porosity (Pc, %) and total porosity [37] (Pt, %):
K = M 5 M 4
S W % = M 1 M M 3 M × K M 3 M × K × 100
C W % = M 2 M M 3 M × K M 3 M × K × 100
F W % = M 3 M M 3 M × K M 3 M × K × 100
B D g c m 3 = M 3 M × K 100
P c % = C W × B D
P t % = P c + S W C W × B D
Soil water storage (SWS, mm) is calculated by the Formula (8) [39]:
S W S = θ × h × 10 1
where SWS is the water storage capacity in mm, θ is the volumetric soil moisture in percent, and h is the soil thickness in cm. The calculation for soil water efficiency (δ) is given in formula [40] (9):
δ S w = S M t / S M s
where δSw represents the moisture benefit, and SMt is the soil water storage on the slopes of different land use types, and SMs is the soil water storage on the slopes of TRT (control).

2.3. Statistical Analysis

Microsoft Excel 2022® and SPSS 28.0® software were used to process the experimental data. One-way ANOVA and Least Significant Difference (LSD) tests were used to determine the significance of the difference analysis (α = 0.05). Plots were created based on the results using Origin 2024® and Excel 2022®. The precipitation data were obtained from the meteorological monitoring station in Keshan County.

3. Results

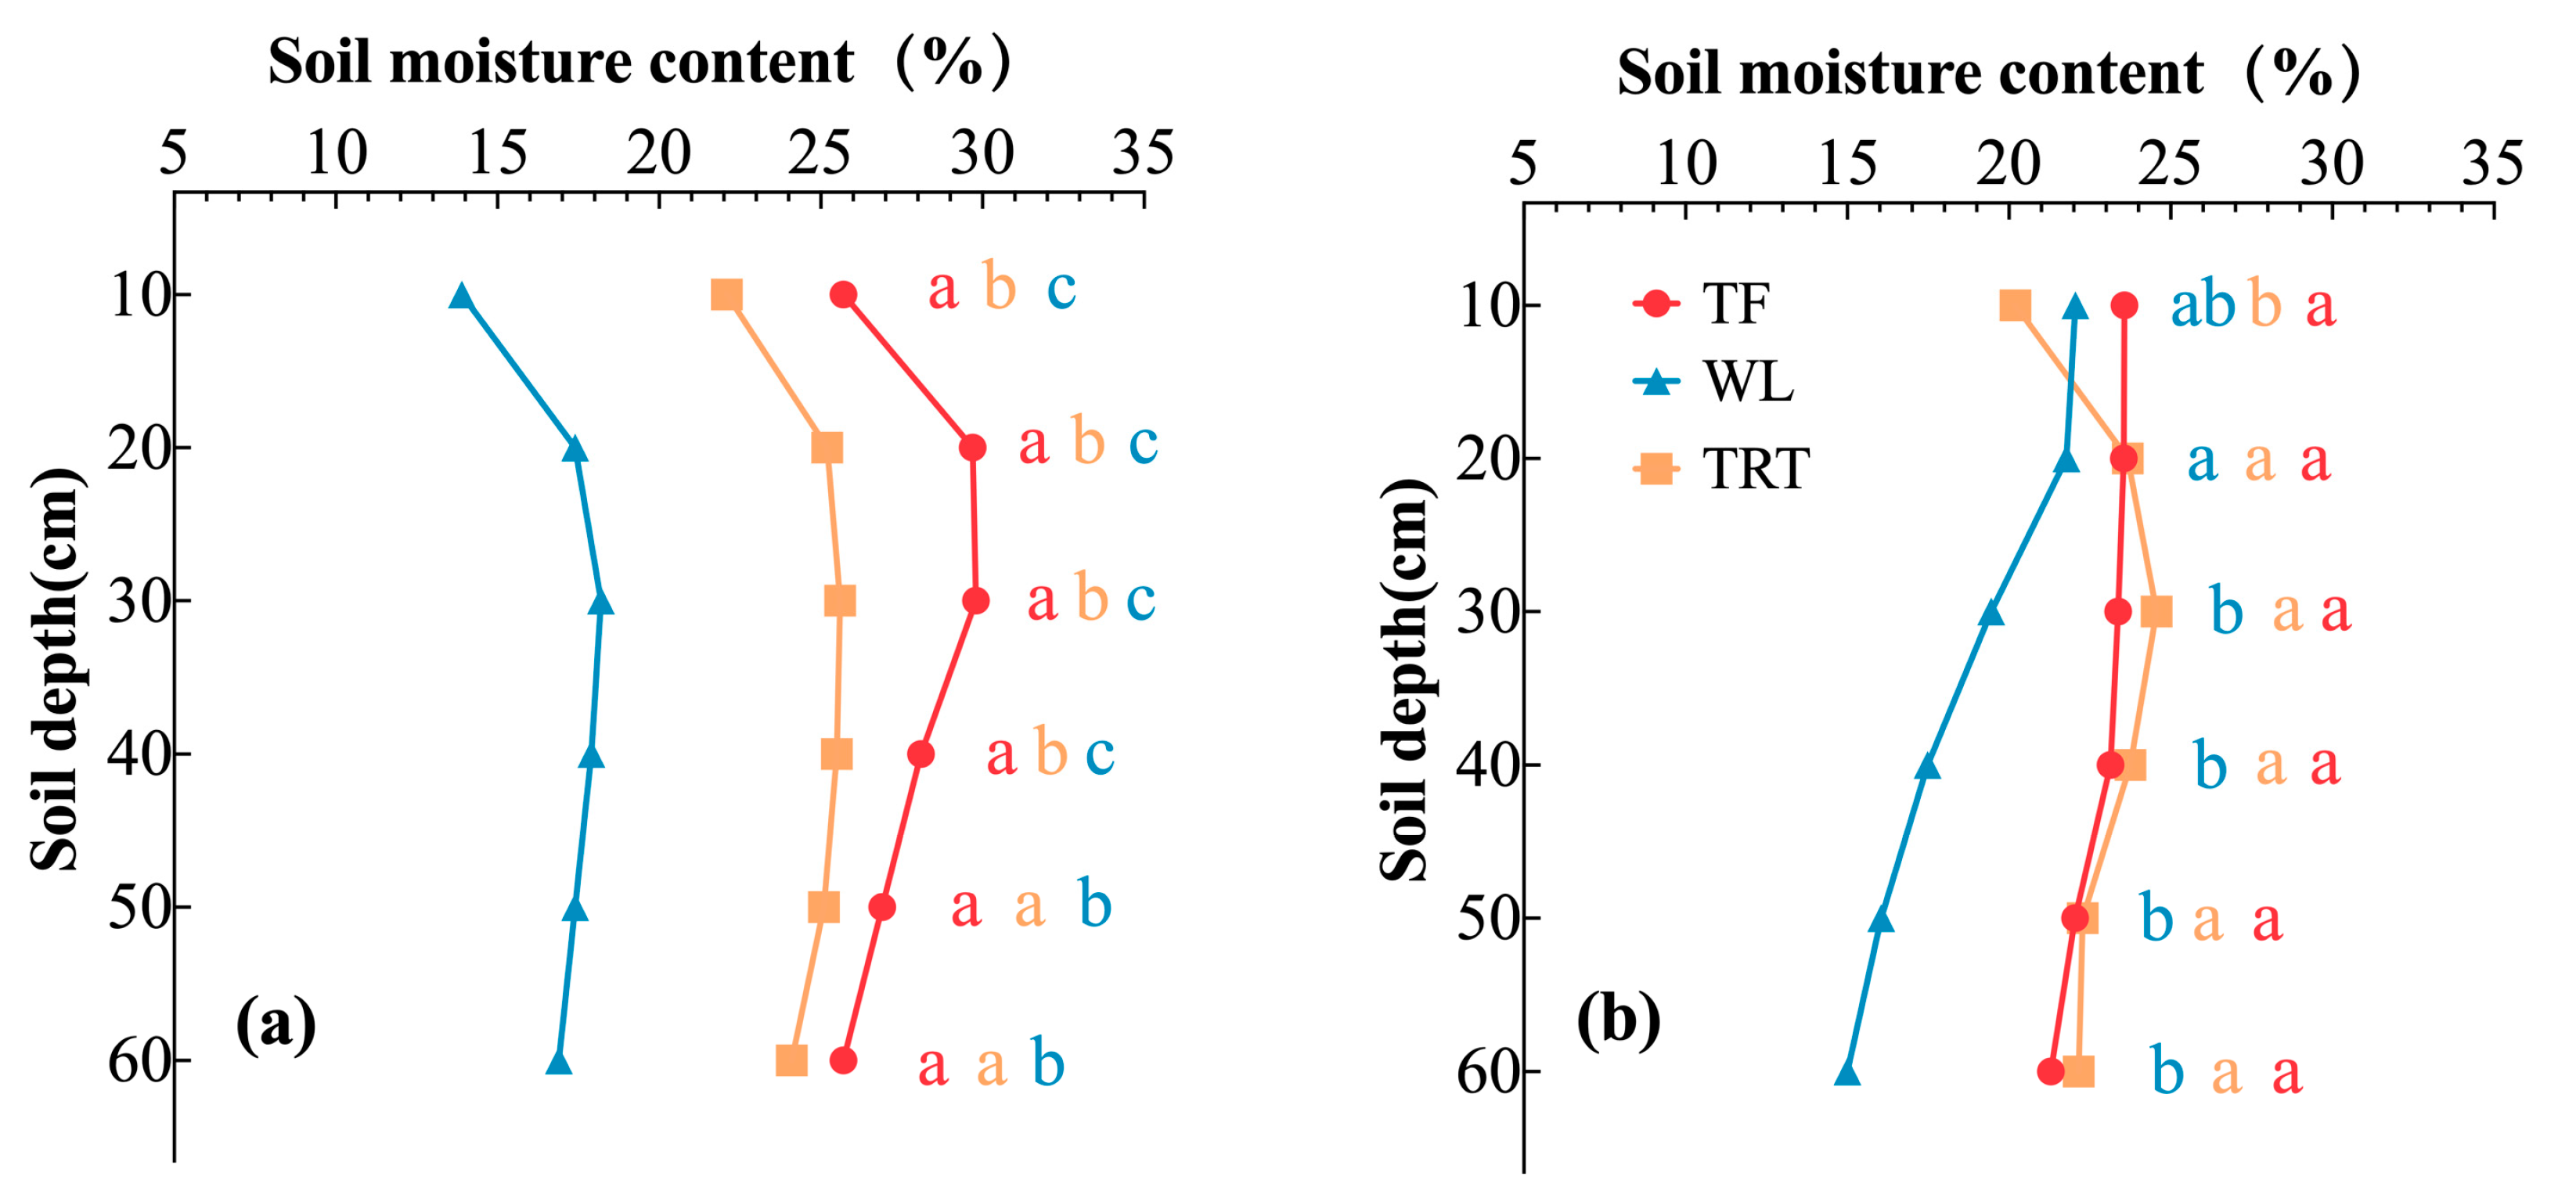
3.1. Characteristics of Soil Moisture under Different Land Use Types

In general, soil moisture is affected by land use type, vegetation, and seasonal climate conditions. Soil moisture content for different land use types is shown in Table 1. In the rainy season, among the 8 points along the slope, the soil moisture content of WL ranged from 10.02% to 21.82%, TRT ranged from 19.81% to 29.12%, and TF ranged from 23.35% to 33.70%. In the dry season, the soil moisture content of WL, TRT, and TF ranges ranged from 8.88% to 25.50%, 15.07% to 28.47%, and 18.85% to 26.92%, respectively. In both dry and rainy seasons, the soil moisture content of different land use types was in the order TF > TRT > WL. The lower soil moisture content of WL seems to be related to its vegetation type, Populus simonii × P. nigra, which has a high transpiration rate and can rapidly absorb soil moisture for growth and respiration, thereby lowering the soil moisture content. In terms of the variation, the three land use types were in the order WL > TRT > TF. It seems that WL is not effective in reducing the moisture redistribution by the slope, and comparatively, TF is more effective in reducing the moisture imbalance by the slope.
The vertical measurements of soil moisture for the different land use types are shown in Figure 3. In the rainy season, the soil moisture content of TRT, WL, and TF all reveal a tendency to increase and then decrease with the soil depth, with the maximum value appearing at 20–30 cm depth. In the 0–10 cm soil layer, the soil moisture of the three land use types was significantly lower than that of other soil depths. This is due to the infiltration of precipitation from the soil surface to the deep, along with strong evaporation in the summer. Compared with TRT, the water content of each soil layer in WL decreased by 8.17%, 7.76%, 7.45%, 7.65%, 7.79%, and 7.17%, while TF increased by 3.62%, 4.53%, 4.20%, 2.61%, 1.80%, and 1.58%, respectively.
In the dry season, the vertical distribution of soil moisture is more complex for different land types. Soil moisture in the 0–20 cm soil layers of WL remained stable and higher than at deeper depths. This may be related to high organic matter in the shallow layer and the crown shading effect of woodland trees inducing a lower evaporation rate. In the 20–60 cm soil layers, soil moisture content decreased rapidly due to the water absorption by roots for transpiration. The water content of TRT showed an increasing and then decreasing trend with the increase in depth. The soil moisture content of TF remained stable across the 0–60 cm soil layers, with a difference of less than 2% vertically. TF had significantly higher soil moisture at a depth of 10 cm than TRT, which may be related to the flattened slope produced by terracing and the lower solar elevation angle during the dry season: these factors effectively reduce evaporation for TF.

3.2. Spatial Variation Characteristics of Soil Moisture under Different Slope Positions

Vegetation type, land use type, and season significantly affect soil moisture content changes along the slope (Figure 4). In the rainy season, the soil moisture content of the 0–60 cm layers at all slope positions of TF is higher than that of WL and TRT. The soil moisture content of the TF slopes from the top position to the bottom shows an overall trend of decreasing and then slightly increasing. The lowest moisture content is at slope position 5, and the moisture content at positions 1 to 4 is significantly higher than that at positions 5 to 8. The pattern of soil moisture content along the slope of TRT is similar to that of TF, albeit lower, with the lowest moisture content at slope position 4. By contrast, the soil moisture content of the WL slope is still lower and sows an overall trend of gradual increase; the lowest moisture content is at slope position 2.
Due to the influence of factors such as precipitation, evaporation rate, and vegetation, the soil moisture variation across slopes is significantly smaller in the dry season than in the rainy season. In the dry season, the soil moisture content along the slopes of TF from top to bottom shows a trend of initial decrease followed by a slight increase, reaching the lowest value at slope position 4. Overall, the change trend of soil moisture along the TF slope is consistent with that of the TRT, but the changes between adjacent slope positions are smaller. The soil moisture content of the WL slope decreases from slope positions 1 to 2 and 4 to 7, interrupted by small increases. The soil moisture content along the slope of TRT from top to bottom decreases from position 1 to 3, then increases to position 7, with a slight decrease at slope position 8.

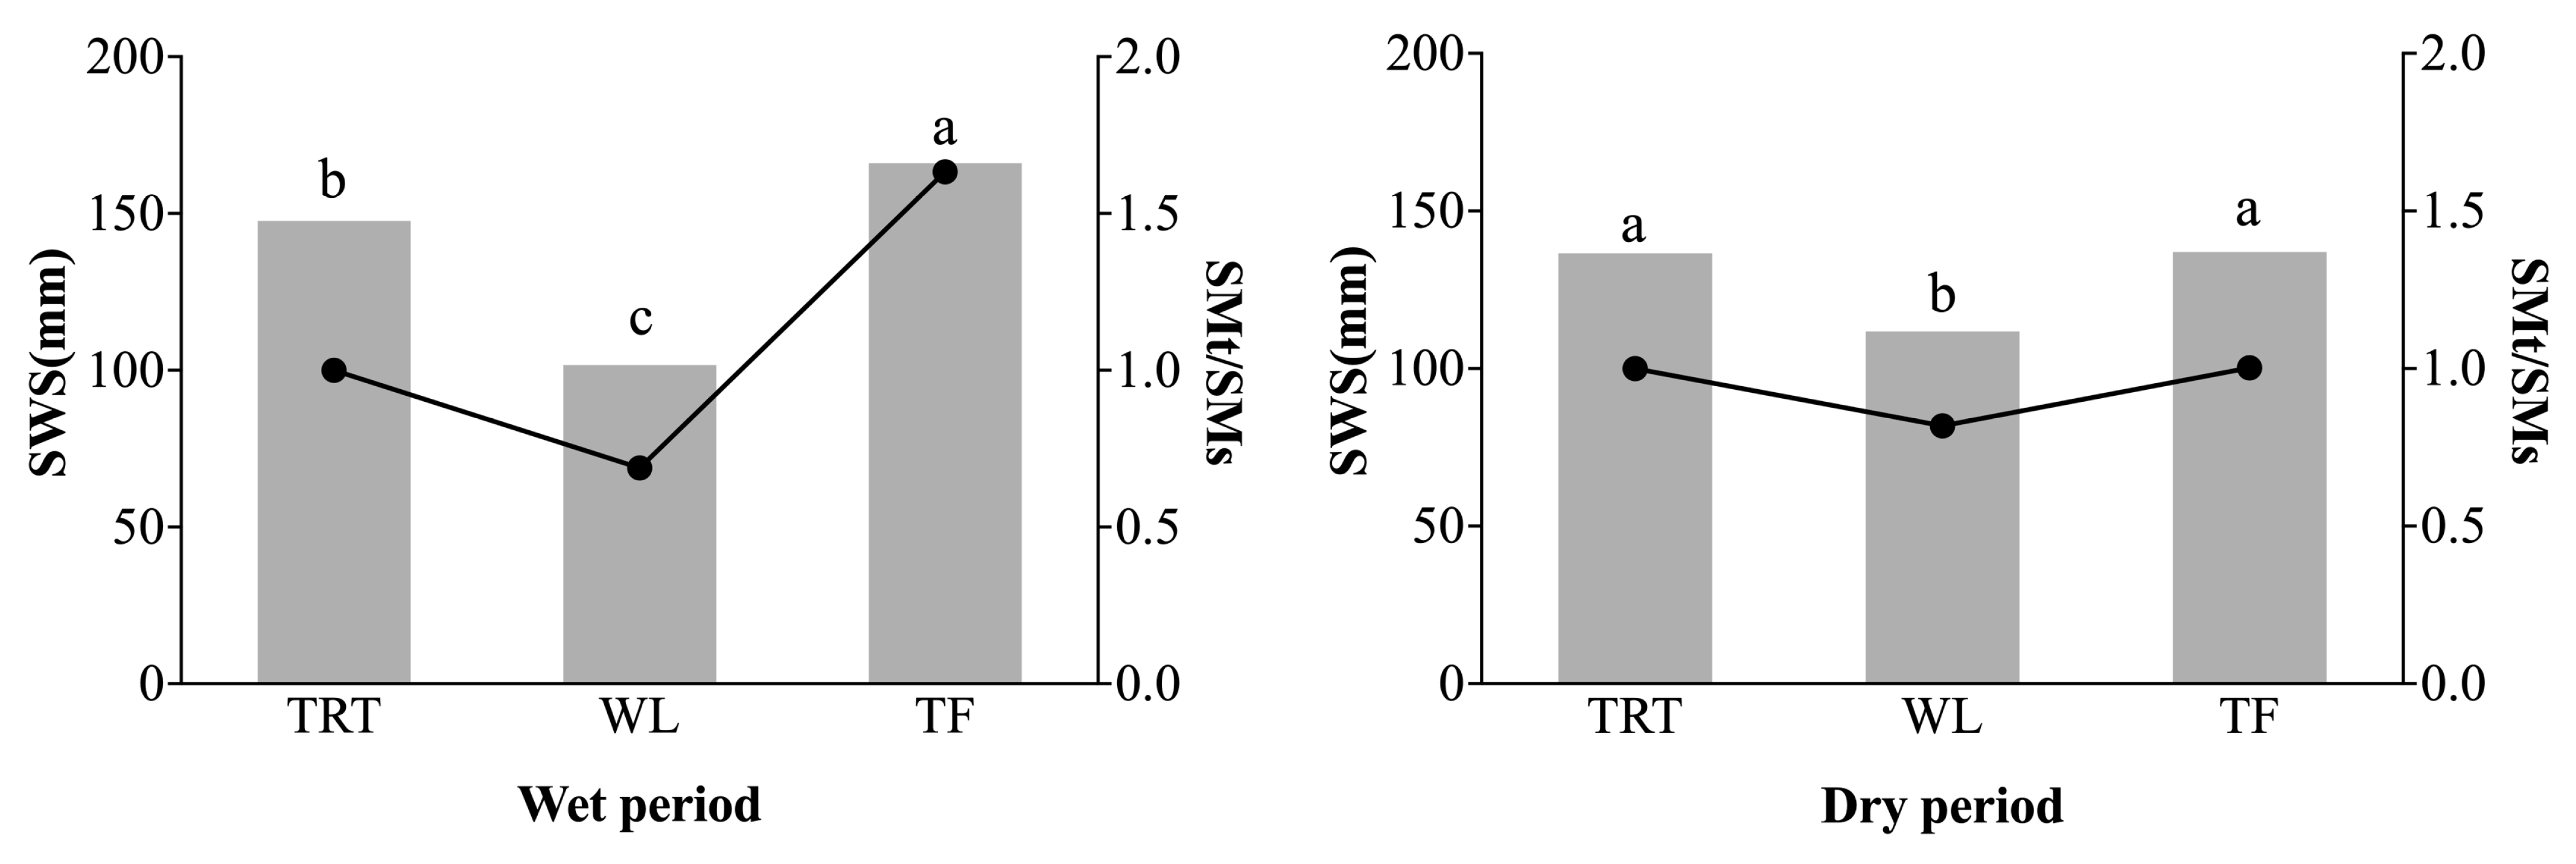
3.3. Differences in Soil Water Storage among Different Land Use Types

The changes in soil water storage (SWS) over two seasons on slopes of different land use types are closely related to precipitation, with the SWS of TRT and TF greater in the rainy season than the dry season but that of WL less in the rainy season than the dry season (Figure 5). In the rainy season, there were significant differences among the SWS of the three land cover types, with TF (166.02 mm) > TRT (147.67 mm) > WL (101.69 mm). During the dry season, the SWS of WL increased to 111.82 mm, an increase of 10.13 mm, while the SWS of TRT and TF decreased to 136.62 mm and 136.98 mm, decreases of 11.05 mm and 29.04 mm, respectively. Although the difference between TF and TRT was not significant, their dry season SWS was still significantly higher than that of WL (p < 0.05).
To visually compare the moisture benefits of different land use types, this study followed Wei’s method [40], which calculates the benefit of terracing.A δ-value of 1 serves as a threshold for the impact of moisture benefit: if the δ value is greater than 1, the land use type is considered to have a positive effect on soil moisture conservation; if the δ value is less than 1, there may be a negative effect. Taking the SWS of TRT as the control land use type, the δ values of WL and TF slopes were 0.69 and 1.14 in the rainy season and 0.82 and 1.01 in the dry season, respectively. The δ values of WL were less than 1 in both dry and rainy seasons, while the δ values of TRT were greater than 1 in both seasons. This indicated that TF had a better water retention capacity than both WL and TRT and that the water retention capacity of WL was poorer than that of TRT.
The slope variation in SWS in different land types is consistent with the trend of soil moisture variation along the slope. To facilitate the comparison of soil water benefits in different slope positions for different land use types, the SWS of TRT at the same slope position was used as a control to compare the δ values of TF and WL at various slope positions (Figure 6). During the rainy season, the δ values of TF at all slope positions were greater than 1, indicating that TF showed good water storage capacity at different slope positions, with significantly higher water benefits at positions 2 to 4 compared to other positions. The rainy season δ values of WL at all slope positions were less than 1, indicating that WL had poor water storage capacity during the rainy season. The water benefit of WL generally showed a trend of first decreasing, then increasing, and finally stabilizing. The water benefit of WL significantly improved along the slope, with better water benefits at positions 4–8. During the dry season, the δ values of TF were slightly lower than their corresponding positions in the TRT field except for positions 2, 3, and 8. During the dry season, the δ values of WL were less than 1 except at position 3.

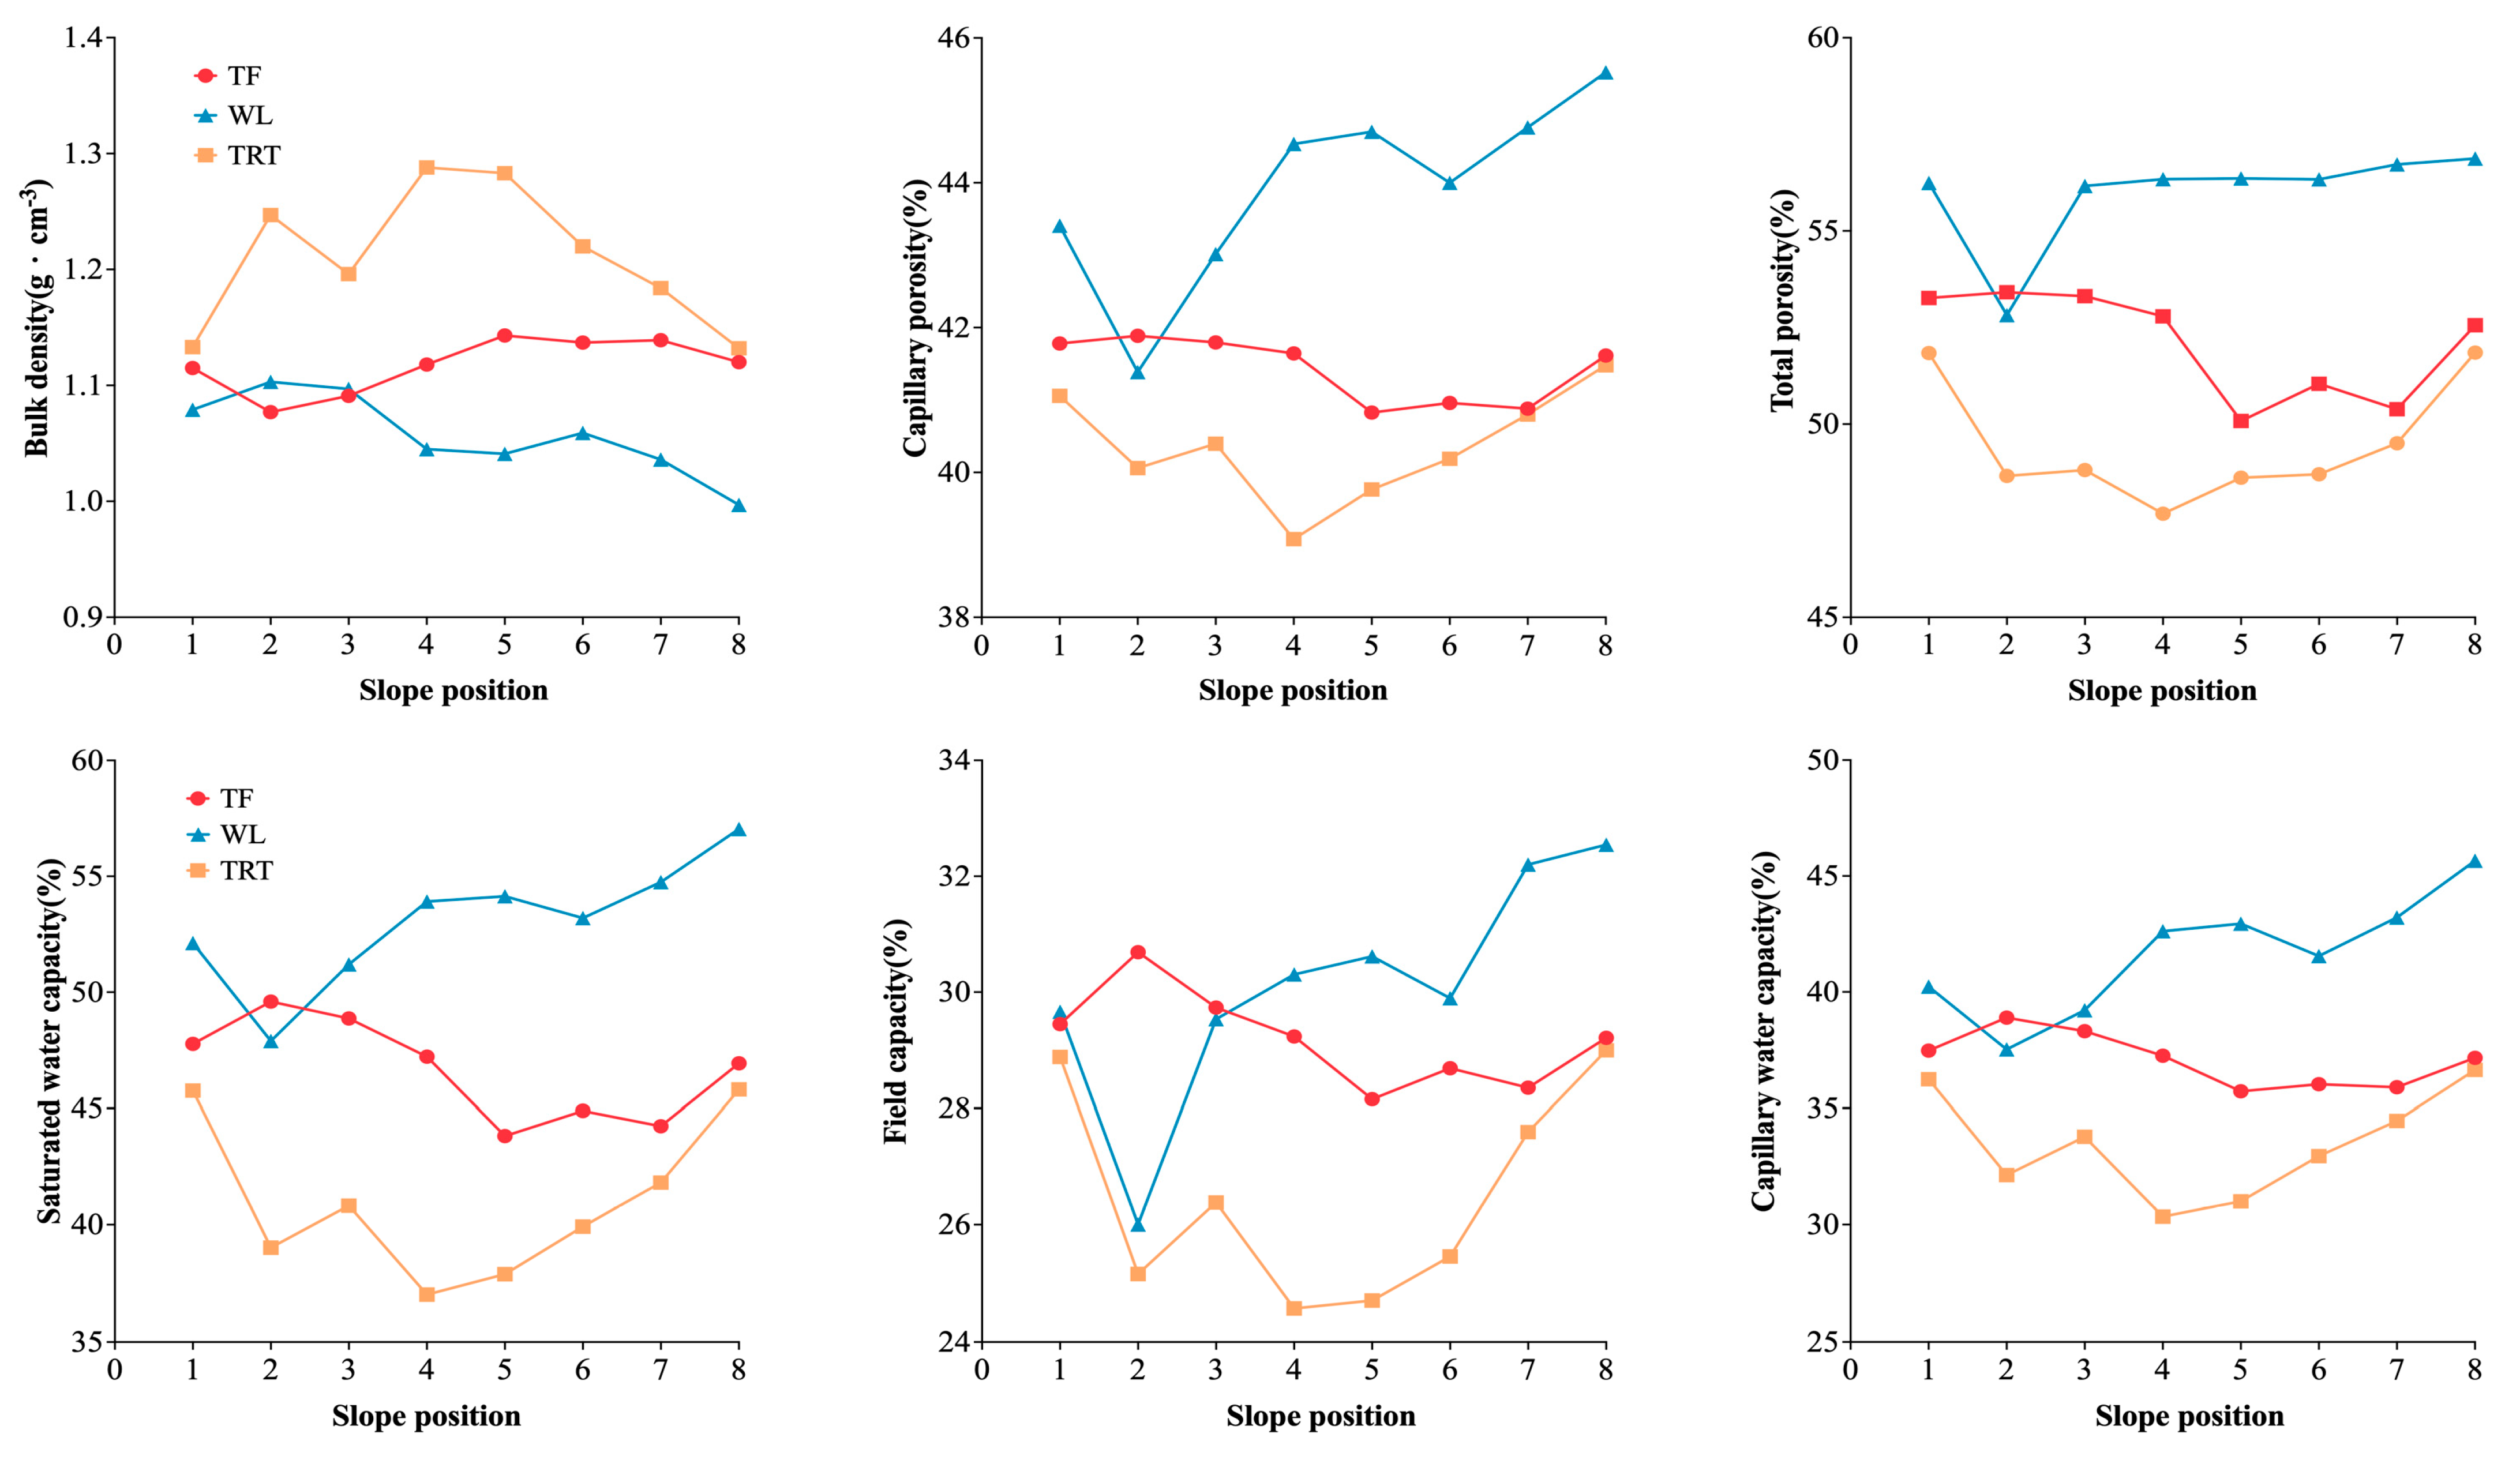
3.4. Differences in Physical Properties among Land Use Types

Soil bulk density is an important physical indicator in soil, reflecting the soil’s porosity, infiltration capacity, and water-holding capacity, which affects the generation of slope runoff and the soil erosion process. Among the different land use types, slope bulk density is greatest on TRT fields and lowest overall on WL slopes (Figure 7). The soil bulk density of WL slopes ranged from 1.00 g/cm3 to 1.10 g/cm3, showing an overall trend of first increasing and then gradually decreasing with the lowering of slope positions, with the highest bulk density at slope position 2. The soil bulk density of TF slopes varied between 1.08 g/cm3 and 1.14 g/cm3, showing a trend of first decreasing, then increasing and finally stabilizing along the slope. The soil bulk density of slope TRT ranged from 1.13 g/cm3 to 1.29 g/cm3, showing a trend of radically climbing to a peak at position 4 and then continually decreasing to position 8.
The comparison of the slope of the mean values of capillary porosity, total porosity, field water capacity, capillary water capacity, and saturated water capacity for the three land use types showed that WL performed the best, followed by TF, with TRT performing the worst. Compared to TRT, the measures of capillary porosity, total porosity, field water capacity, capillary water capacity, and saturated water capacity for TF were higher by 1.07%, 2.65%, 5.66%, 2.72%, and 3.65%, respectively. For WL, these indicators were higher by 3.56%, 6.52%, 12.03%, 3.63%, and 8.18%, respectively. Within the same land use type, the pattern of variation in these five indices on the slope was generally similar. For WL, the overall trend was a decrease followed by an increase. For TRT, the trend was a general decrease from slope positions 1 to 4, followed by a continuous increase from slope positions 5 to 8. For TF, the trend was an initial increase, followed by a decrease, and then a gradual increase.
By comparing the soil moisture content (Figure 4) and physical properties (Figure 7) of different land use types, this study found that the variation in soil moisture content along the slope for the same land use type was consistent with the trends of several soil physical indicators (capillary porosity, total soil porosity, field water capacity, capillary water capacity, and saturated water capacity), but ran counter to the trend of soil bulk density. The correlation between soil properties and moisture content varies among different land use types. Compared to the TRT slope cropland, all six soil property indicators in TF were improved, and soil moisture content also increased. On the other hand, although WL had the best overall soil properties, its soil moisture content remained at a relatively low level, mainly due to the strong transpiration effect of woodlands.

4. Discussion

4.1. Analysis of Differences in Soil Moisture Content and Moisture Benefits among Different Land Use Types

Land use types influence factors such as vegetation interception, soil infiltration capacity, and evaporation [41], thereby altering hydrological conditions and runoff generation mechanisms [42], which directly affect the spatial and temporal distribution patterns of soil moisture. This study shows that the soil moisture content on slopes of the three land use types in the northeastern black soil region during the dry and rainy seasons generally follows the order of TF > TRT > WL, consistent with previous research findings [43,44]. The soil moisture content in farmland is higher than in WL because TF and TRT use contour tillage, which can effectively intercept surface runoff, reduce soil erosion, and increase soil water infiltration and retention.
The relatively high soil moisture content in TF during both dry and rainy seasons is mainly due to the construction of terraces, which alter the surface morphology, reduce the slope gradient and surface runoff velocity, improve soil properties, and increase soil water infiltration time, allowing more rainfall to infiltrate and become soil moisture. This is consistent with the findings of Fiorucci et al. [45].
The soil moisture content in WL is significantly lower than in other types, mainly for two reasons: first, the intense transpiration of Populus simonii × P. nigra (pioneer tree species) requires more water, leading to high water demand [46]; second, different levels of leaf cover and litter cover also affect soil moisture distribution. The canopy and surface humus of WL both serve to reduce the amount of rainfall entering the soil by intercepting precipitation and slowing infiltration [47].
The physical properties of soil are key factors affecting soil permeability and water retention capacity [48]. In this study, the soil bulk density of the three land use types was found to be WL < TF < TRT, while capillary porosity, total porosity, field water capacity, capillary water capacity, and saturated water capacity were WL > TF > TRT. This indicates that WL soil is loose and well-aerated, with a better soil structure than the other land use types, consistent with the findings of Moges et al. [49] and Ciric et al. [50] on the impact of land use types on soil quality. WL has a complex root system and a natural litter layer composed of fallen leaves, which reduces soil bulk density and increases aeration, improving soil physical properties [51]. The bulk density and porosity of farmland are relatively low for two reasons: first, human trampling and mechanical interference cause soil compaction, increasing bulk density and reducing porosity, thereby affecting soil quality; second, repeated tillage in farmland leads to degradation of the soil structure over time. The bulk density and porosity of TF are higher than those of TRT, which is related to the alteration of the microtopography by terraces, reducing surface runoff erosion.
The soil moisture content and soil quality of the three land use types did not exhibit a consistent relationship. WL had the best soil properties but the lowest soil moisture content, while TF had the highest soil moisture content despite having soil properties inferior to those of WL. This is because the dead leaves layer and the root system in WL increase the soil’s organic matter, improving its structure and physical properties [52,53]. However, the intense transpiration in woodlands leads to a water deficit [54], which decreases soil moisture content. Terracing reduces soil erosion and improves soil quality by altering the microtopography, which helps redistribute rainfall and increase moisture retention on the TF slopes [55].
Soil water storage plays a crucial role in assessing water conservation functions and is, therefore, an important consideration for the revegetation of degraded lands and ecological restoration projects [56]. This study found that the soil water storage and δ values at 0–60 cm for different land use types follow the same ranking pattern as soil moisture content, consistent with the findings of Wang et al. [57] in their study on woodland water storage in northwest Shanxi, China. TF exhibits excellent soil water retention capacity in both rainy and dry seasons. Their structure helps to slow down runoff, promote water infiltration and retention in the soil, enhance soil moisture during dry periods, and reduce erosion during the rainy season [58]. Woodland (WL), on the other hand, has reduced overall water benefits due to its root system absorbing and consuming a large amount of soil moisture [46].
In the northeastern black soil region, due to the lack of irrigation measures and the deep burial of groundwater, precipitation is the main source of soil moisture, influencing the region’s water dynamics. This study found that the water storage of TRT and TF is higher in the rainy season than in the dry season, while the opposite is true for WL. The highest water storage in TF and TRT during the rainy season is due to the concentration of precipitation in July, coupled with high temperatures. Vegetation enters its peak growth period, enhancing soil evaporation and plant transpiration. At this time, the infiltration of water during precipitation exceeds the evaporation consumption of vegetation, and the excess infiltrated water moves to deeper layers due to gravitational and matric potentials. In the dry season, the water storage of TRT and TF decreases due to the reduction in precipitation in October and the onset of the crop maturity period, when crop harvest exposes the soil surface, increasing evaporation.
The low water storage in WL during the rainy season is mainly due to two reasons: first, the high vegetation coverage in WL, where canopy interception reduces the amount of rainfall reaching the ground, thereby reducing surface water accumulation [59]; second, the high transpiration rate of trees in WL, which consumes more water through evapotranspiration than crops [60]. In the dry season, the water storage in woodland increases as trees enter their dormant period, slowing down physiological processes. After meeting their consumption needs, the excess rainfall is stored in the soil.

4.2. Analysis of Spatial Variations in Soil Moisture by Slope Position

At the slope scale, slope positions significantly affect the redistribution of water by altering its movement in the soil [61]. This study found that TFs delayed soil erosion and deposition on long slopes and increased soil moisture at various slope positions, with more significant improvements in steeper areas. TFs have a higher soil moisture content as their construction converts natural slopes into stepwise slopes, forming a stepped terrain that facilitates deep soil moisture infiltration. The open and flat terrain atop each terrace step aids in rainwater collection. This is similar to the findings of Han et al. [62], who studied the infiltration characteristics of TRT and TFs under different rainfall durations. They pointed out that under the same rainfall conditions, terraces can reduce runoff and increase water infiltration and content.
The lowest soil moisture points on the slopes of TF and TRT are influenced by the dynamics of water movement. During erosion–deposition processes on long slopes, erosion slows down after reaching a certain stage. This position is a transition point for soil moisture erosion and deposition along the slope, affecting soil structure and porosity, thereby reducing soil moisture content at this slope position. In both dry and rainy seasons, the lowest soil moisture position in TF is lower than that in TRT. This is because, on natural slopes, water flows downward more quickly, and without the barriers of terraces to slow it down, the rapid flow tends to cause erosion at the upper slope positions. The greater soil moisture content at TF slopes 1–4 than at slopes 5–8 is related to the topography of the study area. The upper part of the area is steeper, and although the higher slopes may lead to an increase in surface runoff [63], the terraces intercept rainfall through the more horizontal platforms so that more precipitation is intercepted on the horizontal steps, allowing it to be efficiently trapped and infiltrated into the soil.
The lowest water content in WL was found at slope position 2, which is related to poorer soil quality at this position. Aside from this slope position, the pattern of water movement in WL is consistent with natural slope water movement patterns, and no erosion or deposition phenomena were observed. This is influenced by the ability of forest vegetation and its litter to intercept precipitation, preventing raindrops from directly hitting the ground, significantly reducing the falling speed of raindrops, and effectively weakening the kinetic energy of raindrop impact on the surface, thus controlling slope erosion [64]. In addition, the interception by litter also reduces the intensity of runoff, weakening the potential soil erosion caused by heavy rainfall [65].
This study also found that the soil moisture uniformity on WL and TF slopes is high during the dry season. Terraces mitigate the impact of slope positions on moisture [66]; their horizontal step-like structure helps intercept and accumulate water, effectively slowing down the runoff speed, allowing more water to stay at each slope position, making soil moisture distribution more uniform and maintaining a relatively balanced state of soil moisture on terraced slopes [67].

5. Conclusions

This study investigated the soil moisture and physical properties of three land use types and different slope positions in China’s northeastern black soil region, yielding the following conclusions:
(1)
In both the dry and rainy seasons, the soil moisture content and SWS in the 0–60 cm soil layer were highest in TF, followed by TRT, and lowest in WL. In terms of soil physical properties (such as bulk density, porosity, and water-holding capacity), WL performed better than TF, while TRT performed the worst. In general, there is a complex relationship between soil moisture and physical properties, which varies with different land use types (vegetation cover and terrain adjustments).
(2)
The soil moisture content and water storage in the dry season for WL were significantly higher, while those for TRT and TF were significantly lower than in the rainy season. Compared to the rainy season, the soil moisture content in WL increased by 1.69%, and water storage increased by 10.13 mm, whereas in TF and TRT, soil moisture content decreased by 1.84% and 4.84%, and water storage decreased by 11.05 mm and 29.04 mm, respectively, in the dry season.
(3)
The impact of land use types on soil moisture content is more pronounced in the rainy season than in the dry season. In the rainy season, there are significant differences in soil moisture content in the 0–40 cm soil layer among the three land use types; in the 40–60 cm soil layer, while the difference between TRT and TF decreases, the difference between the farmland types and WL is still significant. In the dry season, the impact is mainly concentrated in the 30–60 cm soil layer. Although there is no obvious difference between TF and TRT, the difference between the farmland types and WL gradually increases at deeper soil layers.
(4)
Both TRT and TF exhibit a trend of decreasing and then slightly increasing soil moisture along the slope during the dry and rainy seasons. Among them, TF consistently shows higher soil moisture content and SWS at all slope positions compared to TRT and WL. TF effectively improves soil quality, reduces erosion and sedimentation, and shifts the lowest water level point downslope. In the rainy season, WL shows a gradual increase in soil moisture along the slope. The moisture differences between TRT and WL at various slope positions diminish during the dry season.
Terraced fields have significant advantages in water resource storage and soil erosion control, effectively modulating the moisture configuration and making them especially suitable for steeper slopes. Woodlands improve soil quality by enhancing soil structure, but excessive planting of forest vegetation on slopes may lead to soil moisture deficits. In the black soil region, combining woodlands and terraced fields can rationally optimize slope configurations, improving soil quality and the ecological environment. These findings provide a scientific basis and practical guidance for local land management and agricultural production, with important practical significance.

Author Contributions

Conceptualization, Z.Z. and B.L.; methodology, Z.Z. and G.W.; software, Z.Z.; validation, Z.Z., Y.Z., Y.Z., B.L. and Y.F.; formal analysis, Z.Z.; investigation, Z.Z., Z.D., M.C., W.Z., W.H. and G.W.; data curation, Z.Z.; writing—original draft preparation, Z.Z.; writing—review and editing, B.L. and M.H.; cartography, W.H.; funding acquisition, B.L. All authors have read and agreed to the published version of the manuscript.

Funding

This research was funded by the National Key Research and Development Program of China, grant number 2021YFD1500705.

Institutional Review Board Statement

Not applicable.

Data Availability Statement

The data presented in this study are available on request from the corresponding author.

Conflicts of Interest

The authors declare no conflicts of interest.

References

  1. Bochet, E. The fate of seeds in the soil: A review of the influence of overland flow on seed removal and its consequences for the vegetation of arid and semiarid patchy ecosystems. Soil 2015, 1, 131–146. [Google Scholar] [CrossRef]
  2. Chen, L.D.; Huang, Z.L.; Gong, J.; Fu, B.J.; Huang, Y.L. The effect of land cover/vegetation on soil water dynamic in the hilly area of the loess plateau, China. Catena 2007, 70, 200–208. [Google Scholar] [CrossRef]
  3. Shi, H.; Shao, M. Soil and water loss from the Loess Plateau in China. J. Arid Environ. 2000, 45, 9–20. [Google Scholar] [CrossRef]
  4. Wang, Y.Q.; Shao, M.A.; Zhang, C.C.; Han, X.W.; Mao, T.X.; Jia, X.X. Choosing an optimal land-use pattern for restoring eco-environments in a semiarid region of the Chinese Loess Plateau. Ecol. Eng. 2015, 74, 213–222. [Google Scholar] [CrossRef]
  5. Zou, W.; Han, X.; Li, L.; Wang, F. Study on Soil Moisture Characteristic of Different Land Use Types in Black Soil. J. Soil Water Conserv. 2009, 23, 236–239. [Google Scholar]
  6. Rosenbaum, U.; Bogena, H.R.; Herbst, M.; Huisman, J.A.; Peterson, T.J.; Weuthen, A.; Western, A.W.; Vereecken, H. Seasonal and event dynamics of spatial soil moisture patterns at the small catchment scale. Water Resour. Res. 2012, 48, 22. [Google Scholar] [CrossRef]
  7. Zhu, W.; Niu, J.; Liu, G.; Liang, H. The influence of vegetation types on the soil moistures during growing season in Loess area. J. Arid Land Resour. Environ. 2016, 30, 152–156. [Google Scholar]
  8. Ding, B.B.; Zhang, J.M.; Zheng, P.F.; Li, Z.D.; Wang, Y.S.; Jia, G.D.; Yu, X.X. Water security assessment for effective water resource management based on multi-temporal blue and green water footprints. J. Hydrol. 2024, 632, 14. [Google Scholar] [CrossRef]
  9. Gao, H.; Guo, S.; Liu, W.; Li, M.; Zhang, J. Spatial Variability of Soil Water Retention Curve under Fertilization Practices in Arid-highland of the Loess Plateau. Trans. Chin. Soc. Agric. Mach. 2014, 45, 161–165. [Google Scholar]
  10. Zhao, H. Discussion on comprehensive practical technology of water storage and water saving in dry farming in Taihang Mountain Area. Chin. Agric. Sci. Bull. 2002, 18, 77–79. [Google Scholar]
  11. Shi, Z.; Zhu, H.; Chen, J.; Fang, N.; Ai, L. Spatial heterogeneity of soil moisture and its relationships with environmental factors at small catchment level. Chin. J. Appl. Ecol. 2012, 23, 889–895. [Google Scholar]
  12. Moradi, A.; Sung, C.T.B.; Goh, K.J.; Hanif, A.H.M.; Ishak, C.F. Effect of four soil and water conservation practices on soil physical processes in a non-terraced oil palm plantation. Soil Tillage Res. 2015, 145, 62–71. [Google Scholar] [CrossRef]
  13. Cantón, Y.; Solé-Benet, A.; Domingo, F. Temporal and spatial patterns of soil moisture in semiarid badlands of SE Spain. J. Hydrol. 2004, 285, 199–214. [Google Scholar] [CrossRef]
  14. Guo, X.X.; Fu, Q.; Hang, Y.H.; Lu, H.; Gao, F.J.; Si, J.B. Spatial Variability of Soil Moisture in Relation to Land Use Types and Topographic Features on Hillslopes in the Black Soil (Mollisols) Area of Northeast China. Sustainability 2020, 12, 3552. [Google Scholar] [CrossRef]
  15. Huo, A.; Zhao, Z.; Luo, P.; Zheng, C.; Peng, J.; Abuarab, M.E.-S. Assessment of spatial heterogeneity of soil moisture in the critical zone of gully consolidation and highland protection. Water 2022, 14, 3674. [Google Scholar] [CrossRef]
  16. Shen, H.; Xin, Z.; Wang, Z. Spatial and temporal dynamics of soil moisture and its influencing factors on the slope of Platycladus orientalis in Beijing mountain area. Acta Ecol. Sin. 2021, 41, 2676–2686. [Google Scholar]
  17. Ajami, M.; Heidari, A.; Khormali, F.; Zeraatpisheh, M.; Gorji, M.; Ayoubi, S. Spatial Variability of Rainfed Wheat Production Under the Influence of Topography and Soil Properties in Loess-Derived Soils, Northern Iran. Int. J. Plant Prod. 2020, 14, 597–608. [Google Scholar] [CrossRef]
  18. Bai, Y.; Shao, M. Temporal stability of soil water storage on slope in rain-fed region of Loess Plateau. Trans. Chin. Soc. Agric. Eng. 2011, 27, 45–50. [Google Scholar]
  19. An, W.; Han, X.; Li, Z.; Wang, S.; Wu, X.; Lv, Y.; Liu, G.; Fu, B. Effects of different vegetation restoration types on the slope difference of soil water content in the Loess Plateau, China. Acta Ecol. Sin. 2018, 38, 4852–4860. [Google Scholar]
  20. Li, X.; Liu, M.; Lu, S.; Wang, W.; Yi, J.; Wan, J. Spatial Distribution Characteristics of Soil Moisture on Tea Garden Slope and Its Response to Rainfall Replenishment in the Three Gorges Reservoir Area. J. Soil Water Conserv. 2023, 37, 137–144. [Google Scholar]
  21. Yin, D.; Song, X.; Zhu, X.; Guo, H.; Zhang, Y.; Zhang, Y. Spatiotemporal Analysis of Soil Moisture Variability and Its Driving Factor. Remote Sens. 2023, 15, 5768. [Google Scholar] [CrossRef]
  22. Farahani, S.S.; Fard, F.S.; Asoodar, M.A. Effects of contour farming on runoff and soil erosion reduction: A review study. Elixir Agric. 2016, 101, 44089–44093. [Google Scholar]
  23. Chen, X.W.; Liang, A.Z.; Jia, S.X.; Zhang, X.P.; Wei, S.C. Impact of tillage on physical characteristics in a Mollisol of Northeast China. Plant Soil Environ. 2014, 60, 309–313. [Google Scholar] [CrossRef]
  24. Tang, M.; Zhang, C.; Gao, X.; Wu, P. Effects of Different Land Use Patterns on Soil Water in Loess Hilly and Gully Regions of China. Plants 2022, 12, 21. [Google Scholar] [CrossRef] [PubMed]
  25. Hengl, T.; Heuvelink, G.B.M.; Rossiter, D.G. About regression-kriging: From equations to case studies. Comput. Geosci. 2007, 33, 1301–1315. [Google Scholar] [CrossRef]
  26. Zhu, H.D.; Shi, Z.H.; Fang, N.F.; Wu, G.L.; Guo, Z.L.; Zhang, Y. Soil moisture response to environmental factors following precipitation events in a small catchment. Catena 2014, 120, 73–80. [Google Scholar] [CrossRef]
  27. Han, J.; Duan, X.; Zhao, Y.; Xiong, H. Spatial and Temporal Variability of Soil Moisture on Sloping Lands of Different Land Use Types in a Dry-hot Valley. J. Soil Water Conserv. 2017, 31, 129–136. [Google Scholar]
  28. Fu, T.; Gao, Y.; Liu, L.; Gao, H.; Qi, F.; Wang, F.; Liu, J. Factors influencing soil water content during dry period in the middle part of the Taihang Mountain. Chin. J. Eco-Agric. 2022, 30, 1054–1063. [Google Scholar]
  29. Wen, L.; Xu, H.; Qin, W.; Xu, W. Preservation Status and Problems of Key Soil and Water Conservation Projects in Black Soil Region of Northeast China. Bull. Soil Water Conserv. 2023, 43, 417–423. [Google Scholar]
  30. Zhang, G.; Yang, Y.; Liu, Y.; Wang, Z. Advances and Prospects of Soil Erosion Research in the Black Soil Region of Northeast China. J. Soil Water Conserv. 2022, 36, 1–12. [Google Scholar]
  31. Zhang, X.; Liang, A.; Shen, Y.; Li, W.; Zhang, X.; Wang, Y.; Xie, Y.; Liu, F.; Yang, X. Erosion Characteristics of Black Soils in Northeast China. Sci. Geogr. Sin. 2006, 26, 687–692. [Google Scholar]
  32. Rasheed, M.W.; Tang, J.L.; Sarwar, A.; Shah, S.; Saddique, N.; Khan, M.U.; Khan, M.I.; Nawaz, S.; Shamshiri, R.R.; Aziz, M.; et al. Soil Moisture Measuring Techniques and Factors Affecting the Moisture Dynamics: A Comprehensive Review. Sustainability 2022, 14, 11538. [Google Scholar] [CrossRef]
  33. Bouchoms, S.; Wang, Z.G.; Vanacker, V.; Van Oost, K. Evaluating the effects of soil erosion and productivity decline on soil carbon dynamics using a model-based approach. Soil 2019, 5, 367–382. [Google Scholar] [CrossRef]
  34. Xu, Y.; Wang, J.; Cai, S.; Zhou, M. Spatial variability of soil moisture in horizontal terrace on slightly sloping land. Trans. Chin. Soc. Agric. Eng. 2008, 24, 16–19. [Google Scholar]
  35. Wang, Y.; Jiao, L.; Zhao, F. The Soil Moisture Determination and Analysis in The Summer in the Ebinur Lake Basin. J. Xinjiang Norm. Univ. (Nat. Sci. Ed.) 2011, 30, 4–8. [Google Scholar]
  36. Zou, W.; Jiang, B.; Gu, L. Measurement of Soil Moisture Constants. J. China Hydrol. 2015, 35, 62–66. [Google Scholar]
  37. Zeng, H.H.; Wu, J.N.; Zhu, X.A.; Singh, A.K.; Chen, C.F.; Liu, W.J. Jungle rubber facilitates the restoration of degraded soil of an existing rubber plantation. J. Environ. Manag. 2021, 281, 11. [Google Scholar] [CrossRef] [PubMed]
  38. Liu, D.; Li, W. A simple method for determining soil bulk density and porosity. Chin. J. Soil Sci. 1983, 27, 44–47. [Google Scholar]
  39. Zhang, Y.W.; Shangguan, Z.P. The change of soil water storage in three land use types after 10 years on the Loess Plateau. Catena 2016, 147, 87–95. [Google Scholar] [CrossRef]
  40. Wei, W.; Chen, D.; Wang, L.X.; Daryanto, S.; Chen, L.D.; Yu, Y.; Lu, Y.L.; Sun, G.; Feng, T.J. Global synthesis of the classifications, distributions, benefits and issues of terracing. Earth-Sci. Rev. 2016, 159, 388–403. [Google Scholar] [CrossRef]
  41. Ghorbani, M.; Amirahmadi, E.; Konvalina, P.; Moudry, J.; Kopecky, M.; Hoang, T.N. Carbon Pool Dynamic and Soil Microbial Respiration Affected by Land Use Alteration: A Case Study in Humid Subtropical Area. Land 2023, 12, 459. [Google Scholar] [CrossRef]
  42. Yang, S.; Kang, T.T.; Bu, J.Y.; Chen, J.H.; Gao, Y.C. Evaluating the Impacts of Climate Change and Vegetation Restoration on the Hydrological Cycle over the Loess Plateau, China. Water 2019, 11, 2241. [Google Scholar] [CrossRef]
  43. Han, X.; Yu, Y.; Cai, J.; Li, Z.; Xu, H.; Li, W.; Guo, Y.; Wan, H.; Wang, Y.; Dong, L.; et al. Spatial variability of soil moisture in Zhongzhuang small watershed, loess hilly region, southern Ningxia and influencing factors. Sci. Soil Water Conserv. 2022, 20, 44–52. [Google Scholar]
  44. Zhang, R.; Cao, H.; Wang, Y.; Huang, C.; Tan, W. Spatial Variability of Soil Moisture and Its Influence Factors in Watershed of Gully Region on the Loess Plateau. Res. Soil Water Conserv. 2012, 19, 52–58. [Google Scholar]
  45. Fiorucci, M.; Pepe, G.; Marmoni, G.M.; Pecci, M.; Di Martire, D.; Guerriero, L.; Bausilio, G.; Vitale, E.; Raso, E.; Raimondi, L.; et al. Long-term hydrological monitoring of soils in the terraced environment of Cinque Terre (north-western Italy). Front. Earth Sci. 2023, 11, 17. [Google Scholar] [CrossRef]
  46. Oren, R.; Pataki, D.E. Transpiration in response to variation in microclimate and soil moisture in southeastern deciduous forests. Oecologia 2001, 127, 549–559. [Google Scholar] [CrossRef] [PubMed]
  47. Yi, Y.; Xin, Z.; Qin, Y.; Xiao, Y.; Zhao, R. Study on Physical Characteristics of Soil Water in Different Land Uses in Loess Hilly Region. Res. Soil Water Conserv. 2013, 20, 45. [Google Scholar]
  48. Gao, J.; Luo, F.; Liu, H.; Qiao, J.; Yu, M.; Xu, Y. Effects of typical ecological projects of desertification combating on soil physical properties in Ulan Buh Desert. Arid Zone Res. 2023, 40, 737–746. [Google Scholar]
  49. Moges, A.; Dagnachew, M.; Yimer, F. Land Use Effects on Soil Quality Indicators: A Case Study of Abo-Wonsho Southern Ethiopia. Appl. Environ. Soil Sci. 2013, 2013, 784989. [Google Scholar] [CrossRef]
  50. Ciric, V.; Manojlovic, M.; Nesic, L.; Belic, M. Soil dry aggregate size distribution: Effects of soil type and land use. J. Soil Sci. Plant Nutr. 2012, 12, 689–703. [Google Scholar] [CrossRef]
  51. Jourgholami, M.; Ghassemi, T.; Labelle, E.R. Soil physio-chemical and biological indicators to evaluate the restoration of compacted soil following reforestation. Ecol. Indic. 2019, 101, 102–110. [Google Scholar] [CrossRef]
  52. Wei, H.; Li, R.; Yang, Q. Research advances of vegetation effect on soil and water conservation in China. Acta Phytoecol. Sin. 2002, 26, 489–496. [Google Scholar]
  53. Tan, K.; Su, Y.; Liu, B. Influence of Shelterbelt on Soil Aggregate Composition and Stability of Slope Farmland in Black Soil. J. North-East For. Univ. 2022, 50, 93. [Google Scholar]
  54. Liu, Z.; Wang, Y.; Xu, L.; Deng, X.; Tian, A. Spatial-temporal Variations and Scale Effect of Soil Moisture on Larix Principis-ruprechtii Plantation Slope in Semihumid Liupan Mountains, China. Mt. Res. 2018, 36, 43–52. [Google Scholar]
  55. Liu, M.; Jiang, D.; Huang, G.; Cai’e, C. An analysis to the differences of soil. Bull. Soil Water Conserv. 1990, 19, 16–20. [Google Scholar]
  56. Liu, J.; Ai, N.; Zong, Q.; Hao, B.; Li, Y.; Qiang, D.; Liu, C. Spatial Distribution Characteristics of Soil Moisture in Sabina vulgaris Ant. Community in the Southern Edge of Mu Us Sandland. J. Soil Water Conserv. 2019, 33, 79–84. [Google Scholar]
  57. Wang, L.; Liu, G.; Feng, X.; Niu, J. The characteristics of water deficit in various vegetation soils in northwestern Shanxi Province. Acta Sci. Nat. Univ. Sunyatseni 2018, 57, 102–109. [Google Scholar]
  58. Shi, Y.Z.; Wang, Y.H.; Cui, Y.L.; Wang, S.W.; Zhang, Y.S. A new rainwater harvesting and recycling system for transforming sloping land into terraced farmland. J. Mt. Sci. 2014, 11, 205–214. [Google Scholar] [CrossRef]
  59. Klaassen, W.; Lankreijer, H.J.M.; Veen, A.W.L. Rainfall interception near a forest edge. J. Hydrol. 1996, 185, 349–361. [Google Scholar] [CrossRef]
  60. Baldocchi, D.D.; Verma, S.B.; Anderson, D.E. Canopy Photosynthesis and Water-Use Efficiency in a Deciduous Forest. J. Appl. Ecol. 1987, 24, 251–260. [Google Scholar] [CrossRef]
  61. Zhu, Q.; Nie, X.F.; Zhou, X.B.; Liao, K.H.; Li, H.P. Soil moisture response to rainfall at different topographic positions along a mixed land-use hillslope. Catena 2014, 119, 61–70. [Google Scholar] [CrossRef]
  62. Han, F.; Liu, X.; Ma, C. Characteristics of soil water infiltration in sloping land and level terrace under different rainfall duration. Agric. Res. Arid Areas 2012, 30, 14. [Google Scholar]
  63. Defersha, M.B.; Quraishi, S.; Melesse, A. The effect of slope steepness and antecedent moisture content on interrill erosion, runoff and sediment size distribution in the highlands of Ethiopia. Hydrol. Earth Syst. Sci. 2011, 15, 2367–2375. [Google Scholar] [CrossRef]
  64. Zhou, Y.; Li, H.; Xu, Q. Effect of Yunnan Pine forest canopy on soil erosion. Mt. Res. 1999, 17, 324–328. [Google Scholar]
  65. Zhao, H.; Wu, Q.; Liu, G. Studies on soil and water conservation functions of litter in chinese pine stand on loess plateau. Sci. Silvae Sin. 2003, 39, 168–172. [Google Scholar]
  66. Wang, G.B.; Liu, B.H.; Henderson, M.; Zhang, Y.; Zhang, Z.; Chen, M.Y.; Guo, H.X.; Huang, W.W. Effect of Terracing on Soil Moisture of Slope Farmland in Northeast China’s Black Soil Region. Agriculture 2023, 13, 1876. [Google Scholar] [CrossRef]
  67. Xia, L.; Song, X.Y.; Fu, N.; Cui, S.Y.; Li, L.J.; Li, H.Y.; Li, Y.L. Effects of forest litter cover on hydrological response of hillslopes in the Loess Plateau of China. Catena 2019, 181, 11. [Google Scholar] [CrossRef]
Figure 1. Location of the research region and sampling sites. (a,b) Location of study area; (c) Sampling point setting; (d) Distant view of woodland (WL), transverse ridge tillage (TRT) and terraced field (TF) farmland.
Agriculture 14 01261 g001
Figure 2. Monthly temperature and precipitation in the study area in 2022.
Agriculture 14 01261 g002
Figure 3. Vertical profiles of soil moisture (0–60 cm) for different land use types during (a) rainy season and (b) dry season. Different letters indicate significant (p < 0.05) differences between land use types at the same depth.
Agriculture 14 01261 g003
Figure 4. Soil moisture (0–60 cm) under different slope position for different land use types in (a) rainy and (b) dry seasons. Different letters indicate significant differences (p < 0.05) among land use types within the same slope position.
Agriculture 14 01261 g004
Figure 5. Soil water storage (SWS) and SMt/SMs (δ values) in the rainy and dry periods for different land use types. Different letters indicate significant differences (p < 0.05) among land use types within the same period.
Agriculture 14 01261 g005
Figure 6. The SMt/SMs (δ values) under different land use types and slope positions during (a) the rainy season and (b) the dry season.
Agriculture 14 01261 g006
Figure 7. Changes in soil physical properties along slopes.
Agriculture 14 01261 g007
Table 1. Soil moisture for different land use types.
TypeRainy SeasonDry Season
Max (%)Min (%)Mean (%) *CV (%)Max (%)Min (%)Mean (%) *CV (%)
WL21.8210.0216.95 Bc1725.508.8818.64 Ab18
TRT29.1219.8124.61 Ab1228.4715.0722.77 Ba12
TF33.7023.3527.67 Aa1026.9218.8522.83 Ba7
* Different capital letters indicate significant differences in the mean values of soil moisture between the same land use types in different seasons. Different lowercase letters indicate significant differences in the mean values of soil moisture between different land use types (p < 0.05).
Disclaimer/Publisher’s Note: The statements, opinions and data contained in all publications are solely those of the individual author(s) and contributor(s) and not of MDPI and/or the editor(s). MDPI and/or the editor(s) disclaim responsibility for any injury to people or property resulting from any ideas, methods, instructions or products referred to in the content.

