
Impact of Building Integrated Rooftop Greenhouse (BiRTG) on Heating and Cooling Energy Load: A Study Based on a Container with Rooftop Greenhouse

Abstract
:1. Introduction
2. Materials and Methods
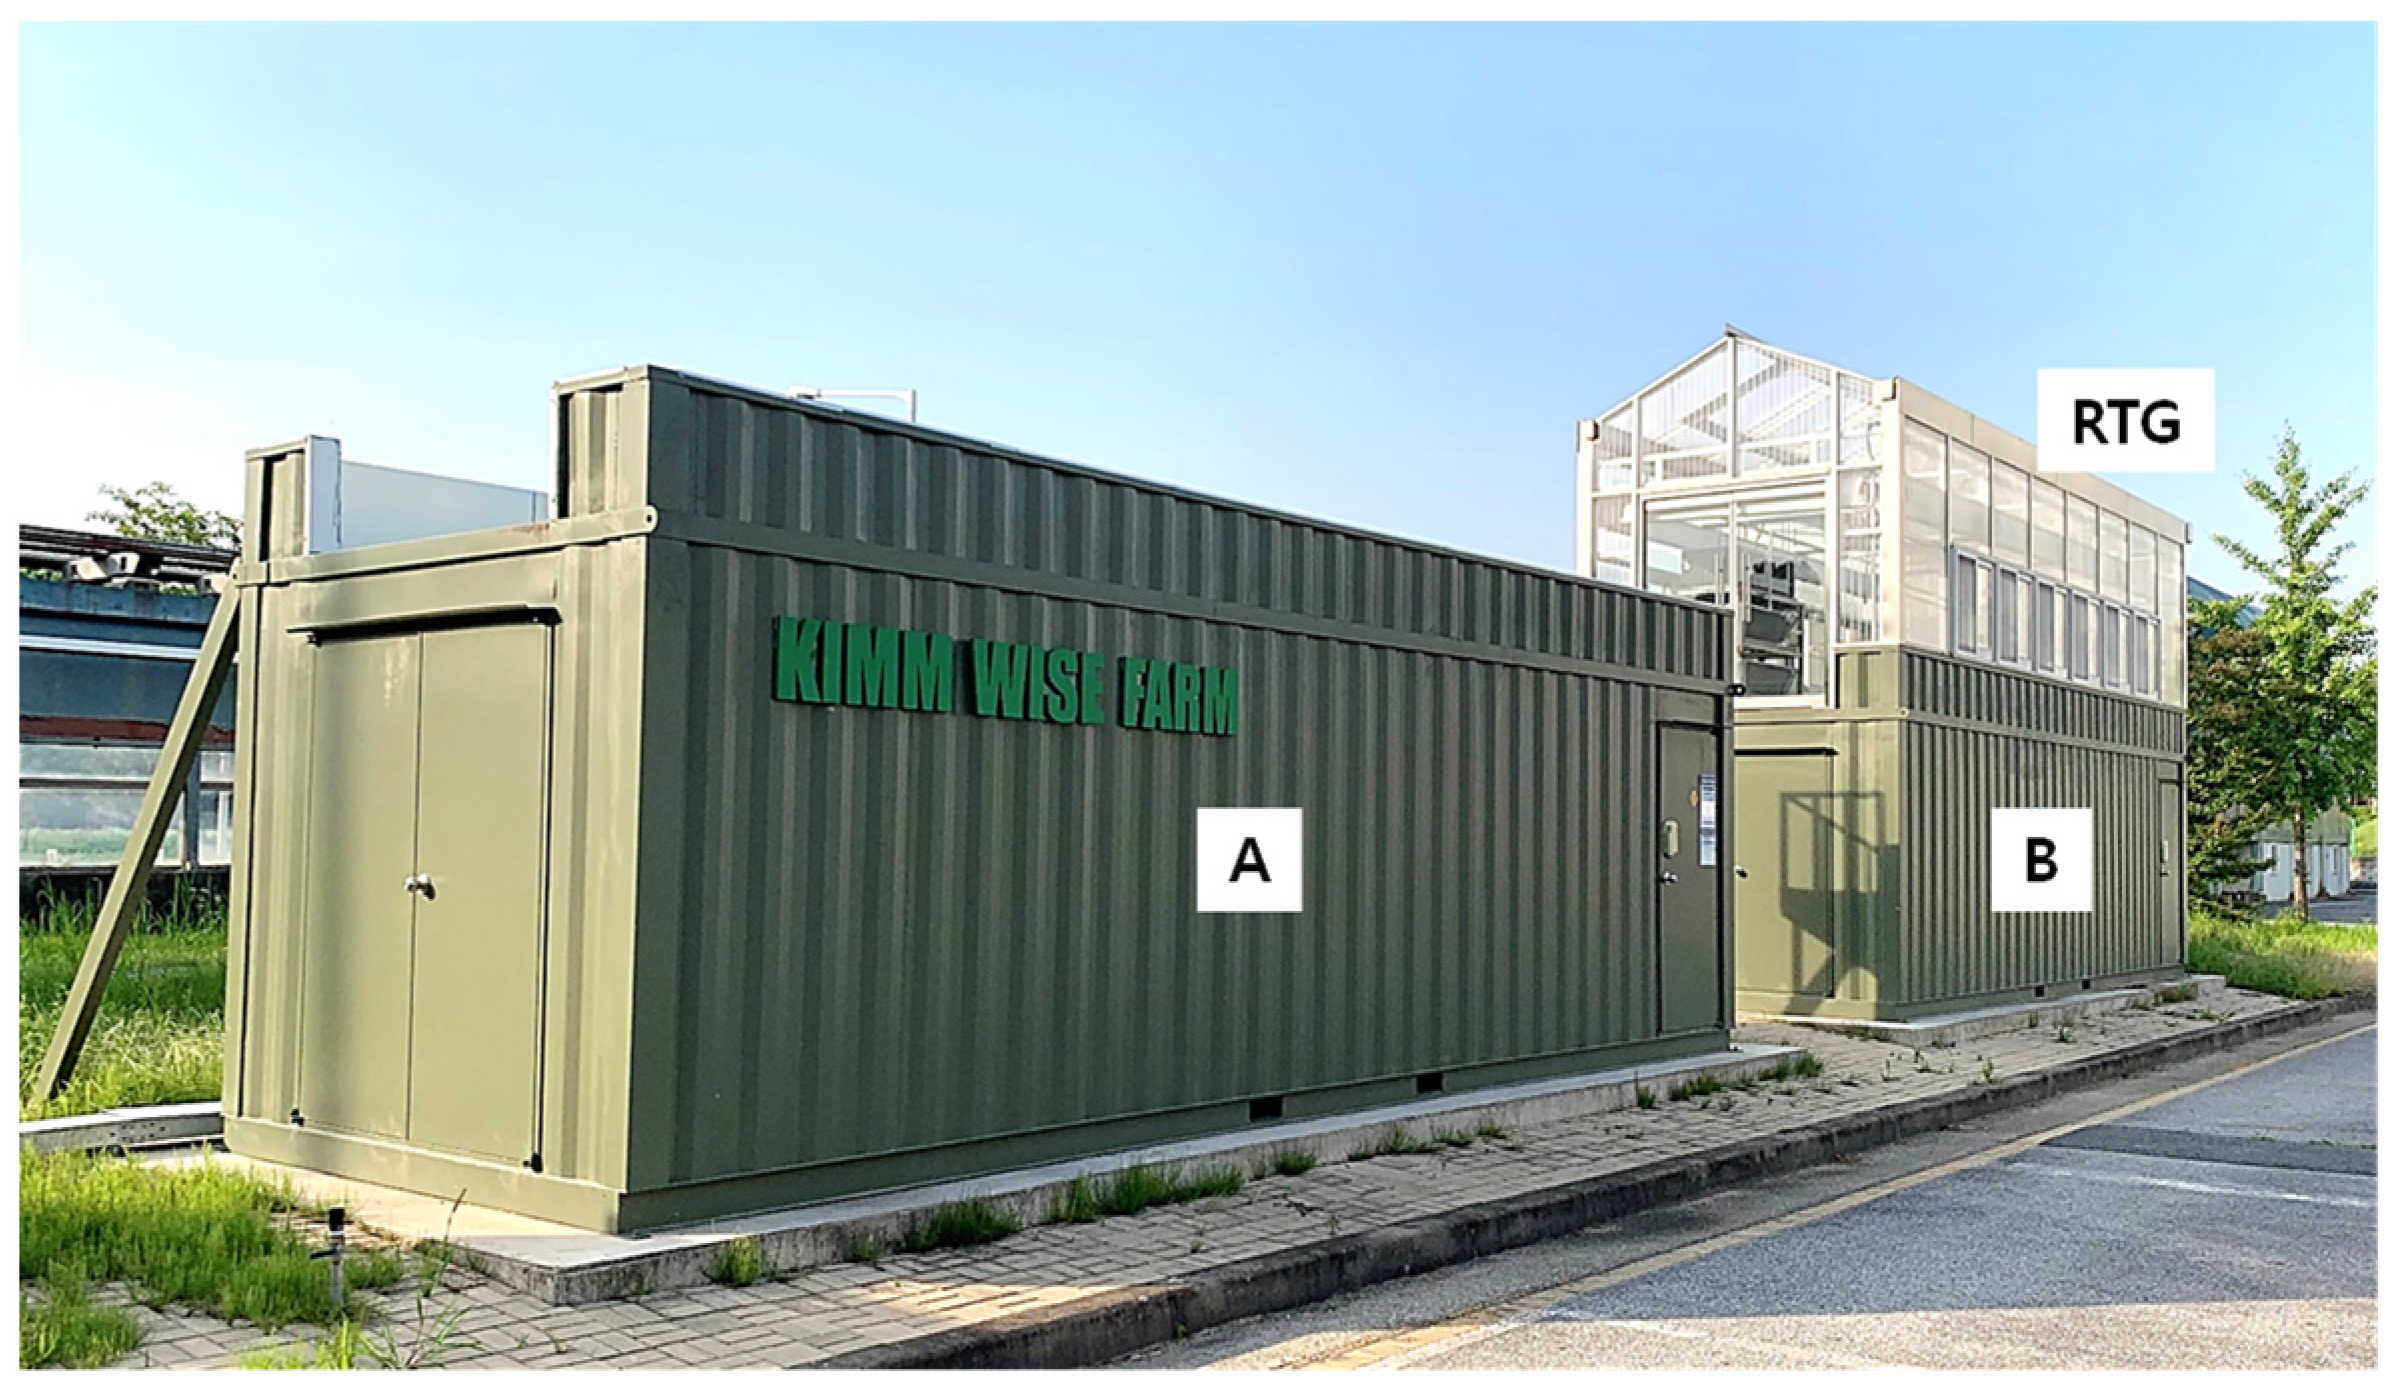
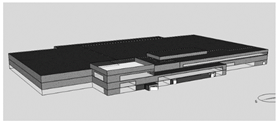
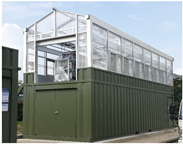
2.1. The Target System Representing BiRTG
2.2. The Building Energy Simulation Model for BiRTG
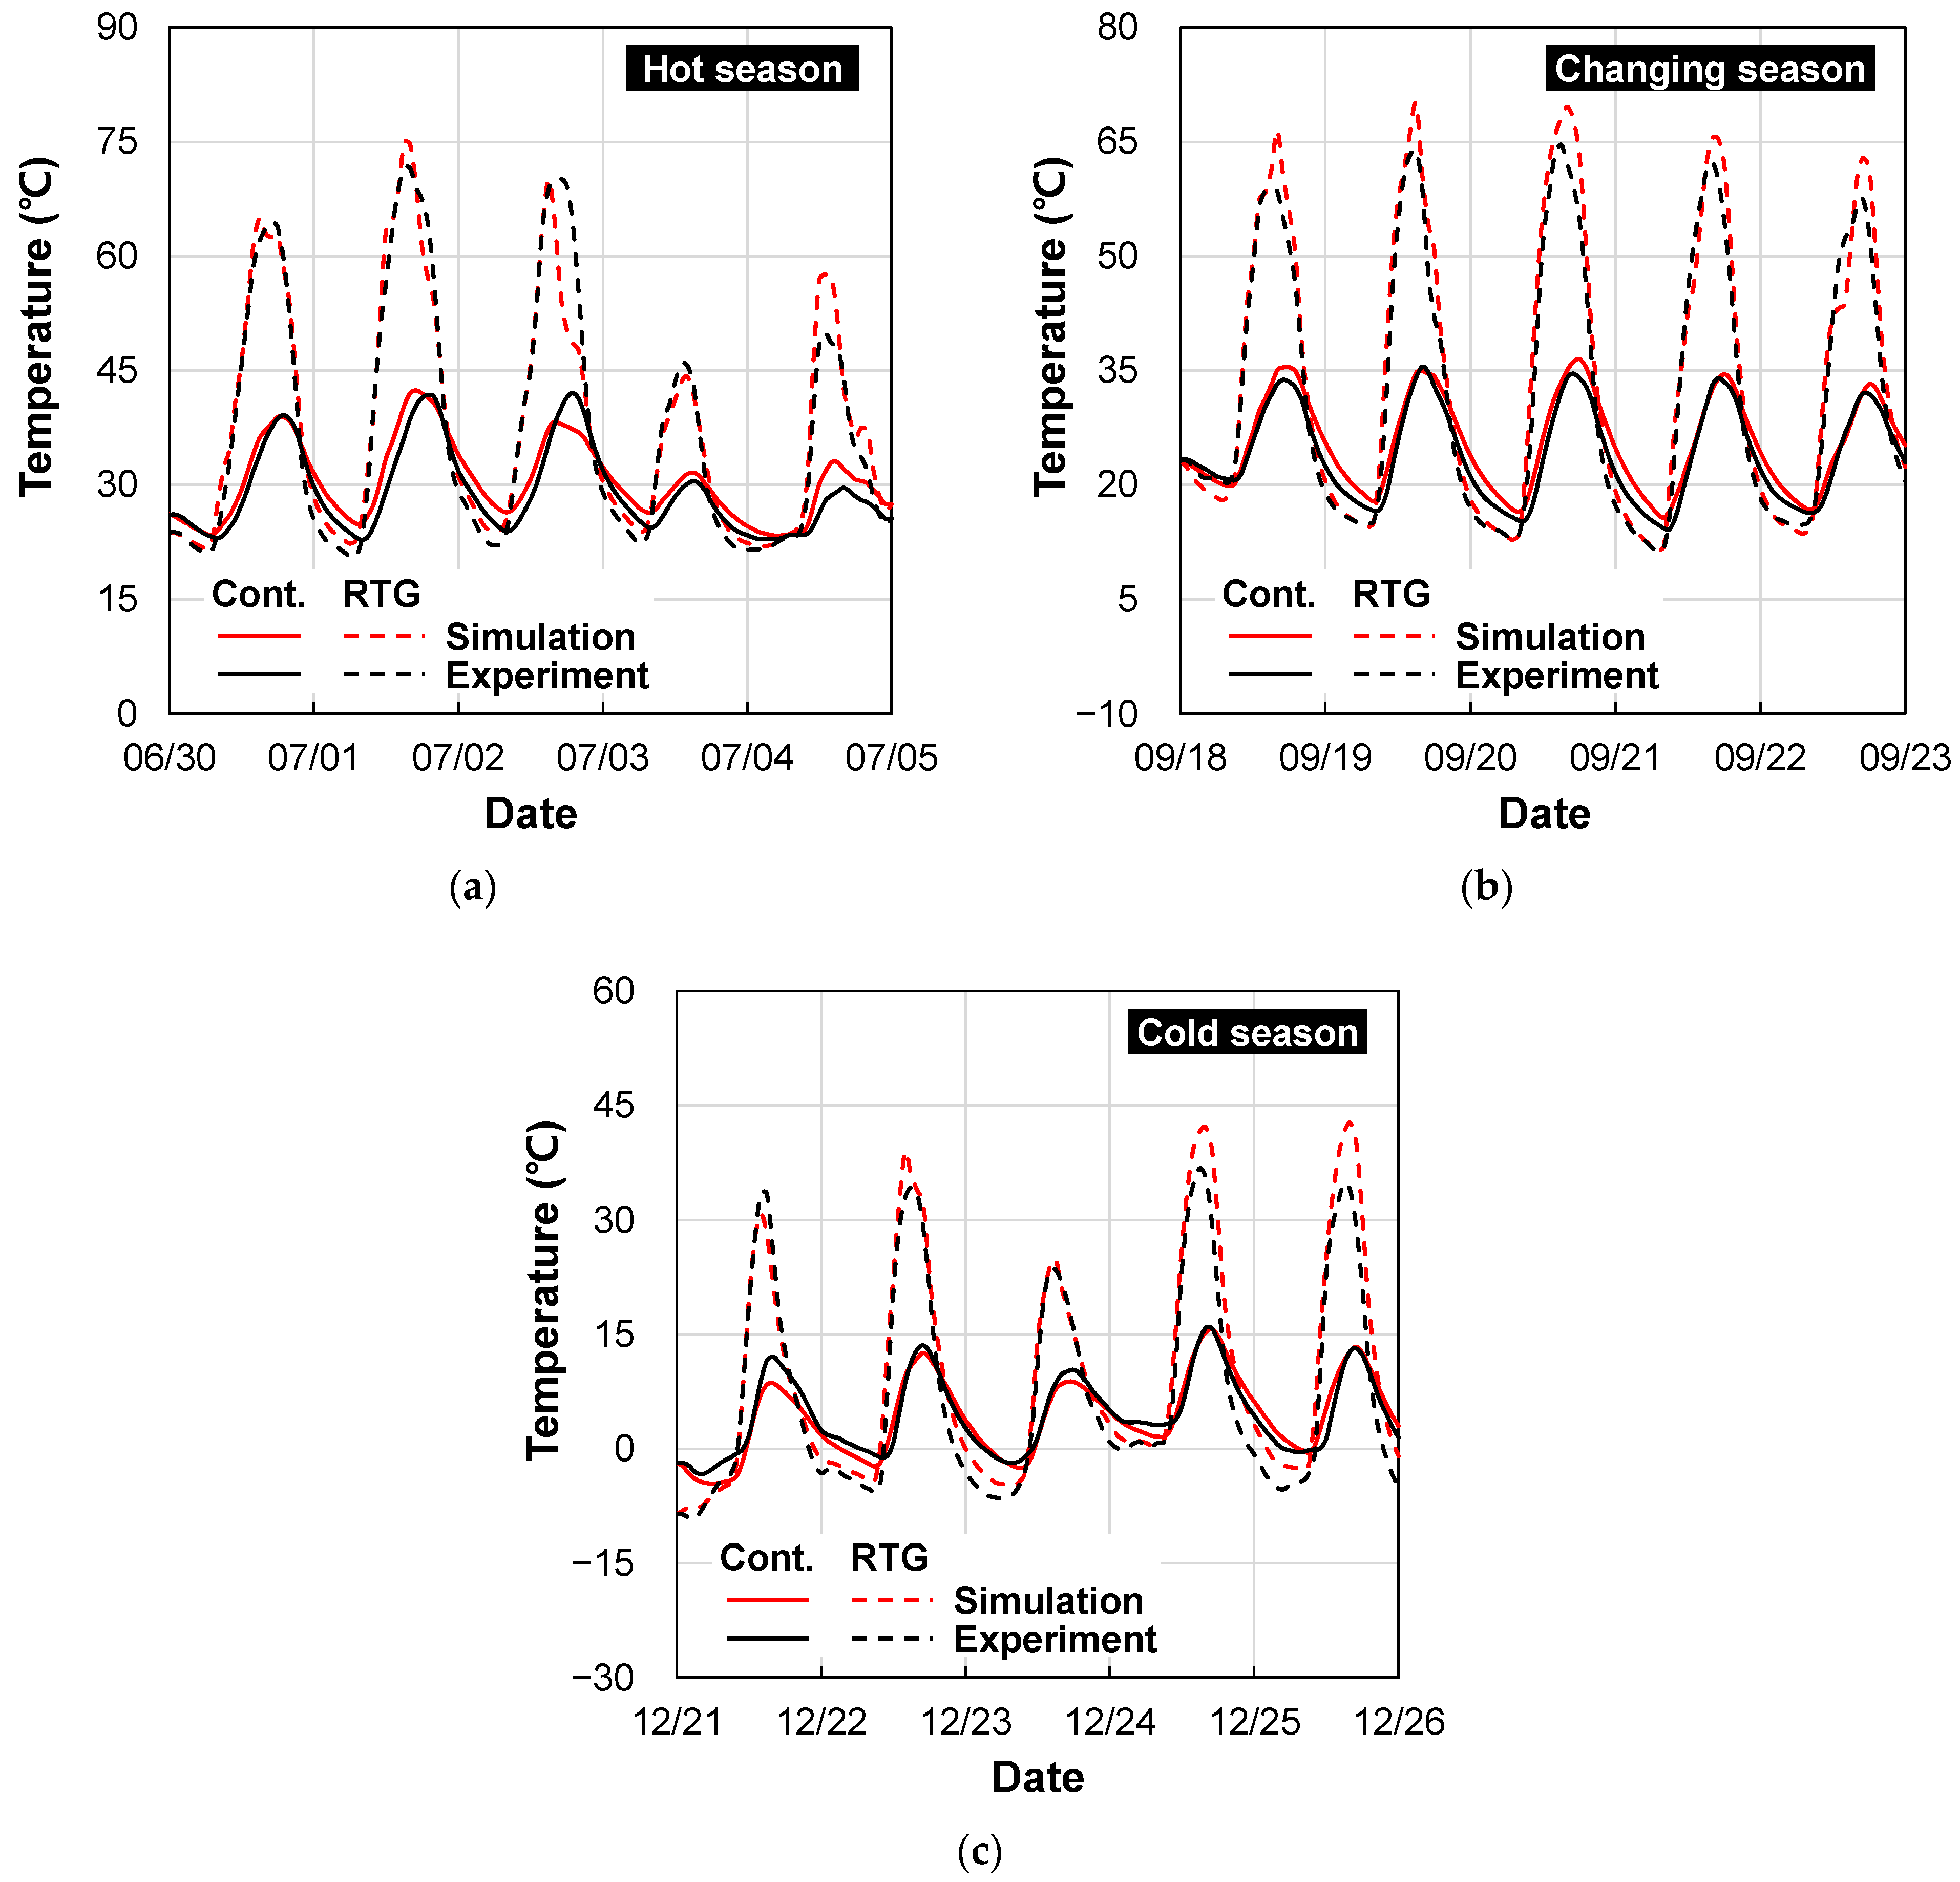
2.3. Model Validation
2.4. Simulation Condition
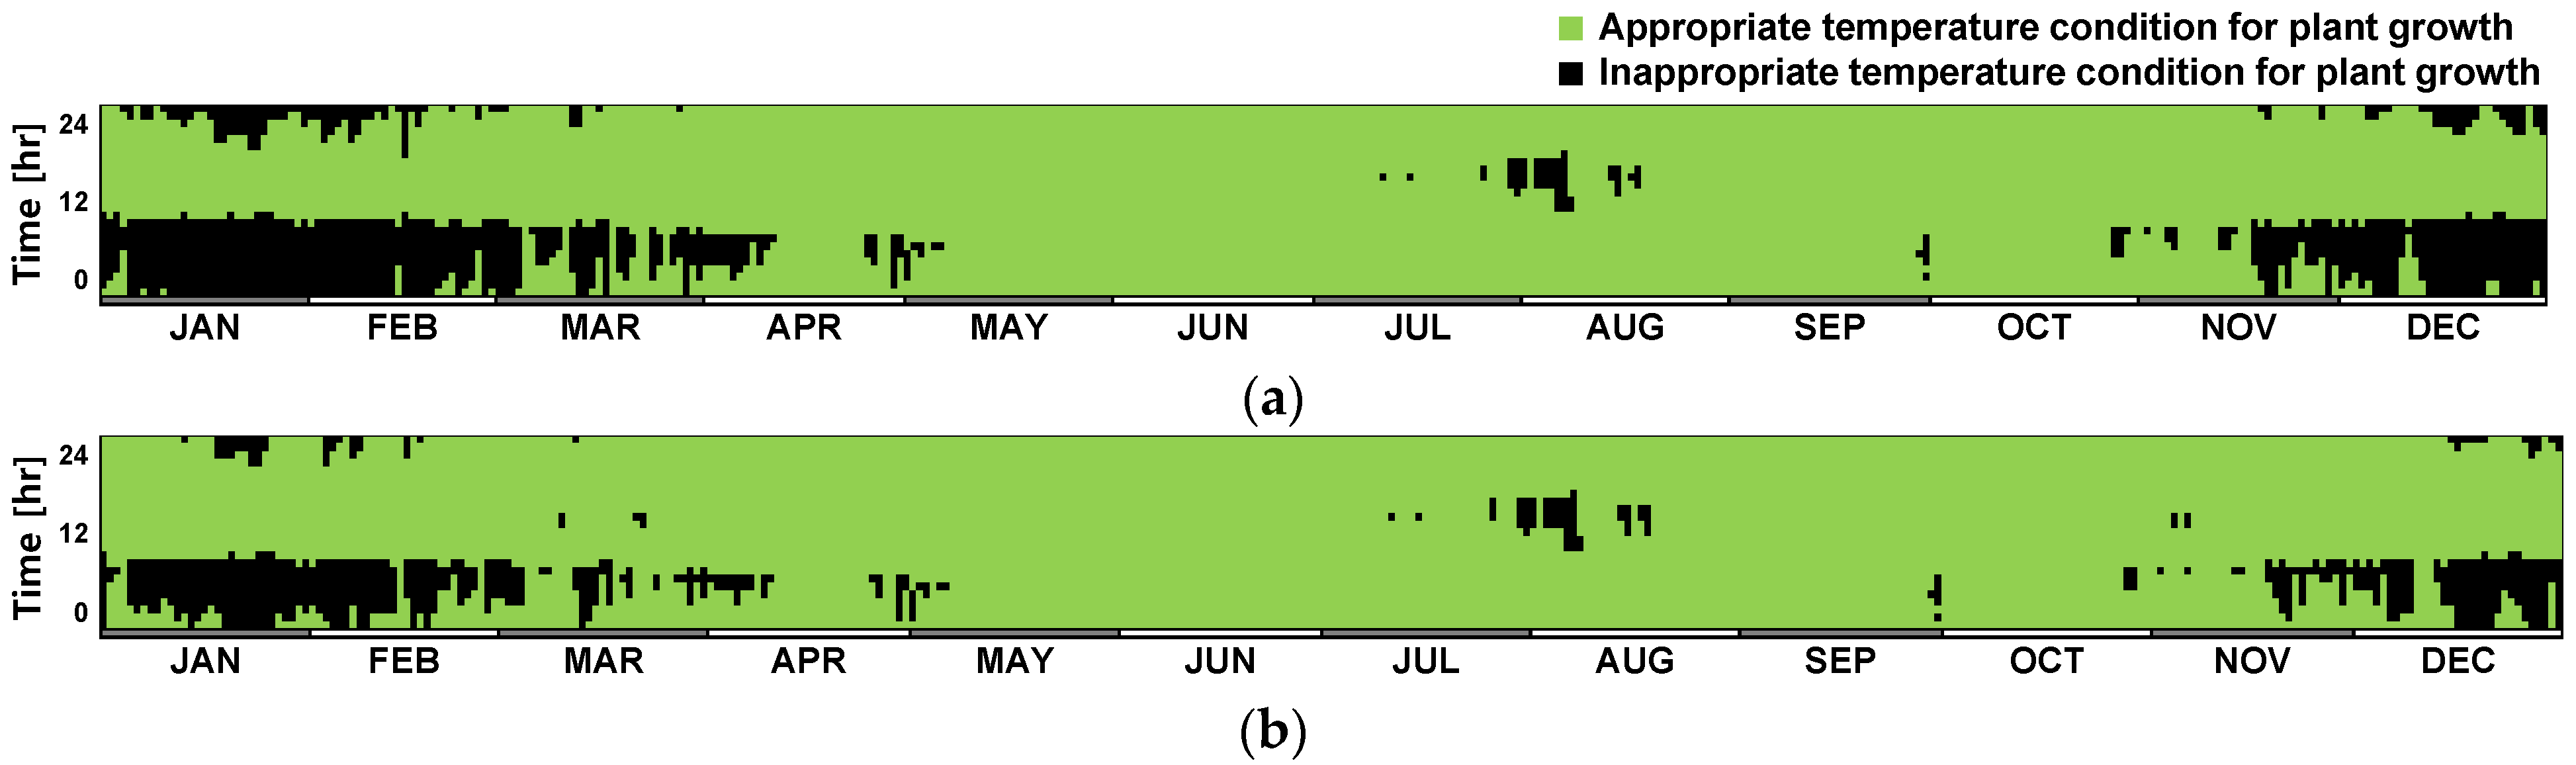
2.4.1. Operating Scenarios for a Greenhouse
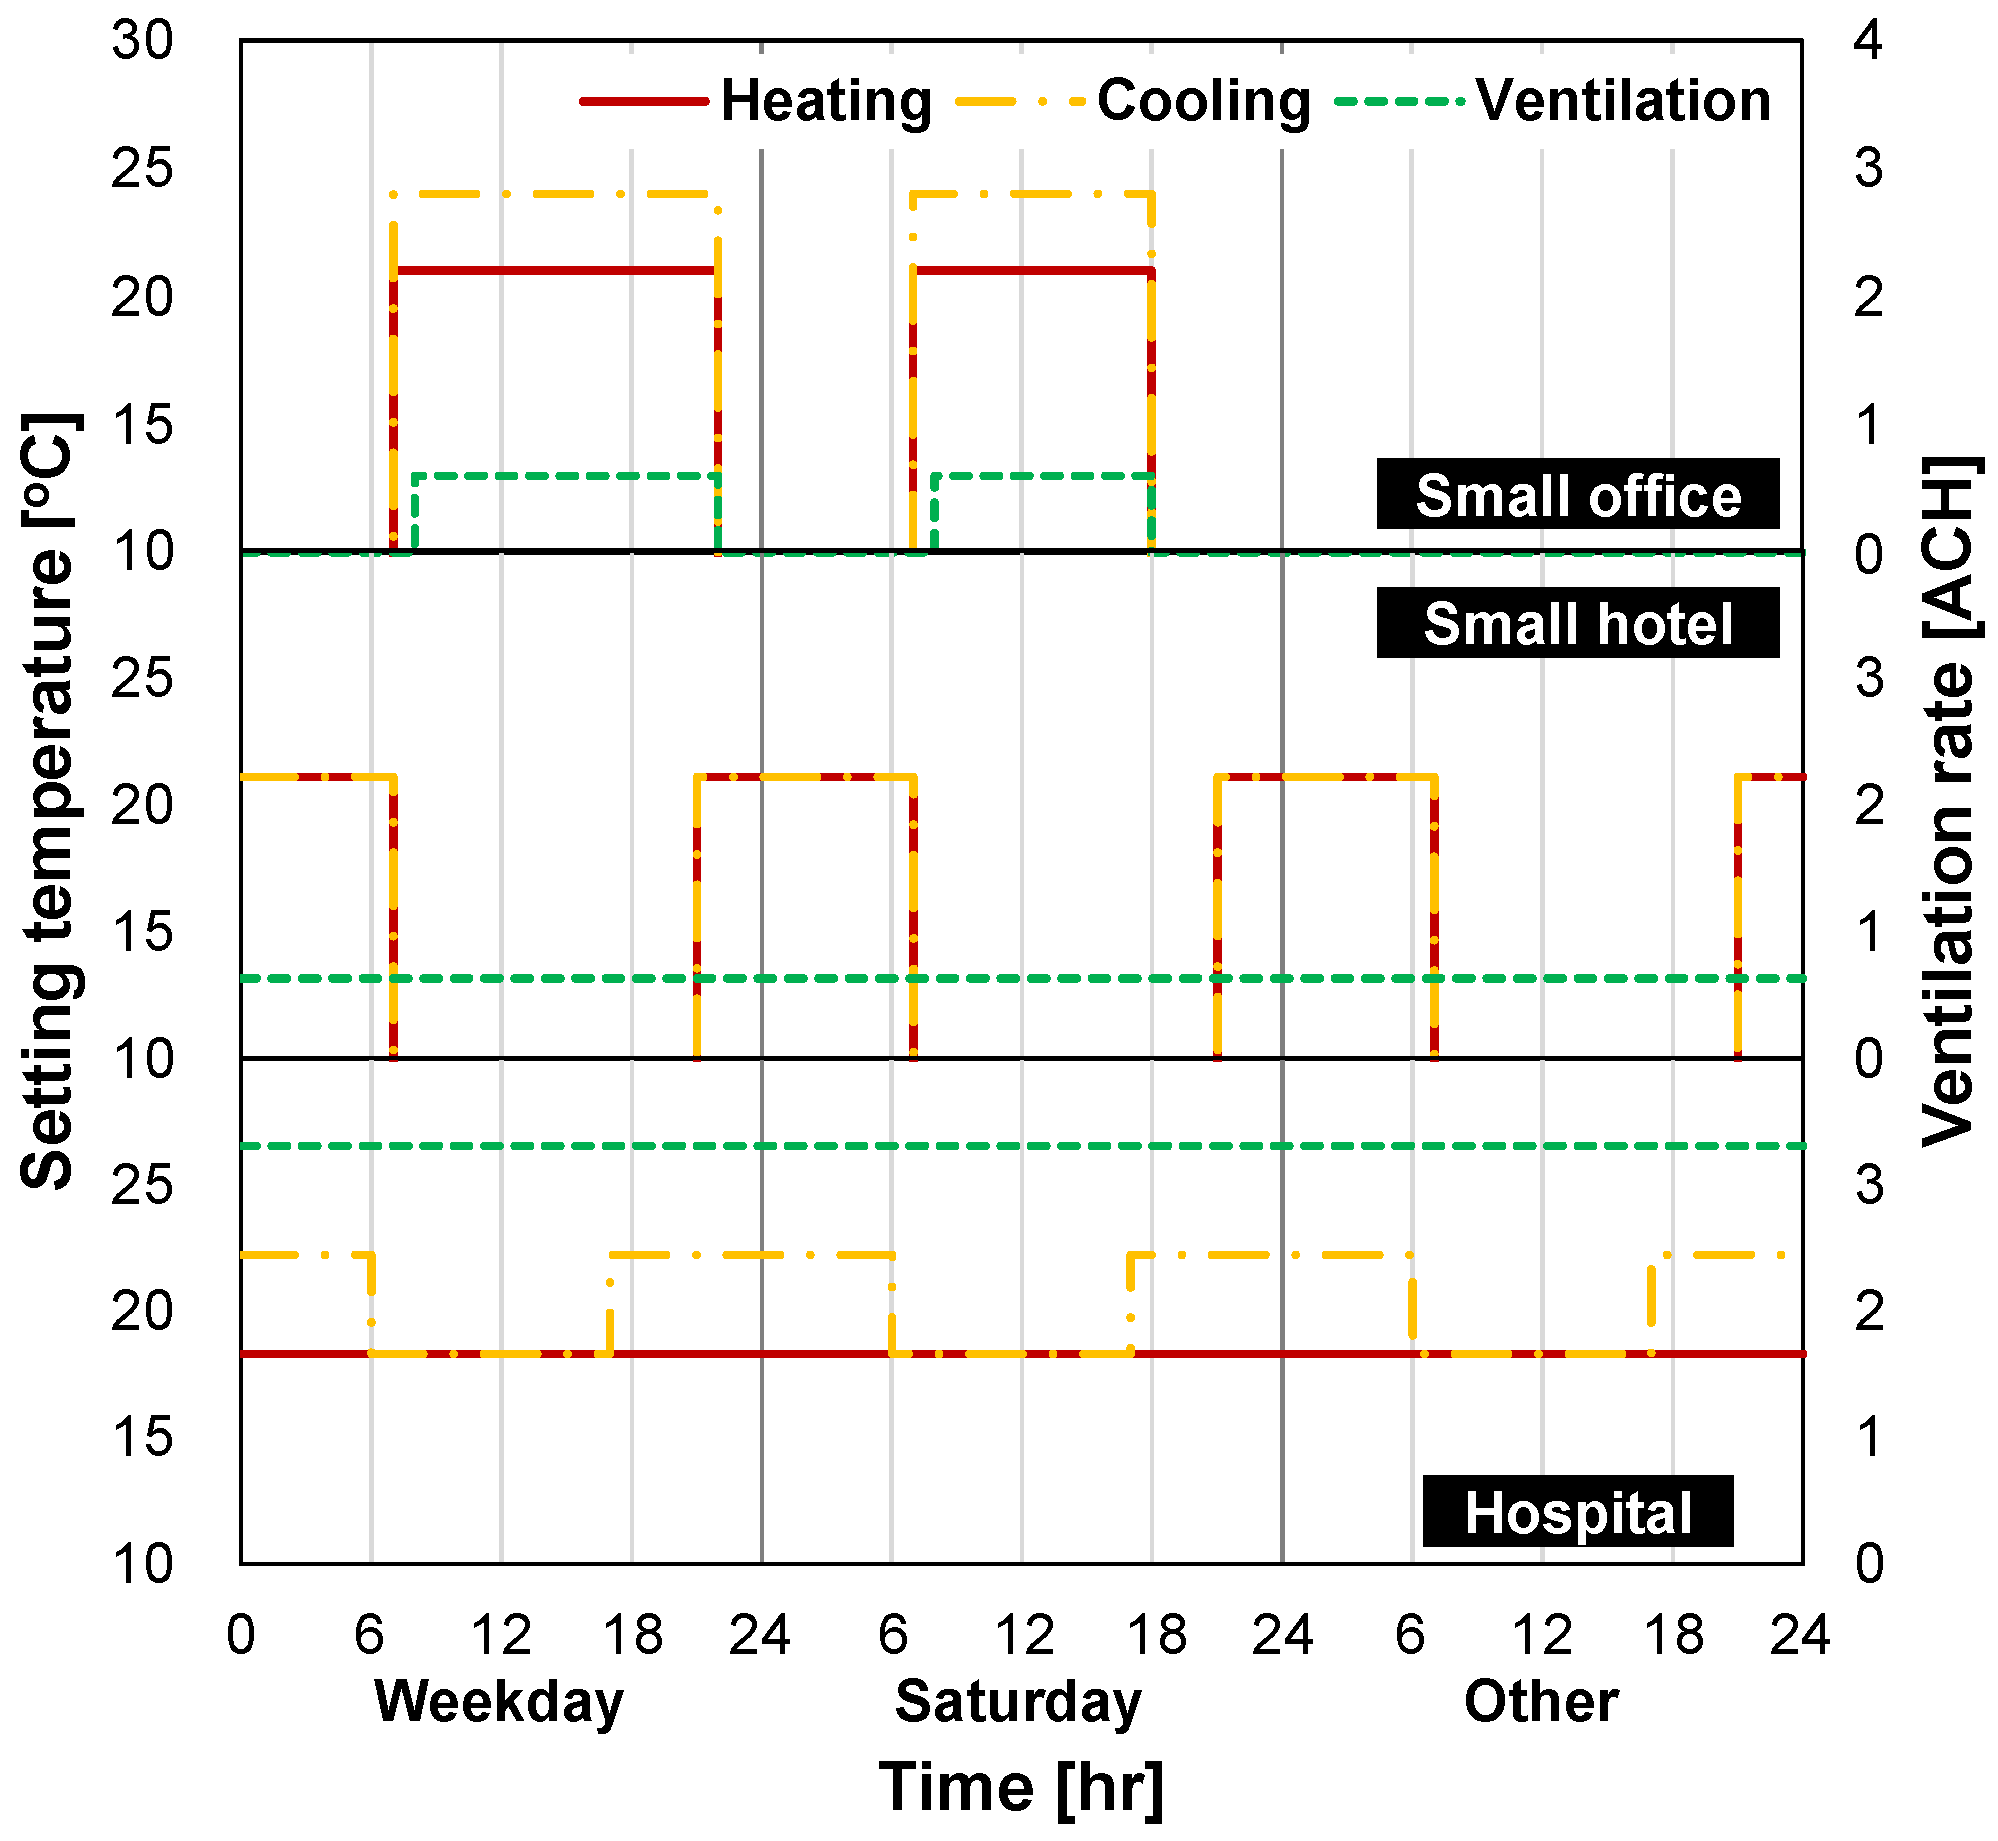
2.4.2. Operating Scenarios for a Container
3. Results and Discussion
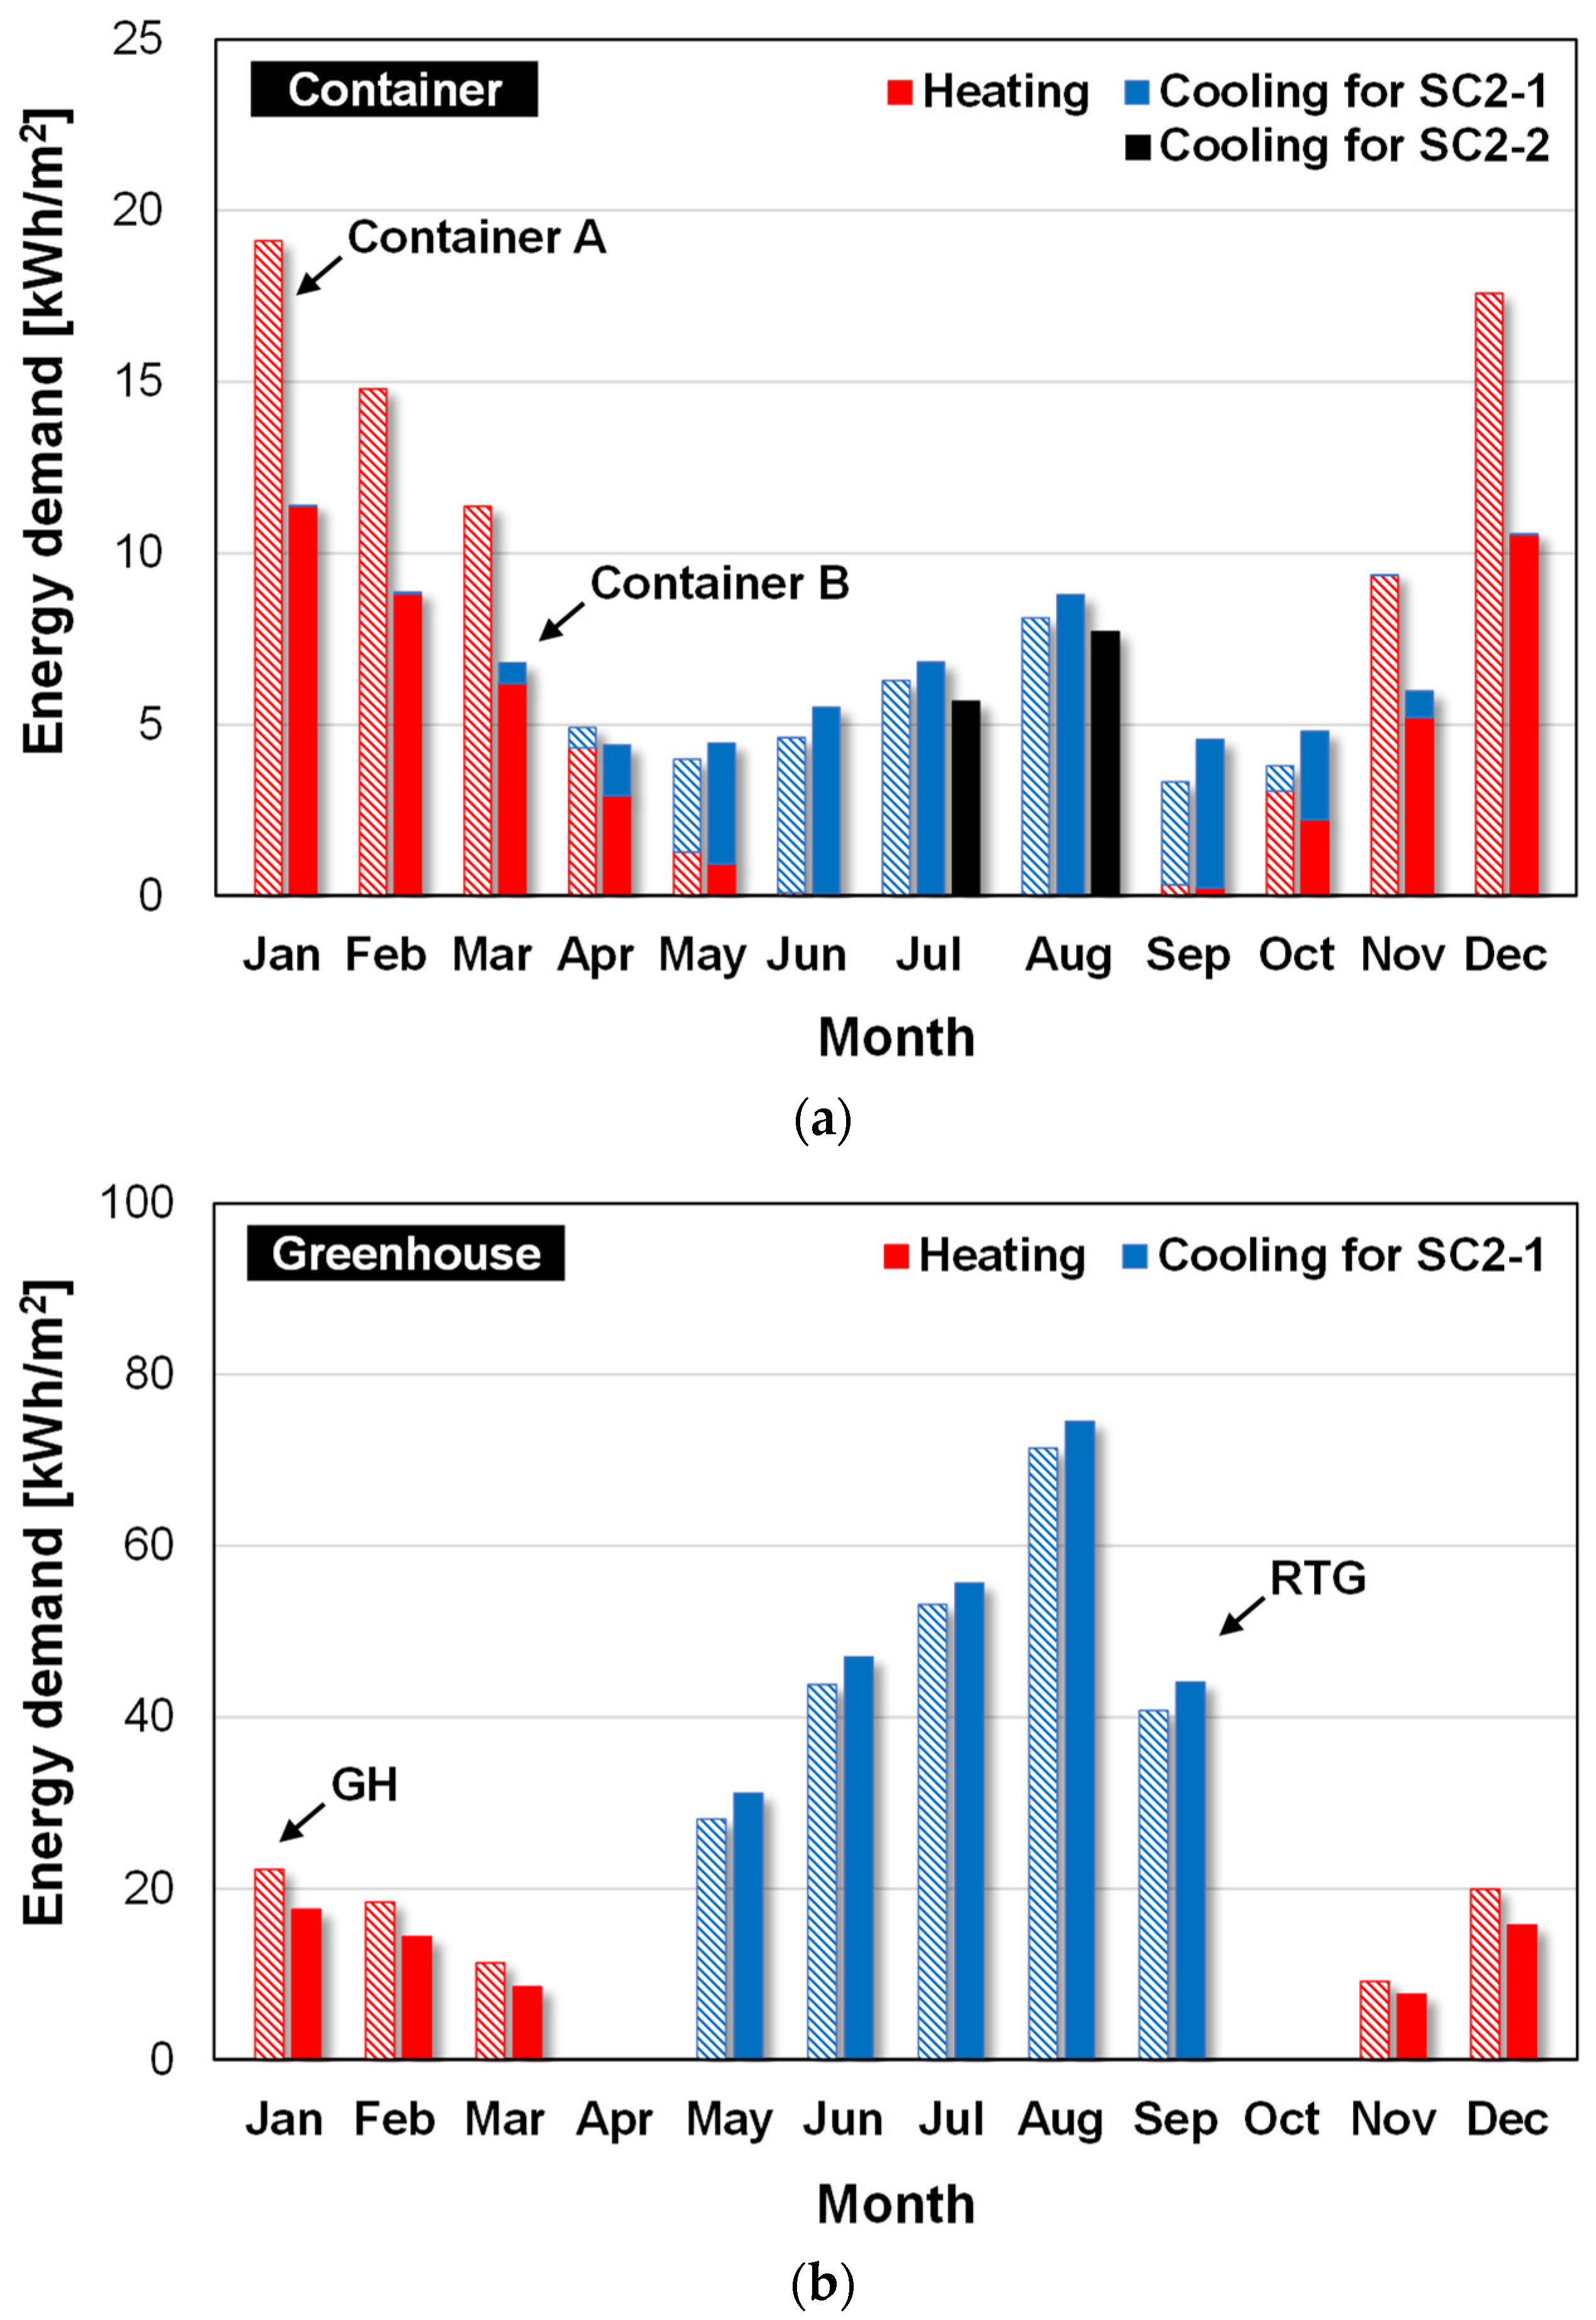
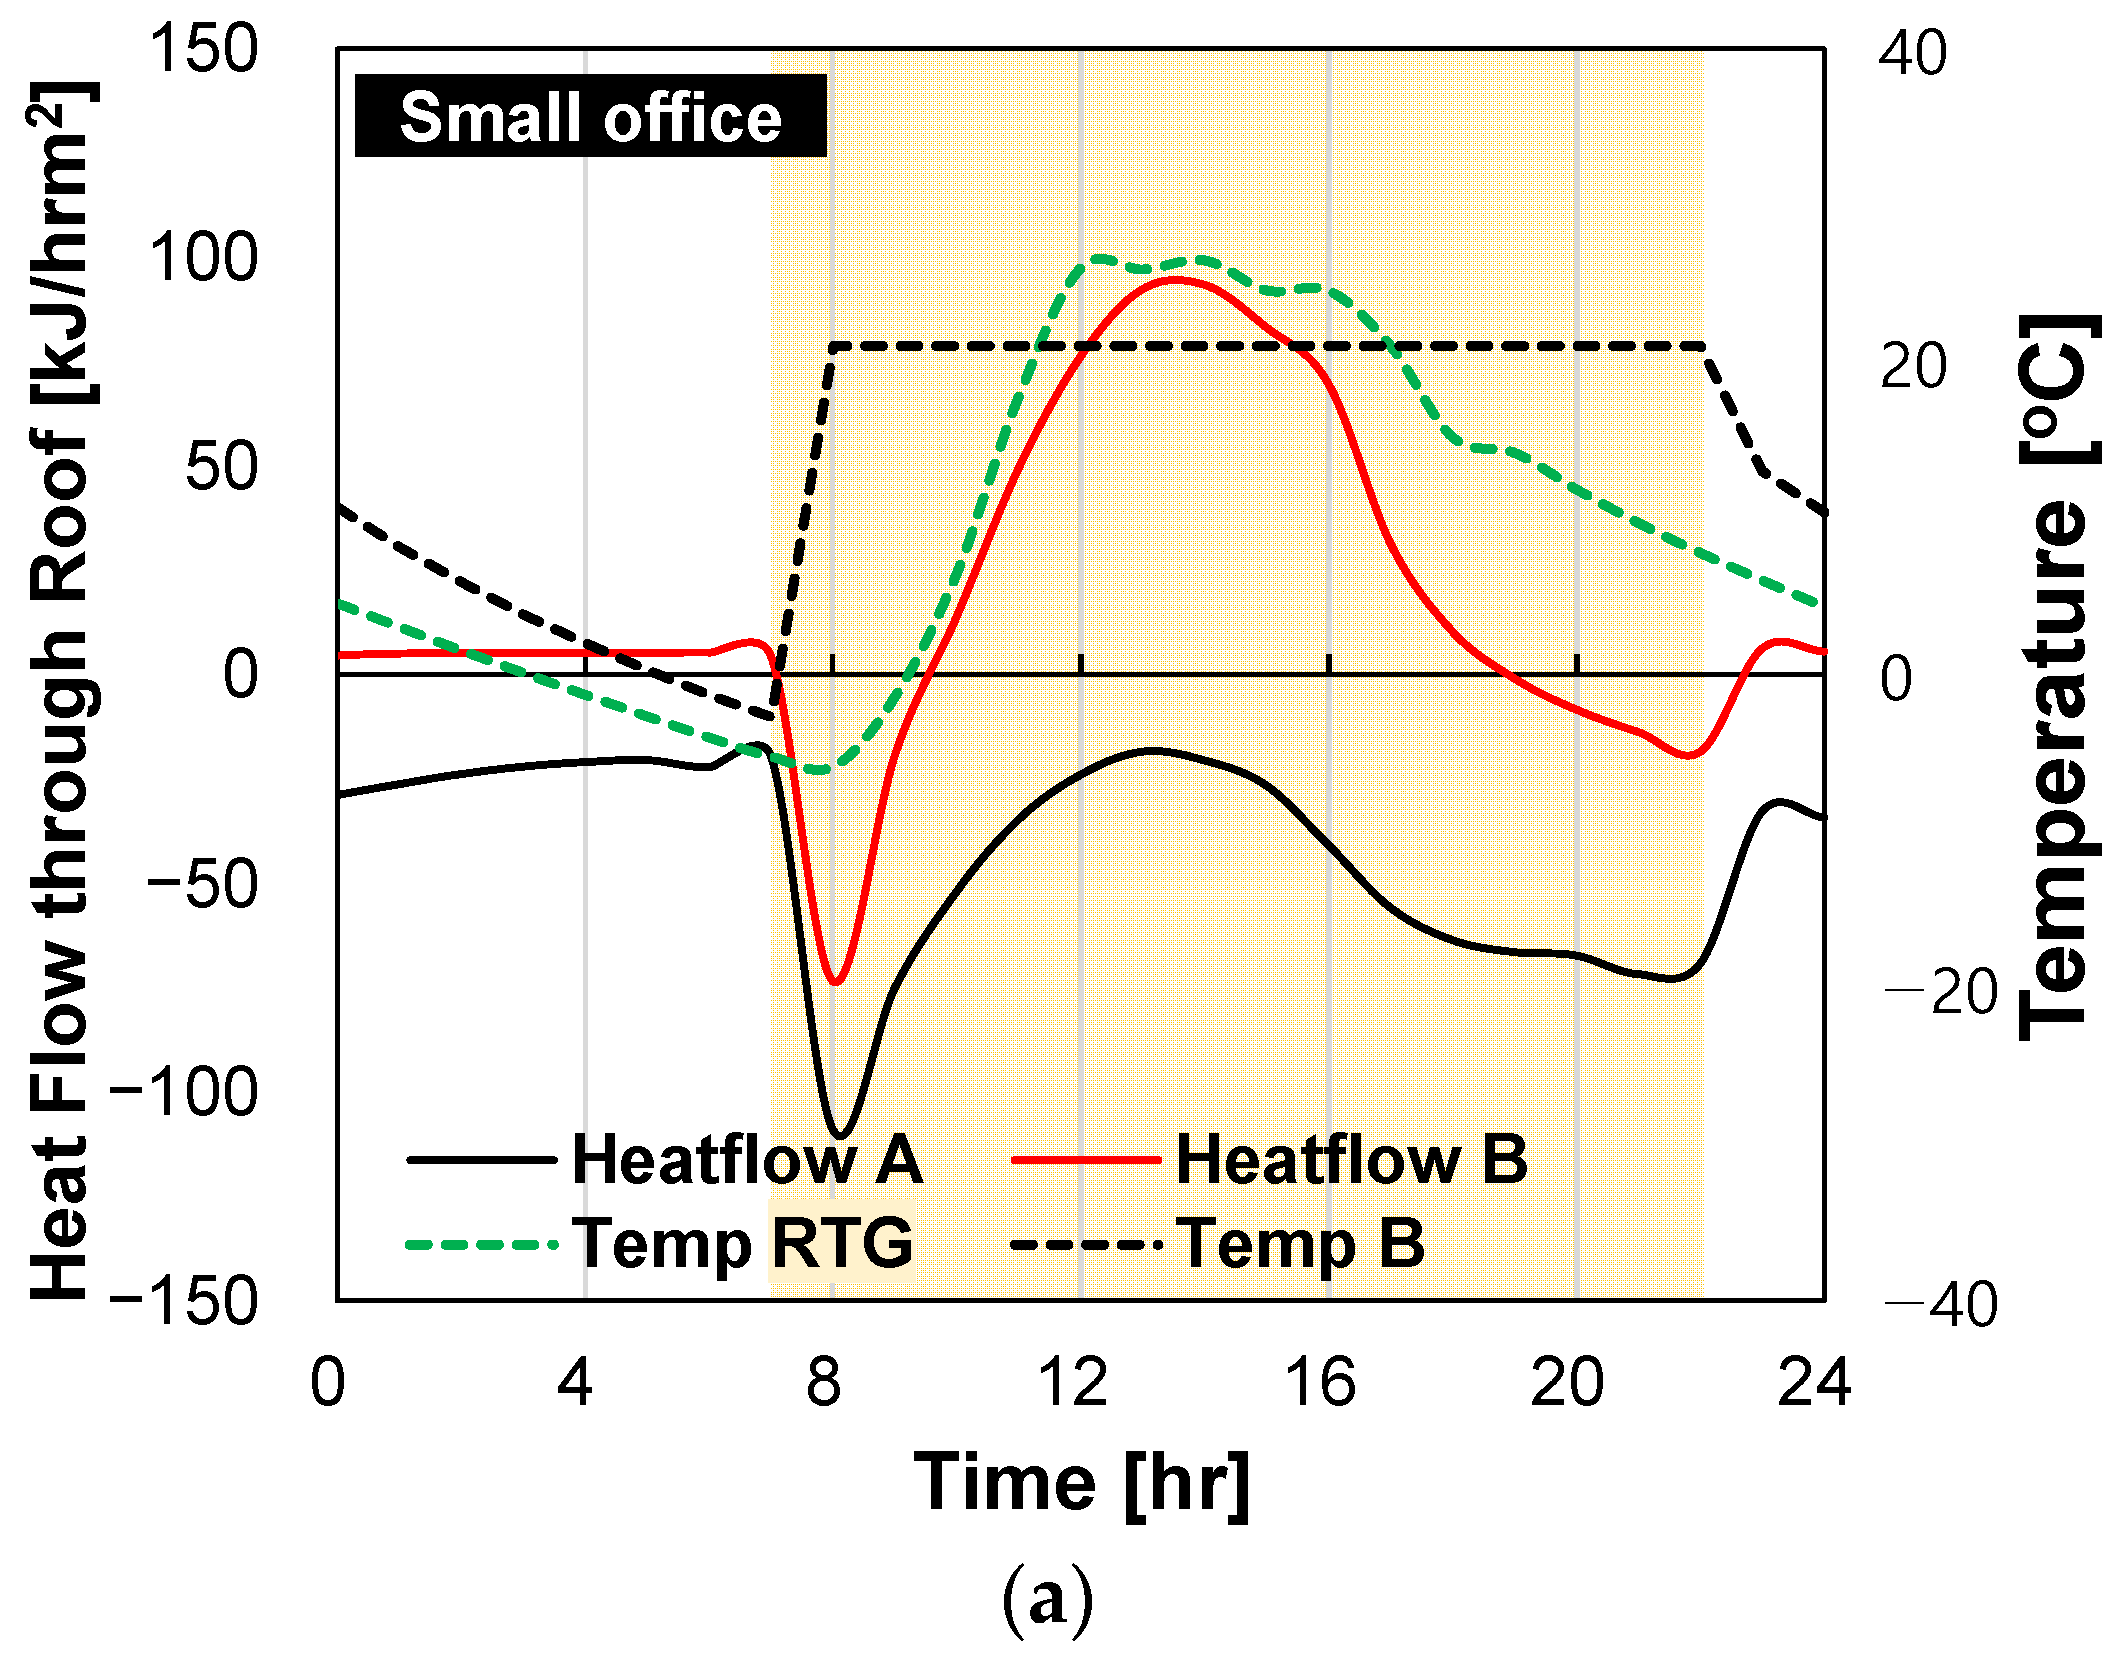
3.1. Thermal Influence of RTG on a Container
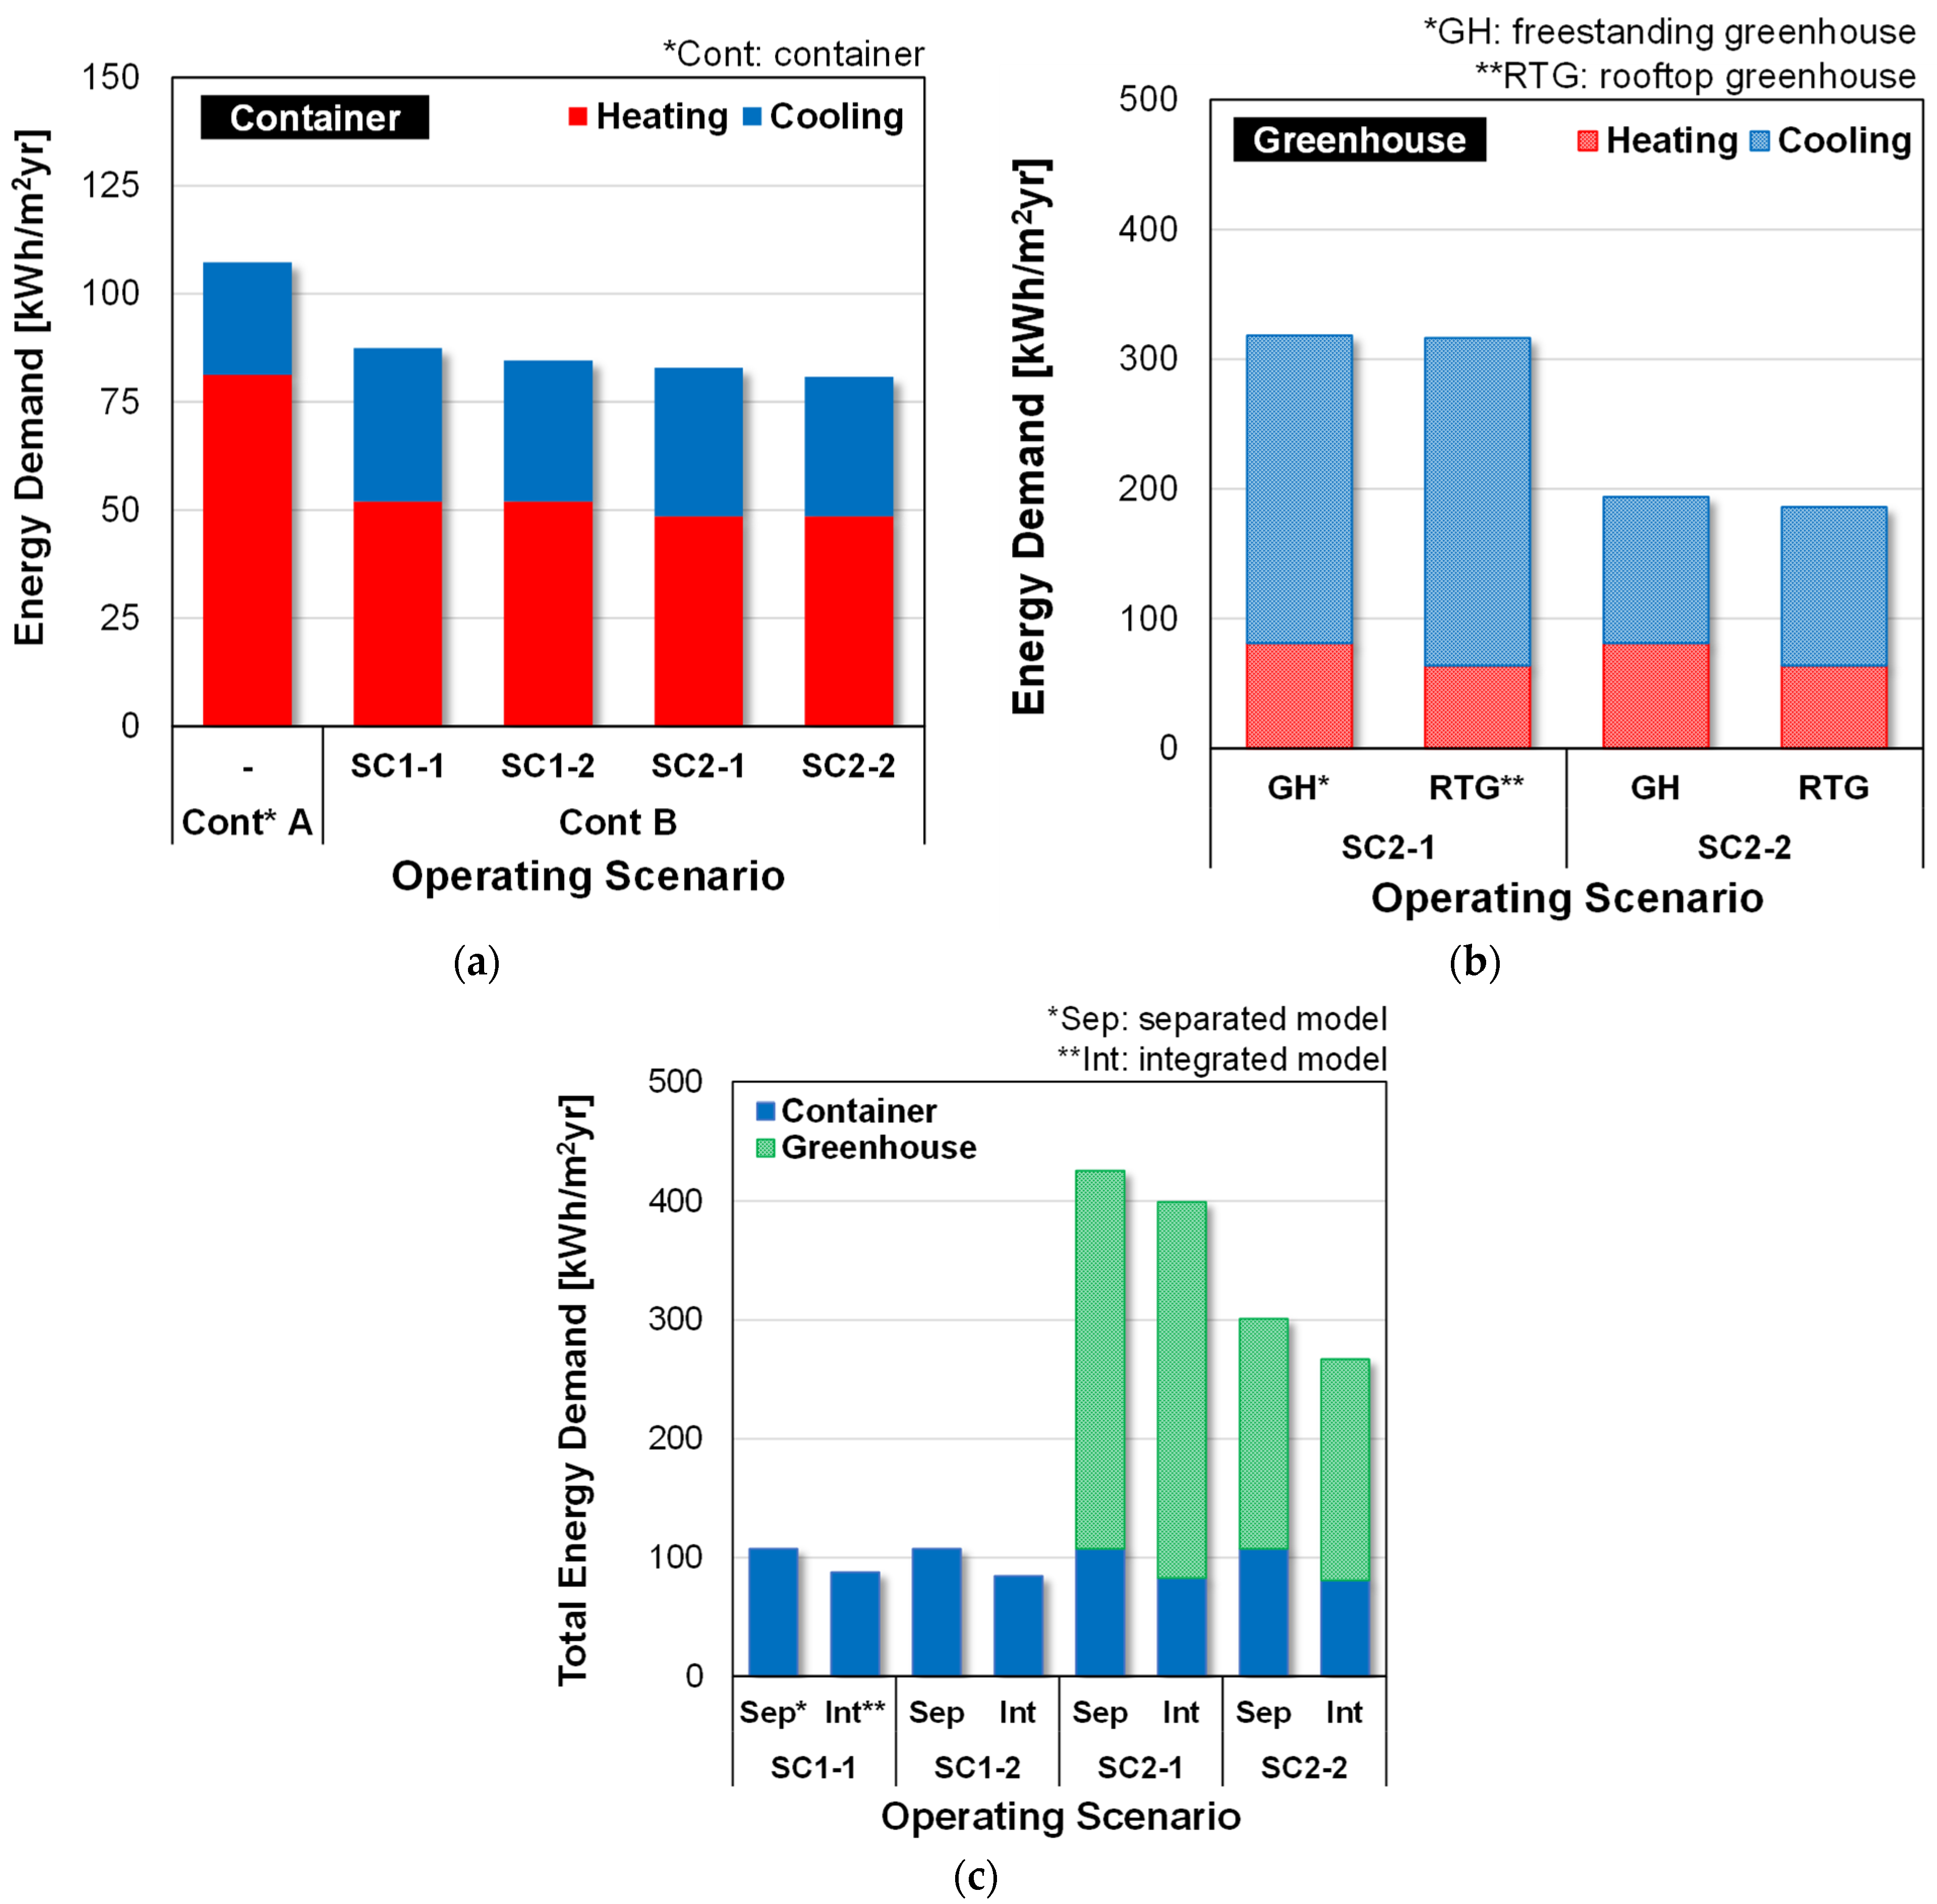
3.2. Influence of RTG Operating Conditions on the Energy Benefits of BiRTG
3.3. Influence of Building Operating Conditions on the Energy Benefits of BiRTG
4. Conclusions
Author Contributions
Funding
Institutional Review Board Statement
Data Availability Statement
Conflicts of Interest
References
- Kundu, D.; Sietchiping, R.; Kinyanjui, M. Developing National Urban Policies; Springer: New York, NY, USA, 2020. [Google Scholar]
- United Nations. World Population Prospects 2022; Department of Economic and Social Affairs Population Division: New York, NY, USA, 2022. Available online: https://population.un.org/wpp/Download/Standard/MostUsed/ (accessed on 10 April 2024).
- Li, M.; Jia, N.; Lenzen, M.; Malik, A.; Wei, L.; Jin, Y.; Raubenheimer, D. Global food-miles account for nearly 20% of total food-systems emissions. Nat. Food 2022, 3, 445–453. [Google Scholar] [CrossRef] [PubMed]
- Drottberger, A.; Zhang, Y.; Yong, J.W.H.; Dubois, M.C. Urban farming with rooftop greenhouse: A systematic literature review. Renew. Sustain. Energy Rev. 2023, 188, 113884. [Google Scholar] [CrossRef]
- Specht, K.; Siebert, R.; Thomaier, S.; Freisinger, U.B.; Sawicka, M.; Dierich, A.; Henckel, D.; Busse, M. Zero-Acreage Farming in the City of Berlin: An Aggregated Stakeholder Perspective on Potential Benefits and Challenges. Sustainability 2015, 7, 4511–4523. [Google Scholar] [CrossRef]
- Thomaier, S.; Specht, K.; Henckel, D.; Dierich, A.; Siebert, R.; Freisinger, U.B.; Sawicka, M. Farming in and on urban buildings: Present practice and specific novelties of Zero-Acreage Farming (ZFarming). Renew. Agric. Food Syst. 2015, 30, 43–54. [Google Scholar] [CrossRef]
- Costanzo, V.; Evola, G.; Marletta, L. Energy savings in buildings or UHI mitigation? Comparison between green roofs and cool roofs. Energy Build. 2016, 114, 247–255. [Google Scholar] [CrossRef]
- Torreggiani, D.; Dall’ara, E.; Tassinari, P. The urban nature of agriculture: Bidirectional trends between city and countryside. Cities 2012, 29, 412–416. [Google Scholar] [CrossRef]
- Specht, K.; Siebert, R.; Thomaier, S. Perception and acceptance of agricultural production in and on urban buildings (ZFarming): A qualitative study from Berlin, Germany. Agric. Hum. Values 2016, 33, 753–769. [Google Scholar] [CrossRef]
- Zambrano-Prado, P.; Orsini, F.; Rieradevall, J.; Josa, A.; Gabarrell, X. Potential Key Factors, Policies, and Barriers for Rooftop Agriculture in EU Cities: Barcelona, Berlin, Bologna, and Paris. Front. Sustain. Food Syst. 2021, 5, 733040. [Google Scholar] [CrossRef]
- Yeo, U.-H.; Lee, S.-Y.; Park, S.-J.; Kim, J.-G.; Cho, J.-H.; Decano-Valentin, C.; Kim, R.-W.; Lee, I.-B. Rooftop Greenhouse: (2) Analysis of Thermal Energy Loads of a Building-Integrated Rooftop Greenhouse (BiRTG) for Urban Agriculture. Agriculture 2022, 12, 787. [Google Scholar] [CrossRef]
- Nadal, A.; Llorach-Massana, P.; Cuerva, E.; López-Capel, E.; Montero, J.I.; Josa, A.; Rieradevall, J.; Royapoor, M. Building-integrated rooftop greenhouses: An energy and environmental assessment in the mediterranean context. Appl. Energy 2017, 187, 338–351. [Google Scholar] [CrossRef]
- Sanjuan-Delmás, D.; Llorach-Massana, P.; Nadal, A.; Ercilla-Montserrat, M.; Muñoz, P.; Montero, J.I.; Josa, A.; Gabarrell, X.; Rieradevall, J. Environmental assessment of an integrated rooftop greenhouse for food production in cities. J. Clean. Prod. 2018, 177, 326–337. [Google Scholar] [CrossRef]
- Jans-Singh, M.; Ward, R.; Choudhary, R. Co-simulation of a Rooftop Greenhouse and a School Building in London, UK. In Proceedings of the Building Simulation 2019: 16th Conference of IBPSA, Rome, Italy, 2–4 September 2019; pp. 3266–3273. [Google Scholar] [CrossRef]
- UN Environment Programme. 2021 Global Status Report for Buildings and Construction; UNEP—United Nations Environment Programme: Nairobi, Kenya, 2021; Available online: http://www.unep.org/resources/report/2021-global-status-report-buildings-and-construction (accessed on 16 April 2024).
- Debrah, C.; Chan, A.P.; Darko, A. Artificial intelligence in green building. Autom. Constr. 2022, 137, 104192. [Google Scholar] [CrossRef]
- Ürge-Vorsatz, D.; Cabeza, L.F.; Serrano, S.; Barreneche, C.; Petrichenko, K. Heating and cooling energy trends and drivers in buildings. Renew. Sustain. Energy Rev. 2015, 41, 85–98. [Google Scholar] [CrossRef]
- Muñoz-Liesa, J.; Royapoor, M.; López-Capel, E.; Cuerva, E.; Gasso-Domingo, S.; Josa, A. Improving urban metabolism: Bi-directional energy and environmental benefits of rooftop greenhouse and building integration. In Proceedings of the Building Simulation 2019: 16th Conference of IBPSA, Rome, Italy, 2–4 September 2019; pp. 5097–5104. [Google Scholar] [CrossRef]
- Zhang, Y.; Yang, Y.; Dubois, M.-C. Light for life: New light solutions for urban plant sites. Acta Hortic. 2022, 1337, 417–434. [Google Scholar] [CrossRef]
- Ahamed, M.S.; Guo, H.; Tanino, K. Modeling heating demands in a Chinese-style solar greenhouse using the transient building energy simulation model TRNSYS. J. Build. Eng. 2020, 29, 101114. [Google Scholar] [CrossRef]
- Rabiu, A.; Na, W.-H.; Akpenpuun, T.D.; Rasheed, A.; Adesanya, M.A.; Ogunlowo, Q.O.; Kim, H.T.; Lee, H.-W. Determination of overall heat transfer coefficient for greenhouse energy-saving screen using Trnsys and hotbox. Biosyst. Eng. 2022, 217, 83–101. [Google Scholar] [CrossRef]
- Klein, S.A. TRNSYS 18: A Transient System Simulation Program; Solar Energy Laboratory, University of Wisconsin: Madison, WI, USA, 2017; Available online: https://sel.me.wisc.edu/trnsys (accessed on 3 September 2020).
- Son, J.E.; Kim, I.S.; Choi, J.M.; Base, J.H. Samgo Greenhouse Horticulture, 2nd ed.; Hyangmunsa: Seoul, Republic of Korea, 2023. [Google Scholar]
- Goo, J. A Study on the Composition and Operation Method of the Rooftop Greenhouse Linked Office Building HVAC System: Focused on Energy Consumption, Thermal Environment and Growth Environment. Marter’s Thesis, University of Seoul, Seoul, Republic of Korea, 2023. [Google Scholar]
- U.S. Department of Energy. New Construction—Commercial Reference Buildings. Office of Energy Efficiency & Renewable Energy. Available online: https://www.energy.gov/eere/buildings/new-construction-commercial-reference-buildings (accessed on 12 April 2024).


| Building Type | Location | RTG Area (m2) | Characteristic | Refs. |
|---|---|---|---|---|
| Research building | Barcelona (Spain) | 75 (real) | - Exchange of heat, CO2, and rainwater between the building and RTG. - Demonstrate the cultivation during winter without the need for additional heating. - Need for further investigation into the cooling impact of an iRTG. | [12,13,18] |
 | ||||
| Warehouse | Malmo (Sweden) | 15,898 (model) | - Analyze the impact of varying parameters such as glazing materials and shading devices for the RTG. - Investigate the heating and cooling saving effect of the warehouse and RTG. | [19] |
 | ||||
| Office | Yeongam (Republic of Korea) | 358 (model) | - Consider the crop energy model (empirical equation for tomato). - Adapt alternating air temperature management (ATM) to reduce the heating load of a BiRTG. - Increase total annual energy load of BiRTG after adapting ATM. | [11] |
 | ||||
| Container | Daejeon (Republic of Korea) | 27 (real) | - Construct a container and RTG for various experiments and data collection. - Compare diverse operating conditions depending on building type (office, hotel, and hospital)/RTG. - Investigate the heating and cooling saving effect of the container and RTG for various conditions. - Analyze the heat transfer through the rooftop surface to investigate the impact of RTG. | This Study |
 | ||||
| 1. A Container Wall | ||||
|---|---|---|---|---|
| Material | Thickness (mm) | U-Value (W/m2K) | Illustration | |
| Wall | G | 2 | 0.376 | 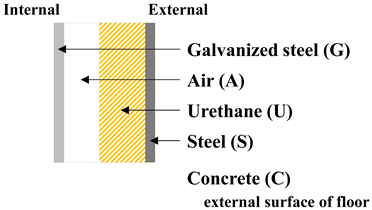 |
| A | 20 | |||
| U | 45 | |||
| S | 2 | |||
| Roof | G | 2 | 0.588 | |
| A | 20 | |||
| U | 20 | |||
| S | 4 | |||
| Floor | G | 2 | 0.272 | |
| A | 20 | |||
| U | 70 | |||
| S | 4 | |||
| C | 300 | |||
| 2. A Greenhouse Covering Material | ||||
| Material | Thickness (mm) | U-Value (W/m2K) | Illustration | |
| Frame | S | 2 | 1.224 | 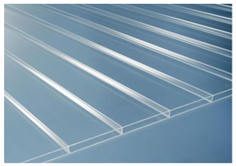 PLEXIGLAS® ALLTOP |
| A | 16 | |||
| S | 2 | |||
| Glass | PLEXIGLAS® ALLTOP | 2.500 | ||
| Floor | Equal to the roof of a container | 0.588 | ||
| Sensor | Model (Manufacturer) | Measurement Accuracy | Measurement Location |
|---|---|---|---|
| Thermocouple | T-type (Omega, Irving, TX, USA) | ±0.5 °C | Two internal columns, each with five points spaced equally along the vertical axis (Use of 10 average values) |
| Humidity sensor | KSH7310 (SEMSECUBE, Seoul, Republic of Korea) | ±3% of full scale | Two internal columns, each with one point (Use of two average values) |
| Radiation sensor | SYE-2007PM (Shinyoung ELE, Seoul, Republic of Korea) | ±5% of full range | External installation beside the greenhouse roof |
| Type | Name | Description |
|---|---|---|
| Type15-3 | Weather Data Reader | - Reading an external weather data file. - The EPW weather data of Daejeon, Republic of Korea. |
| Type56 | Multi-Zone Building | - Modeling the thermal behavior of a building having multiple thermal zones using the TRNBuild modeling result. - Two zones: a container, a rooftop greenhouse. |
| Type14h | Forcing Functions | - Employing a time-dependent forcing function with a repeated pattern. - Solar radiation constraints for shading screen operation during heating and other seasons (presented in Table 6). - Setting the temperature of a greenhouse during heating and cooling seasons (presented in Table 6). |
| Type516 | Multiple Day Scheduler | - Generating the input schedule for a weekday, Saturday, and Sunday. - Heating, cooling, and ventilation schedule for a day (presented in Figure 3). |
| Type2b | Control Strategy | - Generating ON/OFF differential control signal. - ON/OFF signal for window open and ventilation fan depending on the greenhouse inside temperature. |
| Type25f | Printer | - Printing selected variables at specified intervals of time. |
| Type46a | Printegrator | - Printing the integrated values of selected variables. - Generating monthly integrated energy load data. |
| Name | Minimum Limiting Temperature (°C) | Night-time Temperature (°C) | Optimal Growth Temperature (°C) | Maximum Limiting Temperature (°C) |
|---|---|---|---|---|
| Tomato | 5 | 8–13 | 20–25 | 35 |
| Watermelon | 10 | 13–18 | 23–28 | 35 |
| Pumpkin | 8 | 10–15 | 20–25 | 35 |
| Cucumber | 8 | 10–15 | 23–28 | 35 |
| System Component | Applied Period | Operation Constraint | ||
|---|---|---|---|---|
| Parameter | Value | |||
| Shading screen | Heating | 9 h–17 h | Solar radiation (W/m2) | On @ 1000 |
| Other | 9 h–11 h | On @ 1200 | ||
| 11 h–14 h | On @ 800 | |||
| 14 h–17 h | On @ 1000 | |||
| Thermal screen | Heating | After sunset | - | Always On |
| Other | After sunset | Inside temperature (°C) | On @ 16 Off @ 18 | |
| Window (N.V **) | Heating | Daytime (8 h–18 h) | Inside temperature (°C) | Open @ 27 Close @ 24 |
| Cooling | All day | - | Open when EHP is OFF | |
| Other | Daytime (7 h–19 h) | Inside temperature (°C) | Open @ 25 Close @ 21 | |
| Night-time (19 h–7 h) | Open @ 14 Close @ 12 | |||
| Ventilation fan (F.V **) | Heating | - | - | Always Off |
| Other | Daytime (7 h–19 h) | Inside temperature (°C) | Open @ 26 Close @ 22 | |
| Night-time (19 h–7 h) | Open @ 15 Close @ 13 | |||
| EHP *** | Heating * | Daytime (8 h–18 h) | Setting temperature (°C) | 22 |
| Night-time (18 h–8 h) | 14 | |||
| Cooling * | Daytime (7 h–19 h) | 27 | ||
| Night-time (19 h–7 h) | Always Off | |||
| Annual Energy Load (kWh/m2yr) | ||||||||||
|---|---|---|---|---|---|---|---|---|---|---|
| Small Office | Small Hotel | Hospital | ||||||||
| Heating | Cooling | Total | Heating | Cooling | Total | Heating | Cooling | Total | ||
| Sep. | Cont. | 81.3 | 25.9 | 107.3 | 106.0 | 13.4 | 119.4 | 279.1 | 93.0 | 372.1 |
| GH | 81.1 | 112.7 | 193.8 | 81.1 | 112.7 | 193.8 | 81.1 | 112.7 | 193.8 | |
| Int. | Cont. | 48.5 | 32.3 | 80.8 | 78.7 | 15.9 | 94.6 | 230.0 | 102.3 | 332.3 |
| RTG | 63.8 | 122.2 | 186.1 | 59.9 | 123.4 | 183.3 | 60.7 | 120.8 | 181.5 | |
| Energy Reduction Rate (%) | ||||||||||
| Small Office | Small Hotel | Hospital | ||||||||
| Heating | Cooling | Total | Heating | Cooling | Total | Heating | Cooling | Total | ||
| Cont. | 40.3 | −24.4 | 24.7 | 25.7 | −18.2 | 20.8 | 17.6 | −10.0 | 10.7 | |
| RTG | 21.2 | −8.4 | 4.0 | 26.1 | −9.5 | 5.4 | 25.1 | −7.2 | 6.3 | |
| Total | 30.8 | −11.4 | 11.4 | 25.9 | −10.4 | 11.3 | 19.3 | −8.5 | 9.2 | |
Disclaimer/Publisher’s Note: The statements, opinions and data contained in all publications are solely those of the individual author(s) and contributor(s) and not of MDPI and/or the editor(s). MDPI and/or the editor(s) disclaim responsibility for any injury to people or property resulting from any ideas, methods, instructions or products referred to in the content. |
© 2024 by the authors. Licensee MDPI, Basel, Switzerland. This article is an open access article distributed under the terms and conditions of the Creative Commons Attribution (CC BY) license (https://creativecommons.org/licenses/by/4.0/).
Share and Cite
Choi, E.-J.; Lee, D.; Lee, S.-M. Impact of Building Integrated Rooftop Greenhouse (BiRTG) on Heating and Cooling Energy Load: A Study Based on a Container with Rooftop Greenhouse. Agriculture 2024, 14, 1275. https://doi.org/10.3390/agriculture14081275
Choi E-J, Lee D, Lee S-M. Impact of Building Integrated Rooftop Greenhouse (BiRTG) on Heating and Cooling Energy Load: A Study Based on a Container with Rooftop Greenhouse. Agriculture. 2024; 14(8):1275. https://doi.org/10.3390/agriculture14081275
Chicago/Turabian StyleChoi, Eun-Jung, Doyun Lee, and Sang-Min Lee. 2024. "Impact of Building Integrated Rooftop Greenhouse (BiRTG) on Heating and Cooling Energy Load: A Study Based on a Container with Rooftop Greenhouse" Agriculture 14, no. 8: 1275. https://doi.org/10.3390/agriculture14081275