Article

Research on Real-Time Groundwater Quality Monitoring System Using Sensors around Livestock Burial Sites

1
National Institute of Environmental Research, Incheon 22689, Republic of Korea
2
Department of Environmental Engineering, Korea National University of Transportation, Chungju 27469, Republic of Korea
*
Author to whom correspondence should be addressed.
Agriculture 2024, 14(8), 1278; https://doi.org/10.3390/agriculture14081278
Submission received: 12 April 2024 / Revised: 9 July 2024 / Accepted: 10 July 2024 / Published: 2 August 2024
(This article belongs to the Section Agricultural Water Management)

Abstract

:
This study aimed to establish an economical and rapid response system for carcass leachate leakage using a real-time groundwater monitoring system with sensors. In this work, four parameters, namely electrical conductivity (EC), chloride (Cl), nitrate nitrogen (NO3-N), and ammonia nitrogen (NH4-N), were monitored. Three actual livestock burial sites were selected as pilot areas and monitored for three years, from 2019 to 2021, using these four parameters. As a result of sensor quality control, the accuracy and precision range of the four parameters were found to be acceptable, within 75~125% and ±25%, respectively. When compared to the laboratory measurement value, the field measurement value recorded by the sensors was 1.1 times higher for EC, 1.6 times higher for Cl, and 2.5 times higher for NO3-N. The correlation analysis between the lab measurement and sensor measurement results showed that the EC had the highest correlation coefficient of 0.3837. Additionally, the factor extraction results showed that the EC showed a relatively significant correlation compared to the other parameters. In summary, based on the results of this study, EC may be considered a key sensor parameter for evaluating leachate leakage from groundwater near disposal sites.

1. Introduction

Nationwide groundwater monitoring around livestock burial sites caused by avian influenza (AI) and foot-and-mouth disease (FMD) has been conducted due to domestic infectious diseases [1,2]. The extensive impact of burials on groundwater environments requires indicators to distinguish the effects of leachate [3]. Moreover, overseas, the increasing number of livestock burial sites is creating groundwater pollution, prompting the need for continuous monitoring to assess this influence around burial sites [4,5,6]. Generally, it has been reported that when burying one pig (70~100 kg), approximately 6 L of leachate is generated after one week, and about 12 L is generated after two weeks [7]. According to the literature, five months after creating a burial site, there were changes in the physical and chemical factors of groundwater environments compared to 20 months after creating a burial site ([increase] EC, DO, HCO3, TOC, T-N, SO42−, [decrease] pH) [8]. Therefore, it is necessary to take appropriate measures, such as real-time monitoring around burial sites, establishing an immediate response system, and preparing measures to strengthen leachate collection.
There is a need for the development of customized real-time monitoring technology optimized for the environmental characteristics of burial sites. For groundwater quality monitoring, research is being conducted to produce a sensor device based on multiple sensors to measure multiple parameters and evaluate its performance. Efforts are being made to understand the influence of the external environment on the sensor and to explore rational utilization and maintenance methods for the sensor [9]. Additionally, for the real-time monitoring of sensors such as chloride, nitrate, TDS, etc. in field tests and immediate actions, a groundwater observation system with remote control capabilities is being developed [10,11,12]. Research is ongoing to downsize the communication system and develop systems that can be installed at various observation points [13]. Applying a real-time monitoring system has the advantage of allowing one to acquire economic and immediate data. Through these data, it is possible to confirm seasonal fluctuation characteristics and respond immediately to leachate leaks, and these data can be accumulated over months or years [14].
In this study, four parameters (electrical conductivity (EC), nitrate nitrogen (NO3-N), ammonia nitrogen (NH4-N), and chloride (Cl)) that can determine the possibility of groundwater leakage were selected for the simultaneous analysis of multiple sensors. These sensors were applied to three pilot areas of potentially hazardous landfill sites with a high risk of groundwater leakage. The accuracy of water quality data for the four parameters provided by sensors installed in groundwater aquifers was analyzed to select the optimal on-site sensors for the stable evaluation of groundwater leakage.

2. Materials and Methods

2.1. Characteristics of the Study Area

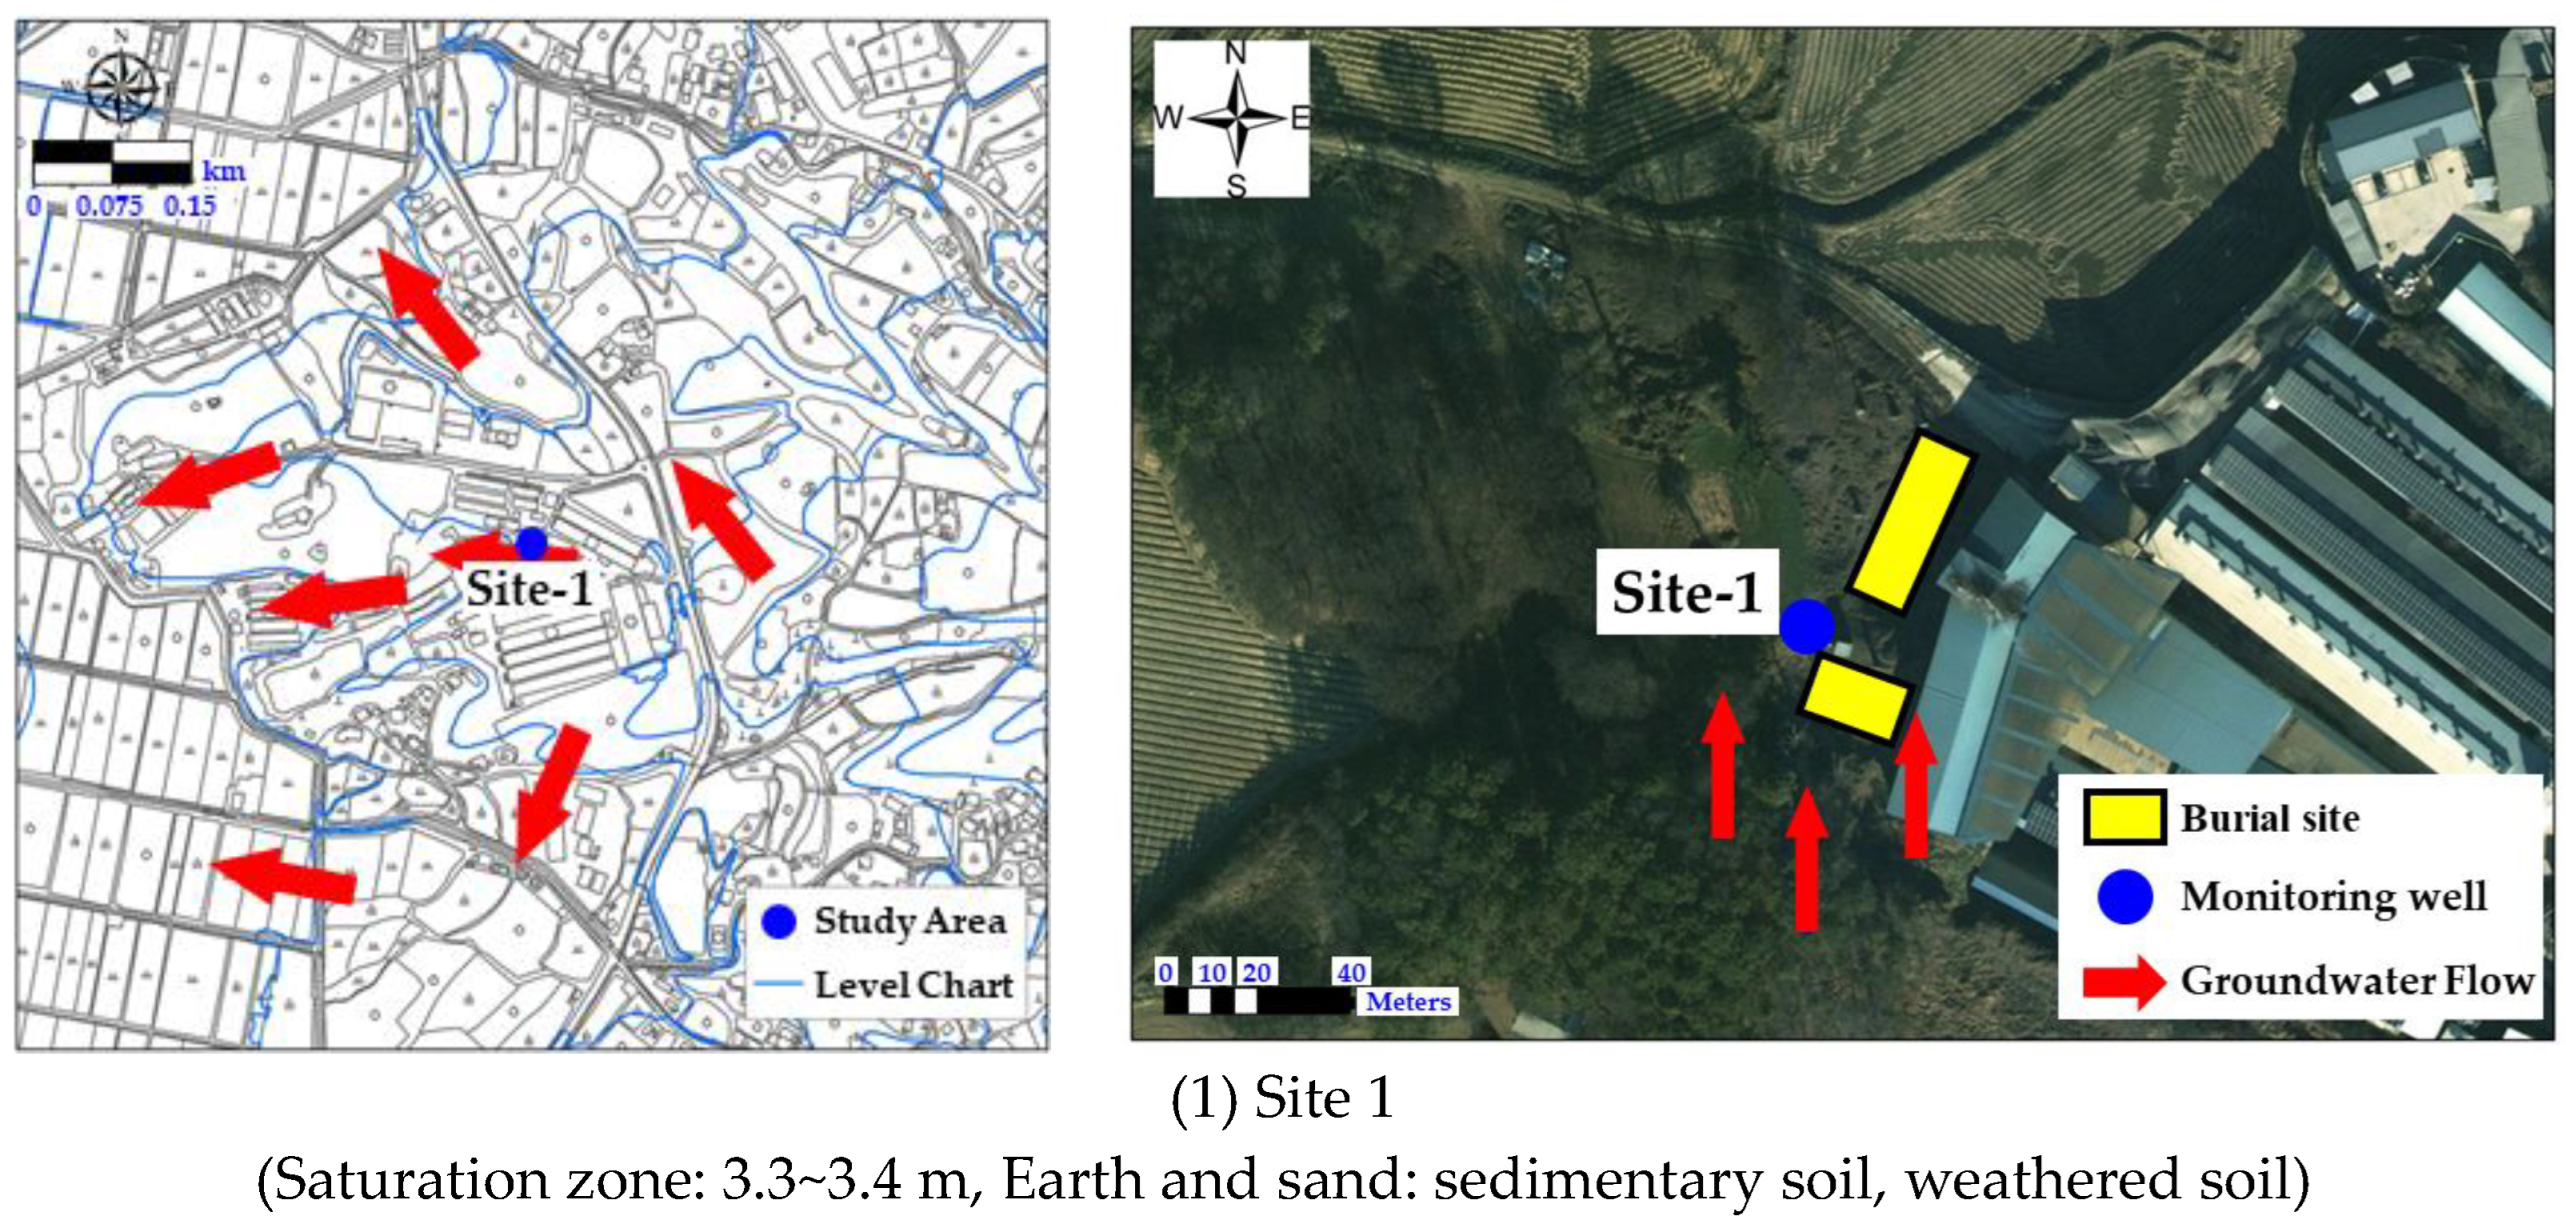
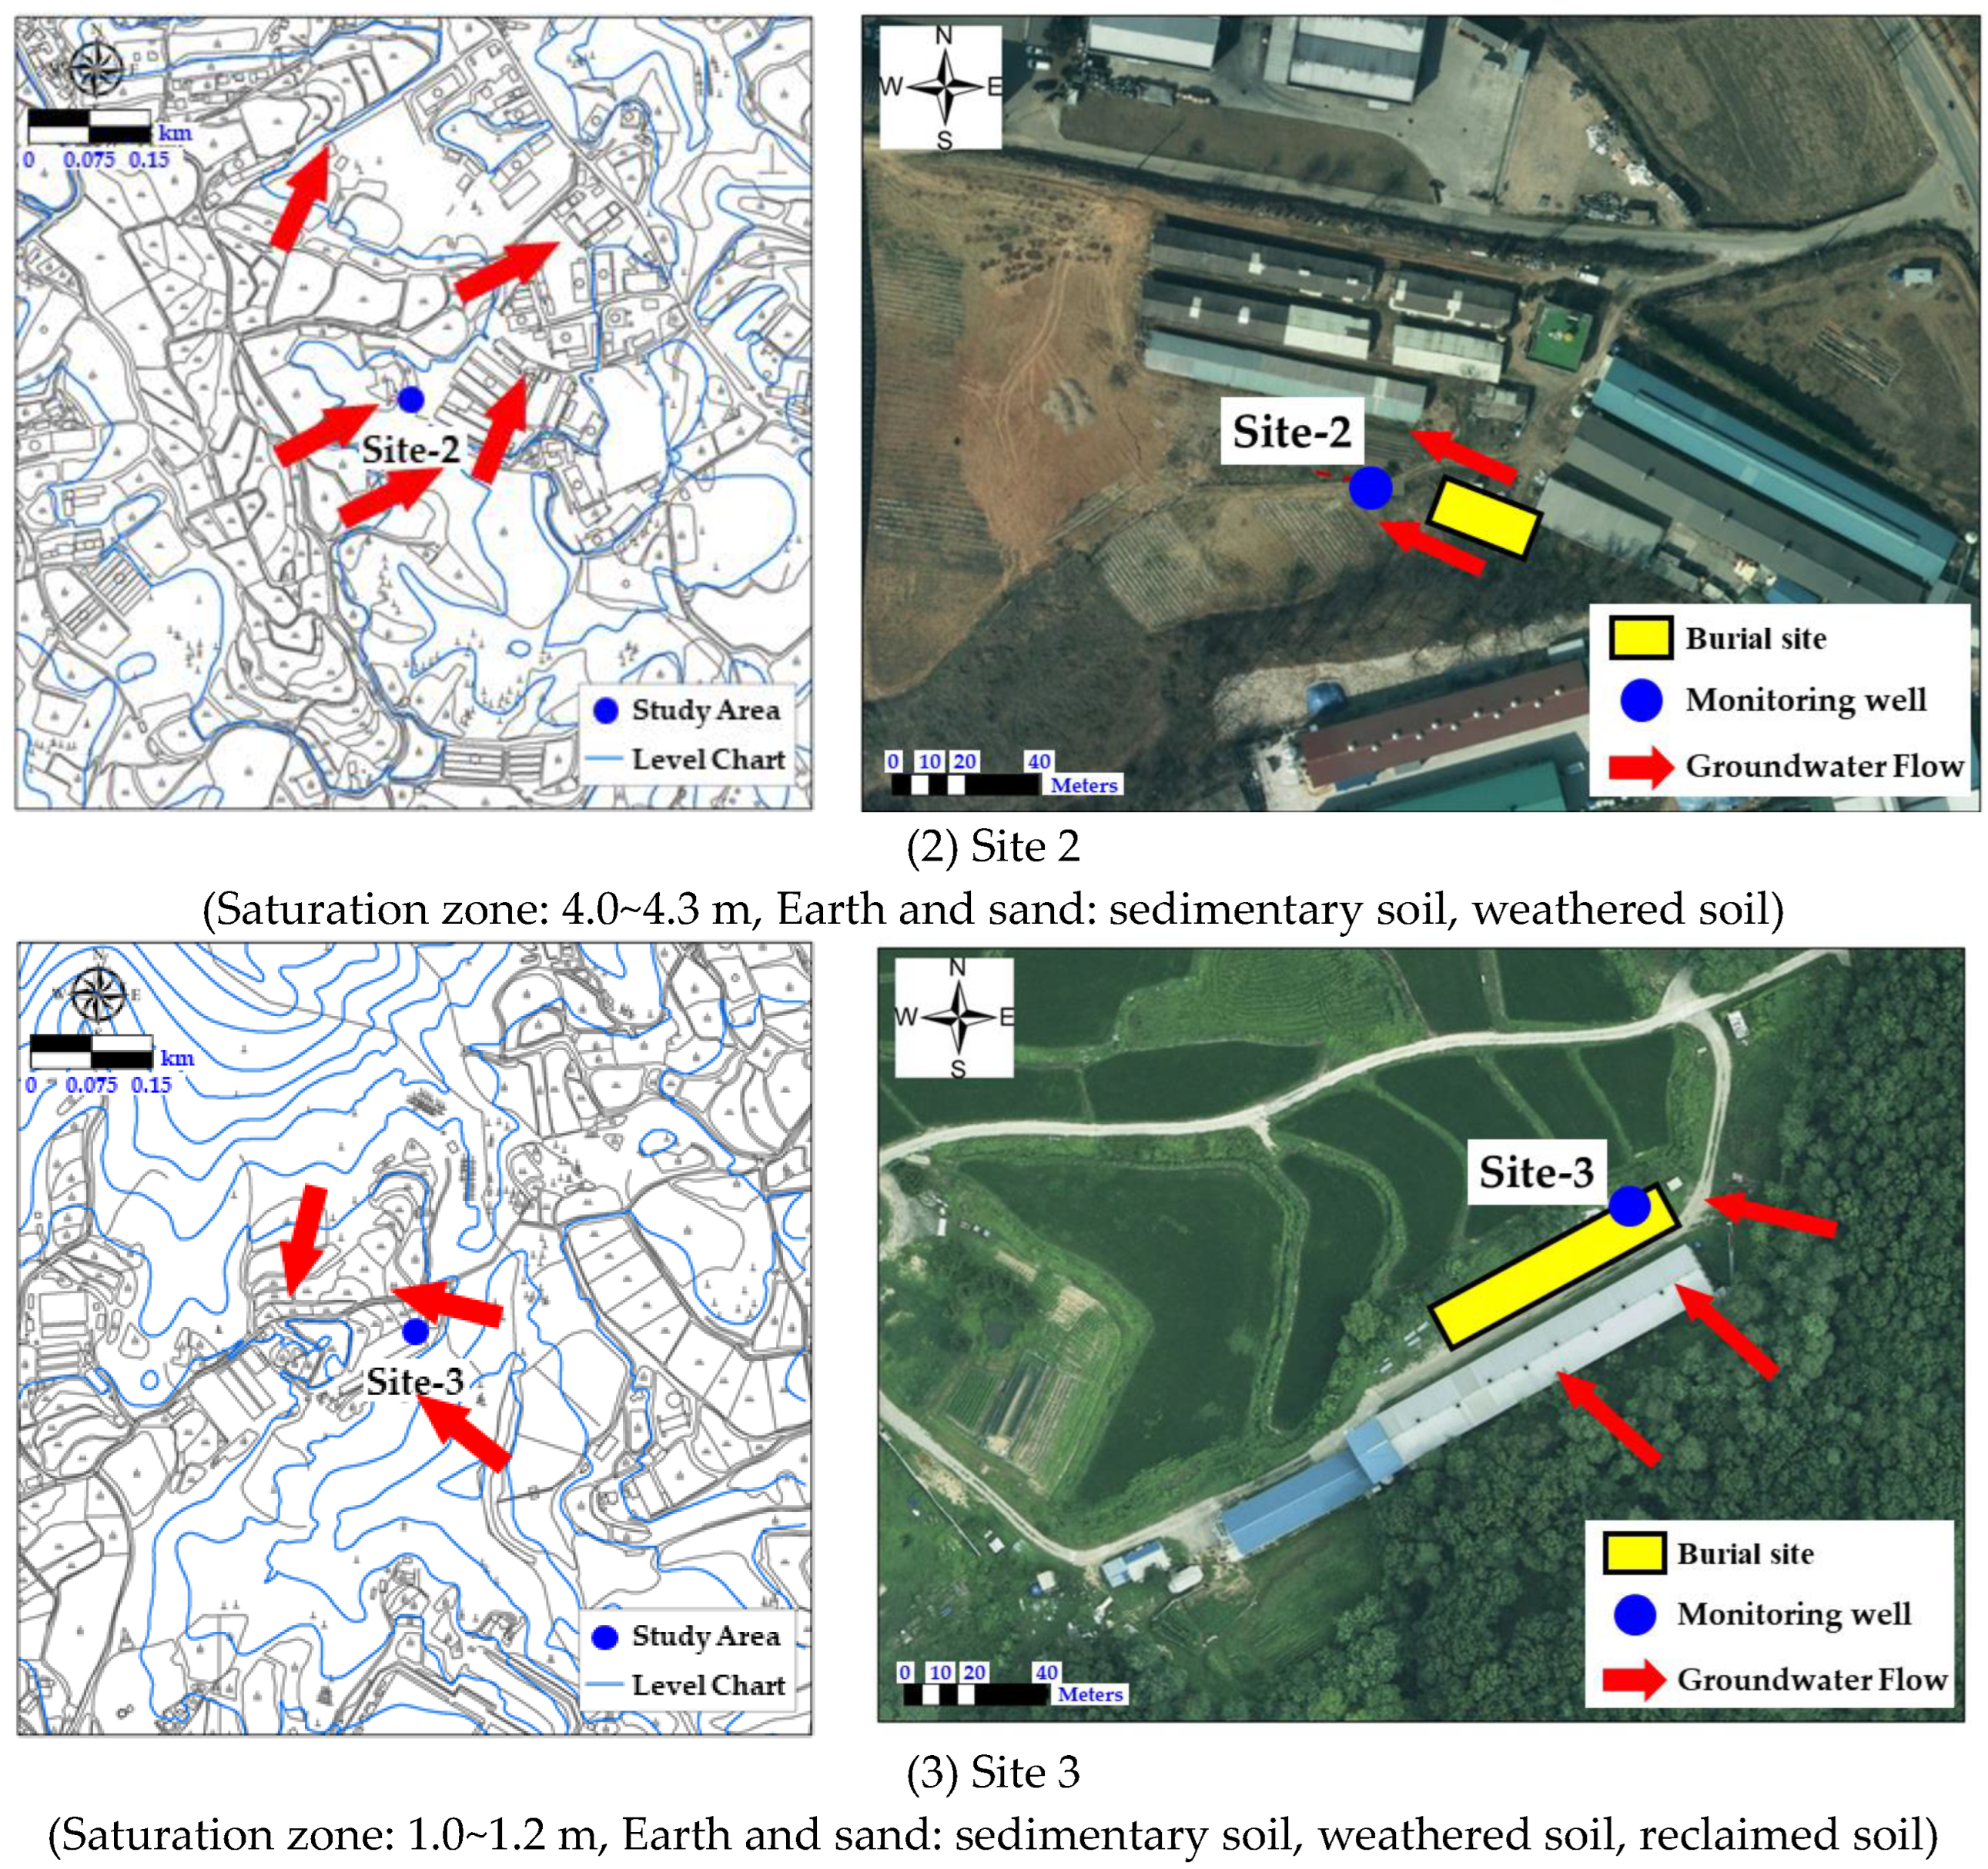
This study conducted monitoring at three landfill sites formed by avian influenza (AI) and African swine fever (ASF) from 2019 to 2021. The average monthly rainfall in the study area is 61.8~107.1 mm/month. Between June and September, when rainfall is concentrated, the rainfall is approximately 1.8~2.1 times higher, at 130.8~193.2 mm/month. Monitoring wells were installed downstream of the landfill sites, taking into consideration the groundwater flow direction. The field information for each monitoring point is shown in Table 1 below.
The study area is a landfill site formed by AI and ASF, and it was established in 2014 and 2016, respectively. Monitoring well points were installed downstream of the groundwater flow direction, considering the possibility of leachate discharge. The measurement sensors were installed inside the well points to directly assess the groundwater impact from the landfill site (Figure 1).

2.2. Sensor and Analytical Parameter Selection

This study aims to evaluate sensors that can be applied to general landfill site monitoring. Therefore, it is necessary to select sensors considering the diameter of the well points, the precision of each measurement parameter, and the characteristics of groundwater around the landfill site. When selecting sensors, products certified with CE (Conformite Europeenne Marking), which is the safety, environmental, and consumer protection standard of the European Union, as well as products certified with ISO9001 (International Quality Management System Standard) and ISO14000 (International Environmental Standard), were compared and reviewed. The field applicability of the three sensors to groundwater was compared with the following factors, as shown in Table 2: ① the diameter of the applicable well points and the ability to install multi-parameter sensors, ② its precision, error range, wide measurement range, cost-effectiveness, and durability for each measurement parameter, ③ its suitability for seasonal or local changes in groundwater depth, ④ the minimization of corrosion, wear, or deformation due to external exposure, and ⑤ the convenience of monitoring through short-range communication technology [9,15,16]. However, the selected sensor observation parameters are EC, NO3-N, NH4-N, and Cl, which are the parameters that are most sensitive to changes in groundwater when leachate is discharged from a landfill site [17].
In this study, the sensor selected was the Aqua Troll 600, as shown in Table 2. The Aqua Troll 600 has the widest measurement range and measurement depth limits for parameters such as EC, NO3-N, and NH4-N.

2.3. Sensor Calibration Evaluation

Suitable target concentrations were prepared for NO3-N, NH4-N, and Cl; the standard solutions for them were three concentrations of 1, 50, and 100 mg/L. The standard solution for Cl was four concentrations of 5, 150, 250, and 500 mg/L, and the sensor’s measurements in response to concentration changes were tested in triplicate. Tests were conducted for the electrode’s average, standard deviation, accuracy, and precision in the respective solutions. Additionally, EC values were measured to investigate their changes and analyze trends. Through this process, the reliability of the sensor in response to concentration changes under laboratory conditions and its correlation with electrical conductivity were determined before deploying the sensor in the field. The experimental results were used to determine if the accuracy fell within 75% to 125% and the precision within ±25%, which are the process test criteria.

2.4. Sensor Installation and Real-Time Monitoring System Establishment

To receive national groundwater quality automatic observation results, additional hardware and software for security, such as firewalls, are necessary, and the addition of dual storage media is also required to prevent data loss [9,18,19].
To ensure the safety of measurement data from public exposure and cyber threats such as hacking, the system was configured to use a Layer 4 Switch for traffic switching. This setup allows for server load balancing and redundancy (server duplication) and ensures stable operation through data backup using a storage configuration. Additionally, to collect and store information, a data logger, which is a device for collecting and storing data, was equipped with additional communication output ports. To facilitate the transmission of measurement data, a CDMA (Code Division Multiple Access) communication modem, specifically the TMX300 modem, was installed. This configuration enables real-time monitoring and data accumulation using the Internet (Figure 2).

2.5. Groundwater Sample Collection

To assess the precision of the sensors, monthly groundwater samples were collected, and a water quality analysis was performed, excluding the dry season. Sampling was carried out after conducting a purging process, which involved pumping approximately three times the total volume, considering the groundwater level and well conditions, until the measurements of the field water quality parameters (such as EC, pH, etc.) stabilized. The stability of the field water quality measurement values was assessed based on data from the United States Geological Survey [20] (Table 3). Samples were collected with an appropriate flow rate so as not to obtain air bubbles or headspace. The collected samples were filtered (0.45 μm, nylon) and subjected to nitrate treatment, which was performed to keep the target substances in the groundwater samples in a stable condition. During transportation and storage, the samples were maintained under refrigeration (0~4 °C) to prevent degradation, and samples expected to have a high level of contamination were separately categorized for transportation and storage.

2.6. Groundwater Sample Analysis Methods

The collected groundwater samples were analyzed using methods specified in the “Drinking Water Quality Testing Standards” and the “Water Pollution Control Process Testing Standards”. For parameters not covered by these standards, methods from the “Standard Methods [21]” and similar references were applied. Field measurements, including water temperature, pH, DO, ORP, and EC, were conducted using a portable water quality analyzer (ProPlus Multiparameter, YSI; Yellow Springs Instrument Inc., Yellow Springs, OH, USA). Field water quality measurements were taken by connecting the electrodes of five analysis parameters to a Quatro cable, and a continuous flow cable adapter designed to enable continuous measurement of solutions was used. Cations (Ca2+, Mg2+, Na+, K+) were measured based on the method specified in “Standard Method 3120”, and analytical instruments such as the ICP-OES (Inductively Coupled Plasma Optical Emission Spectrometer) from the Optima-8300 and 7300 DV (PerkinElmer, Shelton, CT, USA) and the 720-ES (Varian, Palo Alto, CA, USA) were used for measurements. The anion (HCO3, SO42−, Cl) analysis was conducted following the “Drinking Water Quality Testing Standards”, and the analytical instrument ICS-900 (Ion Chromatography System, Thermo Fisher, Waltham, MA, USA) with an IonPac AS14 column (Dionex, Sunnyvale, CA, USA) was used for measurements. HCO3 was measured using a titration method with 0.05 N-HCl simultaneously in the field.

2.7. Statistical Interpretation Method

To determine the interrelation between pollution sources, it was necessary to derive statistical correlations among different pollution sources based on the monitoring results. A factor analysis was conducted using the SPSS Ver. 25 program, following the steps “Data input → Data standardization → Factor extraction → Factor rotation → Final factor extraction”.
The factor analysis involved standardizing the data for the analysis results of the field measurement parameters, cations and anions. Factor extraction was carried out by assessing the Kaiser–Meyer–Olkin (KMO) measure and conducting Bartlett’s test of sphericity. The suitability criteria for the factor analysis included a KMO value of 0.5 or higher [22], and Bartlett’s test of sphericity was expected to yield a significant p-value (if the p-value is ‘0.000’, it generally indicates that there is a significant correlation among the variables).
Communality indicates how much each variable is explained by the extracted factors. It represents the extent to which the variance of a variable is explained by the extracted factors and ranges between 0 and 1. If the commonality value for a variable is less than 0.50, it is either ignored in the interpretation or the variable is removed, and the factor analysis is performed again [23]. In this regard, researcher discretion and judgment are crucial, and caution should be exercised when removing variables. Typically, a communality value above 0.4 is considered acceptable as a criterion [22], indicating that variables with values above this threshold can be reasonably used.

3. Results and Discussion

3.1. Sensor Quality Control and Correlation Analysis with EC through Indoor Experiments

3.1.1. Nitrate Nitrogen (NO3-N)

The results of the NO3-N measurements using ISE (ion-selective electrode) sensors at concentrations of 1 mg/L, 50 mg/L, and 100 mg/L showed that the average NO3-N values were 1.0 mg/L, 46.6 mg/L, and 99.5 mg/L. Consequently, the standard deviations ranged from 0.1 to 0.7, the accuracy ranged from 93.3% to 104.1%, and the precision ranged from 0.5% to 5.0%. These results not only met the process testing standards of accuracy, within 75–125%, and precision, within ±25%, but also indicated highly reliable measurement outcomes (Table 4).
Depending on the amount of NO3-N injected, the EC measurements by the ISE sensor showed average values of 0.013 μS/cm, 0.460 μS/cm, and 0.903 μS/cm, respectively. This indicates a proportional increase in EC with increasing NO3-N concentration.

3.1.2. Ammonium Nitrogen (NH4-N)

The results of the NH4-N measurements using ISE sensors at concentrations of 1 mg/L, 50 mg/L, and 100 mg/L showed that the average NH4-N values were 1.0 mg/L, 50.7 mg/L, and 101.6 mg/L. Consequently, the standard deviations ranged from 0.0 to 1.1, the accuracy ranged from 101.3% to 101.6%, and the precision ranged from 1.1% to 1.6%. These results not only met the process testing standards of accuracy, within 75–125%, and precision, within ±25%, but also indicated highly reliable measurement outcomes (Table 5).
Depending on the amount of NH4-N injected, the EC measurements by the ISE sensor showed average values of 0.013 μS/cm, 0.484 μS/cm, and 0.942 μS/cm, respectively. This indicates a proportional increase in electrical conductivity with increasing NH4-N concentration.

3.1.3. Chloride (Cl)

The results of the Cl measurements using ISE sensors at concentrations of 5 mg/L, 150 mg/L, 250 mg/L, and 500 mg/L showed that the average Cl values were 4.9 mg/L, 157.2 mg/L, 244.0 mg/L, and 498.8 mg/L. Consequently, the standard deviations ranged from 0.2 to 1.3, the accuracy ranged from 99.3% to 100.0%, and the precision ranged from 0.1% to 4.0%. These results met the process testing standards of accuracy, within 75~125%, and precision, within ±25% (Table 6). The EC measurements also showed a proportional increase in the amount of Cl, with average values of 0.019 μS/cm, 0.499 μS/cm, 0.734 μS/cm, and 1.451 μS/cm (Table 6).
For each parameter, standard solutions were prepared to evaluate the reliability of the sensor. The results showed that the measured concentrations and EC increased proportionally with the concentration of each parameter. The accuracy (within 75% to 125% of the process testing standards) and precision (within 25% or less of the process testing standards) were excellent, indicating a high level of reliability. Furthermore, with the increase in NO3-N and NH4-N, the EC increased by approximately 0.0893 to 0.0932 μS/cm for each parameter when the concentration increased by 10 mg/L. For chloride ions, there was an increase of approximately 0.029 μS/cm when the concentration increased by 10 mg/L. Therefore, it was observed that the variation in EC was high with changes in NH4-N.

3.1.4. Multiple (Two or More) Standard Substance Injections for Electrical Conductivity Change Experiment

An experiment on EC change was conducted using samples mixed with two or three parameters at specified concentrations of NO3-N, Cl, and NH4-N. For two-parameter combinations, the following combinations were used: ① NO3-N and NH4-N standard solutions, ② NO3-N and Cl standard solutions, and ③ NH4-N and Cl standard solutions. ④ For three-parameter combinations, a mixture of NO3-N, NH4-N, and Cl standard solutions was used. The concentrations of each parameter used in these experiments were selected based on the minimum concentrations expected in the landfill analysis, which were 2 mg/L for NO3-N, 2 mg/L for NH4-N, and 10 mg/L for Cl. This allowed us to understand how the EC changes with this mixture of parameters, as shown in Table 7.
Under the condition of a mixture of NO3-N and NH4-N ①, the EC was 0.046 μS/cm, which was lower compared to other conditions. Furthermore, in the mixture solution of NO3-N, NH4-N, and Cl ④, the EC was 0.071 μS/cm, which was higher than for the mixture of two parameters. This confirms that the flow of charge was more active due to the presence of all three parameters.

3.1.5. Performance Verification Evaluation of Ion-Selective Electrodes (ISEs) and Maintenance Response Review

In order to operate ISEs in optimal condition, regular calibration and maintenance are necessary. In this study, calibration was conducted at monthly intervals, first before the field installation and then after one month of self-operation.
In this study, the sensors were directly inserted into field samples, exposing them to various interfering substances and ions. Therefore, it was possible to assess the sensor’s characteristics after a certain period had passed. Information about the sensor’s slope and baseline before and after its insertion into the field can be used to identify contamination and changes in the sensor’s characteristics in the sample (Figure 3).
The calibration method involved placing each ISE (NO3-N, NH4-N, Cl) together with a reference electrode into standard solutions, allowing them to stabilize for a certain period, and recording the potential difference for each concentration. For the NH4-N and NO3-N standard solutions, a 10-fold or 100-fold difference in concentration was used to perform two-point calibration with low and high concentrations. In other words, calibration was conducted using standard solutions of 1 and 100 mg/L or 5 and 500 mg/L. For chloride ions, two-point calibration was also performed using concentrations of 2 and 200 mg/L or 5 and 500 mg/L. Typically, when using a 1:1 ion, the standard slope is 57 ± 2 mV (10-fold).

3.2. Groundwater Monitoring Results for Each Parameter Using Sensors

3.2.1. Electrical Conductivity (EC)

Electrical conductivity is an important parameter for determining the leachate discharge in the field, as it increases significantly with the presence of NO3-N, NH4-N, Cl, and other substances when leachate is generated from livestock burial sites [24]. According to the sensor measurements, the EC value at Site 1 was 775.5 μS/cm, at Site 2, it was 515.8 μS/cm, and at Site 3, it was 1420.7 μS/cm, indicating an increasing trend in EC concentration during rainfall events (Table 8).

3.2.2. Nitrate Nitrogen (NO3-N)

In the case of nitrate nitrogen, it is known as a factor that describes the nitration process, in addition to changes in NH4-N. It was confirmed that rural groundwater exhibited higher concentrations of NO3-N than leachate discharge groundwater from the livestock burial sites. NO3-N, along with NH4-N and Cl, is known to be a substance that may be influenced by leachate discharge from burial sites [25]. According to the sensor measurements, the NO3-N concentration at Site 1 was 10.6 mg-N/L, at Site 2, it was 27.6 mg-N/L, and at Site 3, it was 3.5 mg-N/L. This indicates lower values compared to the literature finding of 49 mg-N/L [26] (Table 8).

3.2.3. Ammonia Nitrogen (NH4-N)

Groundwater from areas where leachate has been discharged, such as from livestock burial sites, tends to have higher concentrations of NH4-N compared to rural groundwater [1,8]. This is consistent with the field measurement results, where the oxidation–reduction potential (ORP) values showed the following trend: rural groundwater > monitored groundwater > leachate discharge from the burial site. This pattern can be attributed to the absence of nitrification reactions due to the anaerobic conditions in the leachate and surrounding monitored groundwater aquifers, resulting in delayed oxidation reactions and allowing for the identification of concentration differences caused by leachate discharge [27]. According to the NH4-N sensor measurements, the concentrations were [Site 1] 0.386 mg-N/L, [Site 2] 0.854 mg-N/L, and [Site 3] 0.386 mg-N/L (Table 8).

3.2.4. Chloride (Cl)

Chloride is another representative contaminant, as mentioned earlier, that indicates the influence of leachate discharge, similar to NH4-N. The Cl sensor measurements showed concentrations of [Site 1] 147.2 mg/L, [Site 2] 13.0 mg/L, and [Site 3] 112.3 mg/L. It exhibited a trend of increasing concentrations, similar to EC, during rainfall events (Table 8).

3.3. Comparative Evaluation of Sensor Accuracy in Measuring Field Concentrations

3.3.1. Monitoring Results for Site 1

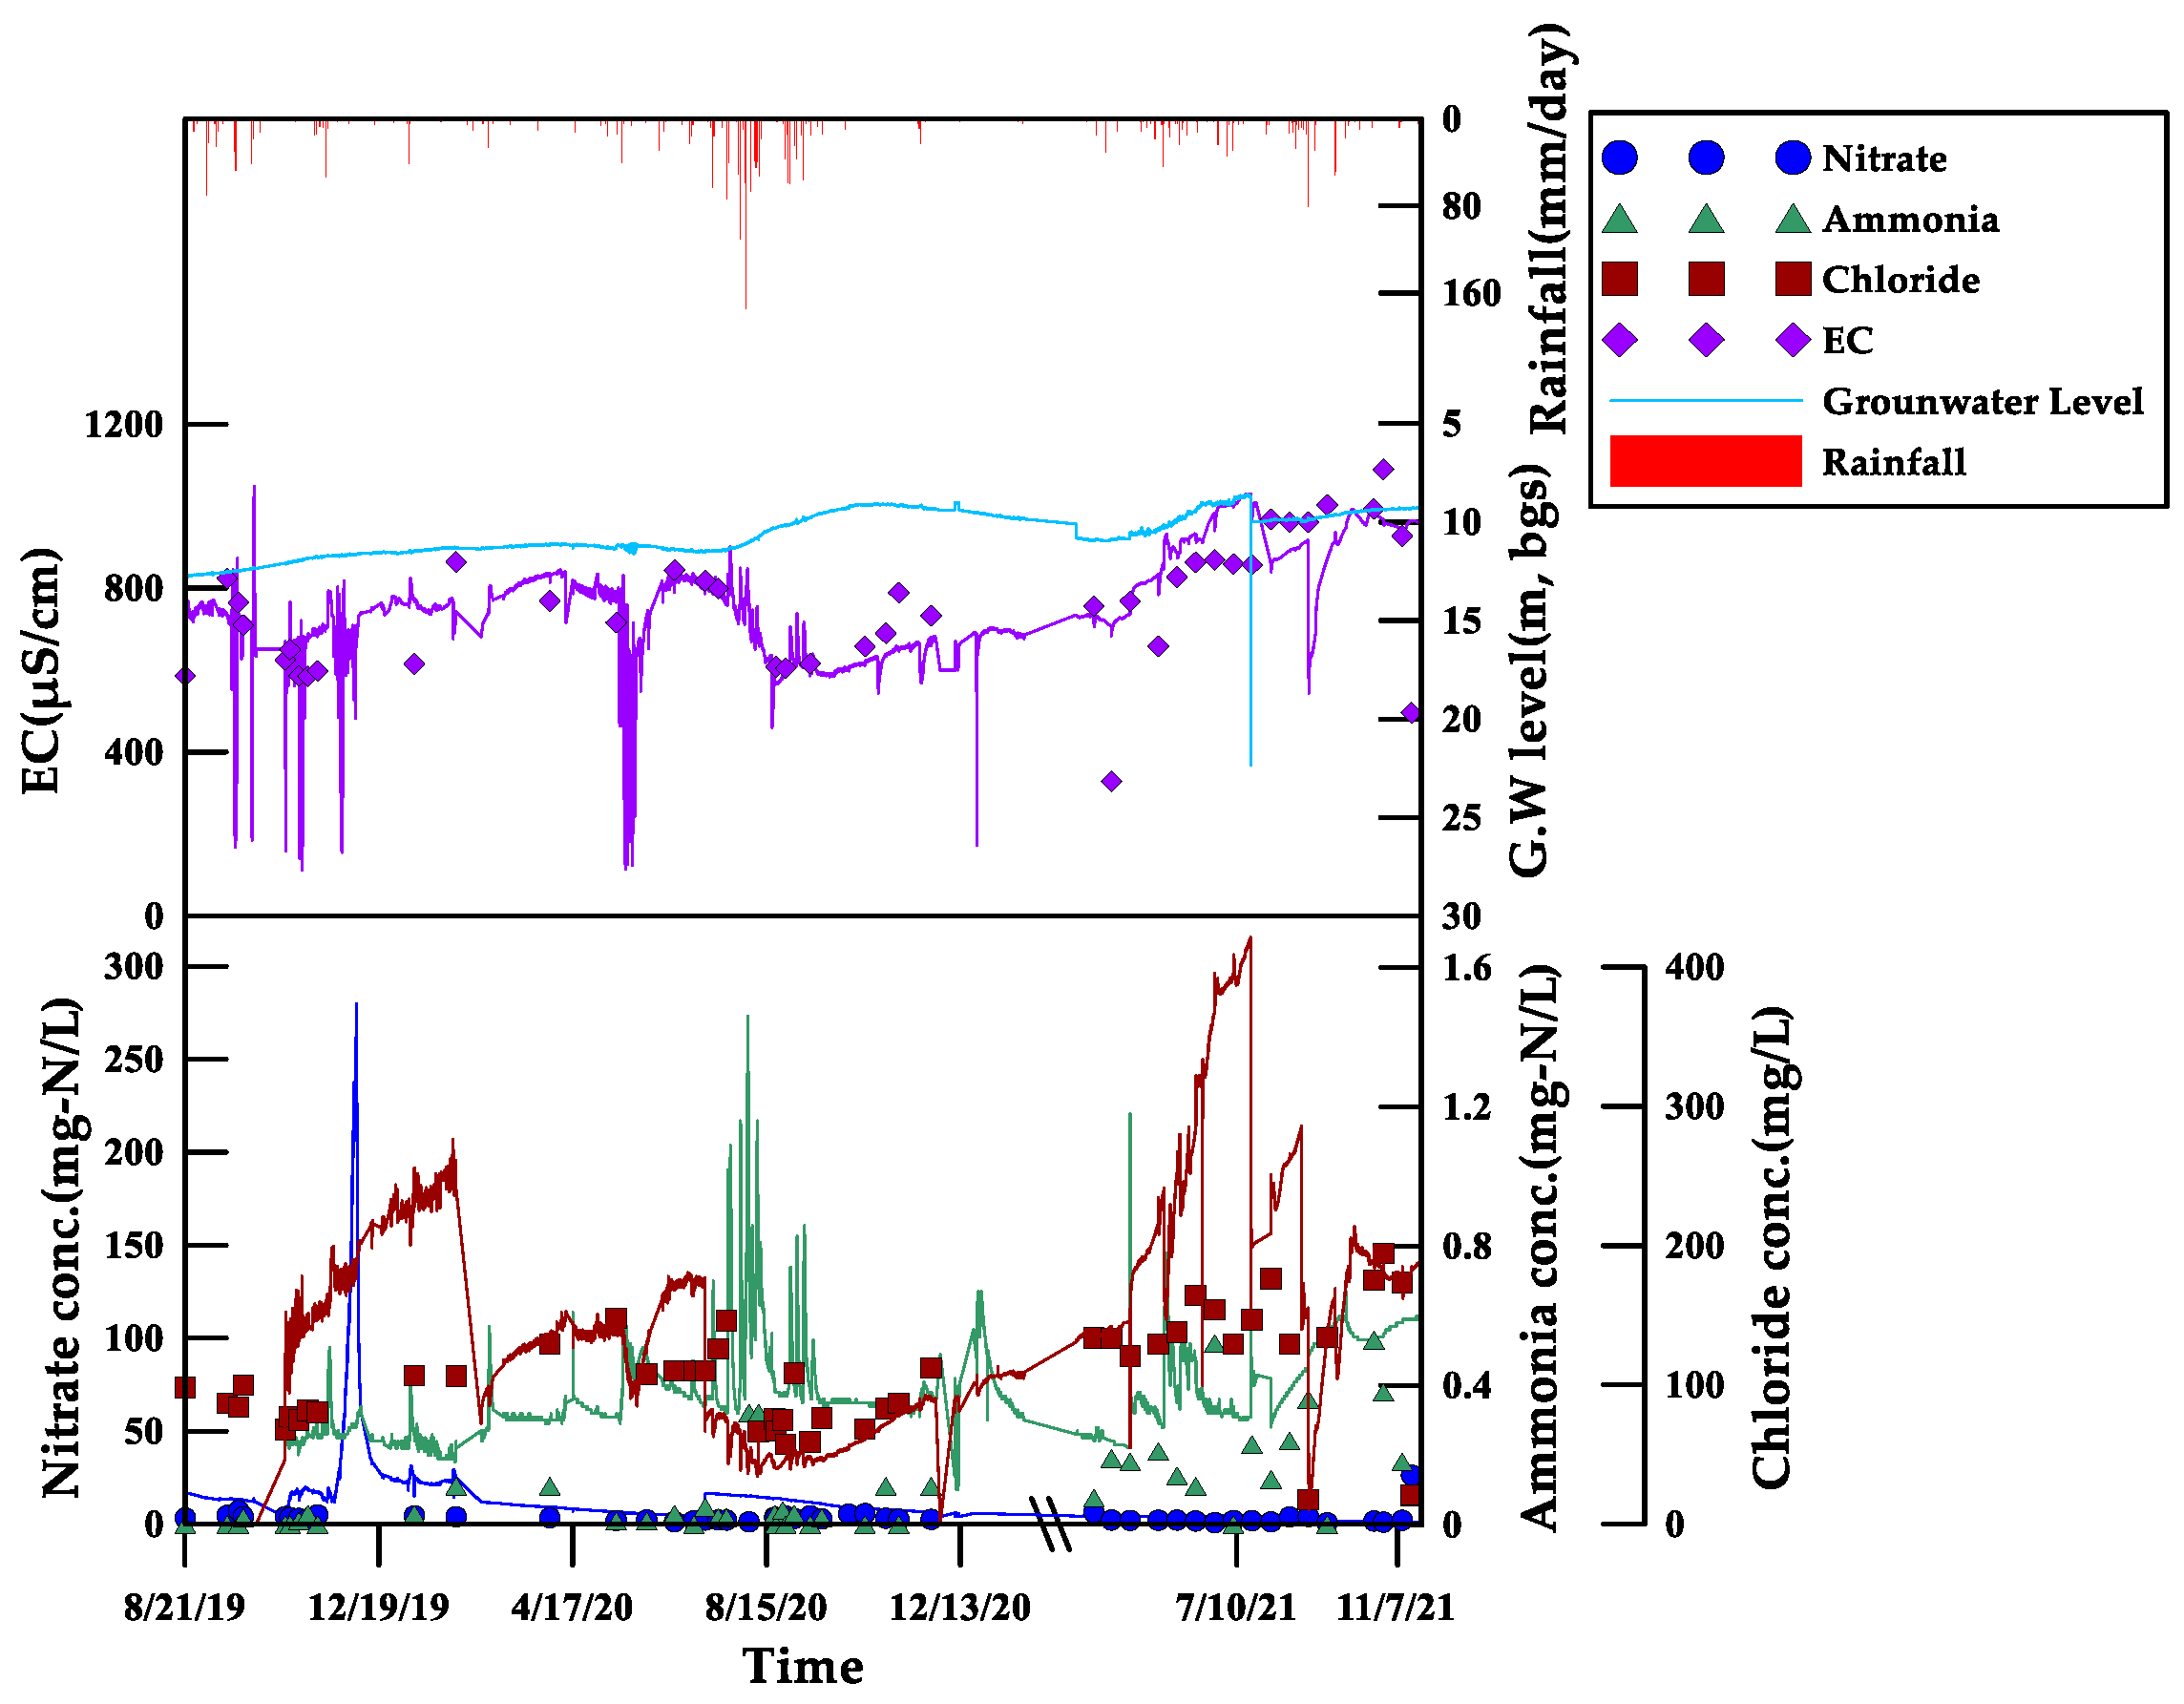
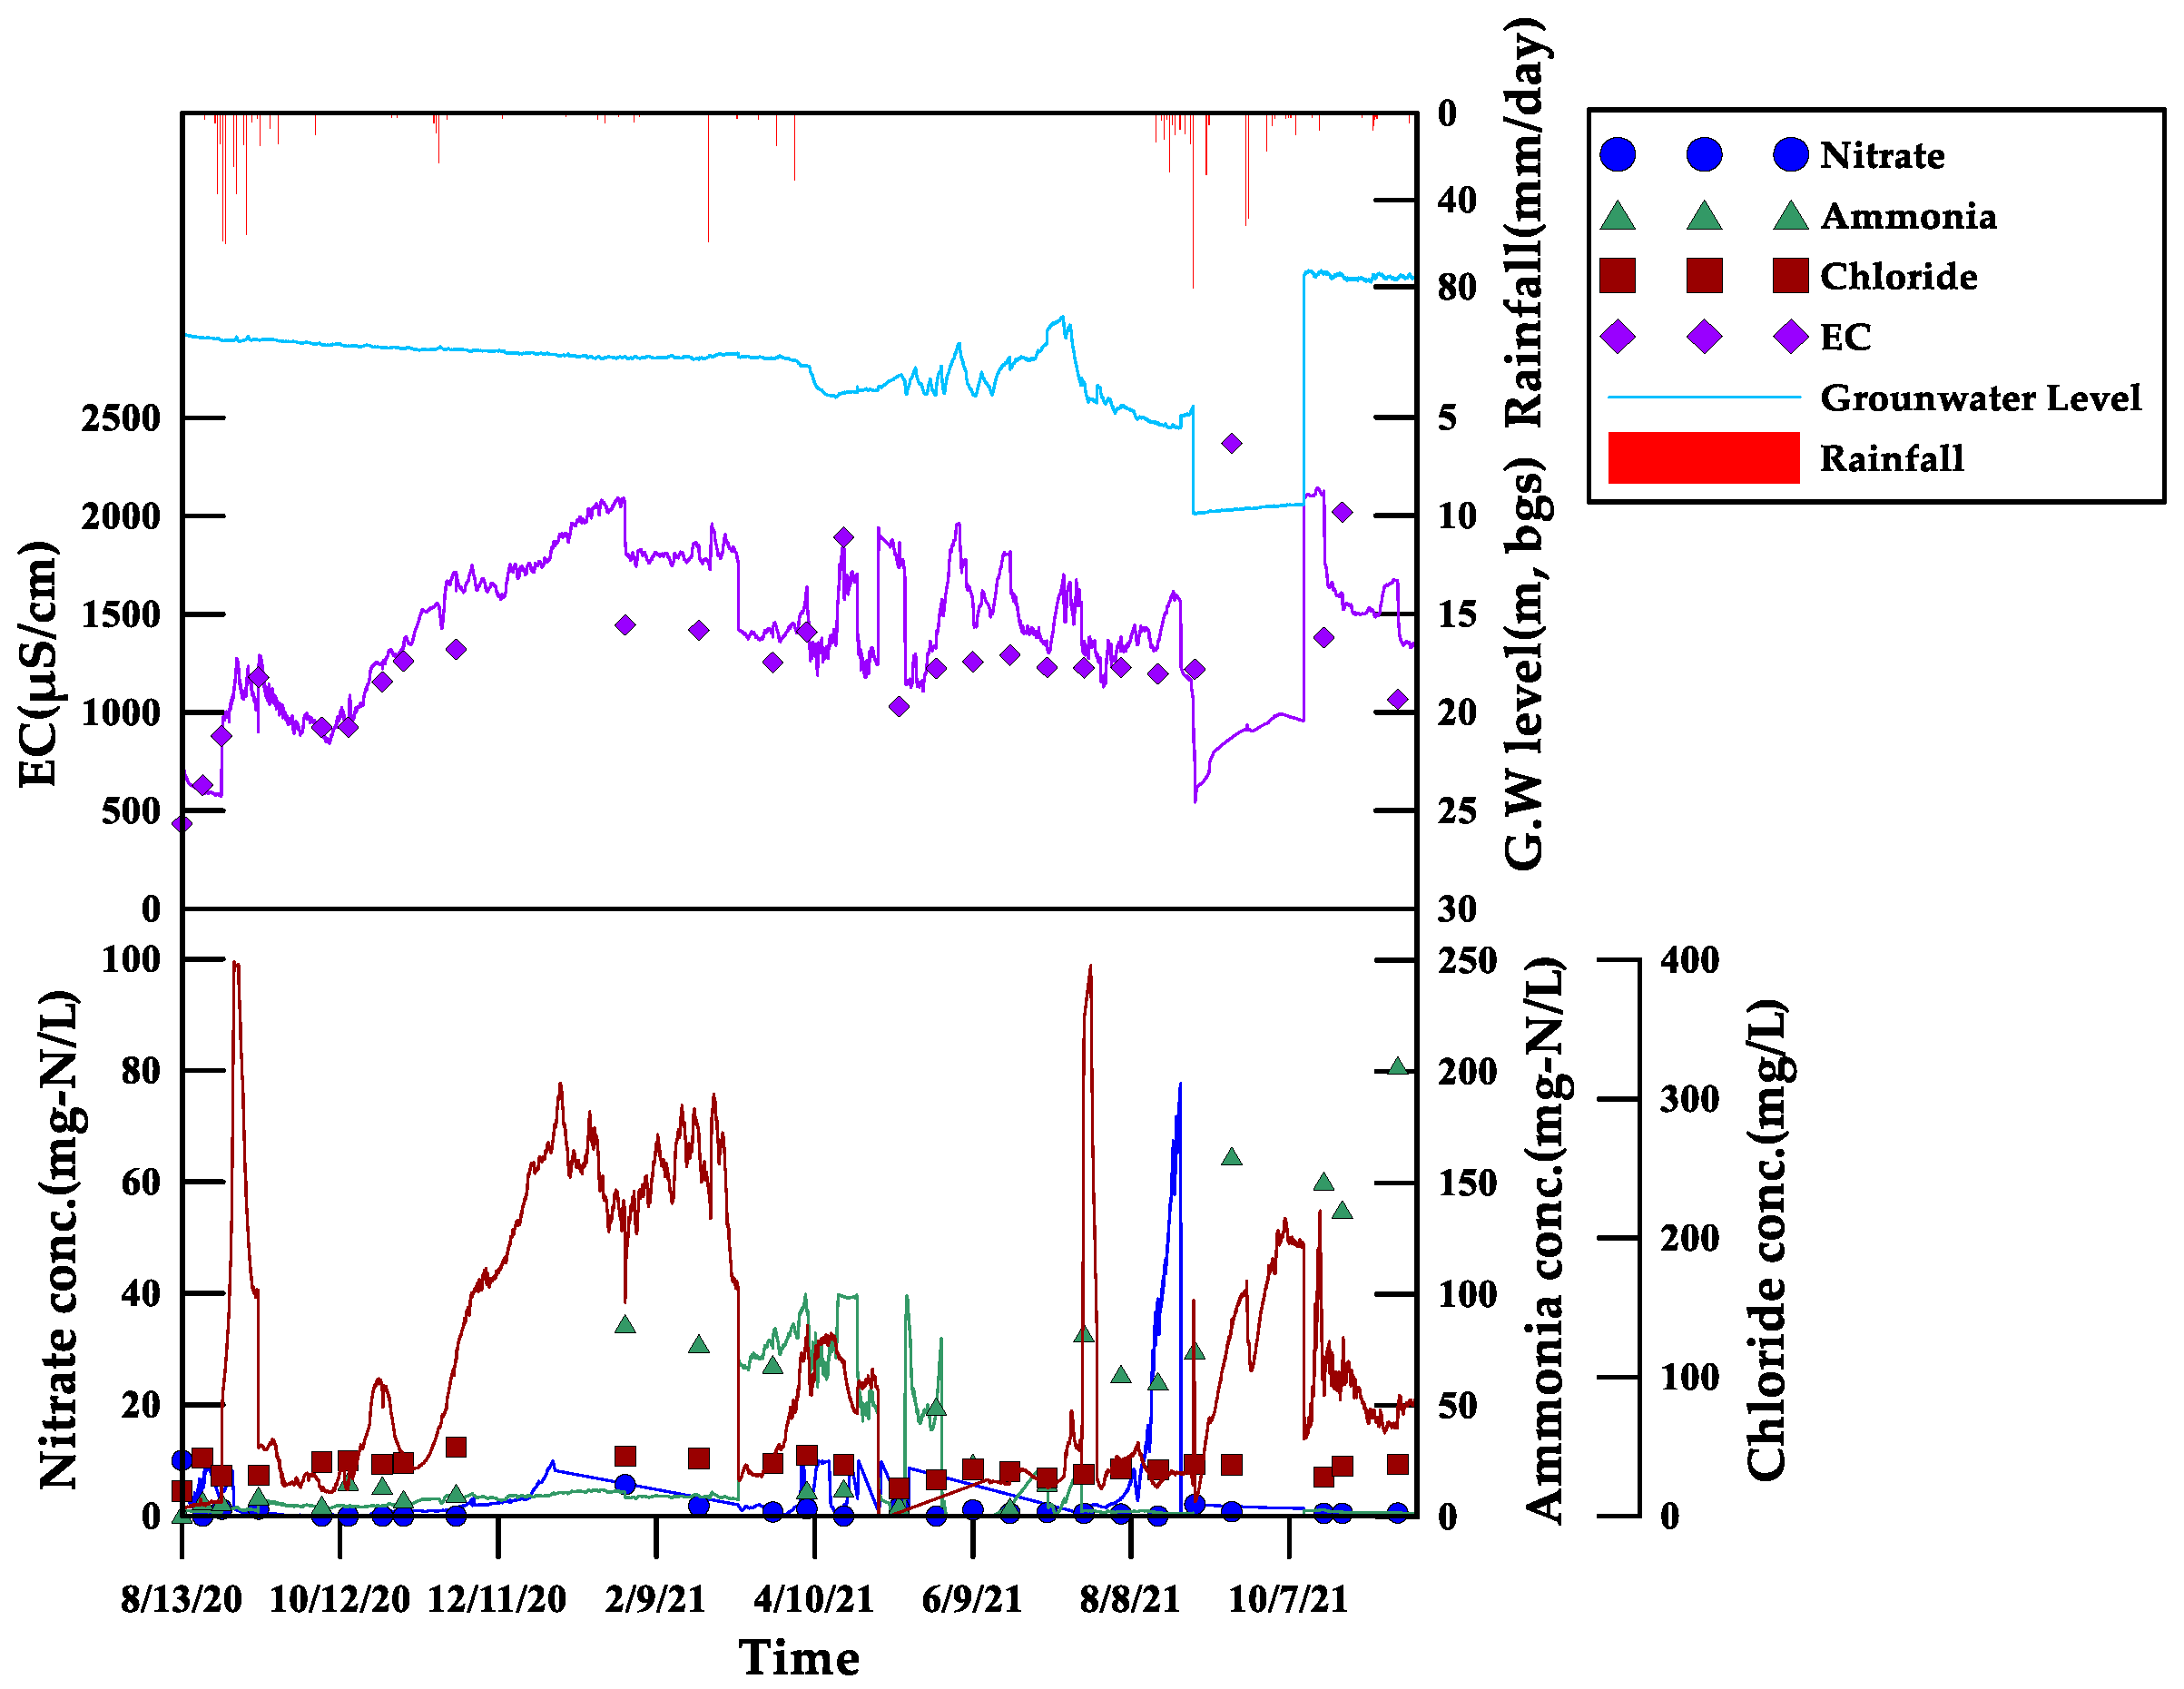
The observation period for Site 1 spanned approximately 27 months, from August 2019 to November 2021. Four parameters (EC, Cl, NO3-N, NH4-N) were monitored using sensors during this period. The monitoring results are presented in Figure 4 below.
During the monitoring period, the laboratory analysis results were as follows [average, minimum~maximum values]: EC: [755.9, 328.8~1090.0 μS/cm]; Cl: [107.4, 17.4~194.6 mg/L]; NO3-N: [3.5, 0.7~26.3 mg/L]; and NH4-N: [0.102, 0.000~0.530 mg/L]. When compared to the laboratory measurement value, the field measurement value by the sensors was 1.1 times higher for EC, 1.5 times higher for Cl, 3.3 times higher for NO3-N, and 8.9 times higher for NH4-N. However, in the case of NH4-N, the measured value was low, so there was a big difference between the sensor-measured value and the laboratory-measured value. The correlation analysis results between the sensor measurements and the laboratory analysis results showed that the EC had the highest correlation coefficient, at 0.3834. The standard deviations for each parameter were as follows: EC: 16.6%; Cl: 60.9%; NO3-N: 178.5%; and NH4-N: 34.0%. It was observed that the EC had the smallest variability among the monitored parameters during the monitoring period. According to the references, the groundwater level increases during rainfall, and EC and Temp. change due to the dilution effect [28]. There were relatively consistent concentration trends during rainfall events.

3.3.2. Monitoring Results for Site 2

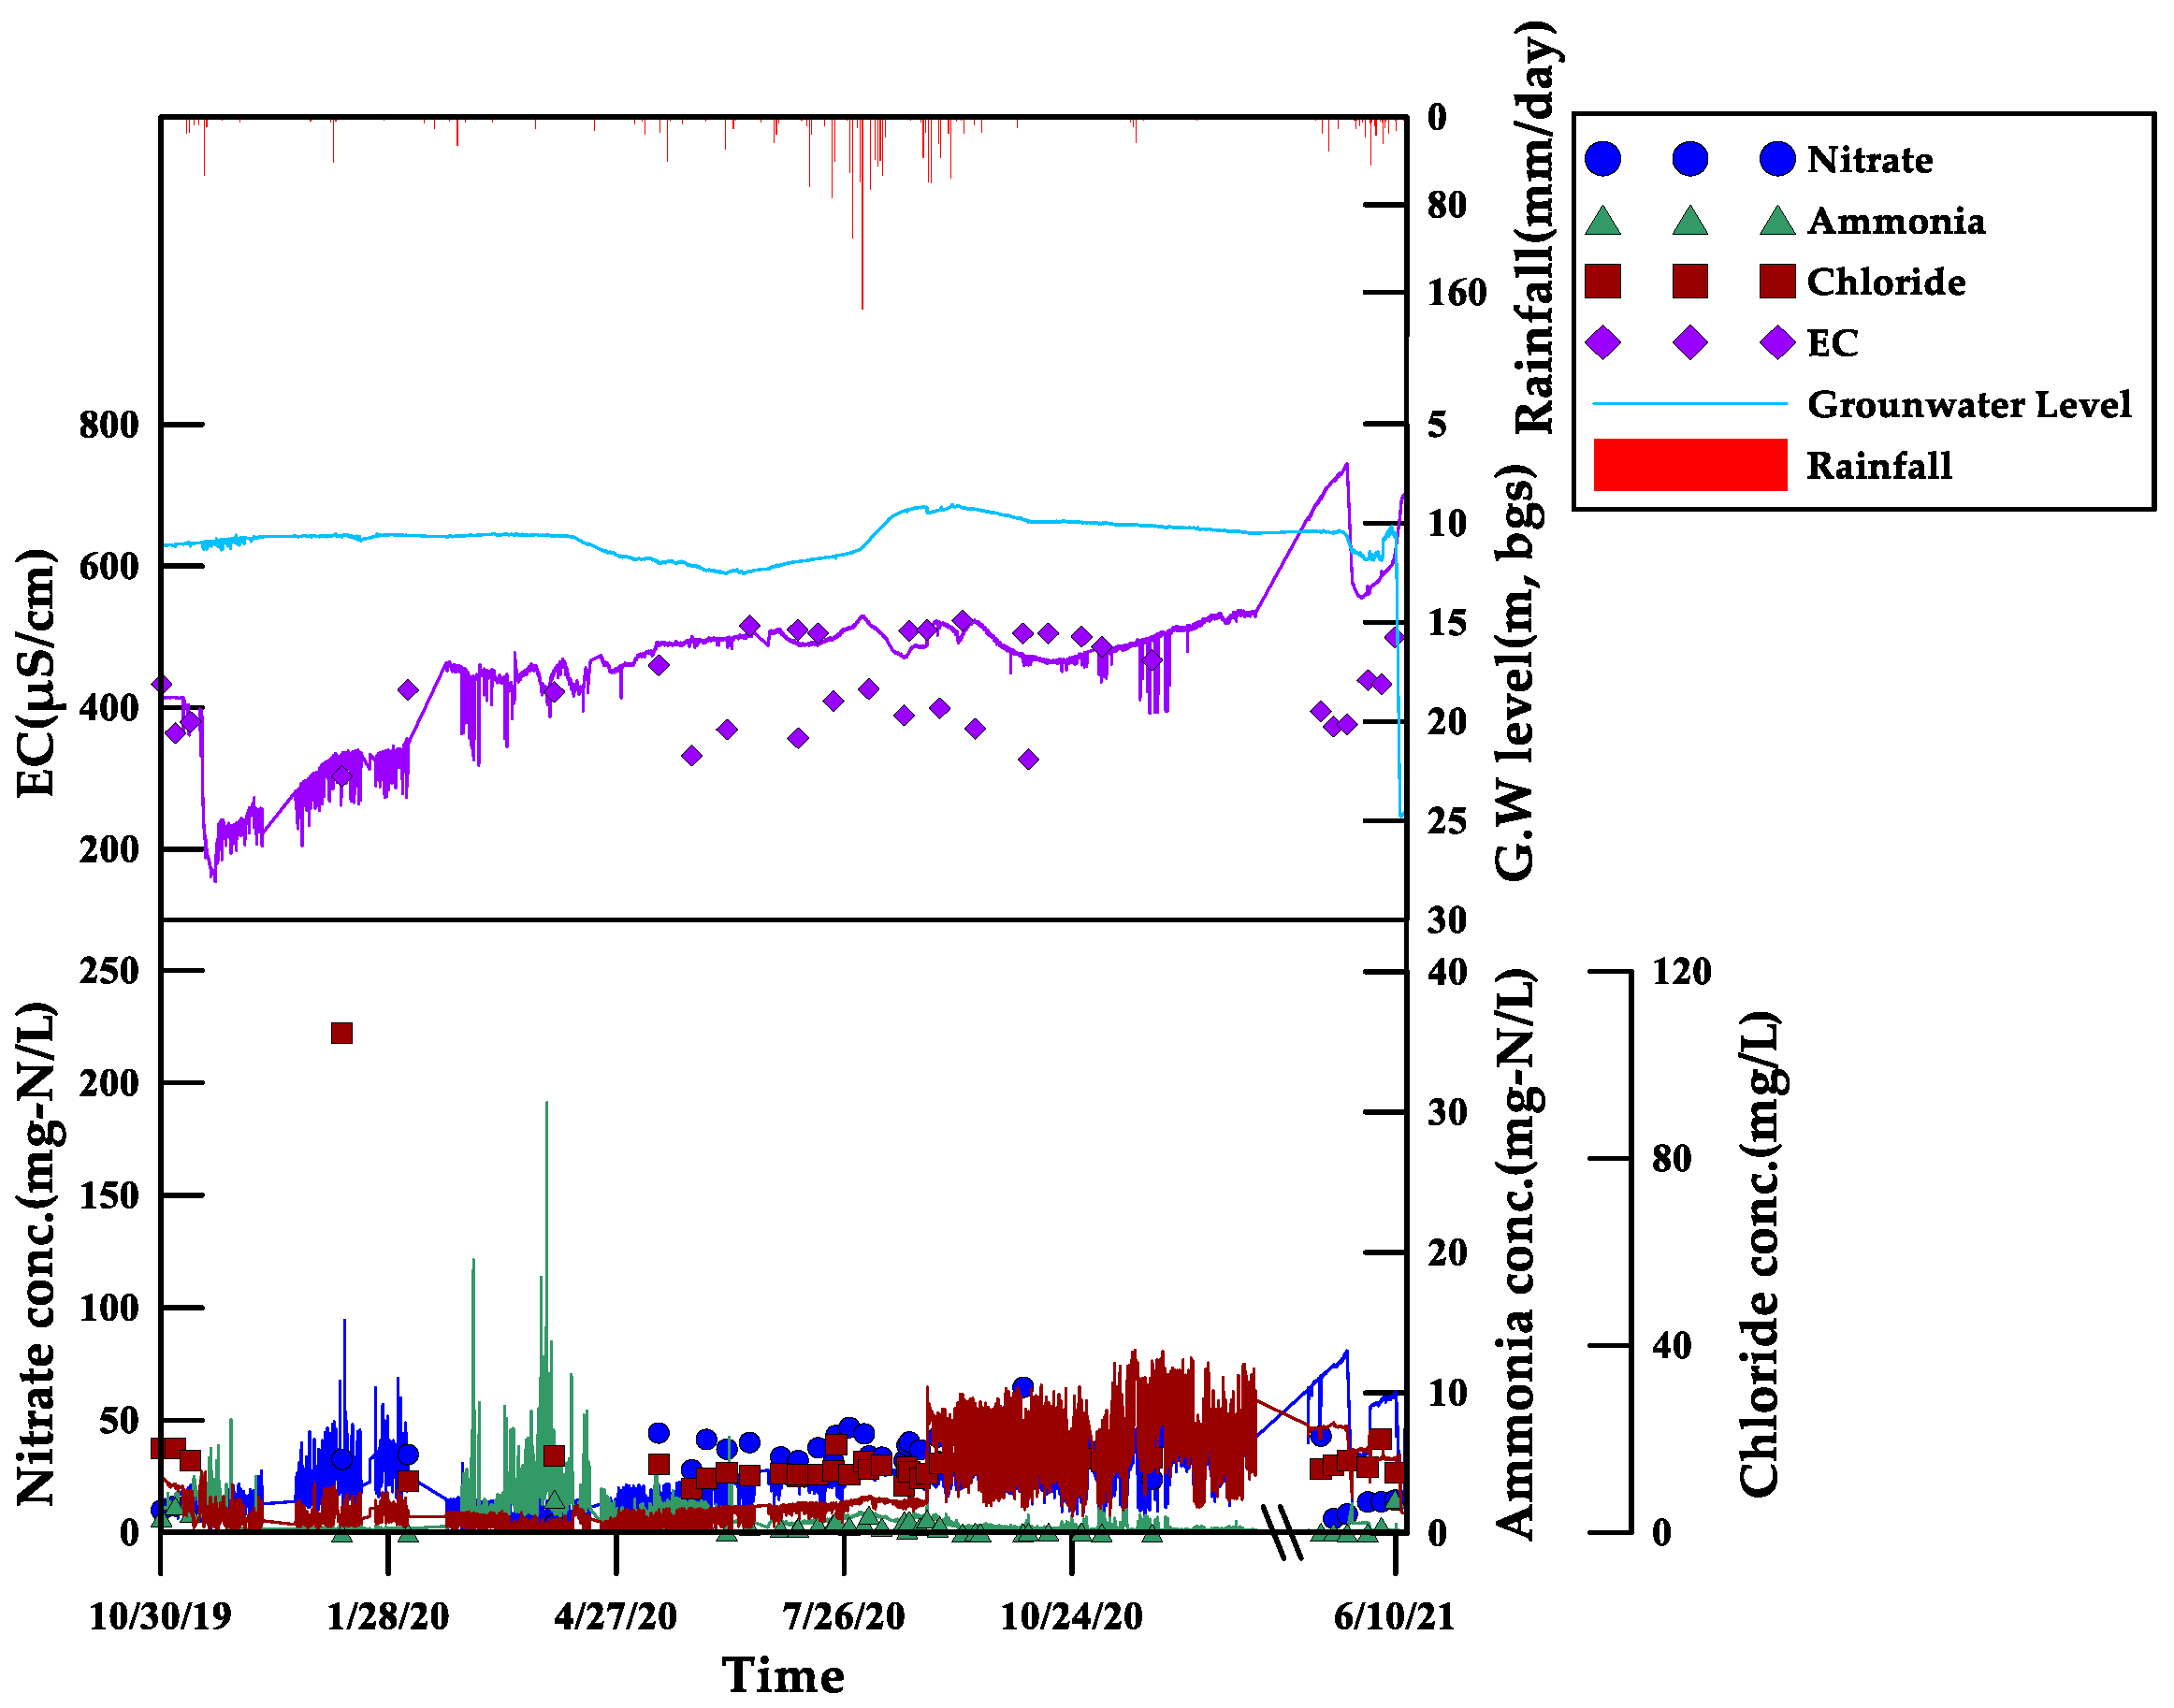
The observation period for Site 2 was approximately 24 months, from October 2019 to November 2021. Four parameters (EC, Cl, NO3-N, and NH4-N) were monitored using sensors. The monitoring results are shown in Figure 5 below.
During the monitoring period, the laboratory analysis results were as follows [average, minimum~maximum values]: EC: [444.9, 303.0~579.0 μS/cm]; Cl: [16.0, 9.4~106.7 mg/L]; NO3-N: [31.6, 3.1~90.9 mg/L]; and NH4-N: [0.482, 0.000~2.400 mg/L]. When compared to the laboratory measurement value, the field measurement value by the sensors was 1.2 times higher for EC, 1.0 times lower for Cl, 2.2 times higher for NO3-N, and 3.6 times higher for NH4-N. The standard deviations for each parameter were as follows: EC: 22.0%; Cl: 79.1%; NO3-N: 77.2%; and NH4-N: 127.5%. Similar to other monitoring areas, the EC exhibited the least variability compared to the mean values measured during the monitoring period.

3.3.3. Monitoring Results for Site 3

The observation period for Site 3 was approximately 15 months, from August 2020 to November 2021. Four parameters (EC, Cl, NO3-N, and NH4-N) were monitored using sensors. The monitoring results are shown in Figure 6 below.
During the monitoring period, the laboratory analysis results were as follows: [average, minimum~maximum values]: EC: [1254.7, 433.0~2370.0 μS/cm]; Cl: [34.7, 18.0~49.6 mg/L]; NO3-N: [1.2, 0.0~10.0 mg/L]; and NH4-N: [50.687, 1.100~202.600 mg/L]. When compared to the laboratory measurement value, the field measurement value by the sensors was 1.1 times higher for EC, 2.3 times higher for Cl, 1.9 times higher for NO3-N, and 0.5 times lower for NH4-N. The correlation analysis results between the sensor measurements and the laboratory analysis results showed that the EC had the highest correlation coefficient of 0.1555. The standard deviations for each parameter were as follows: EC: 25.7%; Cl: 78.3%; NO3-N: 269.3%; and NH4-N: 165.1%. It was observed that the EC had the smallest variation compared to the average values measured during the monitoring period.

3.4. Statistical Correlation Analysis using Analysis Parameters

In this study, considering the results of extensive sensor monitoring conducted over a long period of time at different sites, it was necessary to evaluate the feasibility of field application through a statistical analysis of the parameters. Before factor analysis, a normality test was conducted, and as a result, all four parameters (EC, Cl, NO3-N, NH4-N) did not follow a normal distribution. A principal component analysis (PCA) was performed, and the validation was carried out through the Kaiser–Meyer–Olkin (KMO) measure and Bartlett’s test of sphericity. The triplicate rotation method is varimax with Kaiser normalization. The factor analysis results showed that Site 1 had a KMO measure of 0.355 and a significance probability of 0.000, Site 2 had a KMO measure of 0.734 and a significance probability of 0.000, and Site 3 had a KMO value of 0.362 and a significance probability of 0.000, indicating significant results. In the factor extraction results for Site 2, the EC, Cl, and NO3-N were grouped into one factor (Table 9; Figure 7). However, NH4-N mostly showed non-detection or low concentrations during the sensor monitoring period and did not exhibit significant correlations with other parameters. Electrical conductivity and chloride ions showed significant correlations in terms of Factors 1 and 2, irrespective of the monitoring region, among the four monitoring parameters, indicating their significance as monitoring parameters when monitoring groundwater discharge using sensors.

3.5. Electrical Conductivity Characteristics in Groundwater

Electrical conductivity is considered one of the most important parameters for estimating the total ion concentration in groundwater and representing the total dissolved solids [29]. Additionally, it is known to be a crucial parameter for assessing groundwater contamination and external influences because it closely reflects changes in ion concentrations [30,31,32]. The measurement method for EC relies on direct physical measurements, which results in less susceptibility to external influences such as sample handling and collection compared to other analytical parameters, thus providing reliable measurement values. In the monitoring results of this study, the EC exhibited trends that were most similar to changes resulting from external influences like rainfall and agricultural activities, as well as environmental variations. The measurements obtained by the sensors showed minimal error margins. Therefore, it is anticipated that the utility of the EC will be high in the future development of a real-time monitoring system using sensors, considering its similarity to the characteristics of changes associated with external influences and environmental fluctuations.

4. Conclusions

In this study, we attempted to establish a real-time monitoring system for groundwater around livestock burial sites caused by AI and ASF and prepare an immediate response system. An actual livestock burial site was selected as an experimental area, and sensors were installed. The following conclusions were drawn from the study.
  • Four parameters (EC, Cl, NO3-N, NH4-N) that can be used to assess the possibility of groundwater leachate discharge were selected. A sensor (Aqua Troll 600) was chosen for this study by considering factors such as the simultaneous analysis of the target parameters, the measurement range, the measurement limits, etc. The results of the quality control for sensor measurement reliability showed the following ranges for accuracy and precision: Cl: [accuracy] 99.3~100.0% and [precision] 0.1~4.0%; NO3-N: [accuracy] 93.3~104.1% and [precision] 0.5~5.0%; and NH4-N: [accuracy] 101.3~101.6% and [precision] 1.1~1.6%. These results meet the criteria set by domestic water quality testing standards, which require accuracy to be within 75~125% and precision to be within ±25%. As a result, the reliability of establishing a real-time monitoring system using the sensor was ensured.
  • Three areas with livestock burial sites were selected as pilot areas, and a real-time monitoring system was established. The feasibility of the on-site application was evaluated. When compared to the laboratory measurement value, the field measurement value by the sensors was 1.1 times higher for EC, 1.6 times higher for Cl, and 2.5 times higher for NO3-N. Among the four parameters, the EC showed the closest similarity to the patterns of internal and external environmental changes caused by rainfall and agricultural activities. In addition, the results for EC were more reliable than for other parameters, with a relatively small error rate during the monitoring period.
  • The correlation analysis between the laboratory analysis measurements and the sensor measurement results showed that the EC had the highest correlation coefficient, at 0.3834. In addition, the factor extraction results showed that the EC showed a relatively significant correlation compared to the other three parameters. This confirms that the EC is a key indicator, as supported by previous research, for indicating leachate discharge from livestock burial sites. These results suggest that the data can be used as a valuable foundation for establishing an immediate response system to incidents of leachate discharge as livestock burial sites expand in the future.

Author Contributions

Conceptualization, writing—original draft preparation, and formal analysis, J.Y.; writing—reviewing and editing, S.P.; investigation and writing—reviewing and editing, K.H. All authors have read and agreed to the published version of the manuscript.

Funding

This research was supported by the National Institute of Environmental Research, funded by the Ministry of Environment (NIER-SP2021-179).

Institutional Review Board Statement

Not applicable.

Data Availability Statement

Dataset available upon request from the authors.

Acknowledgments

We thank the anonymous reviewers for their help in overall improving the manuscript. We also thank the journal editorial board for their help and patience throughout the review process.

Conflicts of Interest

The funders had no role in the design of the study; in the collection, analysis, or interpretation of the data; in the writing of the manuscript; or in the decision to publish the results.

References

  1. Kim, H.K.; Park, S.H.; Kim, M.S.; Kim, H.J.; Lee, M.K.; Lee, G.-M.; Kim, S.-H.; Yang, J.-H.; Kim, T.S. Contamination characteristics of agricultural groundwater around Livestock burial areas in Korea. J. Eng. Geol. 2014, 24, 237–246. [Google Scholar] [CrossRef]
  2. Jeong, Y.-C.; An, S.-W.; Min, J.-E.; Park, J.-W. Selection of coagulant and optimum condition for carcasses landfill leachate. In Proceedings of the Korean Society of Geotechnical and Environmental Engineering Conference, Rhodes, Greece, 17–23 June 2012; pp. 91–94. [Google Scholar]
  3. Koh, E.-H.; Kaown, D.; Kim, H.J.; Leea, K.-K.; Kimb, H.; Parkb, S. Nationwide groundwater monitoring around infectious-disease-caused livestock mortality burials in Korea: Superimposed influence of animal leachate on pre-existing anthropogenic pollution. Environ. Int. 2019, 129, 376–388. [Google Scholar]
  4. Anderson, I. Foot and Mouth Disease 2007: A Review and Lessons Learned; Report to the Prime Minister and the Secretary of State for Environment Food and Rural Affairs: London, UK, 2008. Available online: https://www.gov.uk/government/publications/foot-and-mouth-disease-2007-a-review-and-lessons-learned (accessed on 10 June 2024).
  5. National Audit Office. The 2001 Outbreak of Foot and Mouth Disease; 2002. Available online: https://www.nao.org.uk/wp-content/uploads/2002/06/0102939.pdf (accessed on 2 July 2024).
  6. Muroga, N.; Hayama, Y.; Yamamoto, T.; Kurogi, A.; Tsuda, T.; Tsutsui, T. The 2010 foot-and-mouth disease epidemic in Japan. J. Vet. Med. Sci. 2012, 74, 399–404. [Google Scholar] [PubMed]
  7. MAF BioSecurity Authority. Construction Specifications for Carcass Burial Facilities; Ministry of Agriculture and Forestry (MAF): New Zealand, 2005.
  8. Choi, N.-C.; Choi, E.-J.; Kim, B.-J.; Park, J.-A.; Kim, S.-B.; Park, C.-Y. Characterization of Water Quality and Bacteria of Leachate from Animal Carcass Disposal on the Disposal Lapse Time. Econ. Environ. Geol. 2013, 23, 37–46. [Google Scholar]
  9. Chang, H.; Moon, B.; Yoon, S.; Jin, T. Development and performance evaluation of multiple sensor for Groundwater Quality Monitoring and Remote Control System using IoT. J. Korea Inst. Inf. Commun. Eng. 2017, 21, 1957–1963. [Google Scholar]
  10. Parra, L.; Sendra, S.; Lloret, J.; Bosch, I. Development of a conductivity sensor for monitoring groundwater resources to optimize water management in smart city environments. Sensors 2015, 15, 20990–21015. [Google Scholar] [CrossRef] [PubMed]
  11. Venkatesh, J.; Partheeban, P.; Baskaran, A.; Krishnan, D.; Sridhar, M. Wireless sensor network technology and geospatial technology for groundwater quality monitoring. J. Ind. Inf. Integr. 2024, 38, 100569. [Google Scholar]
  12. Burbery, L.; Abraham, P.; Wood, D.; de Lima, S. Applications of a UV optical nitrate sensor in a surface water/groundwater quality field study. Environ. Monit. Assess. 2021, 193, 303. [Google Scholar] [PubMed]
  13. Lim, W.-s.; Hyun, M.-h.; Gyubeom, K. New development and application of a remote controlled groundwater monitoring equipment. J. Geol. 2014, 50, 689–696. [Google Scholar]
  14. Calderwood, A.J.; Pauloo, R.A.; Yoder, A.M.; Fogg, G.E. Low-cost, open source wireless sensor network for real-time, scalable groundwater monitoring. Water 2020, 12, 1066. [Google Scholar] [CrossRef]
  15. Kim, G.-J.; Se-Hoon, J.; Shim, C.-b. Implementation of user interface and geoSensor based traveling Type Sub-observation prototype system for monitoring of groundwater. J. Korea Comput. Inf. Soc. 2012, 17, 183–192. [Google Scholar]
  16. Chi-hyeong, L.; Kim, G.-S.; Choi, J.; Lee, H.; Park, R.; Yong-soon, P. Development of a remote integrated management system for groundwater near livestock burial sites. J. Korean Soc. Geotech. Eng. 2014, 2014, 213–214. [Google Scholar]
  17. Kim, H.K.; Kim, K.H.; Yun, S.T.; Oh, J.; Kim, H.R.; Park, S.H.; Kim, M.S.; Kim, T.S. Probabilistic assessment of potential leachate leakage from livestock mortality burial pits: A supervised classification approach using a Gaussian mixture model (GMM) fitted to a groundwater quality monitoring dataset. Process Saf. Environ. Prot. 2019, 129, 326–338. [Google Scholar] [CrossRef]
  18. Shi, Y.; Zhang, L.; Wei, G.H. The design and application of the groundwater monitoring system based on the internet of things in the HeiHe river basin. Appl. Mech. Mater. 2014, 511, 319–325. [Google Scholar] [CrossRef]
  19. Lee, I.-j. Development of a Real-Time Monitoring System to Prevent Pre-Contamination in Areas Concerned about Groundwater Contamination; GAIA Project technical data book; Korea Environmental Industry and Technology Institute: Seoul, Republic of Korea, 2011.
  20. USGS. National Field Manual for the Collection of Water-Quality Data, 6.0 Guidelines for Field-Measured Water-Quality Properties. 2010. Available online: https://pubs.usgs.gov/publication/tm9A6.0 (accessed on 2 July 2024).
  21. APHA. Standard Methods for the Examination of Water and Wastewater, 20th ed.; American Public Health Association: Washington, DC, USA, 1998. [Google Scholar]
  22. Kaiser, H.F. An index of factorial simplicity. Psychometrika 1974, 39, 31–36. [Google Scholar] [CrossRef]
  23. Lee, H.-S. SPSS 18.0 Manual; Jhjbook Publishing: Seoul, Republic of Korea, 2011; pp. 362–389. [Google Scholar]
  24. Bjerg, P.L.; Ruegge, K.; Pedersen, J.K.; Christensen, T.H. Distribution of redox-sensitive groundwater quality parameters downgradient of a landfill (Grindsted, Denmark). Environ. Sci. Technol. 1995, 29, 1387–1394. [Google Scholar] [CrossRef] [PubMed]
  25. Jung, G.J.; Lee, J.Y. A study on the characteristics of landfill gas and leachate in Nanjido after constructed final cover system. J. Korea Soc. Waste Manag. 2007, 24, 744–751. [Google Scholar]
  26. Huh, I.-R.; Kim, K.-W.; Choi, G.-J.; Lee, T.-S. Monitoring water quality of groundwater observation wells near foot-and-mouth disease livestock burial sites. J. Korean Soc. Environ. Health 2014, 40, 47–54. [Google Scholar] [CrossRef]
  27. Kaown, D.; Hyun, Y.; Bae, G.O.; Lee, K.K. Factors affecting the spatial pattern of nitrate contamination in shallow groundwater. J. Environ. Qual. 2007, 36, 1479–1487. [Google Scholar] [CrossRef]
  28. Son, J.K.; Kwon, T.K.; Kong, M.J.; Kang, T.G.; Lim, R.G.; Kim, N.C.; Park, M.J. Measurement of groundwater penetration and Water Balance Analysis according to Land Use Materials. J. Korea Acad. -Ind. Coop. Soc. 2021, 22, 613–622. [Google Scholar]
  29. Azhdarpoora, A.; Radfarda, M.; Pakdelb, M.; Abbasniac, A.; Badeenezhadd, A.; Mohammadie, A.A.; Yousefi, M. Assessing fluoride and nitrate contaminants in drinking water resources and their health risk assessment in a semiarid region of southwest Iran. Desalination Water Treat. 2019, 149, 43–51. [Google Scholar] [CrossRef]
  30. Panneerselvam, B.; Muniraj, K.; Duraisamy, K.; Pande, C.; Karuppannan, S.; Thomas, M. An integrated approach to explore the suitability of nitrate-contaminated groundwater for drinking purposes in a semiarid region of India. Environ. Geochem. Health 2023, 45, 647–663. [Google Scholar] [CrossRef] [PubMed]
  31. Cellone, F.; Carol, E.; Pugliese, I.; Cordoba, J.; Butler, L.; Lamarche, L. Nitrate pollution in dairy farms and its impact on groundwater quality in a sector of the Pampas plain, Argentina. Environ. Earth Sci. 2020, 79, 1–7. [Google Scholar] [CrossRef]
  32. Zghibi, A.; Tarhouni, J.; Zouhri, L. Assessment of seawater intrusion and nitrate contamination on the groundwater quality in the Korba coastal plain of Cap-Bon (North-east of Tunisia). J. Afr. Earth Sci. 2013, 87, 1–12. [Google Scholar]
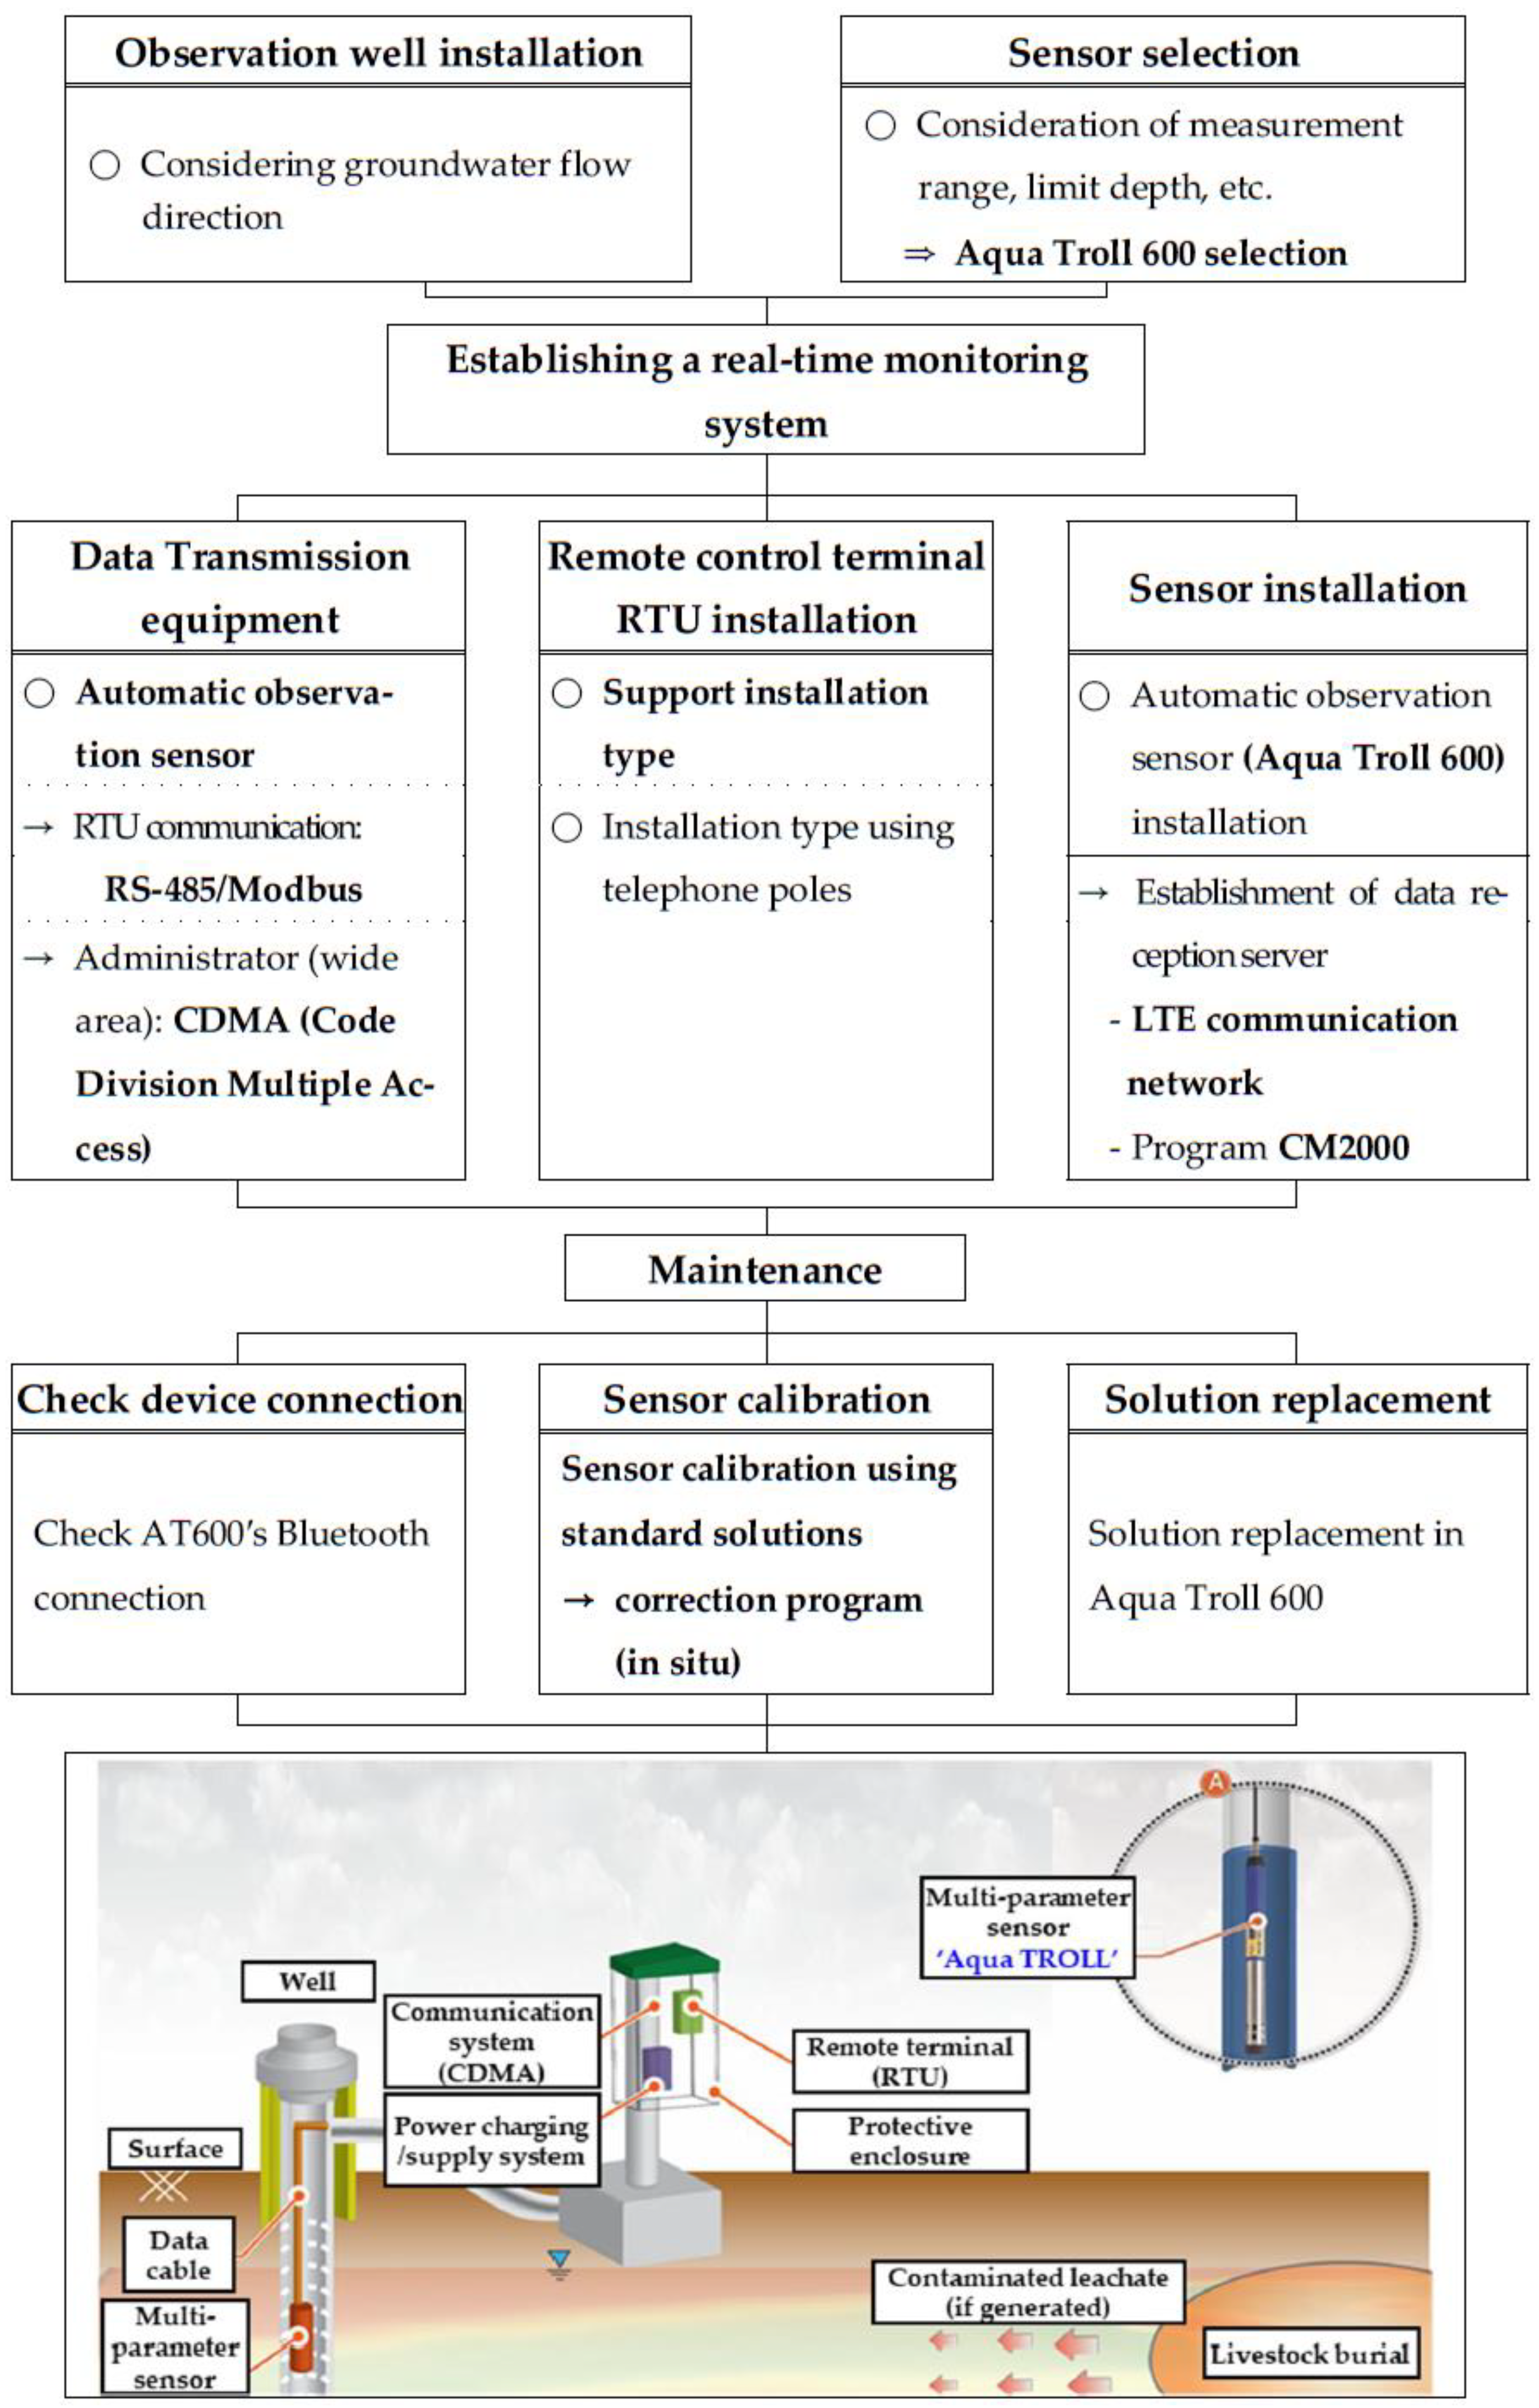
Figure 1. Real-time monitoring system mimetic diagram.
Agriculture 14 01278 g001
Figure 2. Study area (3) characteristics.
Agriculture 14 01278 g002aAgriculture 14 01278 g002b
Figure 3. An example of an anion electrode calibration curve (chloride, nitrate nitrogen, ammonium nitrogen).
Agriculture 14 01278 g003
Figure 4. Site 1 monitoring by sensors.
Agriculture 14 01278 g004
Figure 5. Site 2 monitoring by sensors.
Agriculture 14 01278 g005
Figure 6. Site 3 monitoring by sensors.
Agriculture 14 01278 g006
Figure 7. Rotated component matrix of the three principal components (PCs) extracted using a principal component analysis (PCA).
Agriculture 14 01278 g007
Table 1. Monitored sites (3).
DivisionTime of BurialLivestock Burial (ea)Well Depth
(m)
Average Water Level (m)Observation PeriodRainfall
(mm/month)
Site 12016Laying hen 292,95020.010.5Observation Period of Site-1:
August 2019–November 2021
(27 month)
107.1
Site 22016Laying hen 54,02920.010.3Observation Period of Site-2:
October 2019–November 2021
(26 month)
94.6
Site 32014Laying hen 109,50215.01.2Observation Period of Site-3:
August 2019–November 2021
(27 month)
61.8
Table 2. Monitoring sensor type.
DivisionAqua TROLL 600EXO1DS 5
Sensor sourceManufacturerIn situYSIHYDROLAB
StandardDiameter: 47 mm
Length: 59.16 cm
Diameter: 4 mm
Length: 64.77 cm
Diameter 44 mm
Length 74.9 cm
Weight1.45 kg1.42 kg1.3 kg
Temp Range−5~50 °C−5~45 °C−5~50 °C
Maximum installation depth0.21 MPa (NH4-N, NO3-N)
Communication methodRS485/MODBUS, SDI-12, BluetoothRS232/SDI-12/BluetoothRS-232, SDI-12, RS-485
Simultaneous measurable itemTemp., pressure, water level, pH, ORP, EC, turbidity,
TDS, salinity, NH4-N, NO3-N, Cl
Measurement limit depth25 M15 M15 M
External materialPVC·TitaniumPVC PVC
Application range for each sensor measurement itemEC- Range:
0~350 μS/cm
- Error: ± 0.5%
(of reading + 0.001 μS/cm)
- Range:
0~200 μS/cm
- Error: ± 0.5%
(of reading + 0.001 μS/cm)
- Range:
0~100 μS/cm
- Error: ± 0.5%
(of reading + 0.001 μS/cm)
Cl- Range:
0~150,000 mg/L
- Error: ±10%
(of reading or 2 mg/L)
- Range:
0.5~18,000 mg/L
- Error: ±15%
(of reading or 5 mg/L)
- Range:
0.5~18,000 mg/L
- Error: ±5%
(of reading or 2 mg/L)
NO3-N- Range:
0~40,000 mg-N/L
- Error: ±10%
(of reading or 2 mg/L)
- Range:
0~200 mg-N/L
- Error: ±10%
(of reading or 2 mg/L)
- Range:
0~100 mg/L
- Error: ±5%
(of reading or 2 mg/L)
NH4-N- Range:
0~10,000 mg/L
- Error: ±10%
(of reading or 2 mg/L)
- Range:
10~200 mg/L
- Error: ±10%
(of reading or 2 mg/L)
- Range:
0~100 mg/L
- Error: ±5%
(of reading or 2 mg/L)
Referencehttps://in-situ.com/en/aqua-troll-600-multiparameter-sonde
(2 November 2020)
https://www.ysi.com/exo1
(2 November 2020)
https://www.ott.com/en-uk/products/water-quality-106/hydrolab-ds5-multioarameter-data-sonde-2348/
(2 November 2020)
Table 3. Stabilization criteria for recording field measurements.
Standard Direct Field MeasurementStabilization Criteria for Measurements
(Variability Should Be within the Value Shown)
TemperatureThermistor thermometer±0.2 °C
Conductivitywhen ≤100 μS/cm±5%
when >100 μS/cm±3%
pHMeter displays to 0.01±0.1 unit
Dissolved oxygenAmperometric method±0.3 mg/L
Table 4. Changes in NO3-N and EC according to the amount of NO3-N standard material injected.
Concentration
(mg/L)
Sensor Measurement Parameters1st2nd3rdAverageDeviationAccuracy
(%)
Precision
(%)
0
(D·I water)
NO3-N (mg/L)0---
EC (μS/cm)0.01---
1NO3-N (mg/L)1.01.11.01.00.1104.15.0
EC (μS/cm)0.0120.0130.0130.013---
50NO3-N (mg/L)47.046.646.446.60.393.30.5
EC (μS/cm)0.4600.4600.4600.460---
100NO3-N (mg/L)100.399.099.599.50.799.20.7
EC (μS/cm)0.9030.9030.9030.903---
Table 5. Changes in NH4-N and EC according to the amount of NH4-N standard material injected.
Concentration
(mg/L)
Sensor Measurement Parameters1st2nd3rdAverageDeviationAccuracy
(%)
Precision
(%)
0
(D·I water)
NH4-N (mg/L)0---
EC (μS/cm)0.01---
1NH4-N (mg/L)0.981.001.000.990.0101.31.2
EC (μS/cm)0.0130.0130.0130.013---
50NH4-N(mg/L)49.950.751.550.70.8101.61.6
EC (μS/cm)0.4840.4840.4840.484---
100NH4-N (mg/L)100.0101.3102.2101.61.1101.61.1
EC (μS/cm)0.9420.9420.9420.942---
Table 6. Changes in Cl and EC according to the amount of Cl standard material injected.
Concentration
(mg/L)
Sensor Measurement Parameters1st2nd3rdAverageDeviationAccuracy
(%)
Precision
(%)
0
(D·I water)
Cl (mg/L)0---
EC (μS/cm)0.01---
5Cl (mg/L)55550.2100.04.0
EC (μS/cm)0.0190.0190.0190.019---
150Cl (mg/L)1581571561571.199.30.7
EC (μS/cm)0.4990.4990.4990.499---
250Cl (mg/L)2462442432441.399.40.5
EC (μS/cm)0.7340.7340.7340.734---
500Cl (mg/L)5004994994990.799.90.1
EC (μS/cm)1.4511.4511.4511.451---
Table 7. EC change test results using two or more standard materials.
Concentration
(mg/L)
EC (μS/cm)Average
(μS/cm)
1st2nd3rd
D·I water0.01-
NO3-N
NH4-N
2 mg/L
2 mg/L
0.0460.0460.0460.046
NO3-N
Cl
2 mg/L
10 mg/L
0.0540.0540.0540.054
NH4-N
Cl
2 mg/L
10 mg/L
0.0540.0540.0540.054
NO3-N
NH4-N
Cl
2 mg/L
2 mg/L
10 mg/L
0.0710.0710.0710.071
Table 8. EC, NO3-N, NH4-N, and Cl measurement results through the sensor.
ParameterPeriodSensor Monitoring Result (Average, Min~Max)
Site 1Site 2Site 3
EC
(μS/cm)
2019693.6 (112.0~1048.0)290.4 (154.0~415.0)-
2020715.3 (114.0~901.0)470.0 (255.0~538.0)1243.8 (573.0~1841.0)
2021875.7 (543.0~1030.0)628.8 (526.0~745.0)1497.2 (543.0~2142.0)
Total775.5 (112.0~1048.0)515.8 (154.0~745.0)1420.7 (543.0~2142.0)
NO3-N
(mg/L)
201931.0 (3.8~279.7)13.8 (0.3~44.8)-
202011.0 (4.0~31.5)21.8 (0.1~94.5)1.7 (0.1~9.9)
20213.2 (1.0~5.6)39.5 (3.5~89.8)4.9 (0.1~77.6)
Total10.6 (1.0~279.7)27.6 (0.1~94.5)3.5 (0.1~77.6)
NH4-N
(mg/L)
20190.262 (0.200~0.510)1.224 (0.150~8.070)-
20200.378 (0.100~1.460)1.057 (0.160~30.670)6.040 (2.060~10.470)
20210.419 (0.220~1.180)0.475 (0.000~2.110)16.735 (0.000~99.940)
Total0.386 (0.100~1.460)0.854 (0.000~30.670)13.451 (0.000~99.940)
Cl
(mg/L)
2019101.3 (0.2~243.7)4.8 (0.4~15.8)-
2020111.9 (0.2~276.5)9.6 (0.1~39.0)96.4 (6.0~398.6)
2021205.8 (10.4~421.6)19.7 (2.9~51.3)120.1 (0.0~396.1)
Total147.2 (0.2~421.6)13.0 (0.1~51.3)112.3 (0.0~398.6)
Table 9. Rotated component matrix of the three PCs (principal components) extracted using a PCA (principal component analysis).
VariableSite 1Site 2Site 3
Factor 1Factor 2Factor 1Factor 2Factor 1Factor 2
Cl0.945−0.2010.7810.2100.851−0.282
EC0.8840.3410.8390.1420.6950.551
NH4-N−0.1040.845−0.112−0.9400.0700.601
NO3-N−0.151−0.6790.5240.632−0.2080.618
Eigenvalue1.7091.3331.6011.3471.2551.127
Variance explained (%)42.73633.31640.02333.67131.37128.173
Disclaimer/Publisher’s Note: The statements, opinions and data contained in all publications are solely those of the individual author(s) and contributor(s) and not of MDPI and/or the editor(s). MDPI and/or the editor(s) disclaim responsibility for any injury to people or property resulting from any ideas, methods, instructions or products referred to in the content.