Article

Improved Paddy Rice Classification Utilizing Sentinel-1/2 Imagery in Anhui China: Phenological Features, Algorithms, Validation and Analysis

1
Science Island Branch, University of Science and Technology of China, Hefei 230026, China
2
Anhui Institute of Optics and Fine Mechanics, Hefei Institutes of Physical Science, Chinese Academy of Sciences, Hefei 230031, China
3
Computer and Artificial Intelligence Department, Hefei Normal University, Hefei 230601, China
4
Chief Studio of Agricultural Industry in Hefei, Hefei 230031, China
5
Institute of Geographic Science and Natural Resources Research, Chinese Academy of Sciences, Suzhou 215100, China
*
Author to whom correspondence should be addressed.
Agriculture 2024, 14(8), 1282; https://doi.org/10.3390/agriculture14081282
Submission received: 1 July 2024 / Revised: 23 July 2024 / Accepted: 1 August 2024 / Published: 3 August 2024
(This article belongs to the Section Digital Agriculture)

Abstract

:
Enhancing the accuracy of paddy rice mapping is crucial for bolstering global food security. Prior research incorporating Sentinel imagery with phenological characteristics has identified paddy rice fields effectively. However, challenges such as reliance on a single index, cloud cover interference, and a lack of sufficient training samples continue to complicate the mapping of paddy rice. This study introduces a comprehensive paddy rice mapping framework that incorporates annual phenological features throughout the entire growth phase. This was achieved by expanding the sample size through the extraction of phenological features, and the visually verified samples were then integrated with distinct phenological phases and relevant indices, utilizing hybrid Sentinel-1/2 imagery to map paddy rice distribution. The accuracy of the generated rice map was validated against trusted samples, corroborative agricultural statistics, and another high-resolution 10 m mapping product. Compared with ground-truth samples, the algorithm has achieved an overall accuracy of approximately 92% in most rice production regions with a confusion matrix. Additionally, the estimated rice area in Anhui and several other rice-producing regions shows less than 10% error when compared with governmental statistical records from the yearbook. When compared with another recent paddy rice map at the same spatial resolution (10 m), our approach provided cleaner details and more effectively reduced omission errors. It received values of R 2 = 0.991 and slope = 1.08 in a prefecture-level statistical comparison with a counterpart. Our proposed approach is proven to be valid and is expected to offer significant benefits to agricultural sustainability and technological applications in farming.

Graphical Abstract

1. Introduction

Paddy rice is a staple crop globally, feeding more than 50% of the world’s population [1,2]. Recognized as one of the most crucial crops in the world, paddy rice production is intricately linked to the food supply of human societies [3,4] and environmental sustainability [5]. Therefore, the accurate mapping of paddy rice cultivation is essential for ensuring food security, promoting sustainable agricultural practices, enhancing crop yield strategies, and facilitating technological innovations in farming that enhance efficient resource management.
Compared with the traditional approaches of acquiring essential data on paddy rice cultivation, which entail labor-intensive and time-consuming sampling survey procedures, remote sensing technologies have contributed great convenience and practicality in paddy rice mapping. The time-series remote sensing data could reveal the growth pattern of paddy rice and then help to accurately extract the planting distribution as well as predict pertinent yields. Currently, scholars have utilized the phenological attributes of paddy rice to extract the planting information. Since 2005, Xiao et al. [6] first proposed the phenological method to identify the flooding signal in the transplanting stage by using the excess of the Land Surface Water Index (LSWI) to Normalized Difference Vegetation Index (NDVI). Later, this key phenological feature was widely adopted and boosted by other scholars. For instance, Wei et al. [7] used these LSWI-based phenological features to identify the paddy rice distribution in China from 2014 to 2019. Han et al. [8] utilized the flooding signal to extract the paddy rice planting area in Northeast and Southeast Asia from 2017 to 2019. Aside from the only use of the transplanting stage, a study by Qiu et al. [9] proposed a novel index by combining the contrast trend between LSWI and NDVI to capture the rice pixel more accurately. However, previous research heavily relied on the features revealed in the flooding or the transplanting phases. Once the data were contaminated by the cloud or instrumental issues, the mapping result would be heavily impacted. Although the dense time-series RS data such as MODIS could mitigate the mentioned concerns, the coarse spatial resolution does not perfectly match all the intended purposes on a scale. Other high spatial resolution images, such as those from Sentinel-2, have a coarser temporal resolution, but this makes it difficult to offer sufficient observations in such a short phase. Thus, the question of how to better utilize the full growth cycle of paddy rice and mitigating the dependence on single phenological stages remains a factor to be taken into consideration.
Synthetic Aperture Radar (SAR) technology is also valid in paddy rice mapping, since it can offer consistent images regardless of inclement weather conditions. Many scholars have demonstrated its efficiency in paddy rice mapping [10,11,12]. For instance, Singha et al. [13] utilized the available Sentinel-1 SAR images to detect the flood and flood-affected paddy rice fields, since the variation in Vertical–Vertical (VV) and Vertical–Horizontal (VH) polarization data in the growing phase is correlated to the paddy rice canopies’ expansion. Also, Yang et al. [12] revealed that the VH polarization data demonstrated a sharp increase after the transplanting phase of the paddy rice, thus helping to identify rice pixels. However, methods that only relied on Sentinel-1 data may reveal less than the expected accuracy in paddy rice extraction, since the backscatter of Sentinel-1 is less sensitive to irrigated agriculture than multi-band optical sensors [14].
As artificial intelligence (AI) has advanced, machine learning (ML)-based rice extraction approaches have been widely employed. The ML-based approaches were first fed into pre-processed samples. The designed models were then trained with the features acquired from the samples and finally generated rice mapping results. Several different machine learning models are involved, such as Random Forest (RF) [15], Support Vector Machine (SVM) [16], and Neural Network (NN) [17]. For instance, Ni et al. [18] has collected more than 20,000 ground samples in north east China for the rice mapping algorithm. Zhang et al. [19] has utilized 6359 rice and non-rice samples to generate the rice distribution in the Banan district, China. From these studies, it is evident that accurate results require a large amount of training data, but the training samples are not always guaranteed in different contexts. Previous scholars have tried to expand samples by utilizing phenology. For instance, Zhang et al. [20] attempted to generate samples based on the general phenology calendar, but the phenology may differ due to climatic and topographical features. Thus, generating reliable samples that follow local inter-annual phenological characteristics and exhibit an even distribution across regions is an urgent issue that requires resolution.
Given the issues mentioned above, this study developed a phenological features-based paddy rice mapping algorithm, named PFBPM, to fully utilized the whole growth phase of paddy. The annual phenology is detected with the help of collected ground samples, verified crop calendars, and representative vegetation indices. Then, an automated sample expansion algorithm generates samples in a gridded study area and subsequently undergoes visual purification. Later, the stratified collected samples were processed through image collections based on phenological features to generate the final rice map.The objectives of this study were threefold: (1) to detect phenological stages and correlated feature indices from the ground-truth samples collected in advance; (2) to use phenological details to build the essential paddy rice map, which served as the reference for expanding sample rice pixels for our training in classification; (3) to acquire a satisfactory paddy rice distribution at a regional scale in Anhui Province, which could then serve as a reference for rice distribution research in China.
The remainder of the paper is organized as follows: Section 2 introduces the study area and datasets. Section 3 describes the methodology of this study. Section 4 presents the classification and comparison results. Section 5 discusses the achievements, limitations, and future work. Section 6 concludes the paper.

2. Materials

2.1. Study Area

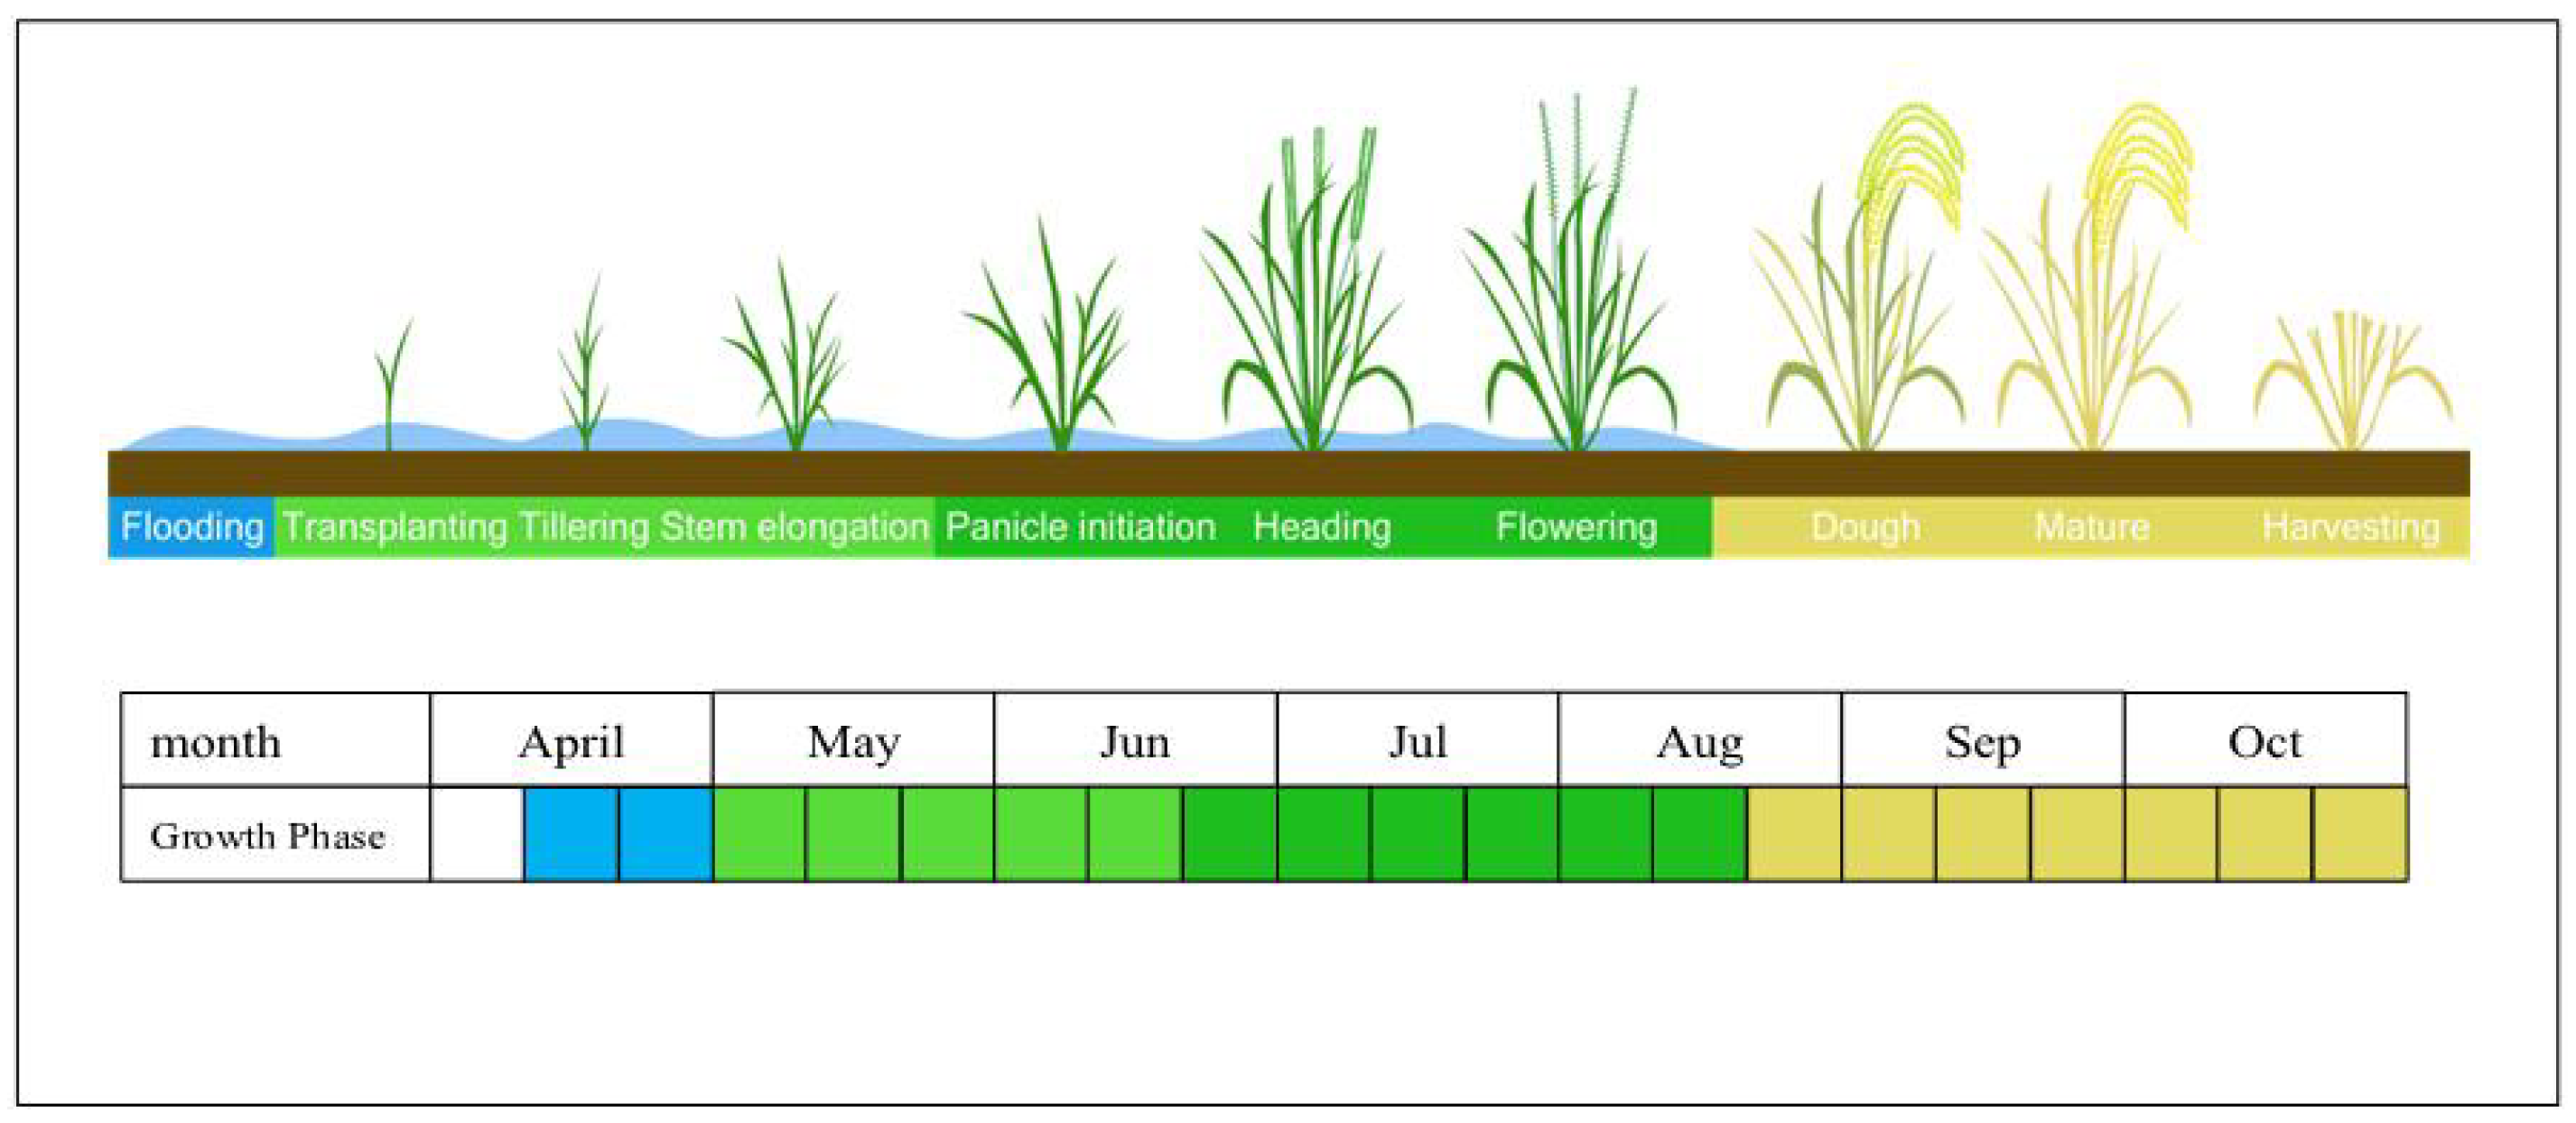
Anhui Province is located in eastern China, spanning latitudes 29°41′–34°38′ N and longitudes 114°54′–119°37′ E. The landscape varies, featuring plains in the northern parts and hilly, mountainous areas in the south. The climate is predominantly humid subtropical, with four distinct seasons. Average annual temperatures range from 14 °C to 16 °C, and precipitation varies between 800 mm and 1800 mm. According to data from the national bureau of statistics, Anhui is a major agricultural province, spanning about 8.8 × 10 5 km2 and accounting for approximately 5% of the country’s total crop area. Paddy rice is predominantly cultivated in the flat plain areas of Anhui Province. These areas provide optimal conditions for rice growth due to abundant water resources and suitable topographical features, including tributaries of the Yangtze River and generally flat plains. The rice-cultivating season in Anhui typically starts in late April or early May. Afterward, the transplanting period begins. Over the next three months, the rice undergoes the stages of heading and flowering, which result in the largest canopies. Finally, the rice crops are harvested from September to late October. The map of the study area is shown in Figure 1.

2.2. DataSet

2.2.1. Sentinel 1 SAR

Sentinel-1 SAR GRD data were deployed as the input of this algorithm. The data were provided in the C band, with a frequency of 5.405 GHz and a wavelength of approximately 6 cm. SAR imagery has a revisit period of either 12 or 6 days, depending on the availability of Sentinel-1A and 1B imagery. Interferometric Wide Swath (IW) mode imagery was selected, as it offers long-term land surface imagery suitable for our algorithms and helps to avoid conflicts. The IW mode is provided in dual-polarization with VV and VH. Our study utilized three years (2021–2023) of time-series imagery from the GEE platform, featuring high-resolution GRD (Ground Range Detected) products with a spatial resolution of 10 m × 10 m. The products were already calibrated and ortho-corrected with the Sentinel-1 toolbox and available on the GEE platform. The detailed introduction can be found on the [21].

2.2.2. Sentinel 2 (TOA)

In order to demonstrate annual variation and obtain the paddy rice distribution, Sentinel-2 top-of-atmosphere (TOA) products from 2021 to 2023 were employed in this study. Compared to surface reflectance (SR) data, the Sentinel-2 TOA datasets on the GEE platform are abundantly offered. The observation counts from 2021 to 2023 were reported in Figure 2. In addition to the conventional spectral bands such as red, blue, green, NIR, and SWIR, Sentinel-2 also provides a red edge band, which has been proven sensitive to vegetation growth in various studies [18]. A three-year span of images (2021–2023) was deployed to specify the phenological phases in Section 3.1 and then divided according to the time range of different phases for classification purposes. A detailed introduction to GEE Sentinel-2 (TOA) dataset can be found in [22].

2.2.3. Ground-Truth Data

The ground-truth dataset comprised both our ground survey data and auto-generated ground-truth rice samples from the Anhui region, excluding Huaibei, Bozhou, and Suzhou, where rice is rarely cultivated. Ground survey samples were systematically collected from cooperative farms where regular paddy rice crop rotations and established planting methodologies are employed. To augment these observations, sample points exhibiting similar spectral characteristics were identified and expanded upon using Google Very High Resolution (VHR) imagery, as shown in Figure 3. We then deployed experiments to capture rice phenology periods and related characteristics within the study area. The specific phenology detection methods are depicted in Section 3.1. Additionally, the Anhui region was divided into 30 equal-sized grids, within which rice and non-rice samples were then generated to illustrate the spatial variation and ensure the samples are representative. The specific sample generation methods were described in Section 3.2.

2.3. Cropland Mask

A cropland mask was applied in this study to exclude non-cropland areas before further algorithm processing. In previous studies, cropland masks have been widely utilized and proven to be helpful in reducing potential errors [7,18]. The Esri land cover dataset [23] was employed to exclude non-cultivated areas such as built-up areas, water bodies, grasslands, and forested regions.

2.4. Verification Dataset

To validate the accuracy of the proposed algorithm, several types of reference data were collected for comparison purposes: national statistical data, ground survey data, and another paddy rice mapping product.
  • Ground Survey Data. Ground survey data were collected from local farmlands from 2021 to 2023. During the survey, we collected the specific rice cultivation fields with GPS coordinates and the dates of specific phenological stages. We have collected 2032 pixel rice sample points from our ground survey. These ground-truth data were then expanded and used to detect the phenological features in the study area. Subsequently, these phenological features were used to extract sample paddy rice points in Anhui. The detailed sample generation process is introduced in Section 3.2.
  • National and Provincial Statistical Data. The Anhui Statistic Yearbook (ASY) has reported the planting areas of paddy rice for Anhui province annually. From this provincial statistical yearbook of Anhui, we collected the paddy rice planting areas of each prefecture-level city. These data were used as a comparison in our validations.
  • Another 10 m Rice Mapping Product. Han et al. [8] proposed a 10 m rice-mapping product in Northeast and Southeast Asia by identifying and analyzing the flood signal as the feature. Their proposed algorithm was deployed to generate a rice-mapping result as a comparison reference for our study.

3. Methodology

The PFBPM algorithm begins with the representative indices selection. Based on previous successful research of paddy rice mapping and monitoring [9,18,20,24,25] as well as the official crop calendars, several valuable indicators were confirmed. Then, the verified farmland ground samples were utilized to specify the phenological stages based on the rough calendar map from USDA. To augment the samples for further classification, a phenological-assisted sample expansion algorithm was deployed.
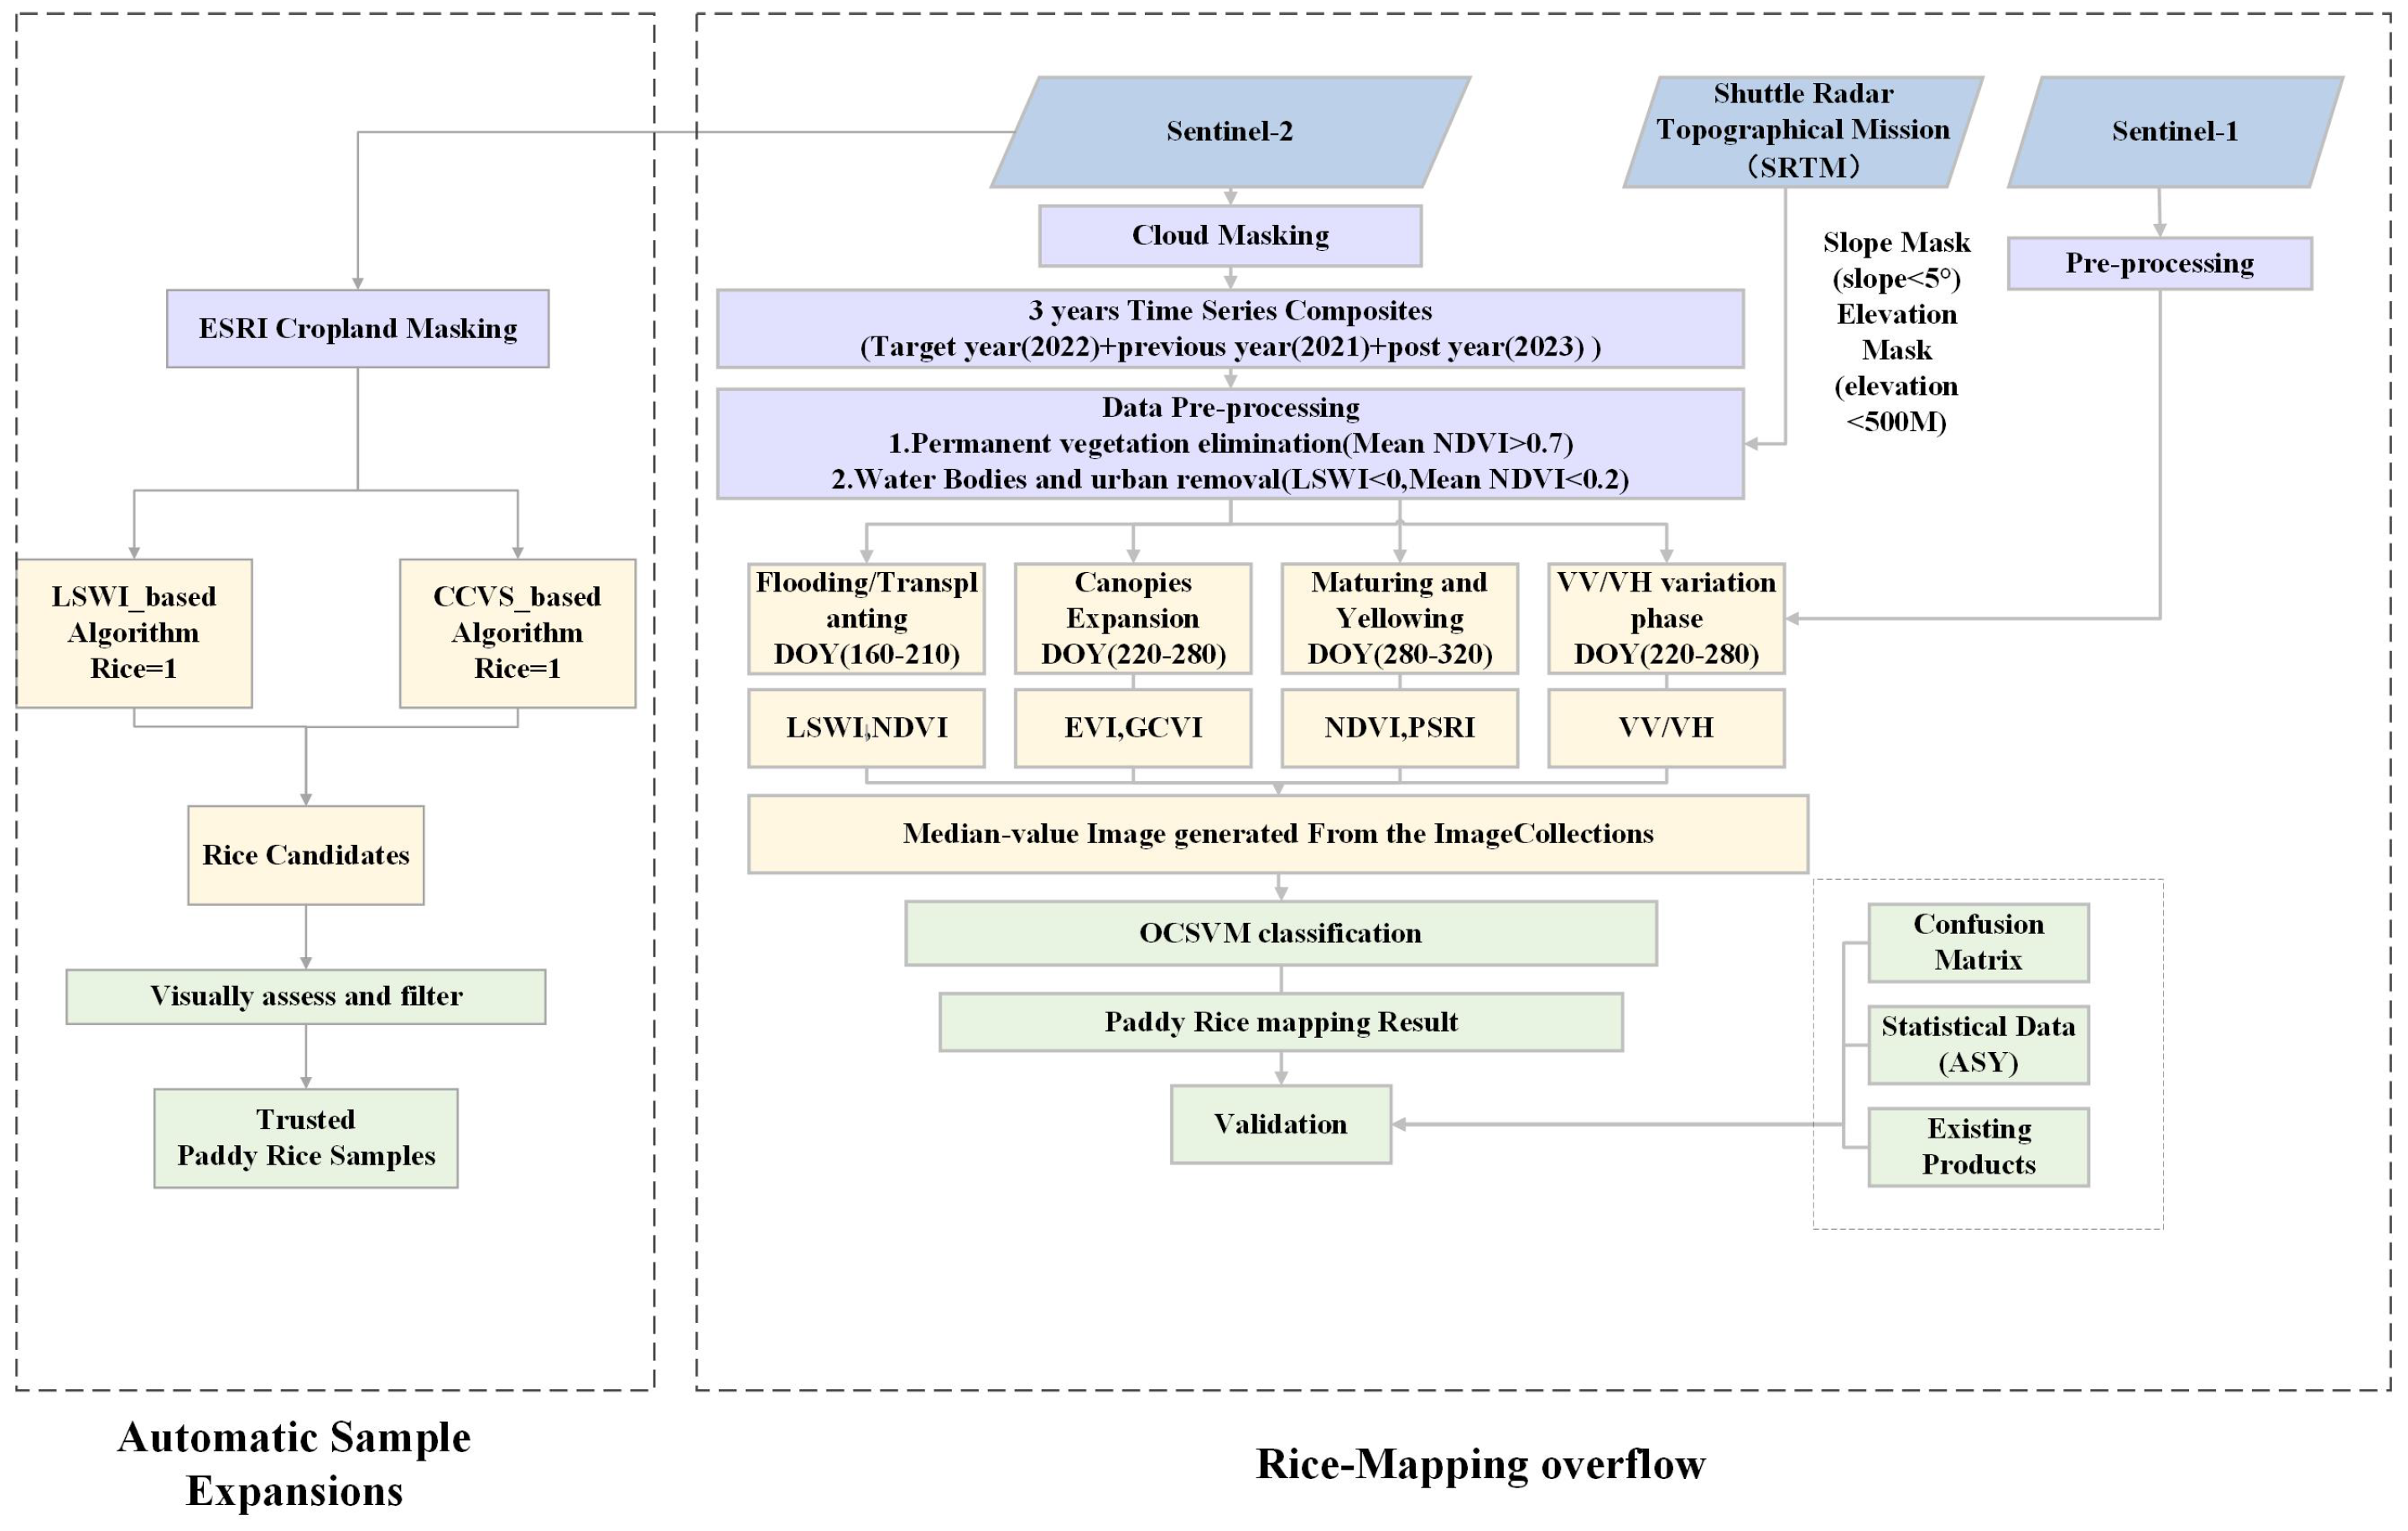
Finally, the distinct features from each phenological phase were retrieved from our modified Hybrid Sentinel-1/2 imagery on the GEE platform and then served as the inputs for the Support Vector Machine (SVM) algorithm to extract the paddy rice distribution. The detailed flowchart of PFBPM is illustrated in Figure 4.

3.1. Phenology Identification and Index Allocation

3.1.1. Index Selection

This study has included several indices that are widely adopted in paddy rice monitoring and mapping. The detailed formulas were listed in Table 1. Due to the varied features displayed in phenology (displayed in Figure 5), different indicators can show different significance. NDVI has been widely adopted in paddy rice mapping [7,26] as it could accurately trace the growth and canopy expansion in the paddy rice life-cycle. Previous scholars [25,27] have successfully utilized the feature that LSWI exceeds NDVI during the transplanting stage to identify the paddy rice fields. Liu et al. [25] conducted an experiment demonstrating that the selected spectral features—EVI and LSWI showed a significant difference from those of wheat and maize, thus illustrating high sensitivity for paddy rice extraction. Before harvest, the paddy rice became senescent and showed a great decrease in chlorophyll. At this time, PSRI was involved in monitoring the maturity of the paddy rice, as it has been proved valid by previous studies [28,29].
GCVI, originally designed to separate soybeans from maize, was later successfully employed to extract paddy rice planting areas due to its clear correlation with chlorophyll concentration [30]. From the calendar map of paddy rice, the canopies of the paddy expanded significantly during the growth phase. The boost of chlorophyll was correlated to the variation in GCVI [30]. Additionally, EVI has long been utilized to extract paddy rice pixels. Qiu et al. [9] demonstrated that the difference in EVI and LSWI between the heading and transplanting phases showed significant separability from other crops. With this distinction, paddy rice fields could be extracted from other crops. This study has also involved the time-series VV/VH value as an indicator, since it has been successfully adopted in paddy rice mapping [31,32]. Bazzi et al. [33] successfully identified paddy rice from other field crops using the annual variation in VV/VH, especially the curving trend during the growing phase, which perfectly distinguished it from other crops.
Given their proven effectiveness in previous studies across different stages, these indices were included in our study as inputs and distributed to different stages in a timely manner based on their representative features. After the phenological specification with ground-truth samples in Section 3.1, we then distribute these indicators to different phases as representations.
Table 1. Spectral indices and their formulas employed in the study.
Index NameCalculation FormulasReference
NDVINDVI = ρ N I R ρ R E D ρ N I R + ρ R E D Tucker (1979) [34]
EVIEVI = 2.5 × ρ N I R ρ R e d ρ N I R + 6 ρ R e d 7.5 ρ B l u e + 1 Huete et al. (2002) [35]
GCVIGCVI = ρ N I R ρ S W I R 1 1 Gitelson et.al (2003) [30]
PSRIPSRI = ρ N I R ρ R e d 1 Merzlyak et al. (1999) [29]
LSWILSWI = ρ N I R ρ S W I R 1 ρ N I R + ρ S W I R 1 Xiao et al. (2005) [24]

3.1.2. Phenological Phase Detection

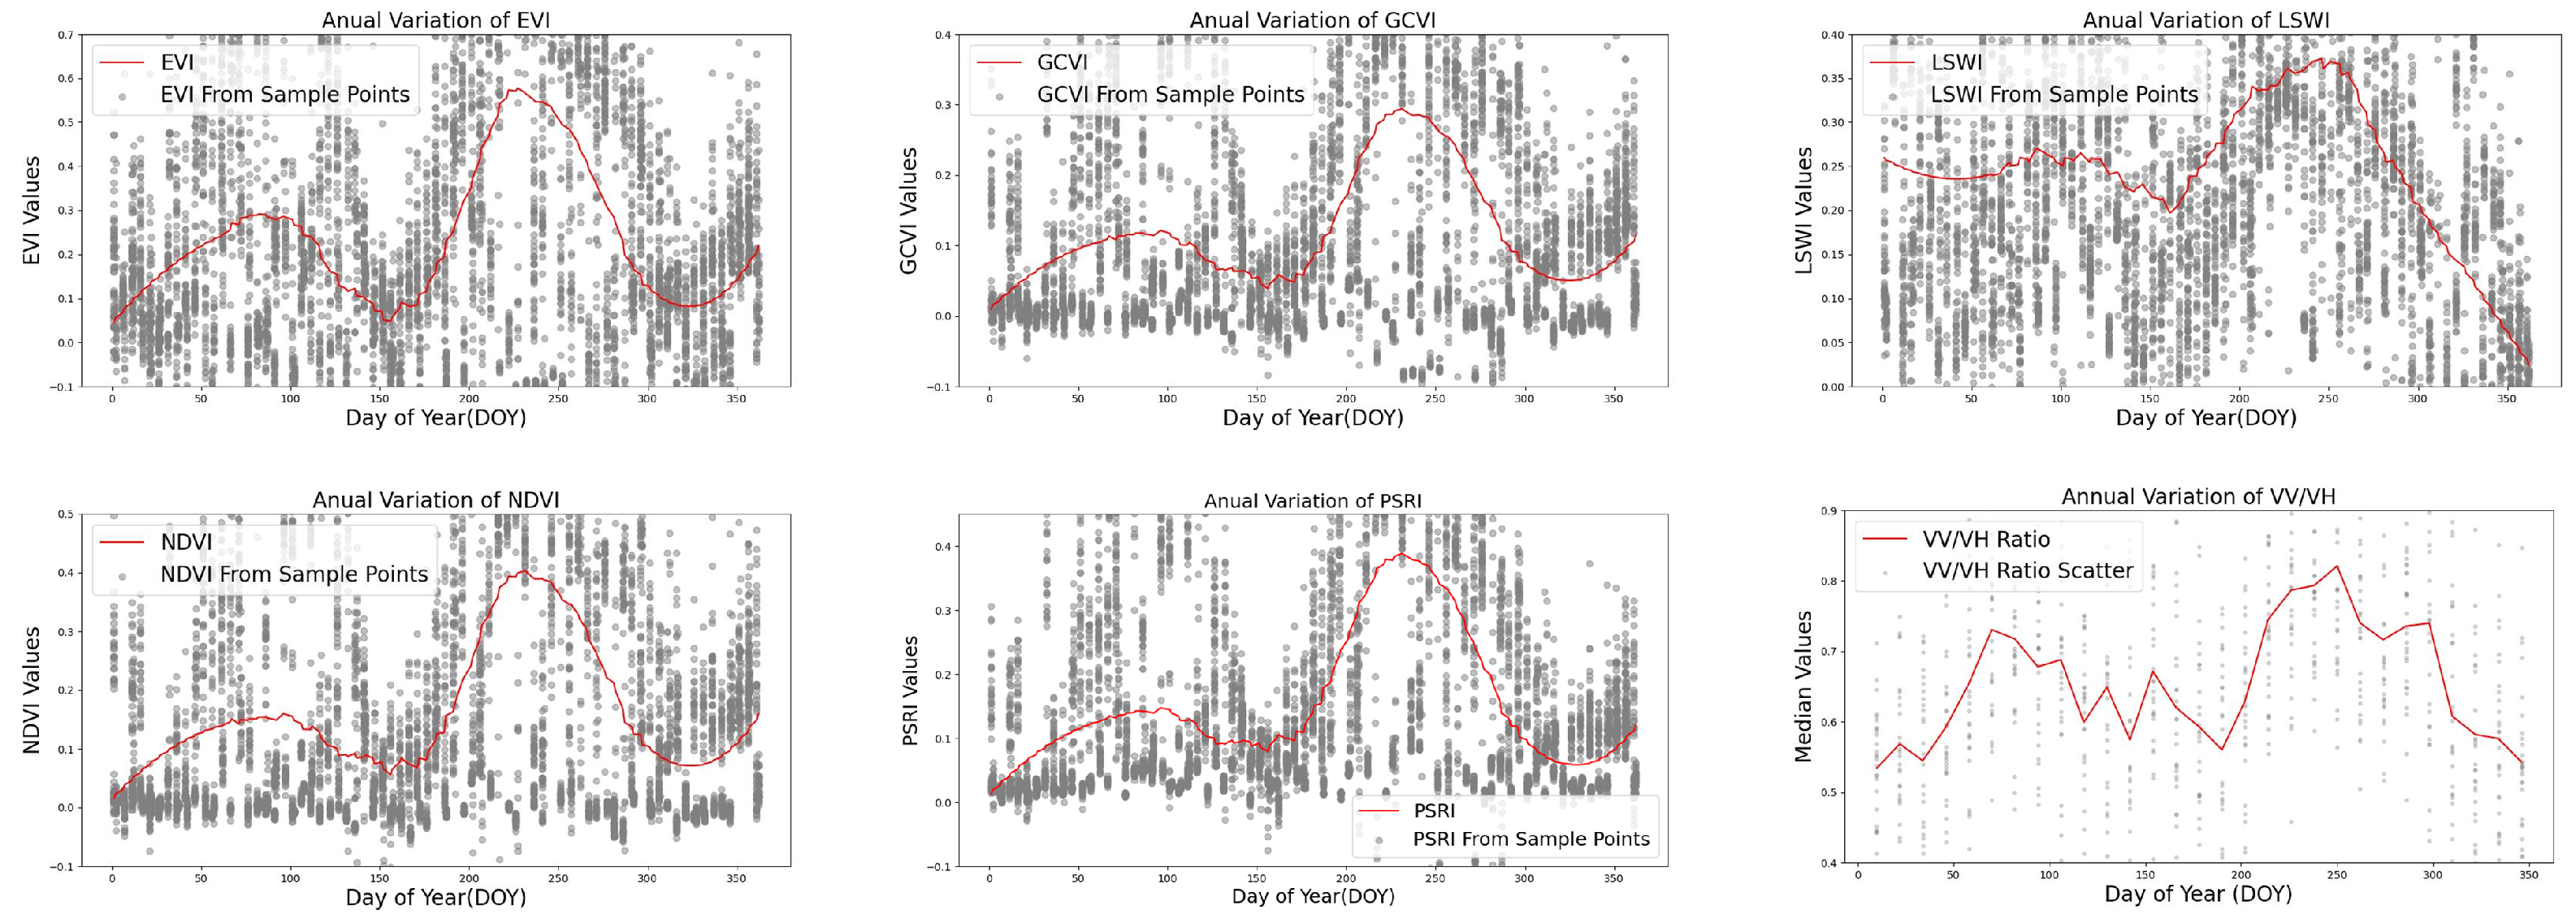
Phenology has been widely used in paddy rice planting area extractions. As paddy rice has demonstrated several key features distinct from other plants in the given phases. Therefore, previous studies have successfully utilized these to identify paddy rice. Based on the official calendar map and phenological variation in paddy rice illustrated in Figure 5, we then attempted to identify the specific phenological phases in the study area. The ground-truth sample points were used to demonstrate annual variation in the selected indices (as shown in Table 1). The three-year Sentinel-1 and Sentinel-2 image collections were first converted into a one year range, sorted by their Day of year (DOY) to expand the data capacity. The annual variation in the six different selected indices were reported in Figure 6. All the grey dots represent the raw values of the sample points on each DOY. The red line, smoothed using the Savitzky–Golay algorithm, indicates the yearly trend of median values.
Aided by the calendar map and previous phenological divisions from other scholars [20,36], the variations in the six different indicators were used to identify the phenological phases and corresponding date ranges locally. Three phenological phases were defined in this study: the flooding period, the growing period and the ripening period. The related candidate indices confirmed in Section 3.1.1 were distributed to each phase, expressing their representations. The details were explained as follows:
  • The Flooding Period. The flooding or transplanting stage is a widely accepted phenological feature for extracting paddy rice. During this stage, moisture levels gradually increase in the planting field. This stage has been extensively verified by many previous studies [25,27]. As shown in Figure 6, LSWI exhibited a sudden increase around DOY 160, indicating the flooding signal of paddy rice. We defined the flooding period as occurring from DOY 160 to 210 to capture this significant and proven feature of paddy rice extraction.
  • The Growing Period. After transplanting, paddy rice begins to grow. With the rapid expansion of canopy areas and the rise of chlorophyll signals, vegetation indices that represent greenness growth are relevant in this phase. GCVI was first used, since it was closely related to the chlorophyll and demonstrated effectiveness in tracing rice growth [20]. Also, the EVI value was involved in capturing the canopies’ expansion, and the peak value during this stage has previously been utilized in rice mapping [9,27]. From the annual indices variation curves, the nominated indicators remain high, around DOY 250–260 (heading date). We slightly expanded both sides of these dates to minimize the risk of missing valuable features. Additionally, VV/VH showed a positive gradient and almost reached the peak value during this stage, consistent with previous research [33,37,38], and was therefore included in this period. Though most of the vegetation indices (VIs) have demonstrated high values during this stage, we purposely included our selection above, since others were more representative in different phases.
  • The Ripening Period. After the growth phase, paddy rice enters the ripening period, during which it begins to mature, and chlorophyll levels decrease. Here, PSRI and NDVI were used to signify this stage, as they are both clearly related to the maturity of paddy rice. As the rice turns yellow, the PSRI shows an increase [28]. In Figure 6, this occurred around DOY 300. Thus, this period was defined from DOY 280 to 320.

3.2. Rice Sample Expansion

After identifying the DOY of the key phenological stages of paddy rice growth in the study area, the hybrid LSWI and CCVS algorithm was deployed to select refined rice pixels [9,20,24]. Xiao et al. [24] demonstrated that the LSWI value is closely correlated with the flooding signal of paddy rice, distinguishing it from other terrestrial crops. The flooding signal is a distinct feature of paddy rice during the seeding and transplanting periods. Typically, the LSWI value exceeds that of NDVI due to the moisture present in the planting area. Consequently, the following variables were calculated and utilized to fulfil the task of rice-sample pixel identification.
N D V I = ρ N I R ρ R e d ρ N I R + ρ R e d
L S W I = ρ N I R ρ S W I R 1 ρ N I R + ρ S W I R 1
R i c e = 1 , if L S W I > N D V I 0 , otherwise
Here, ρ N I R , ρ S W I R 1 , ρ R e d denote the near-infrared (NIR), short-wave infrared (SWIR), and red bands, respectively. The pixels were classified as paddy rice based on the above formulas, with parameters kept consistent with the original studies. A detailed description of the approach could be found in [24].
Additionally, the vegetation phenology and surface moisture method (CCVS) from Qiu et al. [9] utilized the difference between the transplanting and heading stages to identify rice. As discovered in Section 3.1, the LSWI remains elevated from the transplanting to the heading phase. Simultaneously, the EVI value dramatically increases due to canopy expansion. According to Qiu et al. [9]’s study, LSWI and a new index, the ratios of change in the amplitude of LSWI to EVI (RCLE), were used to signify these changes and detect paddy rice pixels. The specific formulas are as follows:
R C L E = L S W I heading L S W I flooding E V I heading E V I flooding
R i c e = 1 , if L S W I m i n > 0.1 , R C L E < 0.6 0 , otherwise
Here, L S W I heading , L S W I transplanting , E V I heading , E V I transplanting represent the LSWI and EVI values at the heading and transplanting stages, respectively. The specific thresholds were set consistently with the original paper. A detailed explanation can be found in [9].
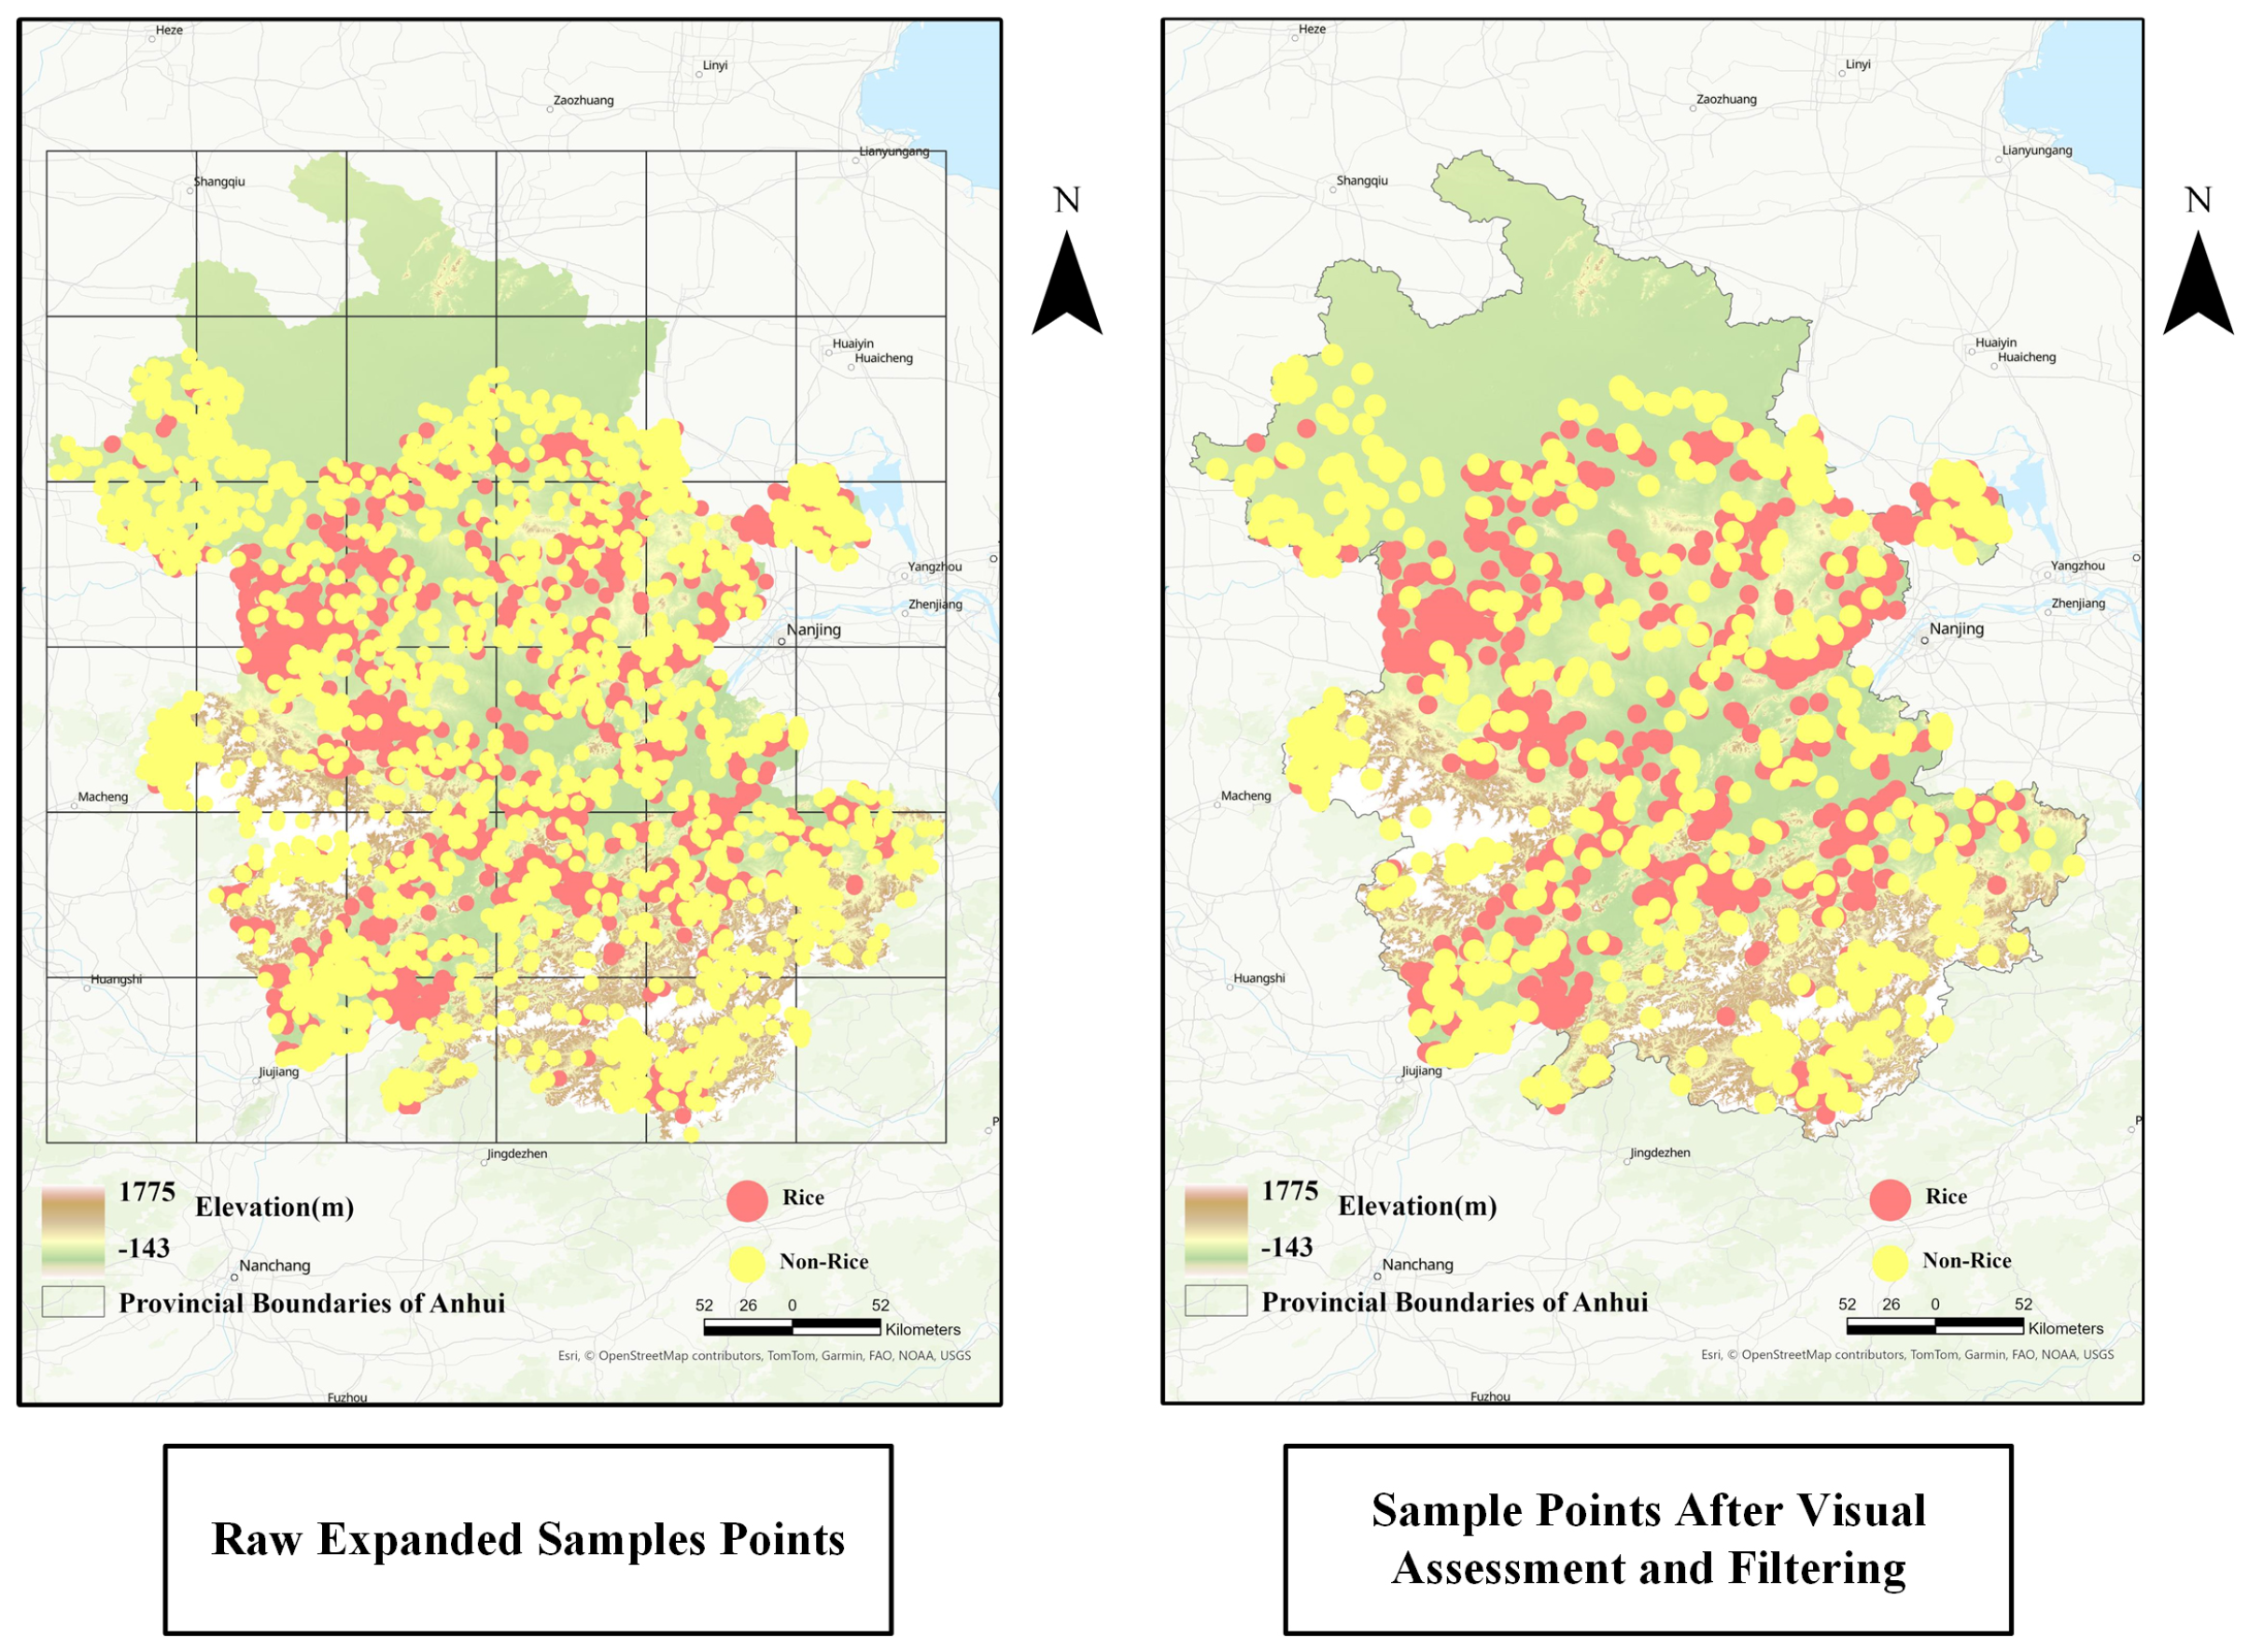
Finally, the paddy rice sample pixels were derived, where the two requirements above were satisfied (Equations (3) and (5)). The sample distribution in the study area is shown in Figure 7. When generating samples, the study area (Anhui Province) was divided into grids of equal size, and samples were stratified within each grid. This approach not only ensures that the selected samples are representative but also optimizes the classification results further [39]. Suzhou, Huaibei, and Bozhou were excluded from sample expansion and further classification, as paddy rice is rarely planted in these three regions. The generated candidate sample points were then filtered and visually assessed through Sentinel-2 high-resolution imagery. Finally, the trusted samples were confirmed (Figure 7).

3.3. Phenological Features-Based Paddy Rice Mapping Method

After preparing the phenological details and trusted samples, we first generated our Hybrid Sentinel-1/2 imagery on GEE platform. For Sentinel-2, the 2021–2023 images have been obtained on GEE platform. The cloud masking was performed on the Sentinel-2 datasets. The QA-60 band was utilized to eliminate the opaque clouds (bit10) and cirrus clouds (bit11). Then, the Sentinel-1 image sets from 2021–2023 were collected and used to generate VV/VH values repeatedly, and attached as bands to the existing Sentinel-2 image collections. Finally, the Hybrid Sentinel-1/2 datasets were ready for the further classification. Also, an image property named ‘CLOUD_PIX_PERCENTAGE’ was used to help us exclude images with a high proportion of cloud pixels. A threshold of 70% was set for this criterion, based on previous relevant studies [40,41].
In the sample expansion process (Section 3.2), we employed a cropland mask to eliminate noise from non-cropland areas. To ensure that the cropland mask employed during the expansion would not bias the classification phase, we did not reuse the mask again. Instead, we applied several independent masks to specifically exclude non-rice pixels during further classification.

3.3.1. Non-Potential Rice Masking

Several masks were deployed to exclude non-crop land pixels in the classification module:
  • Topographical and water bodies exclusions. Areas where NDVI < 0.1 and NDVI < LSWI were identified as permanent water bodies and were masked before proceeding to the next steps [9]. Xin et al. [42] illustrated that paddy rice in China is mainly planted on flat plains in eastern China, due to the terrain being suitable for planting and harvesting. We incorporated DEM data from the NLCD-2000 datasets, calculated the slope of each pixel in our study area, and, following Rossi and Erten [43], excluded regions with slopes greater than 5 degrees to remove potential topographical impacts on our rice classification algorithms.
  • Less-likely vegetation area. Areas less likely to support vegetation, such as urban regions, saline and alkaline lands, or sparsely vegetated areas, typically exhibit high reflectance in both the visible and short-wave infrared spectral bands due to low levels of green vegetation. We calculated the maximum NDVI value from all valid observations during the growing season. Areas exhibiting a maximum NDVI value below 0.5 were classified as less-likely vegetation land (LLVL), and a corresponding mask was subsequently generated [44].
  • Permanent vegetation masking. Permanent vegetation areas, such as forests, consistently exhibit greenness throughout the year. Unlike croplands, which show fluctuations in reflectance and related indices during crop rotation or harvesting, permanent green areas remain stable in their spectral characteristics. We selected NDVI data from year-round observations, calculated the mean value of good observations, and, based on the study of Fensholt et al. [45], masked pixels with an NDVI_Mean greater than 0.7 as permanent greenness.

3.3.2. Image Composites for Classification

After the phenological phases and samples were prepared, image composites were generated following the application of the aforementioned masks. Related indices, as listed in Table 2, were calculated as bands to be added to the Sentinel-2 image collections. To generate the Hybrid Sentinel-1/2 image collections, the VV/VH values were calculated repeatedly from Sentinel-1 collections and added as bands to attach on each image in Sentinel-2 image collections that we retrieved previously. Then, the starting and ending dates of the three distinct phenological phases were applied to generate sub-image composites, which were then merged together and prepared for classification.
To better illustrate the features from the image collections in the time series, we utilized the ‘reduced’ algorithm in GEE to generate the median map of each pixel in the clipped Region of Interest (ROI) after eliminating potential outliers. Compared to the mean map, the median value more effectively displays the phenological features of the period.

3.4. Classification

After generating the imagery to be classified with the included features, we applied a classifier to extract the paddy rice area. While most research typically deployed multi-class classification to separate different land uses or covers, our goal was to specifically identify paddy rice cultivation by segmenting it from all other classes. In this study, we utilized the one-class Support Vector Machine (OCSVM) embedded in GEE for classification. Similar to the traditional Support Vector Machine (SVM) classifier, the OCSVM emphasizes the distinction between the target class and others [46]. In previous studies of paddy rice mapping, OCSVM has demonstrated superior outcomes compared to other classification algorithms [18,47]. Although we collected various categorical non-rice samples in advance, we opted for OCSVM due to its higher classification accuracy and effective sample utilization.
Selecting an appropriate kernel to transform the input data into a higher dimensional space is essential for improving classification accuracy. Initially, we set the kernel as ‘SIGMOID’, commonly used in deep learning. However, this led to over-classification in our results. According to Xu et al. [46], the ‘SIGMOID’ kernel does not perform as expected in OCSVM, prompting the study to switch to the default Radial Basis Function (RBF) kernel. The RBF kernel excels in capturing the complex spatial characteristics of different landscapes, thus enhancing our algorithm’s ability to extract paddy rice areas.
When configured with the RBF kernel, two parameters require careful tuning: ‘ ν ’ (nu) and ‘ γ ’ (gamma). The ‘ ν ’ parameter controls the tolerance for outliers; a lower ‘ ν ’ value makes the algorithm more sensitive to anomalies, thereby enhancing the accuracy of paddy rice extraction. The ‘ γ ’ value influences the curvature of the decision boundary; a lower value results in a smoother boundary, while a higher value can create complex and intricate boundaries in the classification. After comparing several results generated from our training samples with different parameter values, we determined ‘ ν ’ = 0.1 and ‘ γ ’ = 0.3, as this combination produced the optimal results [48].

3.5. Validation

We utilized the Anhui Statistical Yearbook to validate the paddy rice mapping result. To assess the accuracy of our algorithm, we selected the top three cities with the highest paddy rice production in Anhui Province and extracted their cultivation area data for comparative analysis. For this comparison, the statistical rice distribution data served as the actual data, while our rice mapping results were considered the predicted data.
Subsequently, we employed a confusion matrix as the verification tool. The ground-truth samples and some of our expanded samples were used for the validation. The evaluation metrics included were Overall Accuracy (OA), User’s Accuracy (UA), Producer’s Accuracy (PA), and Kappa Coefficient (KC). These parameters were explained in Table 3.
In Table 3, X i i represents the number of correctly predicted pixels for class i (rice pixel). The denominators in the UA and PA formulas represent the total predicted instances for class i and the total actual instances for class i, respectively. N is the total number of instances. P o is the observed agreement (same as OA), and P e is the expected agreement by chance.
Finally, we deployed another rice mapping product [8] and compared its mapping results in Anhui province with our outcomes. Subsequently, a visual comparison between these results was employed as the reference. The product from Han et al. [8] also maps rice distribution based on phenological features. Although it was originally employed in a different study area in Asia, we adapted the algorithm for Anhui Province to generate results that serve as a reference in our comparison. Additionally, a comparison of the prefecture-level rice-planting areas between the two algorithms and the 2022 statistical record was conducted.

4. Results

4.1. Rice Mapping Results

The spatial distribution of the study area is shown in Figure 8. The result was generated from our Hybrid Sentinel-1/2 imagery from 2021–2023. The distribution indicates that most of the paddy rice in Anhui Province is cultivated in the central and southern parts of Anhui, near the Huai River Basin, while it is sparsely distributed in the northern parts. This general mapping outcome is consistent with the statistical data provided in the Anhui Statistical Yearbook.
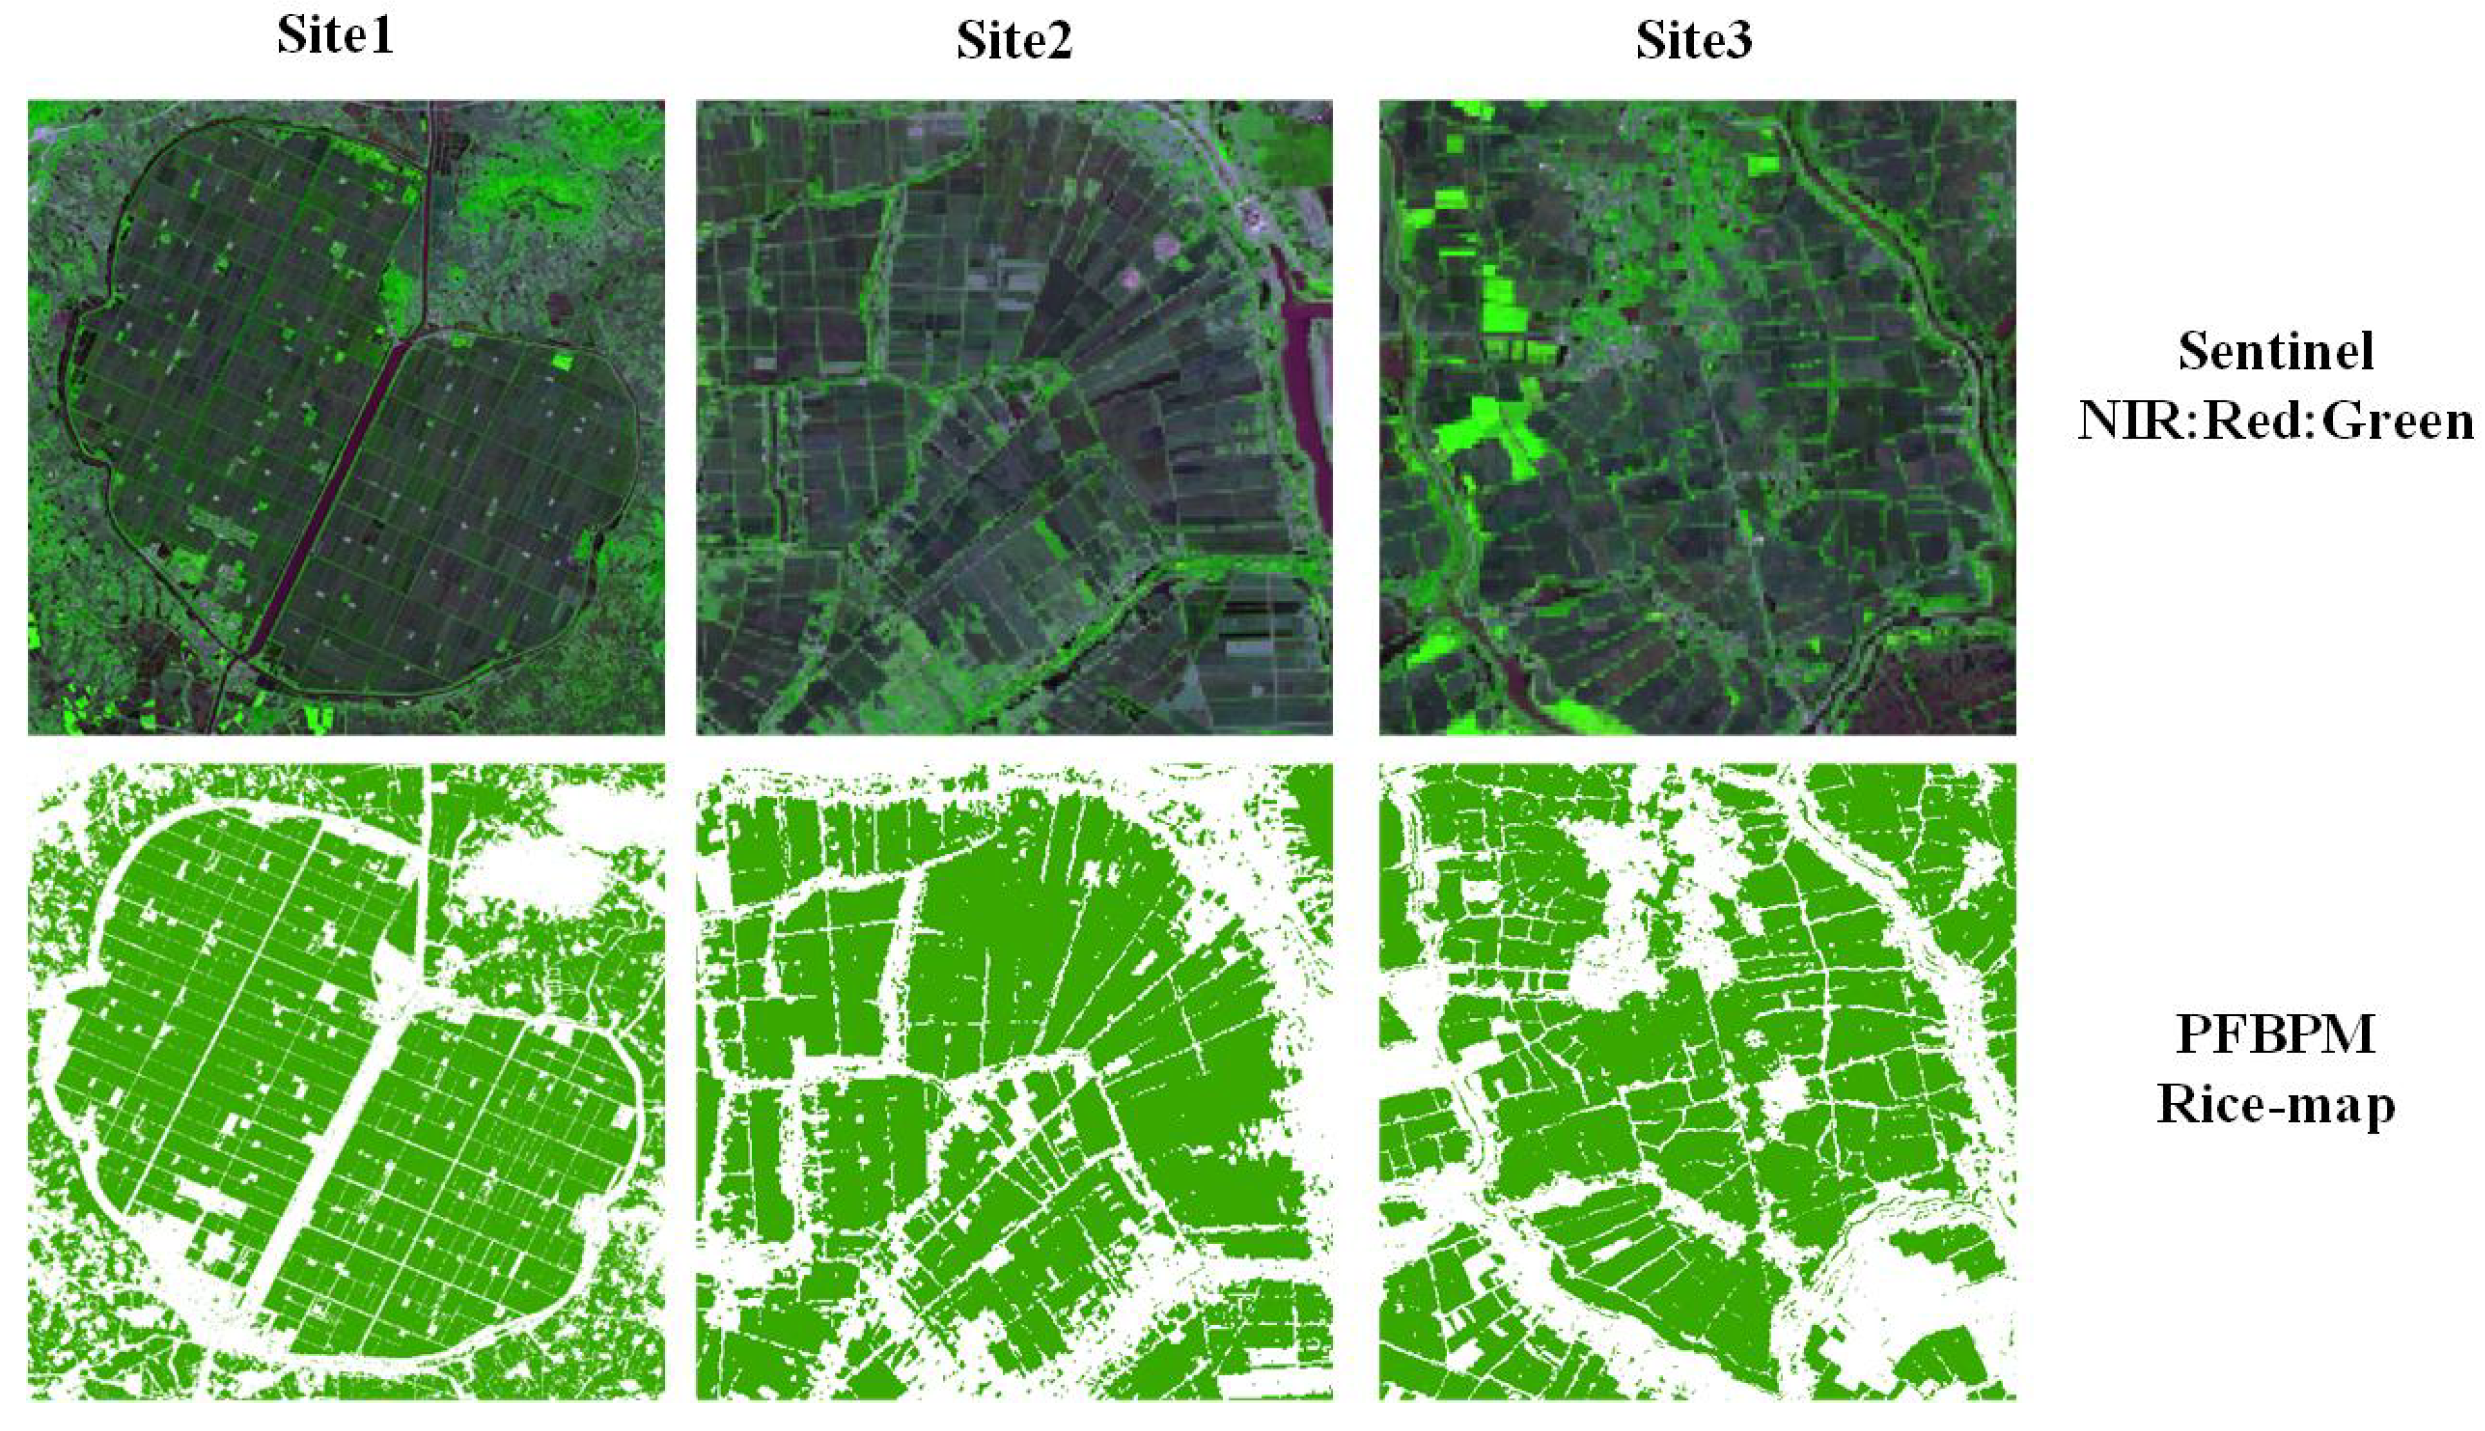
When examining the details, the partial results in three different regions (as shown in Figure 9) demonstrated a general pattern of planting: paddy rice planting is larger in scale, with regular shapes and significant consistency in adjacency. Our phenology-based algorithm, utilizing Hybrid Sentinel 1/2 imagery, exhibited remarkable mapping results in visual performance, clearly distinguishing paddy rice fields from non-rice areas. The results also accurately segmented edges and tiny paths between fields, including small buildings adjacent to cropping fields. However, small unmapped holes or several misclassifications appear on the contiguous rice patches, which might be attributed to noise in the Sentinel data.

4.2. Classification Accuracy

4.2.1. Accuracy Validation from Confusion Matrix

The confusion matrix results of PFBPM in the Anhui region and the top three rice cultivation cities—Hefei, Lu’an, and Chuzhou—were presented in Table 4. As shown in the table, both the Overall Accuracy (OA) and Kappa values exceed 90% and 85%, respectively. These results illustrated that the PFBPM has performed well and achieved considerable results.
Although the overall accuracy was considerable, several misclassifications occurred in our validations. These issues may be related to the inherent limitations of the algorithm. The algorithm relies on the spectral features from satellite images at the pixel level. While these spectral features generally produced the expected values, differences in observational angles or parameters in the time-series data are difficult to normalize perfectly. Additionally, despite using cloud masking with QA60 bands on the GEE platform, cloud contamination can still introduce noise into the paddy rice mapping results. Further analysis of the result uncertainty can be found in Section 5 [19,49].

4.2.2. Accuracy Validation from Statistical Data

We compared our results for paddy rice planting areas with the statistical data from the Anhui Statistical Yearbook (ASY). The yearbook provides detailed planting area information for each prefecture-level city in Anhui Province. The planting areas derived from our algorithm demonstrated a high level of consistency with the statistical data presented in the yearbook.
For validation, we selected the major paddy rice cultivating cities in Anhui Province, specifically those with planting areas greater than or equal to 10 × 104 ha. As shown in Table 5, our results exhibited considerable accuracy, with error rates around or less than 10% compared to the statistical data from the ASY.
To better verify the credibility of our algorithm over the years, we carried out correlation and significance tests between two types of area data (the PFBPM and statistical records) at the prefecture level in 2021, 2022, and 2023, respectively (as shown in Figure 10). The coefficient of determination ( R 2 ) in all three years remained at approximately 0.99, demonstrating that our rice product showed great consistency with the statistical data.

4.2.3. Comparison with Other Rice Mapping Products

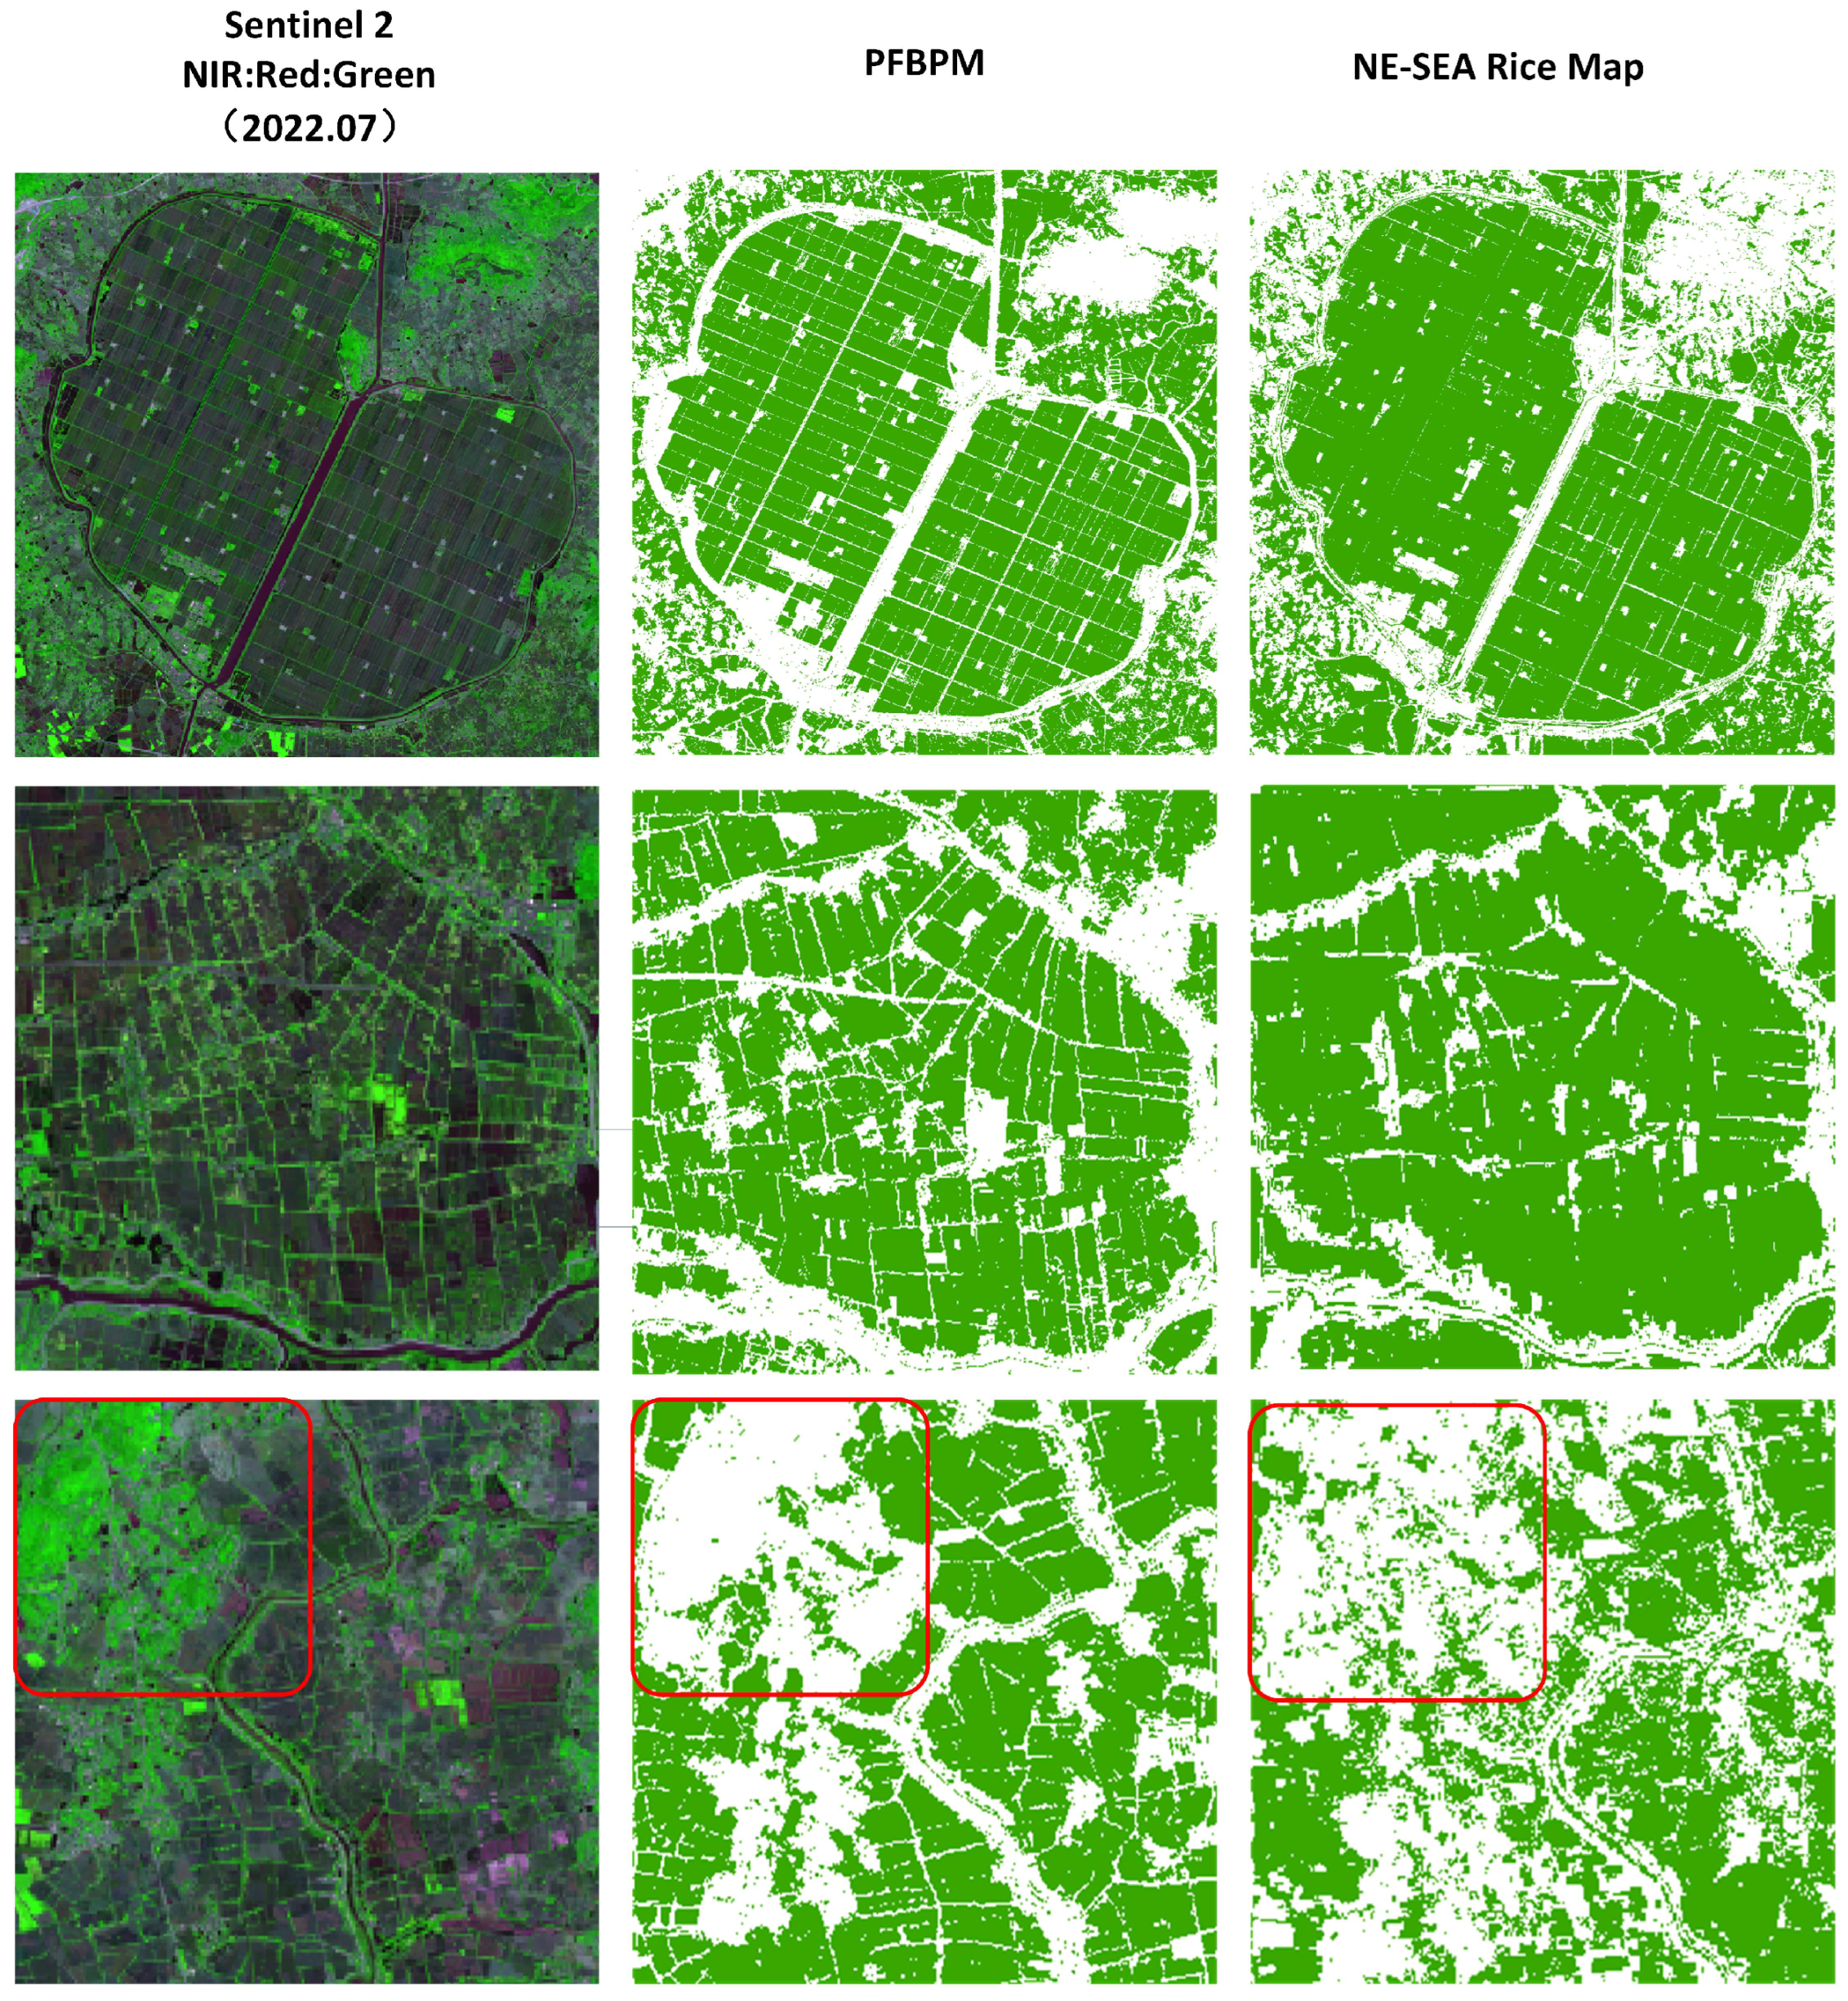
The comparison between our algorithm and NESEA-Rice10 [8] demonstrated that both products exhibit a high degree of consistency in their mapping results. As illustrated in Figure 11, although both produced produce similar classification results overall, PFBPM rice maps were noticeably more complete and cleaner compared to the existing product. In Site 1, the PFBPM showed cleaner details in and between the paddy rice crop sheets. In Sites 2 and 3, the PFBPM provided a more distinct classification of rice and non-rice pixels, ensuring a more accurate representation of the planting areas.
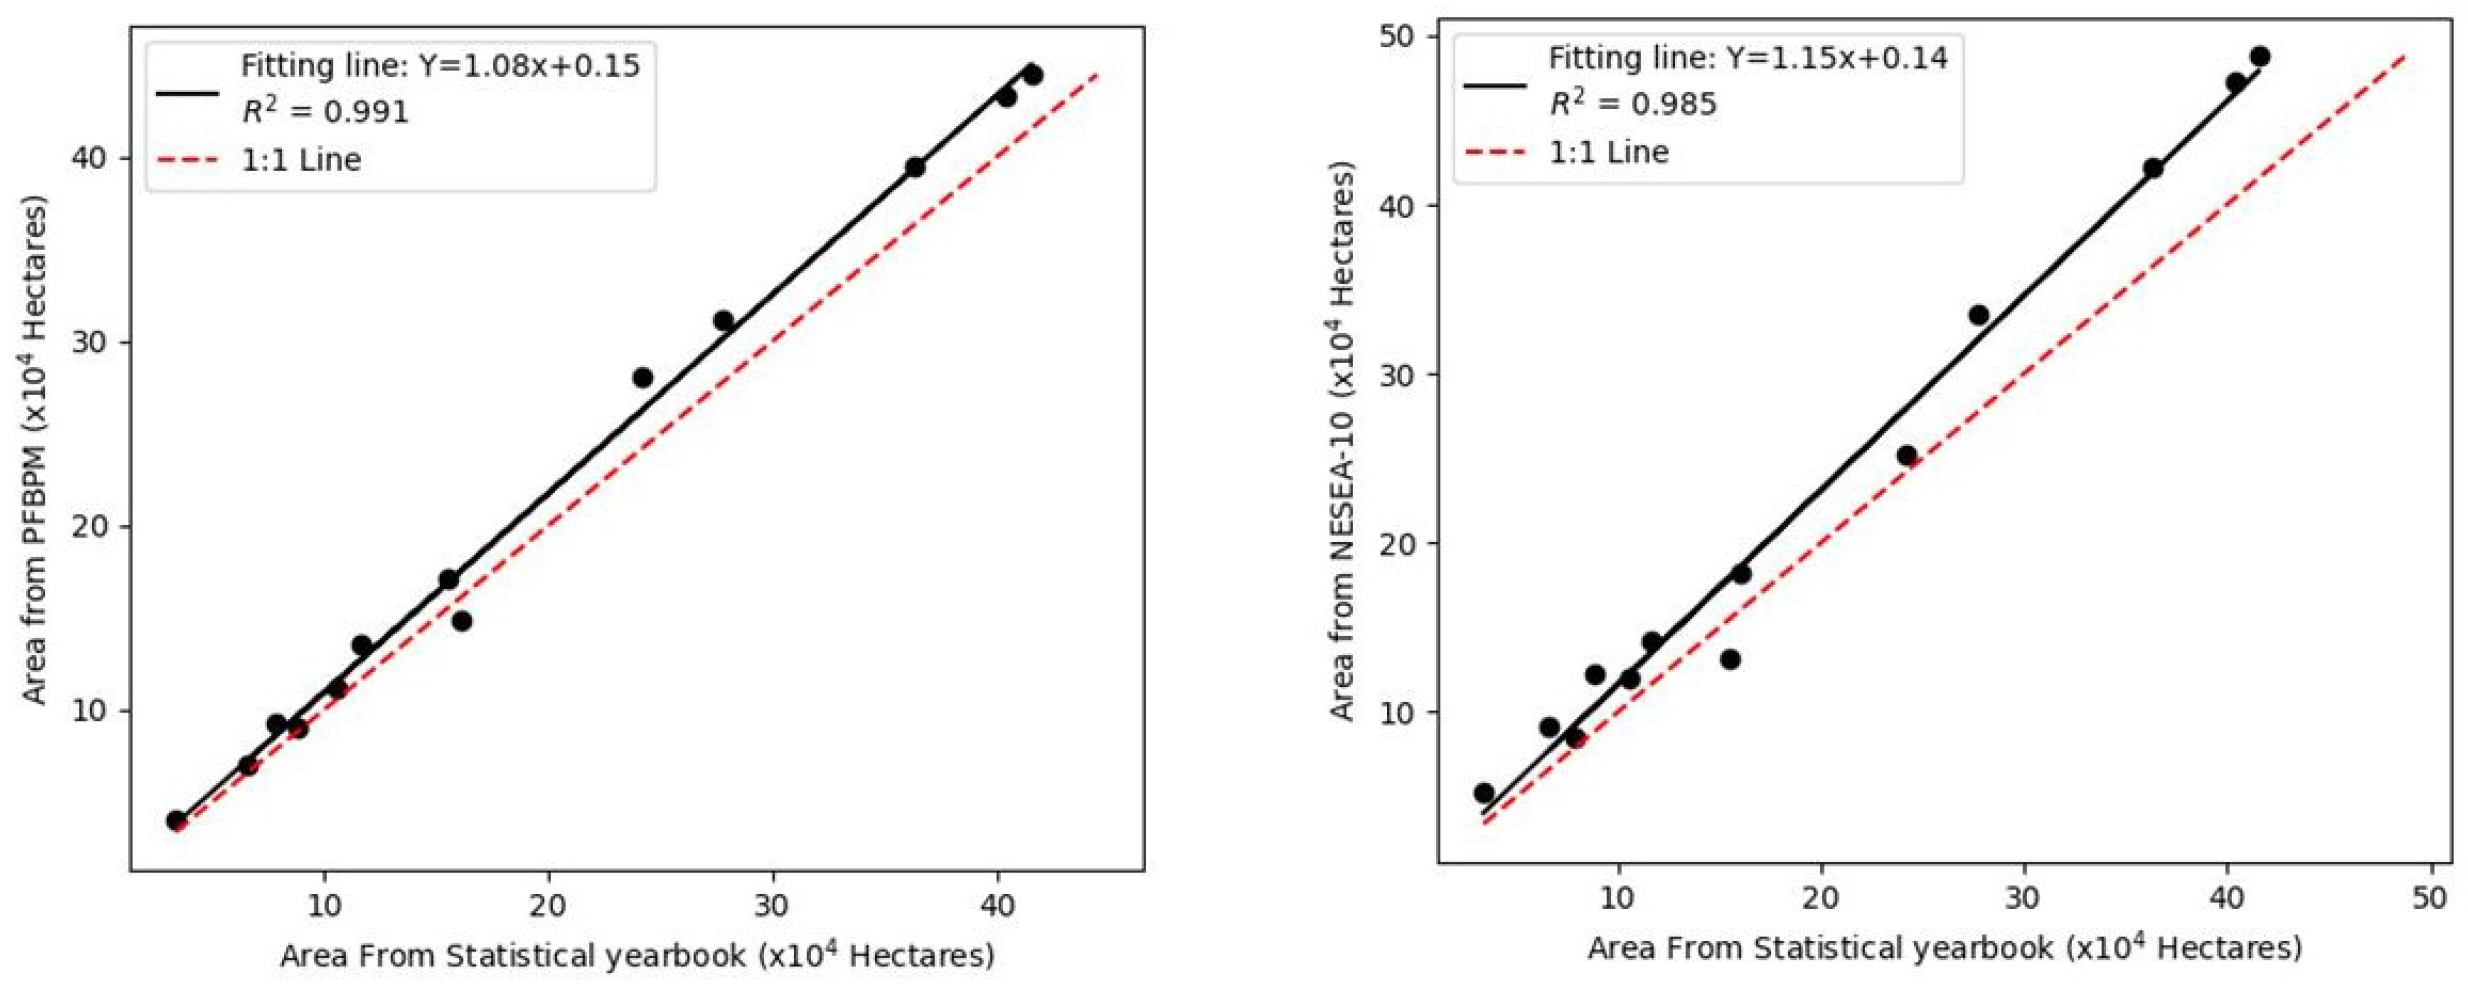
When compared with agricultural statistics (as shown in Figure 12), it was found that the PFBPM showed an average R 2 of 0.991 and slope of 1.08 with a prefecture-level statistical planting area and received better results than the counterpart rice mapping product. This suggested that our extraction is reasonable.

5. Discussion

5.1. Phenological Features-Based Paddy Rice Mapping (PFBPM)

This study proposed an phenological features-based paddy rice mapping (PFBPM) algorithm to extract the spatial distribution of paddy rice in Anhui region, China. While the study focused on a regional area in China, the PFBPM could be adapted to other major rice-producing regions globally, particularly in Asia, where similar satellite coverage and cropping patterns exist. It would be essential to calibrate the model to local phenological stages and vegetation indices relevant to each region’s specific agricultural practices and climate conditions. Beyond paddy rice, the methodology could be tailored to monitor other crops by adjusting the phenological stages and spectral indices used. This adaptation would allow for the monitoring of crops that have distinct spectral profiles and phenological patterns, such as wheat, corn, and soybeans, thereby aiding in broader agricultural management and food security initiatives.

5.1.1. The Reliability of PFBPM

The PFBPM extracted phenological periods from ground-truth samples to delineate the different phenological stages of the paddy rice lifespan. Instead of relying on 1–2 indices throughout the entire life-cycle, we utilized 2–3 indices for each phenological phase to ensure mapping accuracy.
During the transplanting phase, the flooding signals reveal the moisture characteristics of paddy rice, distinguishing it from other crops. In the growing phase, canopy expansion indicates greenness, aiding in detection. As paddy rice matures, greenness fades to yellow. Although the noise is inevitable with a single feature, combining multiple features within each phase enhances mapping accuracy. Phenological differences across regions due to varying climates and crop rotations are significant, but the phenological approach provides a valuable reference for intelligent agriculture using remote sensing. This approach could optimize strategies and patterns in the current agricultural industry.
The transplanting phase is particularly representative of paddy rice, with many studies detecting flooding signals. Based on these studies and their excellent results, LSWI and NDVI were selected to extract moisture signals [7,26]. However, rainy seasons can introduce noise in LSWI identification, necessitating the combination of multiple phenological stages and indices to minimize impacts.
During the growing period, as canopies showed expansion, indices related to chlorophyll (EVI, GCVI) were selected. To ensure accuracy, Sentinel-1 radar-based data, which operates in the C-band and penetrates clouds, was included. Research by Nguyen and Wagner [37] revealed that VV/VH values are sensitive to paddy rice growth cycles compared to other crops, thereby enhancing our algorithm’s accuracy.
As paddy rice matures, chlorophyll content decreases, changing color from green to yellow. PSRI, which captures vegetation senescence, was selected for its sensitivity to changes in leaf pigments. NDVI, which decreases as crops mature, was also included. Integrating both PSRI and NDVI allows for the comprehensive tracking of the maturation stages of paddy rice [9,50].

5.1.2. Trusted Training Sample Expansion

To improve classification accuracy, it is essential to use more valid training samples. Beyond ground-truth sample points, the PFBPM derived trusted training samples based on two widely adopted models: LSWI-based [24] and CCVS [9] algorithms. We divided the study area into uniformly sized polygons and systematically generated samples within each polygon. This method ensures even sample distribution and reduces omissions in further classifications.
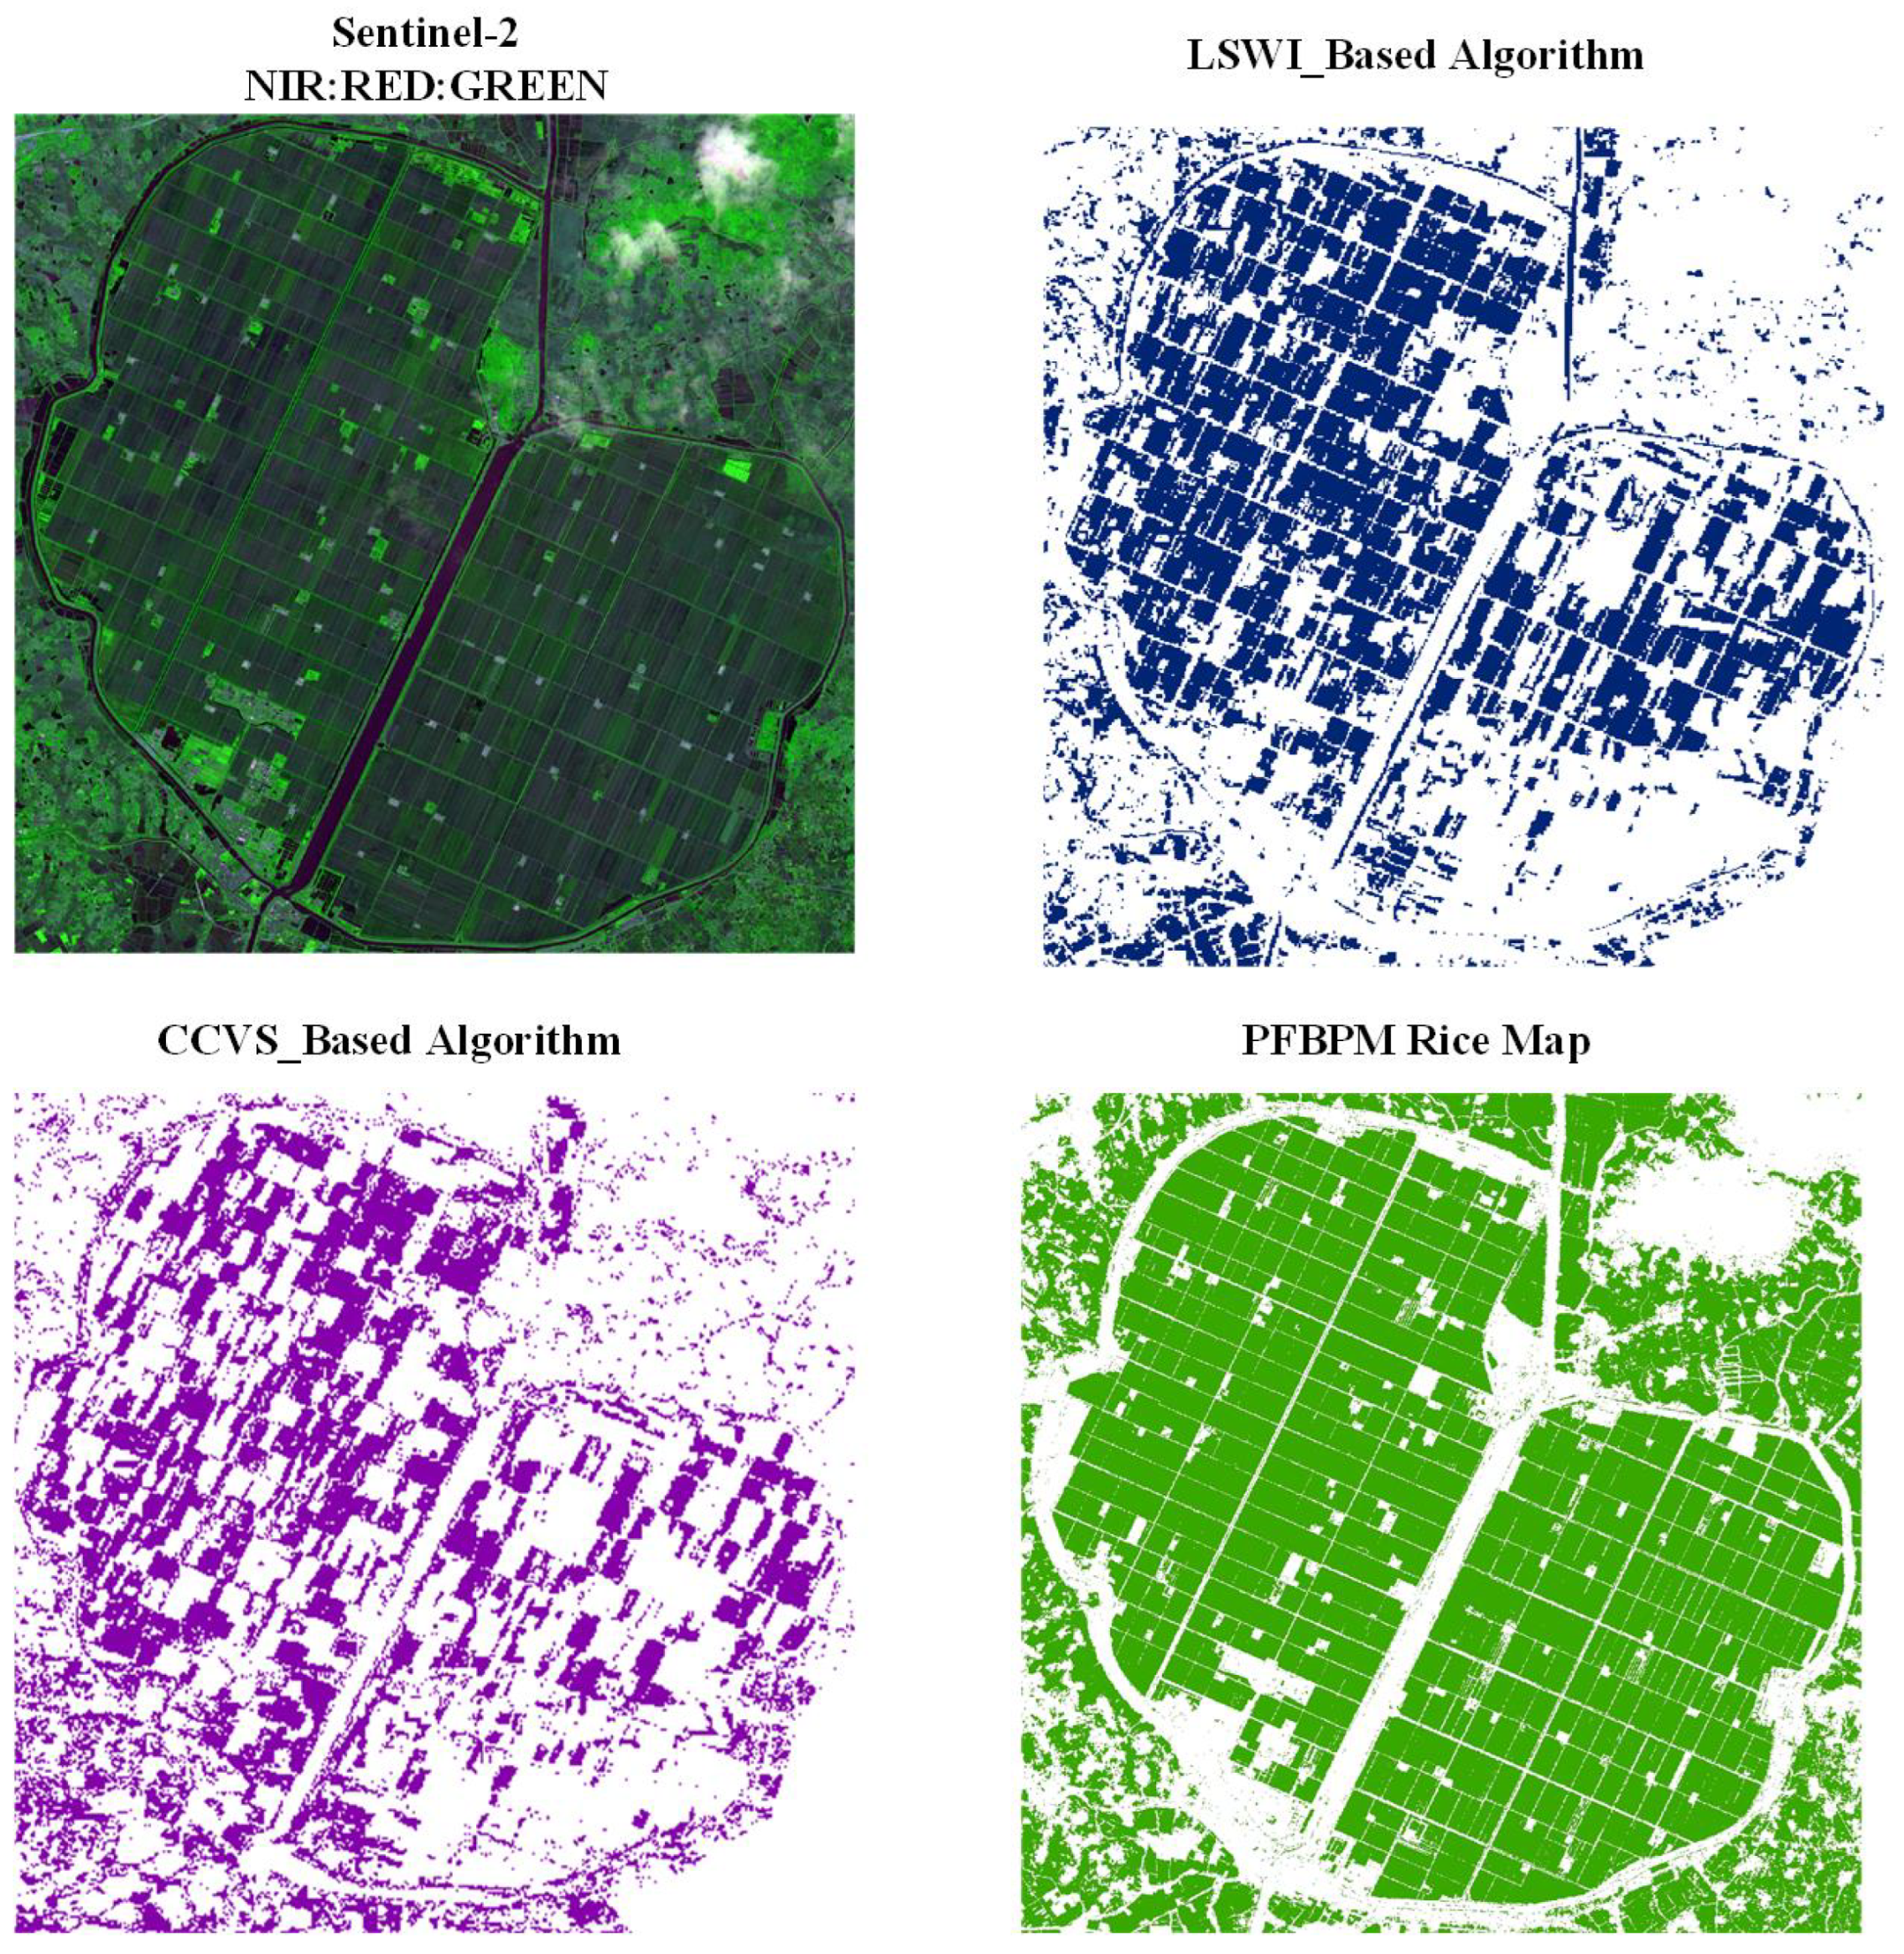
To demonstrate the credibility of our sample generation, we created rice candidate maps using these two approaches in a specific ground-truth area. The comparison results were shown in Figure 13. These maps indicate that both the LSWI and CCVS approaches were effective in identifying paddy rice areas. However, combining these methods enhances accuracy and improves the reliability of sample identification for our proposed method. Further visual assessment facilitated the easy identification and inclusion of rice growing samples. The LSWI-based approach relies on LSWI exceeding NDVI during the transplanting phase, while the CCVS approach, which incorporates the transplanting phase, heading phase, and phenology gradients, both contributed valuable insights. By integrating these two approaches in the sample expansions, we achieved a more comprehensive and precise mapping of paddy rice areas.
Although the sample expansions could offer the benefits of data capacities for classification. The visual screening was still inevitable to guarantee the accuracy of the sample qualities. To improve the generality of the expansion, further work could focus on automatic sample verification with the help of artificial intelligence.

5.1.3. Image Composite Generation

To generate image composites for the classification process, we employed the median strategy, which is more relevant to our study’s objectives compared to other statistical measures such as the mean, max, or min. The median, as a measure of central tendency, is effective in mitigating the impact of abnormal values. These anomalies are common in remote sensing data due to factors such as atmospheric disturbances, sensor errors, and spectral irregularities. By using median composites, we can ensure that the typical conditions of each phenological stage are represented, thus accurately capturing the variations in the indices.
Research has long focused on the correlation between spectral indices and phenological features to extract paddy rice and map its distribution in specific areas. However, previous studies have relied on one or two phenological characteristics with spectral indices, rather than considering the entire life-cycle of paddy rice [10,24]. Depending heavily on just one or two signals can make the process vulnerable to noise and cause inaccuracies.
In this study, we included Sentinel-1 SAR data as part of our classification input. As a radar satellite, Sentinel-1 SAR data ensures data availability because it is not affected by atmospheric or cloud contamination. This approach could complement the use of optical remote sensing data alone, which can be affected by cloud contamination or data gaps [13].
PFBPM derived the phenological cycle of paddy rice using real paddy rice samples and analyzed the variations in relevant spectral indices throughout the rice life-cycle. By incorporating two or three features for each phenological stage, our results proved to be robust against external noise. This multi-stage approach, combined with the use of SAR data, enhances the accuracy and reliability of our paddy rice mapping.

5.1.4. One-Class Classifier

In classifier selection, we opted for the one-class Support Vector Machine (OCSVM) rather than multi-class classifiers. The OCSVM is particularly strong in anomaly detection, making it suitable for identifying rice fields within diverse landscapes. Unlike traditional multi-class classifiers, the OCSVM is trained exclusively on the target class (paddy rice) without needing refined distinctions between non-rice samples. By focusing solely on the spectral characteristics of paddy rice, the OCSVM operates more efficiently. Additionally, multi-class classifiers may exhibit bias towards more dominant or well-represented classes in the training data, potentially leading to the less accurate identification of less-represented target classes such as paddy rice [46]. Therefore, the application of a one-class classifier for target extraction has great potential due to reduced resource requirements in training preparation. The feasibility of OCSVM has been demonstrated in many previous studies [16,18,46].
Moreover, with a well-defined and distinct rice field class, the classifier can effectively create a decision boundary around the target class in the feature space, enabling the accurate identification of paddy rice fields amidst complex adjacent land cover types, such as paths and small houses. Recently, deep learning methods have been widely used in classification tasks and have achieved great outcomes. However, they are rarely applied to paddy rice mapping due to the significant computational and processing resources required for large amounts of remote sensing imagery [17].

6. Extensive Implications and Uncertainty Analysis

This study introduces an accurate paddy rice mapping product for the Anhui region in China. Comparisons with governmental statistical data and other validation approaches indicates that the algorithm has achieved significant success in mapping results. This remote sensing-based approach is expected to be beneficial in the development of the agricultural industry. Anhui, as one of the main paddy rice planting areas in China, requires the accurate mapping and timely monitoring of rice plants for ensuring safe food production [51]. However, traditional statistical approaches require significant labor and financial investments [8]. The PFBPM addresses these challenges by dividing the paddy rice life-cycle into segments, maximizing the function of each representative indicator.
Beyond the immediate application of mapping paddy rice, the PFBPM offers several avenues for future research and operational improvements. Initially, by providing high-resolution, accurate maps of paddy rice distribution, the method can significantly contribute to precision agriculture practices. It enables better management of resources like water and fertilizers, the precise application of farm chemicals, and optimized harvest timings, all of which can lead to increased agricultural efficiency and sustainability. Moreover, the detailed phenological data verified and spatial distribution of paddy rice planting area through this method can improve crop yield prediction models by providing timely information on crop development stages, which are closely linked to yield outcomes. This integration can lead to better forecasting and decision-making processes at both the farm and policy levels.
Despite the considerable advancements in our mapping product, certain limitations remain. Firstly, the phenological stages in PFBPM were derived from local ground-truth samples, which may compromise the product’s generality. Variations in phenology are due to differences in climate and cultivation practices across regions, such as discrepancies in the starting and ending dates of various phenological phases [18,36]. To mitigate this, generating datasets for different regions to validate accurate phenological patterns specific to each area is a direction for future research. Moreover, while the expansion of our sample base helps to augment valuable data, reliance on manual verification could potentially limit the product’s applicability. Future studies should explore the reliability of samples verified by AI in conjunction with very high-resolution (VHR) images. Additionally, this study utilizes Sentinel imagery from various times; given the different climatic conditions and atmospheric circumstances, relative radiometric calibration may further enhance classification accuracy [38]. The PFBPM currently relies on per-pixel analysis and predominantly incorporates spectral features of the pixels, excluding the surrounding geospatial context. This limitation often introduces noise, consequently reducing classification accuracy. Future research could benefit from incorporating object-based image analysis techniques to address and mitigate these issues [52]. Regarding the classifier, efforts are underway to apply deep learning approaches to paddy rice classification by transforming raw remote sensing imagery into information tensors, despite challenges posed by limited computational capabilities and storage constraints. We anticipate that our ongoing studies will yield valuable insights.

7. Conclusions

This paper proposes a systematic approach to mapping paddy rice, termed PFBPM. It utilized Hybrid Sentinel 1/2 time-series data as its reference. The methodology encompasses the following procedures: (1) three distinct phenological phases are derived from ground-truth samples, (2) phenological-based trusted samples are expanded automatically, (3) representative spectral indices and polarized Sentinel-1 data are assigned to each phase, and (4) median image composites are generated for further classification using a one-class SVM to produce the paddy rice mapping results.
The results were validated against statistical yearbook data and subjected to a classification accuracy assessment. In the confusion matrix validation with ground-truth samples, the PFBPM achieved 92% overall accuracy in provincial level and more than 90% in the major rice production regions. Moreover, compared annually with the record in the statistical yearbook, the proposed algorithm achieved errors less than 10% in most rice production areas. When compared annually with the statistical record, the proposed algorithm has showed great correlation. Finally, when compared with existing 10 m rice-mapping approach, the PFBPM demonstrated clearer details and greater accuracy with values of R 2 = 0.991 and slope = 1.08 in a prefecture-level statistical comparison with a counterpart. PFBPM exhibited considerable effectiveness in the Anhui region, fulfilling the expected purpose. We believe that this approach has potential applicability to other regions, provided relevant phenological information is available. Additionally, we plan to apply the PFBPM in the Yangtze River Delta to further optimize its performance. We anticipate that this algorithm will significantly contribute to the integration of artificial intelligence and agriculture, enhancing the efficiency and accuracy of agricultural mapping and monitoring.

Author Contributions

Conceptualization, X.L. and H.H.; Methodology, Z.W., X.S., X.L., F.X. and H.Y.; Software, Z.W. and Y.W. (Yuxuan Wang); Validation, Z.W., X.S. and Y.W. (Yichen Wei); Formal analysis, F.X. and R.T.; Investigation, H.Y.; Writing—original draft, Z.W.; Writing—review & editing, Z.W., X.S., X.L., F.X., H.H., R.T., H.Y., Y.W. (Yuxuan Wang) and Y.W. (Yichen Wei). All authors have read and agreed to the published version of the manuscript.

Funding

This research was funded by Aerospace Science and Technology Innovation Application Research Project: No. E23Y0H555S1; Aviation Science and Technology Innovation Application Research Project: 62502510201; Key Laboratory Project of Chinese Academy of Sciences, No. E33Y0HB42P1; China High-resolution Earth Observation System (CHEOS): 30-Y20A010-9007-17/18; China Center for Resource Satellite Data and Applications Project: HFWZ2020080302.

Data Availability Statement

Data are contained within the article.

Conflicts of Interest

The authors declare no conflicts of interest.

References

  1. Kamaluddin, A.; Ala, A.; Ali, M.S.S.; Salman, D. The adaptation of rice paddy farmers towards climate change. Am.-Eurasian J. Agric. Environ. Sci. 2012, 12, 967–972. [Google Scholar]
  2. Nishimura, S.; Yonemura, S.; Sawamoto, T.; Shirato, Y.; Akiyama, H.; Sudo, S.; Yagi, K. Effect of land use change from paddy rice cultivation to upland crop cultivation on soil carbon budget of a cropland in Japan. Agric. Ecosyst. Environ. 2008, 125, 9–20. [Google Scholar] [CrossRef]
  3. Muthayya, S.; Sugimoto, J.D.; Montgomery, S.; Maberly, G.F. An overview of global rice production, supply, trade, and consumption. Ann. N. Y. Acad. Sci. 2014, 1324, 7–14. [Google Scholar] [CrossRef]
  4. Fairhurst, T.; Dobermann, A. Rice in the global food supply. World 2002, 5, 3–6. [Google Scholar]
  5. Epule, E.T.; Peng, C.; Mafany, N.M. Methane emissions from paddy rice fields: Strategies towards achieving a win-win sustainability scenario between rice production and methane emission reduction. J. Sustain. Dev. 2011, 4, 188. [Google Scholar] [CrossRef]
  6. Xiao, X.; He, L.; Salas, W.; Li, C.; Moore Iii, B.; Zhao, R.; Frolking, S.; Boles, S. Quantitative relationships between field-measured leaf area index and vegetation index derived from VEGETATION images for paddy rice fields. Int. J. Remote. Sens. 2002, 23, 3595–3604. [Google Scholar] [CrossRef]
  7. Wei, J.; Cui, Y.; Luo, W.; Luo, Y. Mapping paddy rice distribution and cropping intensity in China from 2014 to 2019 with landsat images, effective flood signals, and google earth engine. Remote Sens. 2022, 14, 759. [Google Scholar] [CrossRef]
  8. Han, J.; Zhang, Z.; Luo, Y.; Cao, J.; Zhang, L.; Cheng, F.; Zhuang, H.; Zhang, J.; Tao, F. NESEA-Rice10: High-resolution annual paddy rice maps for Northeast and Southeast Asia from 2017 to 2019. Earth Syst. Sci. Data 2021, 13, 5969–5986. [Google Scholar] [CrossRef]
  9. Qiu, B.; Li, W.; Tang, Z.; Chen, C.; Qi, W. Mapping paddy rice areas based on vegetation phenology and surface moisture conditions. Ecol. Indic. 2015, 56, 79–86. [Google Scholar] [CrossRef]
  10. Zhou, Y.; Xiao, X.; Qin, Y.; Dong, J.; Zhang, G.; Kou, W.; Jin, C.; Wang, J.; Li, X. Mapping paddy rice planting area in rice-wetland coexistent areas through analysis of Landsat 8 OLI and MODIS images. Int. J. Appl. Earth Obs. Geoinf. 2016, 46, 1–12. [Google Scholar] [CrossRef]
  11. Huang, X.; Liu, J.; Zhu, W.; Atzberger, C.; Liu, Q. The optimal threshold and vegetation index time series for retrieving crop phenology based on a modified dynamic threshold method. Remote Sens. 2019, 11, 2725. [Google Scholar] [CrossRef]
  12. Yang, H.; Pan, B.; Li, N.; Wang, W.; Zhang, J.; Zhang, X. A systematic method for spatio-temporal phenology estimation of paddy rice using time series Sentinel-1 images. Remote Sens. Environ. 2021, 259, 112394. [Google Scholar] [CrossRef]
  13. Singha, M.; Dong, J.; Sarmah, S.; You, N.; Zhou, Y.; Zhang, G.; Doughty, R.; Xiao, X. Identifying floods and flood-affected paddy rice fields in Bangladesh based on Sentinel-1 imagery and Google Earth Engine. ISPRS J. Photogramm. Remote Sens. 2020, 166, 278–293. [Google Scholar] [CrossRef]
  14. Torbick, N.; Chowdhury, D.; Salas, W.; Qi, J. Monitoring rice agriculture across myanmar using time series Sentinel-1 assisted by Landsat-8 and PALSAR-2. Remote Sens. 2017, 9, 119. [Google Scholar] [CrossRef]
  15. Cai, Y.; Lin, H.; Zhang, M. Mapping paddy rice by the object-based random forest method using time series Sentinel-1/Sentinel-2 data. Adv. Space Res. 2019, 64, 2233–2244. [Google Scholar] [CrossRef]
  16. Clauss, K.; Yan, H.; Kuenzer, C. Mapping paddy rice in China in 2002, 2005, 2010 and 2014 with MODIS time series. Remote Sens. 2016, 8, 434. [Google Scholar] [CrossRef]
  17. Zhang, M.; Lin, H.; Wang, G.; Sun, H.; Fu, J. Mapping paddy rice using a convolutional neural network (CNN) with Landsat 8 datasets in the Dongting Lake Area, China. Remote Sens. 2018, 10, 1840. [Google Scholar] [CrossRef]
  18. Ni, R.; Tian, J.; Li, X.; Yin, D.; Li, J.; Gong, H.; Zhang, J.; Zhu, L.; Wu, D. An enhanced pixel-based phenological feature for accurate paddy rice mapping with Sentinel-2 imagery in Google Earth Engine. ISPRS J. Photogramm. Remote. Sens. 2021, 178, 282–296. [Google Scholar] [CrossRef]
  19. Zhang, W.; Liu, H.; Wu, W.; Zhan, L.; Wei, J. Mapping rice paddy based on machine learning with Sentinel-2 multi-temporal data: Model comparison and transferability. Remote Sens. 2020, 12, 1620. [Google Scholar] [CrossRef]
  20. Zhang, C.; Zhang, H.; Tian, S. Phenology-assisted supervised paddy rice mapping with the Landsat imagery on Google Earth Engine: Experiments in Heilongjiang Province of China from 1990 to 2020. Comput. Electron. Agric. 2023, 212, 108105. [Google Scholar] [CrossRef]
  21. Google. GEE Database:Sentinel-1. 2024. Available online: https://developers.google.com/earth-engine/datasets/catalog/COPERNICUS_S1_GRD (accessed on 10 July 2024).
  22. Google. GEE Database:Sentinel-2. 2024. Available online: https://developers.google.com/earth-engine/datasets/catalog/sentinel-2 (accessed on 10 July 2024).
  23. Karra, K.; Kontgis, C.; Statman-Weil, Z.; Mazzariello, J.C.; Mathis, M.; Brumby, S.P. Global land use/land cover with Sentinel 2 and deep learning. In Proceedings of the 2021 IEEE International Geoscience and Remote Sensing Symposium IGARSS, Brussels, Belgium, 11–16 July 2021; pp. 4704–4707. [Google Scholar]
  24. Xiao, X.; Boles, S.; Liu, J.; Zhuang, D.; Frolking, S.; Li, C.; Salas, W.; Moore, B., III. Mapping paddy rice agriculture in southern China using multi-temporal MODIS images. Remote Sens. Environ. 2005, 95, 480–492. [Google Scholar] [CrossRef]
  25. Liu, J.; Li, L.; Huang, X.; Liu, Y.; Li, T. Mapping paddy rice in Jiangsu Province, China, based on phenological parameters and a decision tree model. Front. Earth Sci. 2019, 13, 111–123. [Google Scholar] [CrossRef]
  26. Tian, H.; Wu, M.; Wang, L.; Niu, Z. Mapping early, middle and late rice extent using sentinel-1A and Landsat-8 data in the poyang lake plain, China. Sensors 2018, 18, 185. [Google Scholar] [CrossRef] [PubMed]
  27. Sukmono, A.; Nugraha, A.L.; Firdaus, H.S. Integration of Leaf Water Content Index (LWCI) and Enhanced Vegetation Index (EVI) for Stress Detection of Rice Plant Using Landsat 8 Satellitte Imagery. KnE Eng. 2019, 398–408. [Google Scholar] [CrossRef]
  28. Sitokonstantinou, V.; Koukos, A.; Drivas, T.; Kontoes, C.; Papoutsis, I.; Karathanassi, V. A scalable machine learning pipeline for paddy rice classification using multi-temporal sentinel data. Remote Sens. 2021, 13, 1769. [Google Scholar] [CrossRef]
  29. Merzlyak, M.N.; Gitelson, A.A.; Chivkunova, O.B.; Rakitin, V.Y. Non-destructive optical detection of pigment changes during leaf senescence and fruit ripening. Physiol. Plant. 1999, 106, 135–141. [Google Scholar] [CrossRef]
  30. Gitelson, A.A.; Gritz, Y.; Merzlyak, M.N. Relationships between leaf chlorophyll content and spectral reflectance and algorithms for non-destructive chlorophyll assessment in higher plant leaves. J. Plant Physiol. 2003, 160, 271–282. [Google Scholar] [CrossRef] [PubMed]
  31. Saadat, M.; Hasanlou, M.; Homayouni, S. Rice crop mapping using Sentinel-1 time series images (Case study: Mazandaran, Iran). Int. Arch. Photogramm. Remote Sens. Spat. Inf. Sci. 2019, 42, 897–904. [Google Scholar] [CrossRef]
  32. Mohite, J.; Sawant, S.; Kumar, A.; Prajapati, M.; Pusapati, S.; Singh, D.; Pappula, S. Operational near real time rice area mapping using multi-temporal sentinel-1 sar observations. Int. Arch. Photogramm. Remote Sens. Spat. Inf. Sci. 2018, 42, 433–438. [Google Scholar] [CrossRef]
  33. Bazzi, H.; Baghdadi, N.; El Hajj, M.; Zribi, M.; Minh, D.H.T.; Ndikumana, E.; Courault, D.; Belhouchette, H. Mapping paddy rice using Sentinel-1 SAR time series in Camargue, France. Remote Sens. 2019, 11, 887. [Google Scholar] [CrossRef]
  34. Tucker, C.J. Red and photographic infrared linear combinations for monitoring vegetation. Remote Sens. Environ. 1979, 8, 127–150. [Google Scholar] [CrossRef]
  35. Huete, A.; Didan, K.; Miura, T.; Rodriguez, E.P.; Gao, X.; Ferreira, L.G. Overview of the radiometric and biophysical performance of the MODIS vegetation indices. Remote Sens. Environ. 2002, 83, 195–213. [Google Scholar] [CrossRef]
  36. Wang, L.; Chen, S.; Peng, Z.; Huang, J.; Wang, C.; Jiang, H.; Zheng, Q.; Li, D. Phenology effects on physically based estimation of paddy rice canopy traits from UAV hyperspectral imagery. Remote Sens. 2021, 13, 1792. [Google Scholar] [CrossRef]
  37. Nguyen, D.B.; Wagner, W. European rice cropland mapping with Sentinel-1 data: The Mediterranean region case study. Water 2017, 9, 392. [Google Scholar] [CrossRef]
  38. Dong, J.; Xiao, X.; Menarguez, M.A.; Zhang, G.; Qin, Y.; Thau, D.; Biradar, C.; Moore, B., III. Mapping paddy rice planting area in northeastern Asia with Landsat 8 images, phenology-based algorithm and Google Earth Engine. Remote Sens. Environ. 2016, 185, 142–154. [Google Scholar] [CrossRef]
  39. Ning, J.; Liu, J.; Kuang, W.; Xu, X.; Zhang, S.; Yan, C.; Li, R.; Wu, S.; Hu, Y.; Du, G.; et al. Spatiotemporal patterns and characteristics of land-use change in China during 2010–2015. J. Geogr. Sci. 2018, 28, 547–562. [Google Scholar] [CrossRef]
  40. Zekoll, V.; Main-Knorn, M.; Alonso, K.; Louis, J.; Frantz, D.; Richter, R.; Pflug, B. Comparison of masking algorithms for sentinel-2 imagery. Remote Sens. 2021, 13, 137. [Google Scholar] [CrossRef]
  41. Coluzzi, R.; Imbrenda, V.; Lanfredi, M.; Simoniello, T. A first assessment of the Sentinel-2 Level 1-C cloud mask product to support informed surface analyses. Remote Sens. Environ. 2018, 217, 426–443. [Google Scholar] [CrossRef]
  42. Xin, F.; Xiao, X.; Dong, J.; Zhang, G.; Zhang, Y.; Wu, X.; Li, X.; Zou, Z.; Ma, J.; Du, G.; et al. Large increases of paddy rice area, gross primary production, and grain production in Northeast China during 2000–2017. Sci. Total Environ. 2020, 711, 135183. [Google Scholar] [CrossRef]
  43. Rossi, C.; Erten, E. Paddy-rice monitoring using TanDEM-X. IEEE Trans. Geosci. Remote Sens. 2014, 53, 900–910. [Google Scholar] [CrossRef]
  44. Wang, Q.; Tenhunen, J.D. Vegetation mapping with multitemporal NDVI in North Eastern China transect (NECT). Int. J. Appl. Earth Obs. Geoinf. 2004, 6, 17–31. [Google Scholar] [CrossRef]
  45. Fensholt, R.; Horion, S.; Tagesson, T.; Ehammer, A.; Ivits, E.; Rasmussen, K. Global-scale mapping of changes in ecosystem functioning from earth observation-based trends in total and recurrent vegetation. Glob. Ecol. Biogeogr. 2015, 24, 1003–1017. [Google Scholar] [CrossRef]
  46. Xu, X.; Ji, X.; Jiang, J.; Yao, X.; Tian, Y.; Zhu, Y.; Cao, W.; Cao, Q.; Yang, H.; Shi, Z.; et al. Evaluation of one-class support vector classification for mapping the paddy rice planting area in Jiangsu Province of China from Landsat 8 OLI imagery. Remote Sens. 2018, 10, 546. [Google Scholar] [CrossRef]
  47. Zhang, X.; Yang, G.; Xu, X.; Yao, X.; Zheng, H.; Zhu, Y.; Cao, W.; Cheng, T. An assessment of Planet satellite imagery for county-wide mapping of rice planting areas in Jiangsu Province, China with one-class classification approaches. Int. J. Remote Sens. 2021, 42, 7610–7635. [Google Scholar] [CrossRef]
  48. Xiao, Y.; Wang, H.; Xu, W. Parameter selection of Gaussian kernel for one-class SVM. IEEE Trans. Cybern. 2014, 45, 941–953. [Google Scholar] [CrossRef] [PubMed]
  49. López-Andreu, F.J.; Erena, M.; Dominguez-Gómez, J.A.; López-Morales, J.A. Sentinel-2 images and machine learning as tool for monitoring of the common agricultural policy: Calasparra rice as a case study. Agronomy 2021, 11, 621. [Google Scholar] [CrossRef]
  50. Park, S.; Im, J.; Park, S.; Yoo, C.; Han, H.; Rhee, J. Classification and mapping of paddy rice by combining Landsat and SAR time series data. Remote Sens. 2018, 10, 447. [Google Scholar] [CrossRef]
  51. Zhang, G.; Xiao, X.; Biradar, C.M.; Dong, J.; Qin, Y.; Menarguez, M.A.; Zhou, Y.; Zhang, Y.; Jin, C.; Wang, J.; et al. Spatiotemporal patterns of paddy rice croplands in China and India from 2000 to 2015. Sci. Total Environ. 2017, 579, 82–92. [Google Scholar] [CrossRef] [PubMed]
  52. Zhang, M.; Lin, H. Object-based rice mapping using time-series and phenological data. Adv. Space Res. 2019, 63, 190–202. [Google Scholar] [CrossRef]
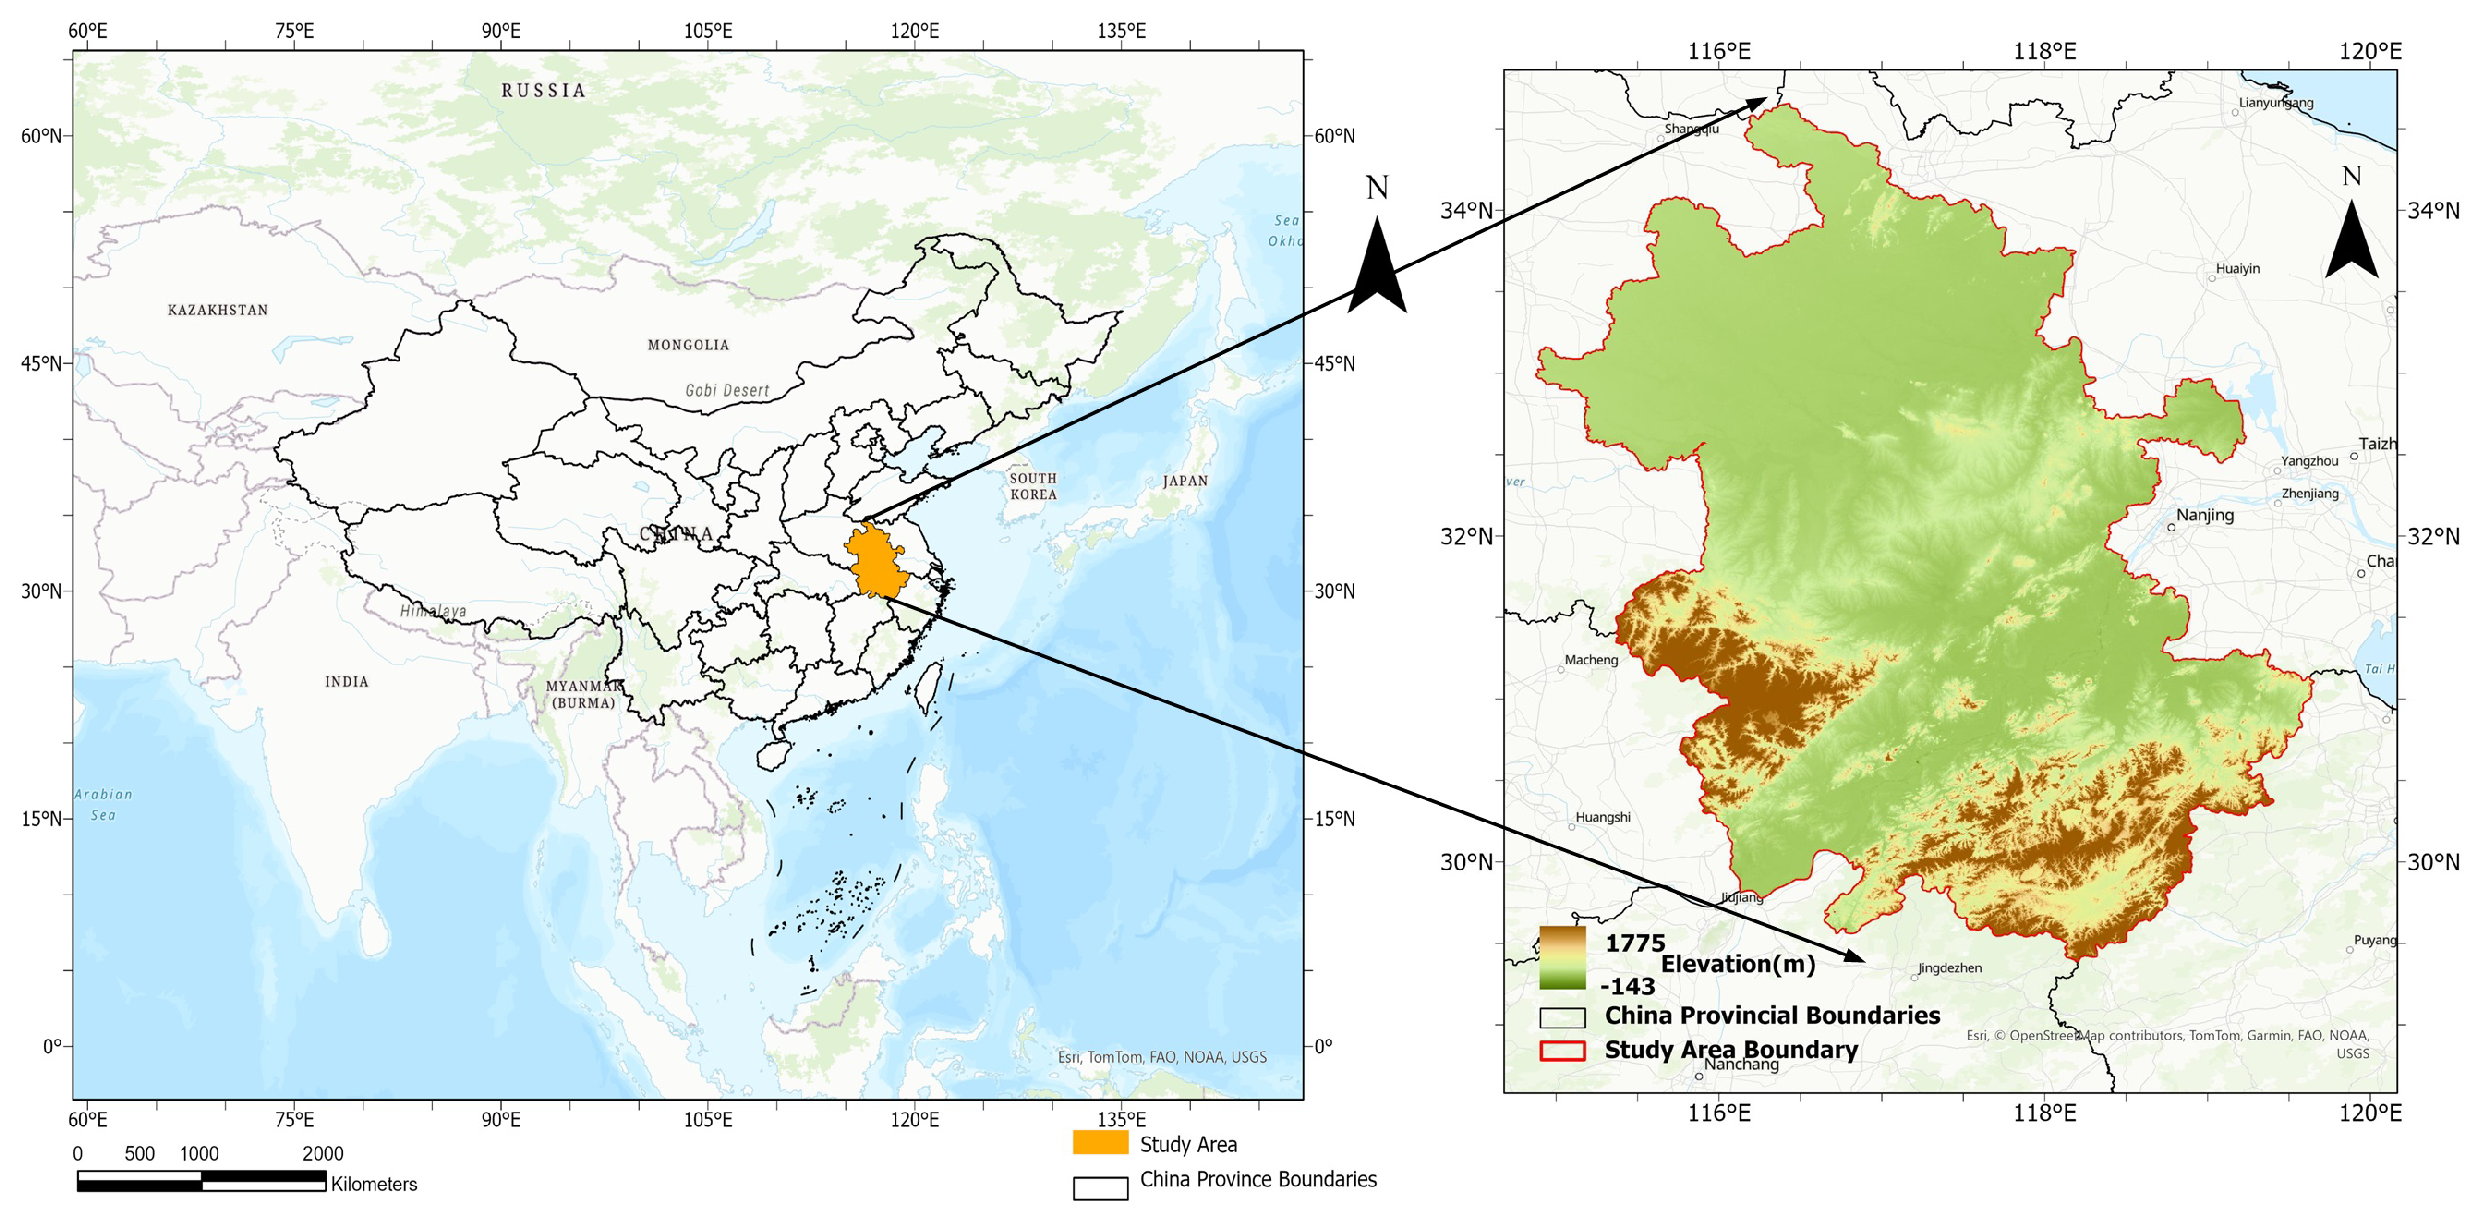
Figure 1. The study area of Anhui.
Agriculture 14 01282 g001
Figure 2. Observation counts of Sentinel-2 in the study area, 2021–2023.
Agriculture 14 01282 g002
Figure 3. Ground survey and visually expanded samples for phenology detection.
Agriculture 14 01282 g003
Figure 4. Flowchart of the PFBPM.
Agriculture 14 01282 g004
Figure 5. The phenological variation in and associated crop calendar of paddy rice in the study area.
Agriculture 14 01282 g005
Figure 6. Annual variation in phenological indices in the study area: EVI, GCVI, LSWI, NDVI, PSRI, and VV/VH.
Agriculture 14 01282 g006
Figure 7. Spatial distribution of paddy rice sampling pixels in the study area.
Agriculture 14 01282 g007
Figure 8. Spatial distribution of paddy rice in Anhui region, China.
Agriculture 14 01282 g008
Figure 9. Detailed mapping results at three paddy rice planting sites.
Agriculture 14 01282 g009
Figure 10. Prefecture-level area comparisons of rice planting area between the PFBPM and statistical records.
Agriculture 14 01282 g010
Figure 11. Comparison between the PFBPM and another existing 10 m product. The three different columns represent Sentinel-2 image (three-channel composite:NIR, red, green), PFBPM rice map and NE-SEA rice map, respectively. The red rectangle regions showcase the difference between PFBPM and NE-SEA rice map.
Agriculture 14 01282 g011
Figure 12. Comparison of paddy rice planting area between the PFBPM, NESEA-Rice10 and statistical record in 2022.
Agriculture 14 01282 g012
Figure 13. Rice candidates maps of selective sampling approaches and PFBPM.
Agriculture 14 01282 g013
Table 2. Selected indices and specific DOY for three phenological stages.
Phenology StageIndicesDay of Year (DOY)
The flooding periodLSWI, NDVI160–210
The growing periodEVI, GCVI, VV/VH220–280
The ripening periodPSRI, NDVI280–320
Table 3. Parameters for calculating confusion matrix metrics.
MetricFormula
User’s Accuracy (UA) UA i = X i i j X i j × 100 %
Producer’s Accuracy (PA) PA i = X i i j X j i × 100 %
Overall Accuracy (OA) OA = i X i i i j X i j × 100 %
Kappa Coefficient (KC) KC = P o P e 1 P e
P o = OA and P e = 1 N 2 i ( j X i j ) ( j X j i )
Table 4. Confusion matrix results for Anhui province and the top three rice-yield cities.
Region RiceOthersUA (%)PA (%)OA (%)Kappa (%)
AnhuiRice842082691949286
Others457811794909286
HefeiRice21519695939489
Others143186292959389
Lu’anRice152410494989385
Others133129291929385
Chu’zhouRice183514193939386
Others127154992929386
Table 5. Comparison of paddy rice planting area between the PFBPM and official statistics (2022) in the unit of ×104 ha.
CityHefeiBengbuHuainanChuzhouLuanWuhuXuanchengAnqing
Yearbook Record35.5210.4128.0441.1340.6016.0415.4623.97
Mapping Result38.5311.1330.1544.6943.2817.8317.1126.04
Errors(%)8.476.927.528.666.6011.2710.678.64
Disclaimer/Publisher’s Note: The statements, opinions and data contained in all publications are solely those of the individual author(s) and contributor(s) and not of MDPI and/or the editor(s). MDPI and/or the editor(s) disclaim responsibility for any injury to people or property resulting from any ideas, methods, instructions or products referred to in the content.