Article

Crop Density and Sowing Timing Effect on Tan Spot Occurrence in Spring Wheat

by
Agnė Lukošiūtė-Stasiukonienė
1,
Mohammad Almogdad
1,*,
Roma Semaškienė
1 and
Viktorija Mačiulytė
2
1
Department of Plant Pathology and Protection, Institute of Agriculture, Lithuanian Research Centre for Agriculture and Forestry, Instituto al. 1, Akademija, LT-58344 Kėdainiai distr., Lithuania
2
Institute of Geosciences, Vilnius University, LT-03225 Vilnius, Lithuania
*
Author to whom correspondence should be addressed.
Agriculture 2024, 14(8), 1284; https://doi.org/10.3390/agriculture14081284
Submission received: 30 June 2024 / Revised: 30 July 2024 / Accepted: 2 August 2024 / Published: 3 August 2024
(This article belongs to the Section Crop Protection, Diseases, Pests and Weeds)

Abstract

:
Tan spot (Pyrenophora tritici-repentis) is presenting a persistent challenge to the plant health and yield of all wheat-growing regions. This research is focused on tan spot disease management in spring wheat when planted at three distinct times and with three different seeding rates without the use of fungicides. Across all years, higher seed rates (500 and 600 seeds per m2) generally resulted in lower tan spot intensity compared to the lower seed rate (400 seeds per m2). Significant differences in tan spot intensity were observed across seed rates at all sowing times. In 2021, the percentage of the AUDPC was significantly higher in the late sowing time (324.58%), with about a 2-fold difference compared with the early (167.48%) and optimal sowing time (191.80%). This suggests that delayed sowing significantly exacerbates disease occurrence. The combined effect of sowing time and year on the AUDPC was notably significant. The AUDPC of the tan spot in all seed rates was the highest in the late sowing time plots in comparison to the ideal and initial planting dates plots. Our results demonstrate how important seed rate and sowing timing are in determining the degree of tan spot in spring wheat. Growing crop methods may be improved by taking these elements into account to better control tan spots. More agricultural methods and environmental aspects should be investigated in future studies to create all-encompassing tan spot control plans.

1. Introduction

Spring wheat (Triticum aestivum L.) stands as a cornerstone crop in global agriculture, supplying essential carbohydrates and proteins to vast populations worldwide [1]. Despite its agricultural significance, the productivity and quality of spring wheat can be substantially compromised by various biotic stresses, with fungal diseases such as tan spot (Pyrenophora tritici-repentis), presenting a persistent challenge to crop health and yield [2]. Tan spot, characterized by necrotic lesions on wheat leaves, is a prevalent foliar disease that occurs in virtually all wheat-growing regions [3]. The economic impact of tan spots is considerable, as it can lead to significant yield reductions and decrease the quality of harvested grain [4]. Tan spot is a serious foliar disease that can result in yield losses of up to 50% during widespread seasons [5]. The disease often results in yield decreases of 6% to 24% for grains [6]. The significant influence on wheat yield highlights the necessity of putting into practice efficient management techniques to reduce losses and preserve the sustainability of wheat cultivation. The severity of tan spot outbreaks fluctuates annually, influenced by a multitude of factors encompassing microenvironment changes or plant growth stages [7]. Among the array of factors influencing tan spot intensity, plant density and sowing timing emerge as pivotal agronomic determinants. Plant density, defined as the number of plants per unit area, influences the spatial arrangement of plants and subsequently affects light interception, air circulation, and microclimate within the canopy [8]. Employing management techniques like optimizing planting time can reduce the impact of environmental stressors during crucial stages of growth [9], thus influencing disease susceptibility. In wheat, there is a complex interaction between crop density and infectious disease occurrence, with varying effects observed depending on the specific pathogen and environmental conditions. The microclimate within the canopy of wheat, integral to the growth and development of crops, mirrors fluctuations in the crop’s microenvironment [10]. Higher plant densities can promote canopy closure, creating a more favorable microenvironment for pathogen proliferation by enhancing humidity and reducing air circulation, thus exacerbating disease pressure [11]. One of the more extensively studied instances involves how canopy structure can decrease disease occurrences in beans and corn [12]. Similarly, sowing timing exerts a profound influence on disease dynamics in wheat. Early sowing can coincide with crop growth stages and conditions that are favorable for disease development. The timing of planting had a notable impact on disease indexes in wheat [13].
Over the past few years, wheat foliar diseases have become more severe due to a combination of factors, including the implementation of sustainable farming practices, the cultivation of vulnerable wheat varieties, and the heightened prevalence of pathogens [14]. Changes in the climate, which is the cause of the severe disease outbreak, may cause a significant decrease in the nutritional value of grain as evidenced by the emergence of red and black smudge characteristics [15,16], as well as in core weight, the grains number per head, and the overall biomass [17,18]. The overwinters in wheat residue in the field, agricultural techniques, a single culture, vulnerable varieties, and ecological farming are also linked to a rise in yield decreases [19,20]. As compared to other agricultural crops, environmental variables (lack of rainfall, poor soil, rising temperatures, and rising CO2) may decrease the production of wheat [21] as well as biological factors like diseases [22]. Cultivar mixes, rotated crops, and each stage of tillage are examples of field or agricultural management techniques that are effective in preventing disease-related harm [23]. Nevertheless, their ongoing usage may be hindered by the associated financial drawbacks, particularly for tiny farms, but extensive fungicide treatments are not sustainable and might lead to a high rate of disease development [24]. Sustainable control of pests is one of the primary aims of the European Commission, which is achieved when all farmers and other expert pesticide consumers follow Integrated Pest Management (IPM), a sustainable pest management system that emphasizes alternative methods of control over chemical ones and places a strong emphasis on pest prevention, using chemical pesticides only as necessary [25].
In this study, we focused on the interaction of interplay between plant density, sowing timing, and tan spot disease occurrence in spring wheat. Through a comprehensive examination of different combinations of plant densities and sowing dates, we aim to elucidate the complex dynamics underlying disease development and provide valuable insights into agronomic practices that can mitigate tan spot damage and enhance wheat productivity in diverse agroecosystems.

2. Materials and Methods

2.1. Experimental Design

Multifactor field experiments were carried out at the experimental fields of the Institute of Agriculture of Lithuanian Research Centre for Agriculture and Forestry in 2021–2023 in the Kėdainiai district of central Lithuania. The trials were established in the spring wheat cv. ‘Flippen’. Spring wheat was planted following winter rape in 2021, after winter rye in 2022, and after winter wheat in 2023. Recommended agronomic practices were followed, including the application of fertilizer, insecticides, herbicides, and growth regulators but not including fungicides. Three seeding rates (400, 500, and 600 viable seeds m−2) and three sowing times, early, optimal, and late were tested. Early sowing is defined as before 20 April, optimal sowing is from 24 April to 4 May, and late sowing is from 8 to 19 May. Specifically, the sowing dates in 2021 were 15 April for early sowing, 29 April for optimal sowing, and 12 May for late sowing. In 2022, the sowing dates were 13 April for early sowing, 29 April for optimal sowing, and 11 May for late sowing. For 2023, the sowing dates were 20 April for early sowing, 4 May for optimal sowing, and 19 May for late sowing. The sowing was carried out with the Wintersteiger (Vienna, Austria) plot drill. The experiment was laid out in a completely randomized design with four replications. The dimensions of the plot were 10 m × 1.5 m (15 m2), and the replicate spacing was 2 m. In addition, the plots were separated by a distance of 0.25 m.

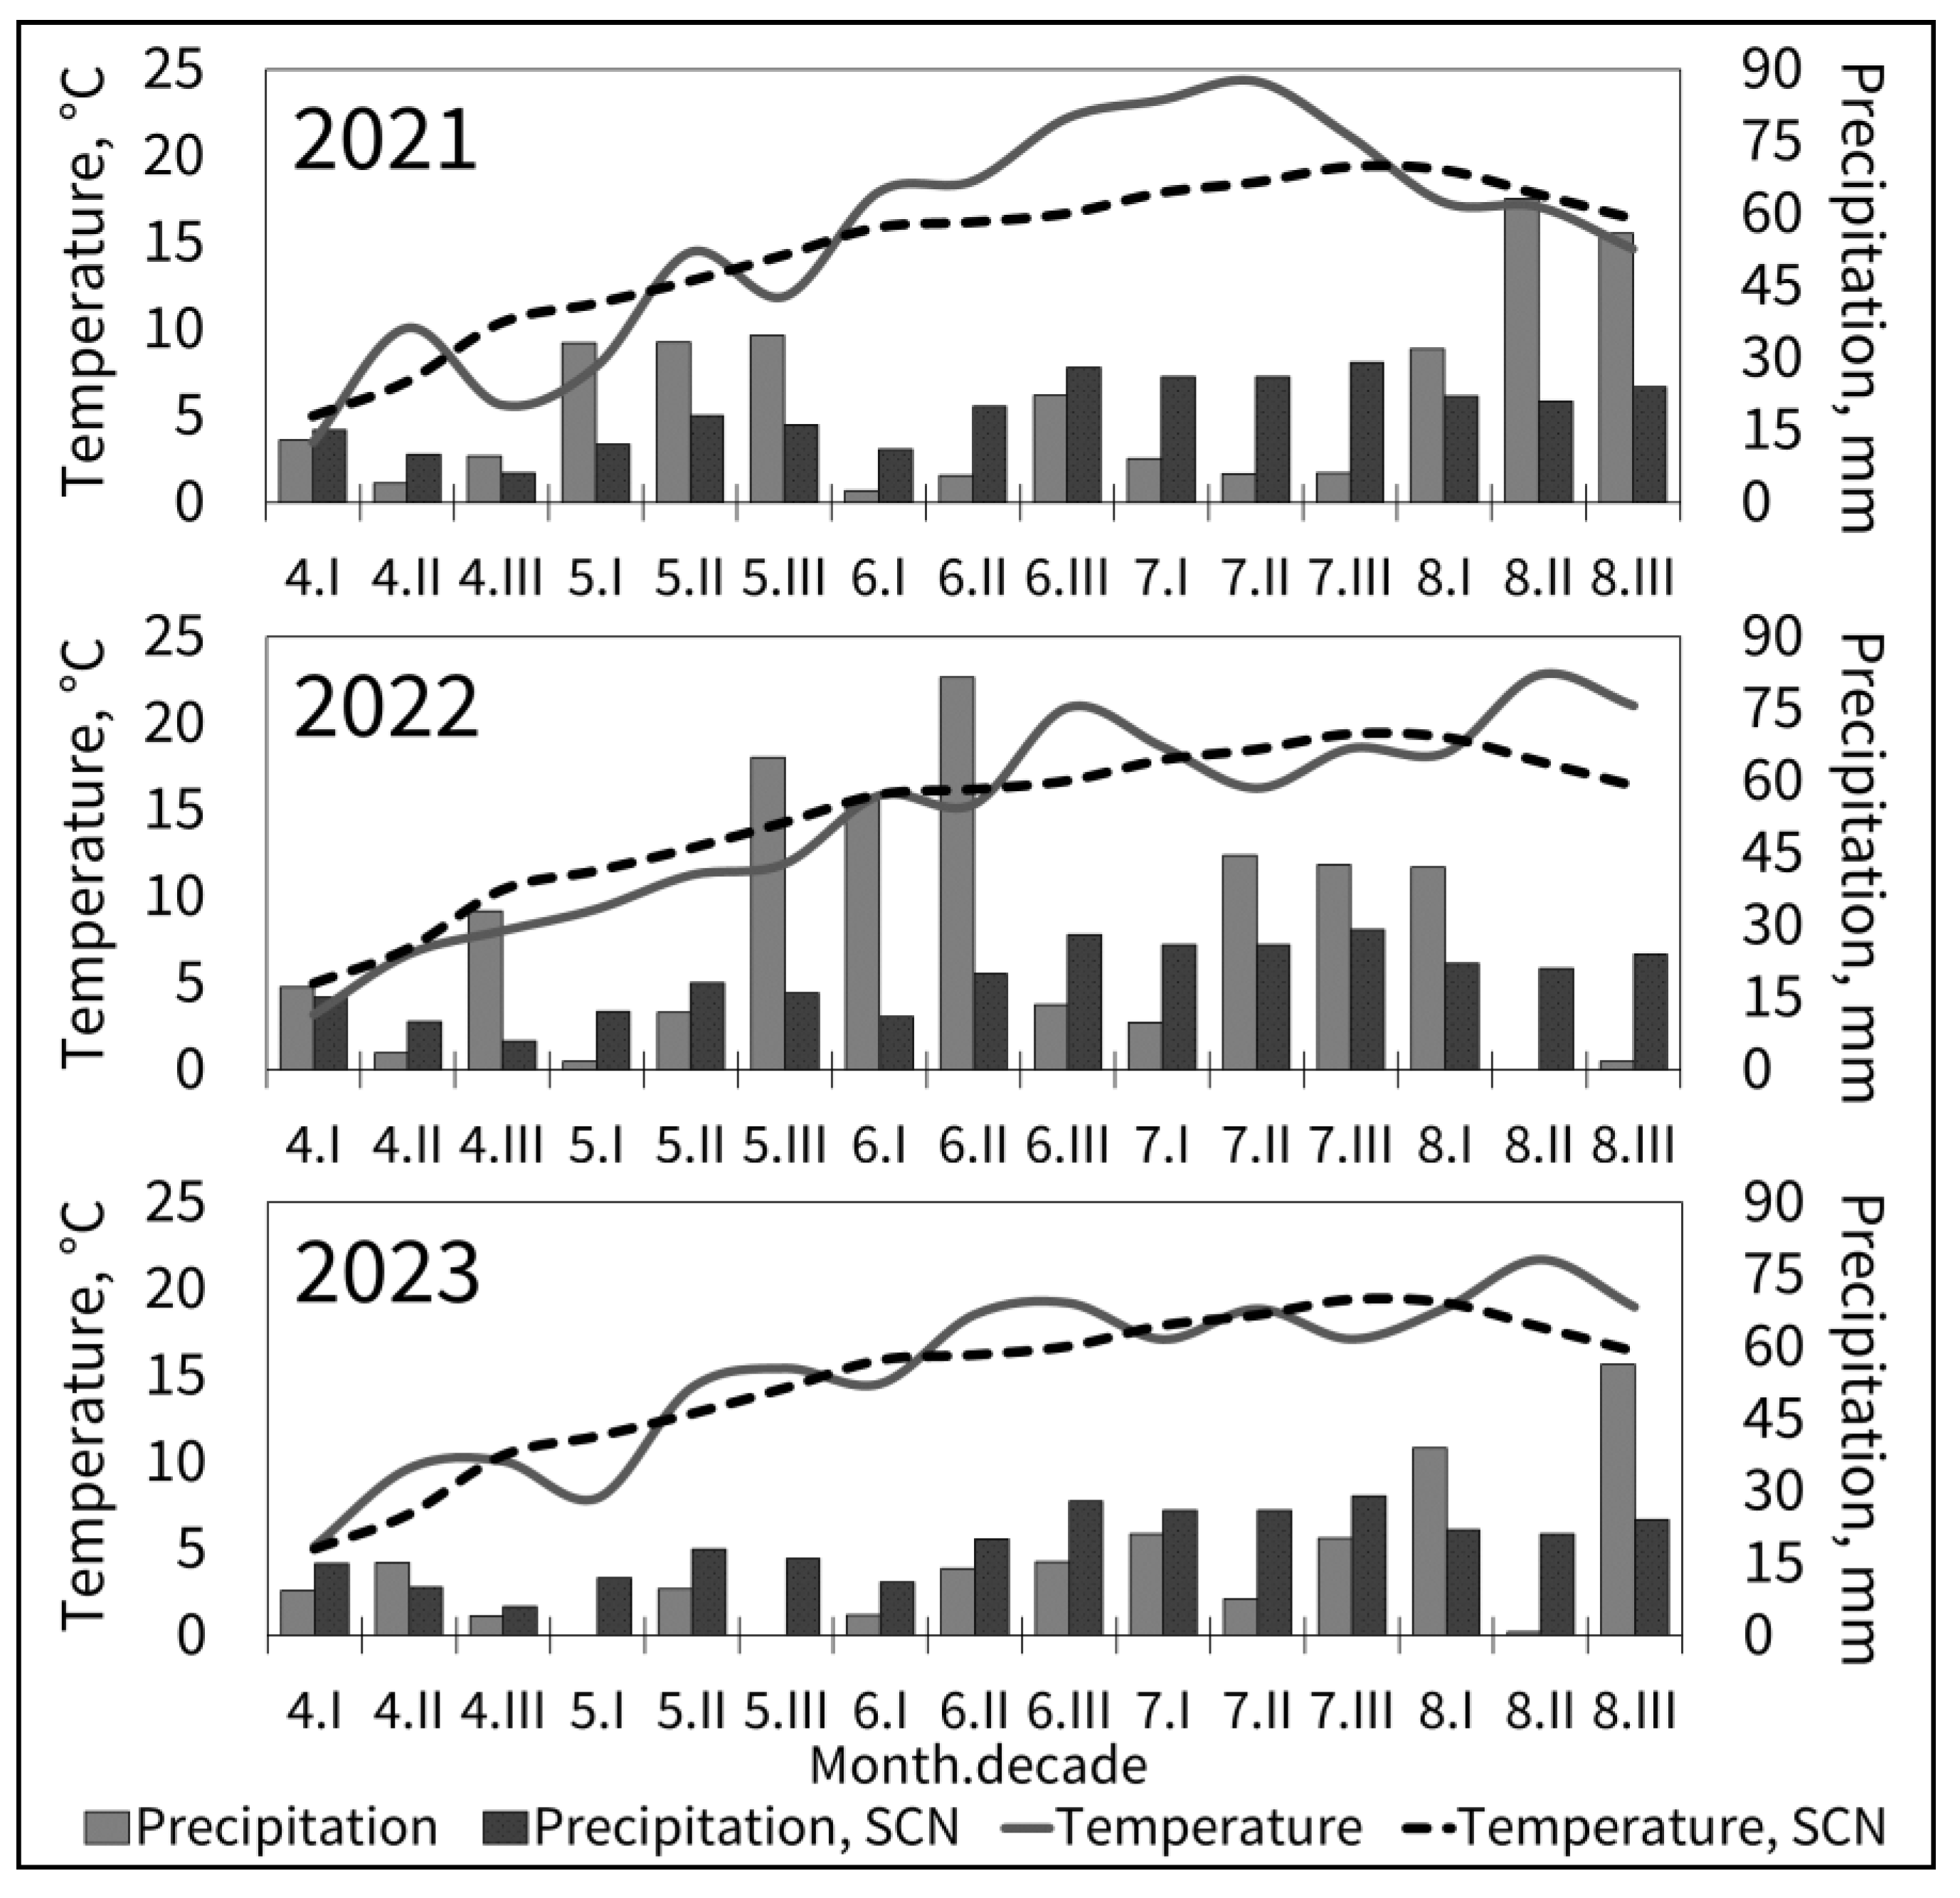
2.2. Meteorological Data

The Dotnuva weather station closest to the fields (at a distance of 2 km) provided the meteorological data. It belongs to the Lithuanian Hydrometeorological Service. Air temperature and precipitation in the growing season (from April to August) of 2021–2023 were recorded and compared to the standard climate norm (SCN) of the average of the years 1991–2020. Precipitation and temperature conditions were also evaluated between BBCH growth phases from one end to the beginning of the next. Figure 1 displays temperature and precipitation trends for the growth seasons of 2021, 2022, and 2023, compared to the 1991–2020 climate norm. From 1991 to 2020, the average annual air temperature was 7.5 °C, and annual precipitation was 566 mm, with July being the warmest and wettest month [26]. In 2021, the April–August temperature was 0.7 °C above average, and precipitation was 16% higher than the norm, though with uneven distribution. The last frost was recorded on 9 May. April and May were colder than usual, while June and July were significantly warmer. In 2022, temperatures were near normal, but precipitation was 49% above the norm, with July being particularly rainy. The last frost occurred on 24 May. In 2023, temperatures were 0.6 °C above average, and precipitation was 24% below normal. The frost season lasted until 6 June, causing delays in sowing and early droughts due to low precipitation in the early months.

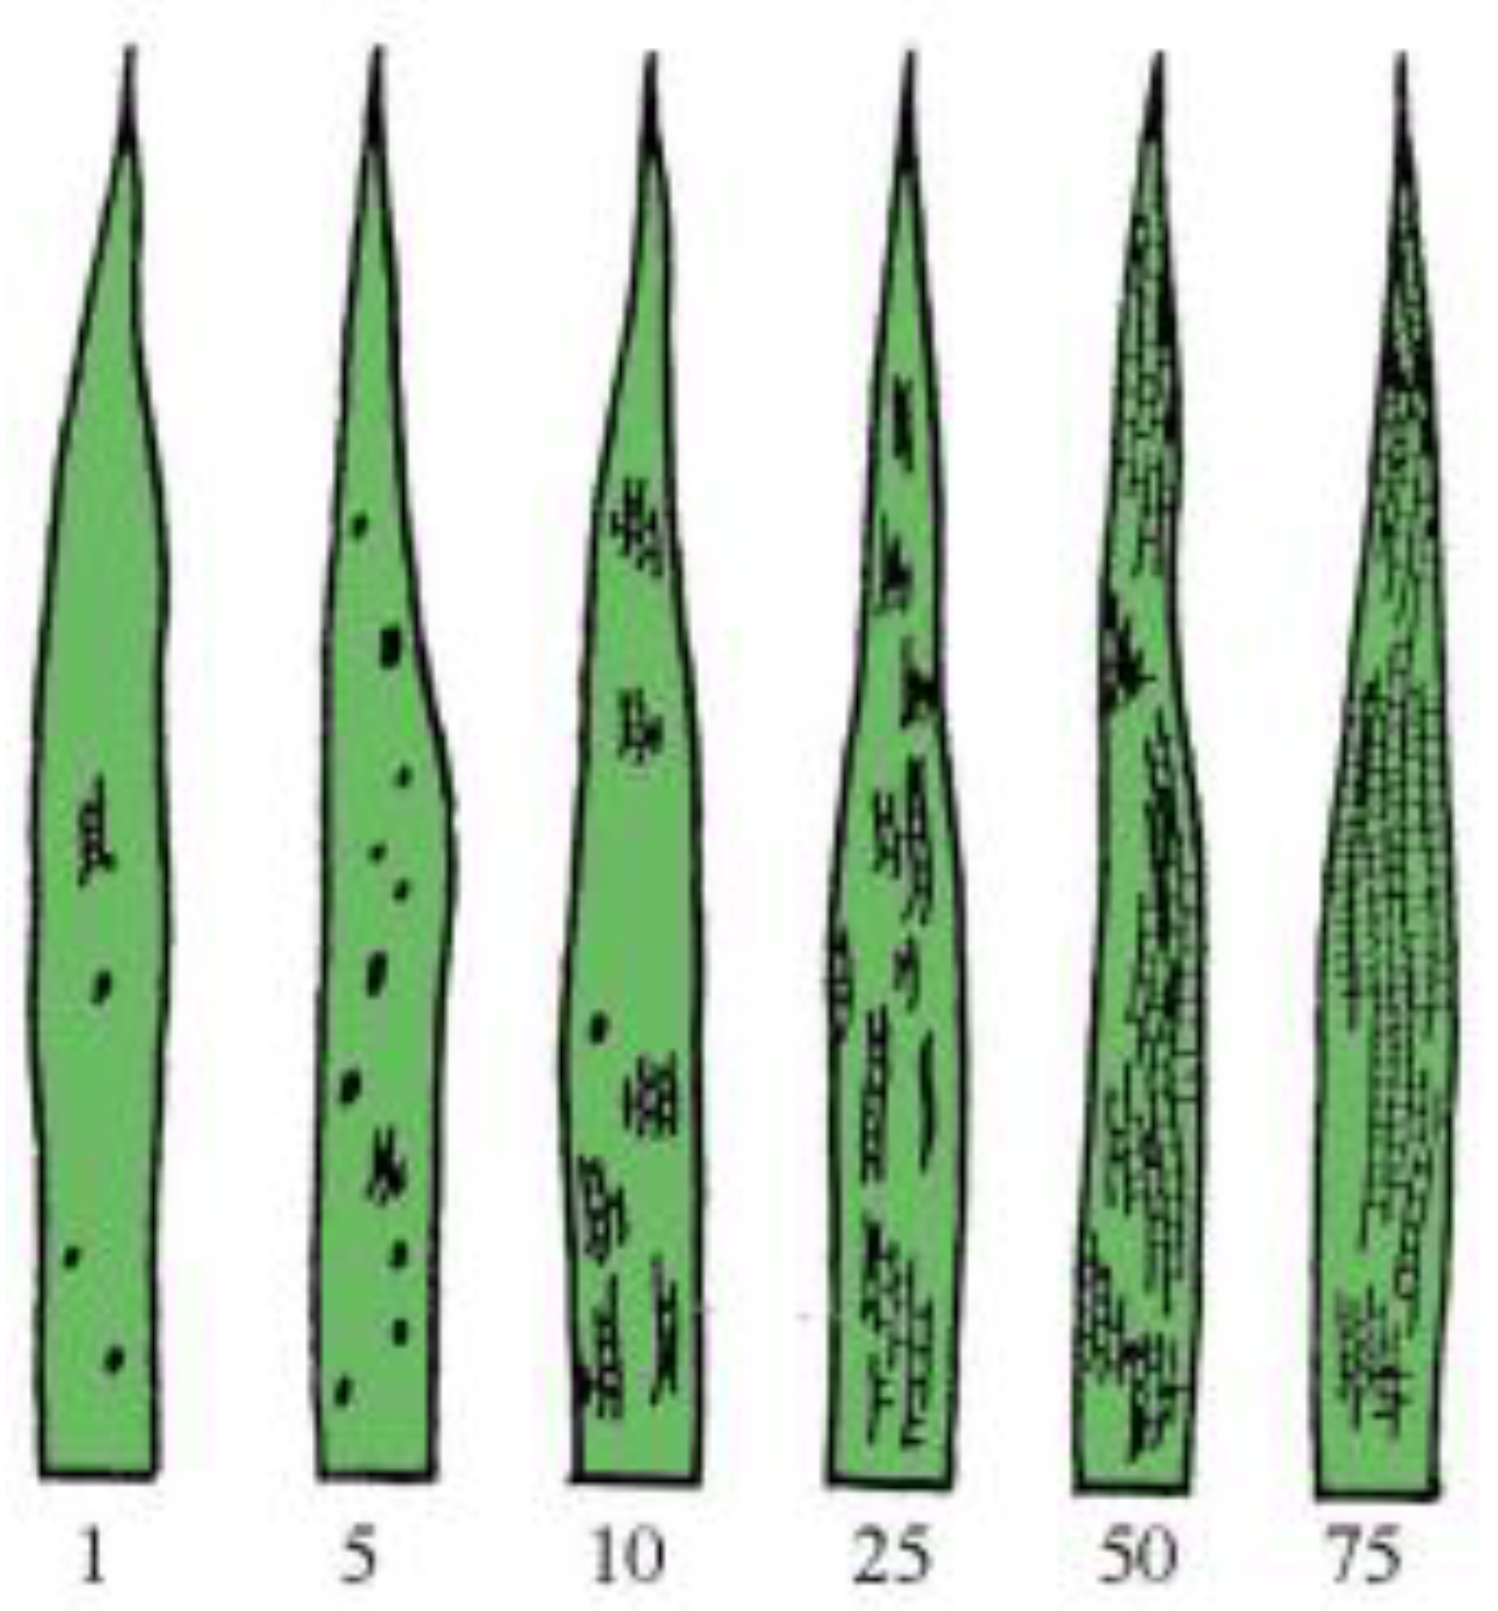
2.3. Severity of Tan Spot

The foliar disease inventory was carried out by inspecting the plants during the development phases (BBCH) from 31 to 32 (stem elongation beginning), from 37 (flag leaf just visible, still rolled) to 41 (early boot stage), from 59 (end of heading) to 65 (full flowering), and at 75 (medium milk) according to the methods described in the European and Mediterranean Plant Protection Organization (EPPO) standard (PP 1/26(4), 2012) [27]. Then, the averages of each sowing time and each seed rate were calculated. Table 1 shows the dates of each assessment in line with the growth stages, several days between sowing time and assessment, and the differences in days between the sowing timings. On all 10 chosen at random main tillers in each plot, the area of infected foliage was visually evaluated on every one of the green leaves and recorded separately as the mean for each leaf level according to the recommended scale (Figure 2). Disease severity was calculated according to the following formula presented by Dabkevičius and Gaurilčikienė [28]:
R = ( a × b ) N
where R—disease severity (affected leaf area) in %; (a × b)—the sum of the products of the percentage leaf area affected by the disease (a) and the number of affected leaves in the corresponding percentage group (b); and N—the total number of healthy and diseased leaves.
During each growing season, using a method developed by Simko and Piepho [30], the area under the disease progress curve (AUDPC) was employed to measure the tan spot disease. This regular approach made it possible to quantify disease severity consistently and accurately over the growing seasons, which allowed for insightful treatment comparisons. The formula for AUDPC is as follows:
A U D P C = i = 1 n 1 ( y i + y i + 1 ) / 2 × ( t i + 1 t i )
where n—the whole number of examinations; yi—the severity degree of disease (%) at the ith examination; and ti—days at the ith examination.

2.4. Statistical Analysis

SAS statistical package 9.4 was used for collecting and statistically analyzing the row results (SAS Institute Inc., Cary, NC, USA). A mixed-effects model was used to analyze the data for the severity of tan spot disease. The year was treated as a random effect, and the seeding rate and planting time were fixed factors. The Kolmogorov–Smirnov Test was used to check the data for homogeneity before analysis. The disease severity data were analyzed by applying Duncan’s multiple range test with a significance level set at p ≤ 0.05 for each sowing period or seed rate separately.

3. Results

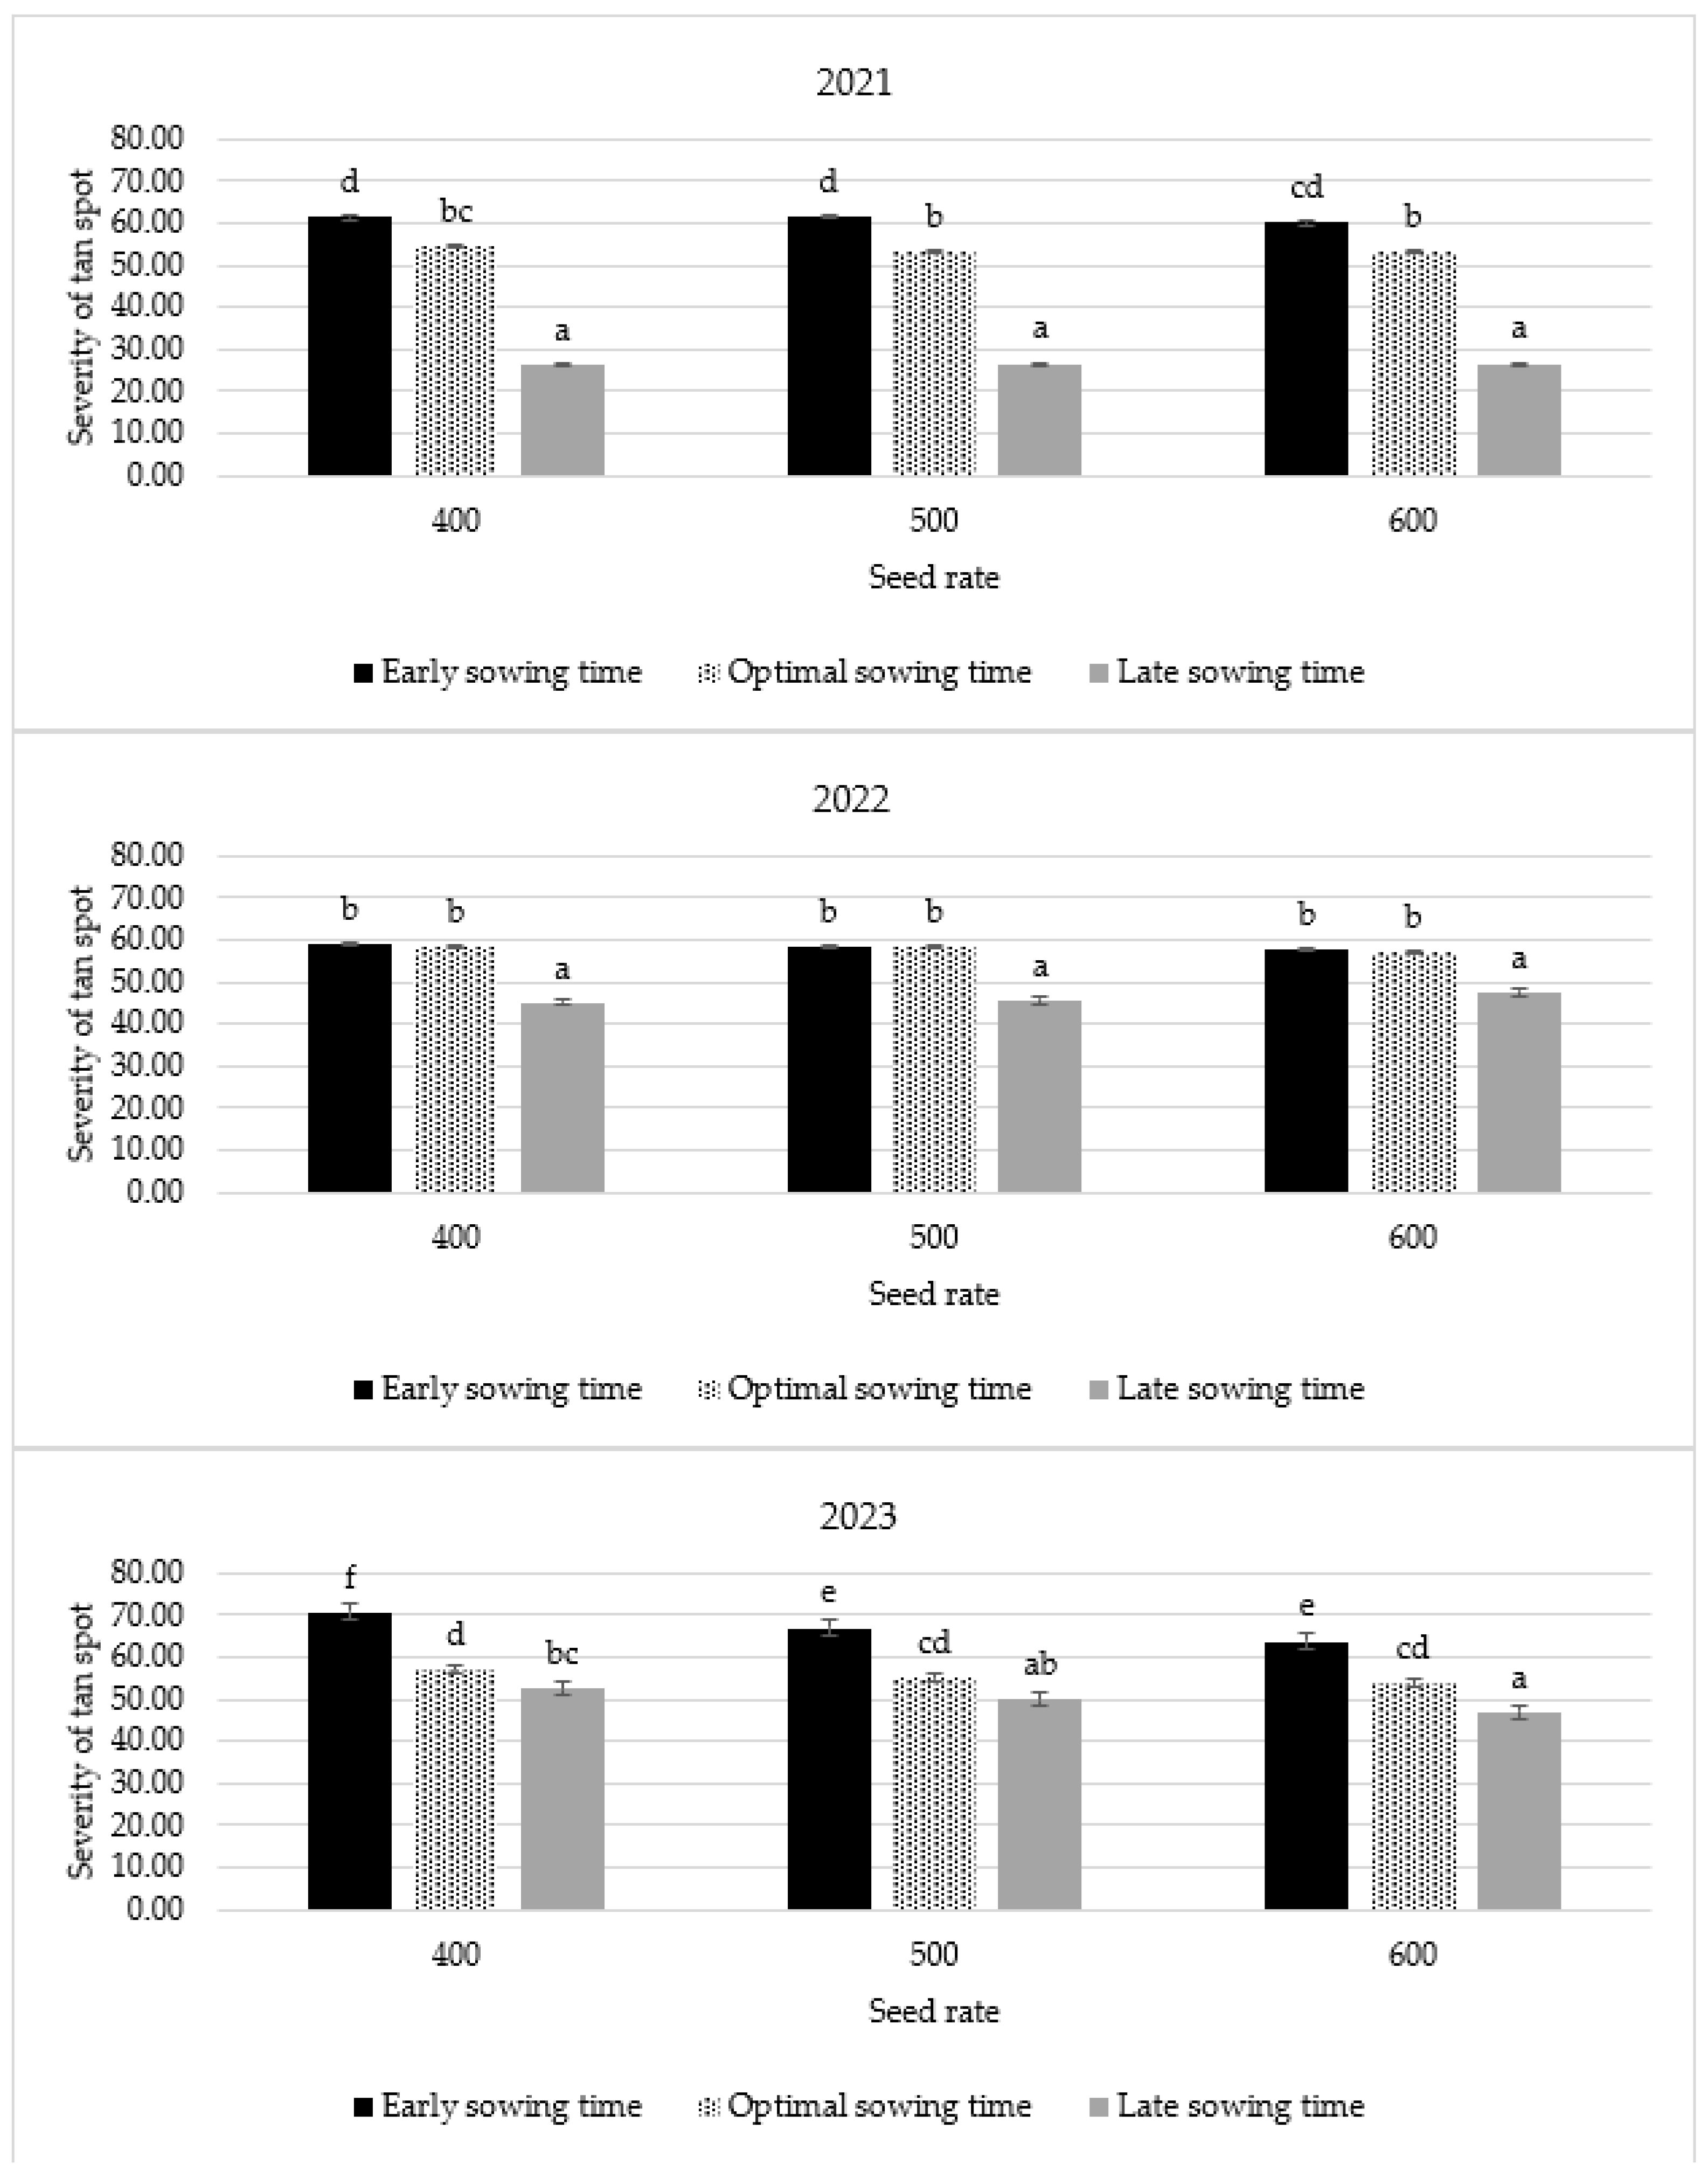
3.1. The Effect of Planting Time and Seeding Density on Tan Spot Intensity

Figure 3 presents the analysis of planting time and seeding density effects on tan spot intensity in spring wheat from 2021 to 2023. In 2021, tan spot intensity varied from 26.25 to 61.65. Late sowing consistently resulted in the lowest intensity across different seed rates, while early sowing showed the highest severity. Differences between early and optimal sowing times were not significant at any seed rate. In 2022, tan spot intensity was highest for initial and ideal planting times for all seeding densities, ranging from 57.19 to 58.75. Late sowing showed significantly lower intensity. There were no notable differences among the various seeding densities at any sowing time. It was observed that in 2022, the severity of tan spots is very similar in the early and optimal sowing fields, whereas in other years, it is lower in the optimal sowing fields (Figure 3). Additionally, the values for the latest sowing in 2022 are higher than in 2021 and 2023. This may be related to the very rainy start of the growing season in 2022 for the early and optimal sowings. From sowing until the BBCH 37–41 phase, precipitation was 83–223% higher than the SCN (Table 2), although the temperature was close to normal or up to 1.8 °C lower than normal. In other years, precipitation and temperature during the early and optimal sowing times did not exhibit such extremes. In 2023, tan spot intensity ranged from 46.88 to 70.63, with higher rates observed in optimal and late sowing times. This indicates a potential disadvantage of early sowing. For early sowing, a seed rate of 600 seeds per m2 resulted in lower tan spot intensity. Across all years, higher seed rates (500 and 600 seeds per m2) generally resulted in lower tan spot intensity compared to the lower seed rate (400 seeds per m2). Significant differences in tan spot intensity were observed across seed rates at all sowing times.

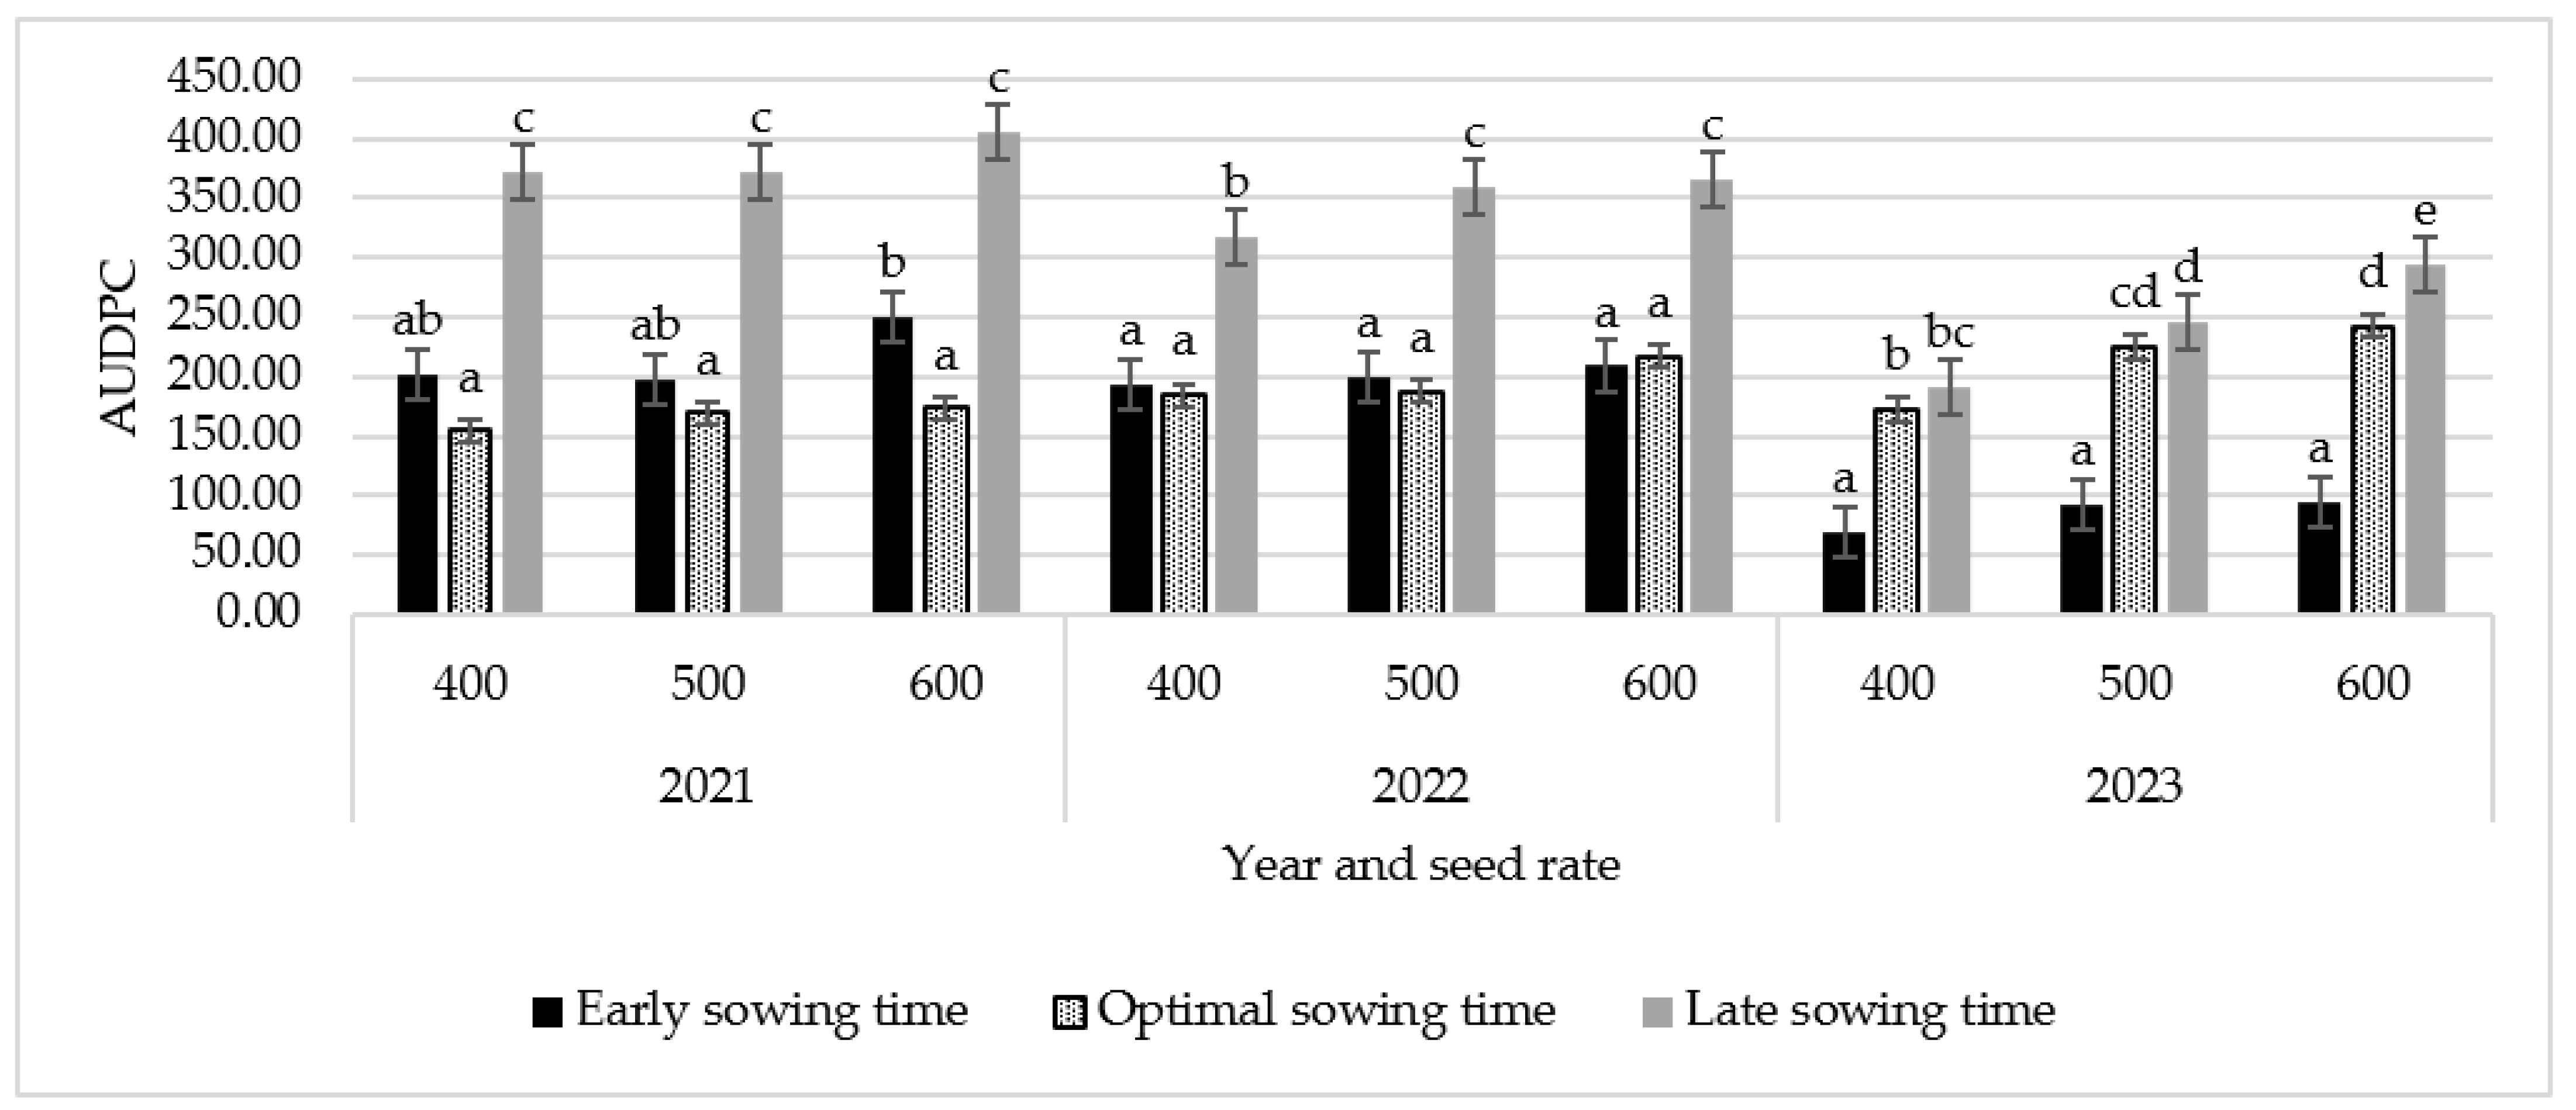
3.2. Evaluation of the Area under the Disease Progress Curve (AUDPC) in Relation to Planting Times and Seed Rates during Each Year of Study

Figure 4 illustrates the epidemic development of the foliar pathogen (tan spot). The field experiments revealed that the later planting time for all seed densities recorded a high tan spot intensity which was significant (p ≤ 0.05) and differed statistically from the other two earlier sowing times investigated in this research. The AUDPC values between the growing seasons of 2021 and 2022 revealed a similar trend. In 2021, the AUDPC values were significantly higher for late sowing times than for early times, with 600 plants per m2, and the early sowing time had a higher AUDPC level than the optimal sowing time. The air temperature in 2021 during BBCH 37–41 growth phases was exceptionally high in the latest sowing and exceeded normal values by as much as 8 °C, while precipitation was nearly a third higher than the SCN. Therefore, such high AUDPC values in the latest sowing may be related to the very warm and wet conditions, whereas fields sown earlier experienced much drier and cooler conditions during the mentioned growth phase (Table 2). Particularly warm conditions were observed from the second half of June to the second half of July (Figure 2). Conversely, in 2022, AUDPC values showed no significant differences between the earliest and ideal planting times for all seeding rates. Due to the very rainy period from the third decade of May to the second decade of June (Figure 2), the fields of all three sowing times experienced significantly wetter conditions than usual, although the temperature did not show extreme deviations from the average for that period. Evaluating the meteorological conditions across all sowing fields, there were no particularly large air temperature anomalies throughout the season (except for the optimal sowing field during the BBCH 59–65 phase which was 5.8 °C warmer than usual). The particularly wet periods may be associated with the higher AUDPC value in 2022 compared to 2023. By and large, in 2023, the AUDPC values were lower than in 2021 and 2022. The AUDPC at the early sowing time was significantly lower than optimal and late sowing times at sowing date three within all seed rates. On average, 2023 exhibited the smallest anomalies in air temperature, particularly in precipitation. Throughout the growing season, spanning from late March to mid-August, only one decade had precipitation exceeding the norm (Figure 2), and this was observed only at the end of the growth season. Although the lack of rainfall led to a severe drought from 15 to 28 June, the moisture deficit and relatively minor temperature extremes may be related to the lowest AUDPC values across the three analyzed years (Figure 4). It appears that the record-long frosts in 2023 did not affect plant condition and the AUDPC values, even though the sowing that year was the latest across all three fields compared to 2021 and 2022 (Table 1). It can be assumed that, despite the risk of drought impact, drier years may be less favorable for disease spread.
Although the time differences (in days) between sowing dates in different years are not significant (the difference between the first and second sowing times was 14–16 days, between the second and third sowing times was 12–15 days, and between the first and third sowing times was 27–29 days in different years). This could be attributed to the late sowing, which occurred between 11 and 19 May over the three years of the study, as warmer conditions prevailed during this time compared to usual conditions. Table 2 presents a detailed analysis of precipitation levels, with variance from the long-term mean as well as the mean air temperature fluctuation across various development phases.

3.3. The Interactions between Year, Sowing Time, and Seed Rate

Table 3 shows the impact of the season, seeding rate, and sowing date on the AUDPC. Our results reveal significant insights into how these factors interplay to affect the AUDPC. Specifically, in 2023, the AUDPC was lower than that in 2021 and 2022 when averaged across sowing dates and seeding rates. This indicates a year-specific effect on disease progression, highlighting the importance of considering annual variations in disease management strategies. The percentage of AUDPC was significantly higher in the late sowing time (324.58%), with about a 2-fold difference compared with the early (167.48%) and optimal sowing times (191.80%). This suggests that delayed sowing significantly exacerbates disease occurrence, likely due to the extended exposure to disease conditions during the prolonged growing season. However, it is crucial to note that the effect of the highest seed rate (600 plants per m2) resulted in an increase in the percentage of the AUDPC (250.13%) compared to the lower seed rates, and the differences were not significant. The combined effect of sowing time and year on the AUDPC was notably significant. For instance, in 2021 the AUDPC for late sowing reached 450.16%, which was considerably higher compared to other sowing times. This finding underscores the critical impact of sowing time on disease severity and its interaction with specific years. In contrast, the interaction between seed rate and year did not exhibit a significant effect on the AUDPC, suggesting that while sowing time is a more influential factor, seed density alone has a more stable influence across years. These findings demonstrate the complex interaction between plant density, sowing timing, and disease intensity. While late sowing may result in lower disease intensity in specific years, longer disease exposure times are generally linked to higher disease severity over time. As a result, even though early and ideal sowing dates typically reduce the risk of disease and produce better results, the ideal sowing date must be balanced with the requirement for enough spring wheat foliage for optimum grain output. Developing efficient management plans and maximizing crop yield and disease control require a sophisticated understanding of the relationships between sowing time, plant density, and disease occurrence.

4. Discussion

The study’s findings indicate that the severity of tan spot disease in this research was significantly influenced by the year and sowing timing. These results are in line with earlier studies that have shown the significant effects of seed rate [31], sowing time [32,33,34], and year [35] on the frequency of plant diseases. Variations in environmental factors, like temperature and rainfall patterns, can affect how well pathogens survive and the development of the disease, which is why tan spot severity varies from year to year in our study [36,37,38,39]. We found that the years marked by three distinct ten-day periods of extremely rainy weather during the growing season (2022) exhibited the highest disease prevalence. Conversely, the years with below-average precipitation and recorded drought (2023) showed the lowest disease spread. Early planting resulted in significantly higher disease severity than late and optimal sowing dates. That might be the result of prolonged exposure to environmental factors that encourage the spread of pathogens. Sohi et al. [40] have not supported similar findings, reporting that the disease severity increased with a delay in the sowing date [41], indicating that rust severity increased with a later planting date. According to Kumar et al. [42], barley did not have any disease during the early sowing crop, but the disease did surface during the late sowing crop.
In contrast to what we expected, there was very little effect of seed rate on the severity of tan spots, which is in disagreement with other research studies. According to Pande et al. [43], there was a significant variation in the intensity of rust and late leaf spots at higher crop densities compared to lower densities. Schaafsma et al. [31] discovered that fusarium head blight (FHB) in winter wheat was influenced by seeding rates. Unlike FHB, which can be influenced by high plant density through increased humidity and canopy closure, tan spot severity in our research did not show a consistent effect of seeding rate on the AUDPC across all years. It may be due to the different nature of the diseases and the specific dynamics associated with each pathogen. Overall, our study aligns with the notion that seeding rate can influence disease severity, but the effects are not always straightforward and can vary depending on the specific disease and context. According to Chang et al. [44], plant density and chickpea blight severity had a positive linear association. Jurke et al. [45] showed that canola’s incidence of the sclerotinia stem rot disease increased significantly with an increase in sowing rate. Although higher seed rates have been linked to greater disease severity in several crops, our findings showed that, within the range under investigation, seed rate variations could not significantly affect the development of tan spots given the current circumstances.
The differences in the AUDPC between variant sowing times and seed rates bring attention to the complicated relationship that exists between pathogen biology, crop growth stage, and meteorological conditions in the development of disease. Plants that are sown later tend to be in a more sensitive growth stage during the height of pathogen activity, which makes them more susceptible to being infected. This effect has been studied in several plant–pathogen relationships. The growth stage and environmental factors typically affect a plant’s sensitivity to infection [46,47]. A pathogen’s survival and development, as well as a host plant’s growth, can all be significantly impacted by environmental conditions. The same plant may become resistant to these changing environmental factors or completely sensitive to them, and the pathogen may become very slightly pathogenic or capable of causing quite serious damage [38]. Crops grown later in the growing season may be affected by unfavorable weather conditions, like higher humidity, which helps the growth and dissemination of diseases. Higher relative air humidity, according to Cheng et al. [48], enhances the activity of genes necessary for fatty acid (such as jasmonic acid) production and transduction. Those fatty acids play an essential role in plants’ defense mechanisms against pests and diseases [49]. Despite observed variations in 2021, the AUDPC levels did not significantly differ among the initial optimal sowing dates in 2022. This shows that variability in pathogen populations and environmental factors from year to year affects the dynamics of disease. Our findings are in line with Velásquez et al. [36] who reported that the pathogen reproduction process, pathogen growth, the severity of gene expression in plants, and the overwintering of inocula—which is essential for starting infections in upcoming growing seasons—all seem to be significantly impacted by environmental factors. Burdon et al. [50] found that the incidence and severity of disease in plants found in natural ecosystems and crops grown in agriculture are both being affected by variations in the climate. When the environmental conditions in 2023 became less favorable for the development of tan spots, the severity of the disease started to decline. Unfavorable weather patterns may be one of the causes contributing to the 2023 AUDPC values being lower than in other study years. This is consistent with the findings of Semaskiene et al. [51], who expected that the disease severity started to rise at the heading in both inoculated and non-inoculated plots in the year when the weather became more favorable for the development of tan spots compared to other years.

5. Conclusions

The study demonstrates that the sowing time of spring wheat significantly influences tan spot intensity and severity in wheat. Across the years of 2021 to 2023, late sowing consistently decreased tan spot intensity and increased the AUDPC values compared to early and optimal sowing times. However, it is crucial to acknowledge that spring wheat requires a prolonged vegetation period to achieve optimal grain yield. Therefore, while late sowing may reduce disease prevalence, it is not recommended as a general practice due to the potential negative impact on overall yield. Future research should focus on developing integrated disease management strategies that consider optimal sowing times and environmental conditions to balance disease control and yield optimization. The AUDPC of the tan spot in all seed rates was the highest in the late sowing time plots in comparison to the ideal and initial planting date plots. Considering the fluctuations in environmental factors such as temperature and precipitation during the year of the study, our results showed that different seeding rates did not significantly affect the development of tan spots. However, in 2022, when it was exceptionally rainy, more tan spots were recorded compared to dry years in all seeding rates and sowings times. Therefore, optimizing sowing times is essential for minimizing tan spot severity and improving crop health.

Author Contributions

Conceptualization, A.L.-S.; methodology, A.L.-S. and R.S.; formal analysis, M.A.; investigation, A.L.-S.; writing—original draft preparation, M.A., A.L.-S. and V.M.; writing—review and editing, R.S.; supervision, R.S. All authors have read and agreed to the published version of the manuscript.

Funding

Part of this research was supported by the long-term research program “Harmful Organ isms in Agro and Forest Ecosystems” implemented by the Lithuanian Research Centre for Agriculture and Forestry.

Institutional Review Board Statement

Not applicable.

Data Availability Statement

The data are contained within the article.

Acknowledgments

The authors express their gratitude to the technical team of the Department of Plant Pathology and Protection at the Institute of Agriculture, Lithuanian Research Centre for Agriculture and Forestry, for their valuable contributions to this research.

Conflicts of Interest

The authors declare no conflicts of interest.

References

  1. Grote, U.; Fasse, A.; Nguyen, T.T.; Erenstein, O. Food Security and the Dynamics of Wheat and Maize Value Chains in Africa and Asia. Front. Sustain. Food Syst. 2021, 4, 617009. [Google Scholar] [CrossRef]
  2. Jabran, M.; Ali, M.A.; Zahoor, A.; Muhae-Ud-Din, G.; Liu, T.; Chen, W.; Gao, L. Intelligent Reprogramming of Wheat for Enhancement of Fungal and Nematode Disease Resistance Using Advanced Molecular Techniques. Front. Plant Sci. 2023, 14, 1132699. [Google Scholar] [CrossRef]
  3. Kokhmetova, A.M.; Kovalenko, N.M.; Kumarbaeva, M.T. Pyrenophora tritici-Repentis Population structure in the Republic of Kazakhstan and identification of Wheat Germplasm Resistant to Tan Spot. Vavilov J. Genet. Breed. 2020, 24, 729. [Google Scholar] [CrossRef] [PubMed]
  4. Singh, J.; Chhabra, B.; Raza, A.; Yang, S.H.; Sandhu, K.S. Important Wheat Diseases in the US and Their Management in the 21st Century. Front. Plant Sci. 2022, 13, 1010191. [Google Scholar] [CrossRef] [PubMed]
  5. Kokhmetova, A.; Sehgal, D.; Ali, S.; Atishova, M.; Kumarbayeva, M.; Leonova, I.; Dreisigacker, S. Genome-wide association study of tan spot resistance in a hexaploid wheat collection from Kazakhstan. Front. Genet. 2021, 11, 581214. [Google Scholar] [CrossRef] [PubMed]
  6. Cook, M.J.; Edwards, J.; Rodoni, B.; McLean, M.S.; Santa, I.M.; Hollaway, G.J. Grain yield and quality losses caused by tan spot in wheat cultivars in Australia. PhytoFrontiers™ 2024, 4, 223–235. [Google Scholar] [CrossRef]
  7. Fernandez, M.R.; Clarke, J.M.; DePauw, R.M. The Effect of Plant Height on Tan Spot on Durum Wheat in Southern Saskatchewan. Crop Sci. 2002, 42, 159–165. [Google Scholar] [CrossRef] [PubMed]
  8. Murchie, E.H.; Burgess, A.J. Casting Light on the Architecture of Crop Yield. Crop Environ. 2022, 1, 74–85. [Google Scholar] [CrossRef]
  9. Lake, L.; Sadras, V.O. The Critical Period for Yield Determination in Chickpea (Cicer arietinum L.). Field Crops Res. 2014, 168, 1–7. [Google Scholar] [CrossRef]
  10. Zhang, F.; Zhang, D.; Li, L.; Zhang, Z.; Liang, X.; Wen, Q.; Chen, G.; Wu, Q.; Zhai, Y. Effect of Planting Density on Canopy Structure, Microenvironment, and Yields of Uniformly Sown Winter Wheat. Agronomy 2023, 13, 870. [Google Scholar] [CrossRef]
  11. Café-Filho, A.C.; Lopes, C.A.; Rossato, M.; Café-Filho, A.C.; Lopes, C.A.; Rossato, M. Management of Plant Disease Epidemics with Irrigation Practices; Ondrašek, G., Ed.; IntechOpen: London, UK, 2018; ISBN 978-1-78984-924-0. [Google Scholar]
  12. Ando, K.; Grumet, R.; Terpstra, K.; Kelly, J.D. Manipulation of Plant Architecture to Enhance Crop Disease Control. CAB Rev. Perspect. Agric. Vet. Sci. Nutr. Nat. Resour. 2007, 2, pagination. [Google Scholar] [CrossRef]
  13. Moreno, M.V.; Stenglein, S.A.; Perelló, A.E.; Moreno, M.V.; Stenglein, S.A.; Perelló, A.E. Pyrenophora tritici-Repentis, Causal Agent of Tan Spot: A Review of Intraspecific Genetic Diversity. Mol. Basis Plant Genet. Divers. 2012, 297–330. [Google Scholar] [CrossRef]
  14. Gurung, S.; Mamidi, S.; Bonman, J.M.; Xiong, M.; Brown-Guedira, G.; Adhikari, T.B. Genome-Wide Association Study Reveals Novel Quantitative Trait Loci Associated with Resistance to Multiple Leaf Spot Diseases of Spring Wheat. PLoS ONE 2014, 9, e108179. [Google Scholar] [CrossRef] [PubMed]
  15. Coelho, M.A.d.O.; Torres, G.A.M.; Cecon, P.R.; Santana, F.M. Sowing Date Reduces the Incidence of Wheat Blast Disease. Pesqui. Agropecuária Bras. 2016, 51, 631–637. [Google Scholar] [CrossRef]
  16. Lozano-Ramírez, N.; Dreisigacker, S.; Sansaloni, C.P.; He, X.; Islas, S.S.; Pérez-Rodríguez, P.; Carballo, A.C.; Diaz, C.N.; Kishii, M.; Singh, P.K. Genome-Wide Association Study for Resistance to Tan Spot in Synthetic Hexaploid Wheat. Plants 2022, 11, 433. [Google Scholar] [CrossRef] [PubMed]
  17. Fernandez, M.R.; Zentner, R.P.; McConkey, B.G.; Campbell, C.A. Effects of Crop Rotations and Fertilizer Management on Leaf Spotting Diseases of Spring Wheat in Southwestern Saskatchewan. Can. J. Plant Sci. 1998, 78, 489–496. [Google Scholar] [CrossRef]
  18. Singh, P.K.; Crossa, J.; Duveiller, E.; Singh, R.P.; Djurle, A. Association Mapping for Resistance to Tan Spot Induced by Pyrenophora tritici-Repentis Race 1 in CIMMYTs Historical Bread Wheat Set. Euphytica 2016, 207, 515–525. [Google Scholar] [CrossRef]
  19. Cotuna, O.; Paraschivu, M.; Paraschivu, A.M.; Sărățeanu, V. The Influence of Tillage, Crop Rotation and Residue Management on Tan Spot (Drechslera tritici Repentis Died. Shoemaker) in Winter Wheat. Res. J. Agric. Sci. 2015, 47, 13–21. [Google Scholar]
  20. Singh, P.K.; Singh, R.P.; Duveiller, E.; Mergoum, M.; Adhikari, T.B.; Elias, E.M. Genetics of Wheat-Pyrenophora tritici-Repentis Interactions. Euphytica 2010, 171, 1–13. [Google Scholar] [CrossRef]
  21. Kajla, M.; Yadav, V.K.; Khokhar, J.; Singh, S.; Chhokar, R.S.; Meena, R.P.; Sharma, R.K. Increase in Wheat Production through Management of Abiotic Stresses: A Review. J. Appl. Nat. Sci. 2015, 7, 1070–1080. [Google Scholar] [CrossRef]
  22. Chai, Y.; Senay, S.; Horvath, D.; Pardey, P. Multi-Peril Pathogen Risks to Global Wheat Production: A Probabilistic Loss and Investment Assessment. Front. Plant Sci. 2022, 13, 1034600. [Google Scholar] [CrossRef] [PubMed]
  23. Bockus, W.; Claassen, M. Effects of Crop Rotation and Residue Management Practices on Severity of Tan Spot of Winter Wheat. Plant Dis. 1992, 76, 633. [Google Scholar] [CrossRef]
  24. Muqaddasi, Q.H.; Kamal, R.; Mirdita, V.; Rodemann, B.; Ganal, M.W.; Reif, J.C.; Röder, M.S. Genome-Wide Association Studies and Prediction of Tan Spot (Pyrenophora tritici-Repentis) Infection in European Winter Wheat via Different Marker Platforms. Genes 2021, 12, 490. [Google Scholar] [CrossRef]
  25. Helepciuc, F.E.; Todor, A. Evaluating the Effectiveness of the EU’s Approach to the Sustainable Use of Pesticides. PLoS ONE 2021, 16, e0256719. [Google Scholar] [CrossRef] [PubMed]
  26. Almogdad, M.; Lukošiūtė-Stasiukonienė, A.; Semaškienė, R.; Mačiulytė, V. Sowing Date and Seed Rate Influence on Septoria Leaf Blotch Occurrence in Winter Wheat. Agriculture 2024, 14, 988. [Google Scholar] [CrossRef]
  27. European and Mediterranean Plant Protection Organization (EPPO). PP1/26(4)—Efficacy Evaluation of Fungicides. Bull. OEPP/EPPO Bull. 2012, 42, 419–425. [Google Scholar]
  28. Dabkevičius, Z.; Gaurilčikienė, I. Augalų ligų apskaitos metodai. In Žemės Ūkio Augalų Kenkėjai, Ligos ir jų Apskaita; Lithuanian Research Centre for Agriculture and Forestry: Akademija, Lithuania, 2002; pp. 12–14. [Google Scholar]
  29. Dabkevičius, Z.; Brazauskienė, I. Augalų Patologija; Lietuvos Žemės Ūkio Universitetas: Akademija, Lithuania, 2007; p. 496. [Google Scholar]
  30. Simko, I.; Piepho, H.P. The Area under the Disease Progress Stairs: Calculation, Advantage, and Application. Phytopathology 2012, 102, 381–389. [Google Scholar] [CrossRef] [PubMed]
  31. Schaafsma, A.W.; Tamburic-Ilincic, L. Effect of Seeding Rate and Seed Treatment Fungicides on Agronomic Performance, Fusarium Head Blight Symptoms, and DON Accumulation in Two Winter Wheats. Plant Dis. 2005, 89, 1109–1113. [Google Scholar] [CrossRef]
  32. Apeyuan, K.D.; Nwankiti, A.O.; Oluma, O.A.H.; Ekefan, E.J.; Apeyuan, K.D.; Nwankiti, A.O.; Oluma, O.A.H.; Ekefan, E.J. Effect of Different Sowing Dates on Disease Initiation and Development of Roselle (Hibiscus sabdariffa L.) Leaf Spot Disease Caused by Coniella musaiensis Var. Hibisci in Makurdi, Central Nigeria. J. Geosci. Environ. Prot. 2017, 5, 94–101. [Google Scholar] [CrossRef]
  33. Krnjaja, V.; Mandić, V.; Bijelić, Z.; Stanković, S.; Obradović, A.; Caro Petrović, V.; Gogić, M. Influence of Sowing Time on Fusarium and Fumonisin contamination of Maize Grains and Yield Component Traits. Agriculture 2022, 12, 1042. [Google Scholar] [CrossRef]
  34. Kpu, K.A.; Annih, M.G.; Ambang, A.L.; Agwah, E.D. Influence of Tillage Systems and Sowing Dates on the Incidence of Leaf Spot Disease in Telfairia occidentalis Caused by Phoma sorghina in Cameroon. Sci. Rep. 2022, 12, 19790. [Google Scholar] [CrossRef] [PubMed]
  35. Kandel, Y.R.; Phillips, X.A.; Gaska, J.M.; Conley, S.P.; Mueller, D.S. Effect of Planting Population on Stem Diseases of Soybean in Iowa and Wisconsin. Plant Health Prog. 2021, 22, 108–112. [Google Scholar] [CrossRef]
  36. Singh, B.K.; Delgado-Baquerizo, M.; Egidi, E.; Guirado, E.; Leach, J.E.; Liu, H.; Trivedi, P. Climate Change Impacts on Plant Pathogens, Food Security and Paths Forward. Nat. Rev. Microbiol. 2023, 21, 640–656. [Google Scholar] [CrossRef] [PubMed]
  37. Raza, M.M.; Bebber, D.P. Climate Change and Plant Pathogens. Curr. Opin. Microbiol. 2022, 70, 102233. [Google Scholar] [CrossRef] [PubMed]
  38. Velásquez, A.C.; Castroverde, C.D.M.; He, S.Y. Plant–Pathogen Warfare under Changing Climate Conditions. Curr. Biol. 2018, 28, R619–R634. [Google Scholar] [CrossRef] [PubMed]
  39. Velička, R.; Butkevičienė, L.M.; Pupalienė, R.; Kriaučiūnienė, Z.; Kosteckas, R.; Kosteckienė, S.; Klusavičius, E.; Meškauskas, S. The Effect of Sowing Time on Pest Spreading in Spring Oilseed Rape Crop. Žemės Ūkio Mokslai 2017, 24, 143–156. [Google Scholar] [CrossRef]
  40. Sohi, G.S.; Singh, A.; Singh, B.; Beniwal, M. Effect of Sowing Date and Weather Parameters on Severity of Alternaria Blight on Different Varieties of Brassica juncea. Int. J. Curr. Microbiol. Appl. Sci. 2020, 9, 3732–3739. [Google Scholar] [CrossRef]
  41. Gebrel, E.E.M.A.; Gad, M.A.; Kishk, A.M.S. Effect of Sowing Dates on Potential Yield and Rust Resistance of Some Wheat Cultivars. J. Plant Prod. 2018, 9, 369–375. [Google Scholar] [CrossRef]
  42. Kumar, S.; Satish Kumar, C.; Karwasra, S. Effect of Date of Sowing on the Incidence of Stripe Disease of Barley. J. Pharmacogn. Phytochem. 2019, 8, 2345–2347. [Google Scholar]
  43. Pande, S.; Rao, J.N. Effect of Plant Population Densities on the Severity of Late Leaf Spot and Rust of Groundnut. Plant Pathol. J. 2002, 271–278. [Google Scholar] [CrossRef]
  44. Chang, K.F.; Ahmed, H.U.; Hwang, S.F.; Gossen, B.D.; Howard, R.J.; Warkentin, T.D.; Strelkov, S.E.; Blade, S.F. Impact of Cultivar, Row Spacing and Seeding Rate on Ascochyta Blight Severity and Yield of Chickpea. Can. J. Plant Sci. 2007, 87, 395–403. [Google Scholar] [CrossRef]
  45. Jurke, C.J.; Fernando, W.G.D. Effects of Seeding Rate and Plant Density on Sclerotinia Stem Rot Incidence in Canola. Arch. Phytopathol. Plant Prot. 2008, 41, 142–155. [Google Scholar] [CrossRef]
  46. Sharabani, G.; Shtienberg, D.; Borenstein, M.; Shulhani, R.; Lofthouse, M.; Sofer, M.; Chalupowicz, L.; Barel, V.; Manulis-Sasson, S. Effects of Plant Age on Disease Development and Virulence of Clavibacter michiganensis Subsp. Michiganensis on Tomato. Plant Pathol. 2013, 62, 1114–1122. [Google Scholar] [CrossRef]
  47. Samain, E.; Aussenac, T.; Selim, S. The Effect of Plant Genotype, Growth Stage, and Mycosphaerella graminicola Strains on the Efficiency and Durability of Wheat-Induced Resistance by Paenibacillus Sp. Strain B2. Front. Plant Sci. 2019, 10, 453178. [Google Scholar] [CrossRef] [PubMed]
  48. Cheng, C.; Gao, X.; Feng, B.; Sheen, J.; Shan, L.; He, P. Plant Immune Response to Pathogens Differs with Changing Temperatures. Nat. Commun. 2013, 4, 2530. [Google Scholar] [CrossRef] [PubMed]
  49. Dar, T.A.; Uddin, M.; Khan, M.M.A.; Hakeem, K.R.; Jaleel, H. Jasmonates Counter Plant Stress: A Review. Environ. Exp. Bot. 2015, 115, 49–57. [Google Scholar] [CrossRef]
  50. Burdon, J.J.; Zhan, J. Climate Change and Disease in Plant Communities. PLoS Biol. 2020, 18, e3000949. [Google Scholar] [CrossRef]
  51. Semaskiene, R.; Ronis, A. Incidence and Severity of Leaf Spotting Diseases of Winter Wheat in Lithuania. Latv. J. Agron. 2004, 7, 98–102. [Google Scholar]
Figure 1. The average air temperature (light lines) and total precipitation (light bars) for each decade of the vegetation season in 2021, 2022, and 2023, compared to the 1991–2020 standard climate norm (SCN, average of 1991–2020, dark lines for temperature and dark bars for precipitation). The labels ‘4.I’, ‘4.II’, and ‘4.III’ represent the first, second, and third ten-day periods of April, respectively. This pattern continues similarly for May (5), June (6), July (7), and August (8). Figure modified and supplemented based on Almogdad et al. [26].
Agriculture 14 01284 g001
Figure 2. Pyrenophora tritici-repentis on spring wheat, percentage of leaf area affected [29].
Agriculture 14 01284 g002
Figure 3. Impact of sowing timing and seed rate on tan spot severity in spring wheat across the years 2021, 2022, and 2023. Values sharing the same letter are not significantly different at p ≤ 0.05.
Agriculture 14 01284 g003
Figure 4. Effect of sowing time and seed rate on area under disease progress curve (AUDPC) values of tan spot in spring wheat in 2021–2023 growing seasons. Values sharing same letter are not significantly different at p ≤ 0.05.
Agriculture 14 01284 g004
Table 1. Assessment dates and time differences (in days) from sowing for each stage.
YearsStagesDate of StageDays after SeedingDifference, Days
1st
Sowing
2nd
Sowing
3rd
Sowing
1st
Sowing
2nd
Sowing
3rd
Sowing
1st–2nd
Sowing
1st–3rd
Sowing
2021Sowing day15 April29 April12 May---1427
BBCH 31–3209 June13 June21 June554540412
BBCH 37–4118 June22 June25 June64544447
BBCH 59–6525 June30 June08 July716257513
BBCH 7513 July16 July22 July89787139
Harvest day13 August13 August13 August1201069300
2022Sowing day13 April29 April11 May---1628
BBCH 31–3203 June10 June20 June514240717
BBCH 37–4117 June26 June30 June655850913
BBCH 59–6530 June05 July15 July786765515
BBCH 7514 July21 July26 July928376712
Harvest day17 August19 August25 August12611210628
2023Sowing day20 April04 May19 May---1429
BBCH 31–3207 June15 June21 June484233814
BBCH 37–4115 June21 June30 June564842615
BBCH 59–6525 June30 June10 July665752515
BBCH 7514 July21 July29 July857871715
Harvest day23 August23 August23 August1251119600
Table 2. Mean air temperature (°C), fluctuation from the long-term mean (°C) among growing phases, quantity of rainfall (mm), and fluctuation from the long-term mean (%) between various growth stages of spring wheat for the years 2021, 2022, and 2023. Data are presented from the end of one BBCH phase to the beginning of the next and categorized by three different sowing times.
YearsFromToParameter *1st—Sowing2nd—Sowing3rd—Sowing
2021Sowing dayBBCH 31–32Prec. (deviation)111 mm (65%)114 mm (77%)76 mm (19%)
Temp. (deviation)11.3 °C (−1.0 °C)13.0 °C (−0.7 °C)15.5 °C (0.7 °C)
BBCH 31–32BBCH 37–41Prec. (deviation)8 mm (−53%)1 mm (−93%)18 mm (29%)
Temp. (deviation)17.4 °C (1.1 °C)19.5 °C (3.4 °C)24.5 °C (8.2 °C)
BBCH 37–41BBCH 59–65Prec. (deviation)18 mm (−4%)22 mm (7%)4 mm (−88%)
Temp. (deviation)23.7 °C (7.4 °C)21.8 °C (5.2 °C)21.6 °C (4.2 °C)
BBCH 59–65BBCH 75Prec. (deviation)13 mm (−72%)11 mm (−77%)15 mm (−56%)
Temp. (deviation)22.5 °C (4.9 °C)23.8 °C (5.7 °C)24.2 °C (5.8 °C)
BBCH 75Harvest dayPrec. (deviation)70 mm (−4%)69 mm (4%)64 mm (20%)
Temp. (deviation)20.4 °C (1.5 °C)19.9 °C (−0.9 °C)19.1 °C (−0.1 °C)
2022Sowing dayBBCH 31–32Prec. (deviation)140 mm (126%)107 mm (83%)176 mm (177%)
Temp. (deviation)9.8 °C (−1.8 °C)11.6 °C (−1.8 °C)13.6 °C (−1.2 °C)
BBCH 31–32BBCH 37–41Prec. (deviation)72 mm (219%)121 mm (223%)52 mm (112%)
Temp. (deviation)16.3 °C (0.1 °C)16.5 °C (0.2 °C)19.9 °C (3.3 °C)
BBCH 37–41BBCH 59–65Prec. (deviation)54 mm (80%)4 mm (−86%)45 mm (4%)
Temp. (deviation)18.9 °C (2.5 °C)23.0 °C (5.8 °C)18.6 °C (0.6 °C)
BBCH 59–65BBCH 75Prec. (deviation)45 mm (9%)54 mm (39%)26 mm (3%)
Temp. (deviation)18.6 °C (0.6 °C)16.3 °C (−2.1 °C)18.0 °C (−0.6 °C)
BBCH 75Harvest dayPrec. (deviation)94 mm (17%)85 mm (27%)68 mm (−1%)
Temp. (deviation)18.7 °C (−0.2 °C)19.6 °C (0.7 °C)20.1 °C (1.5 °C)
2023Sowing dayBBCH 31–32Prec. (deviation)18 mm (−69%)14 mm (−79%)18 mm (−65%)
Temp. (deviation)12.1 °C (−0.5 °C)13.8 °C (−0.3 °C)16.0 °C (0.7 °C)
BBCH 31–32BBCH 37–41Prec. (deviation)0 mm (−100%)14 mm (36%)15 mm (−33%)
Temp. (deviation)17.5 °C (0.9 °C)19.7 °C (3.7 °C)19.1 °C (2.5 °C)
BBCH 37–41BBCH 59–65Prec. (deviation)15 mm (−38%)15 mm (−33%)21 mm (−31%)
Temp. (deviation)20.0 °C (3.9 °C)19.1 °C (2.5 °C)17.5 °C (−0.3 °C)
BBCH 59–65BBCH 75Prec. (deviation)35 mm (−30%)29 mm (−50%)27 mm (−43%)
Temp. (deviation)17.8 °C (0.1 °C)18.1 °C (0 °C)17.9 °C (−0.9 °C)
BBCH 75Harvest dayPrec. (deviation)68 mm (−27%)60 mm (−22%)40 mm (−28%)
Temp. (deviation)19.2 °C (0.5 °C)19.2 °C (0.5 °C)20.0 °C (1.4 °C)
* Prec.—total amount of rainfall; Temp.—mean air temperature.
Table 3. The interplay between the intensity of tan spot disease and the year, sowing date, and rate of seeds in spring wheat in 2021–2023 growing seasons: main and interaction effects (means and p-values).
FactorCategoryAUDPC
Year2021254.85 ± 100.80 b
2022248.21 ± 75.42 b
2023180.80 ± 79.84 a
Sowing timeEarly167.48 ± 67.66 a
Optimal191.80 ± 36.00 a
Late324.58 ± 71.37 b
Seed rate400206.15 ± 87.30 a
500227.58 ± 89.42 a
600250.13 ± 95.21 a
ANOVA p-valuesYear<0.0001
Sowing time<0.0001
Seed rate<0.0001
Year × sowing time<0.0001
Year × seed rate0.1102
Sowing time × seed rate0.3615
Year × sowing time × seed rate0.3227
Note: Within every characteristic and variable, averages that have a similar symbol are not significantly varied at p ≤ 0.05.
Disclaimer/Publisher’s Note: The statements, opinions and data contained in all publications are solely those of the individual author(s) and contributor(s) and not of MDPI and/or the editor(s). MDPI and/or the editor(s) disclaim responsibility for any injury to people or property resulting from any ideas, methods, instructions or products referred to in the content.

