
Fault Diagnosis of Rolling Bearings in Agricultural Machines Using SVD-EDS-GST and ResViT
Abstract
:1. Introduction
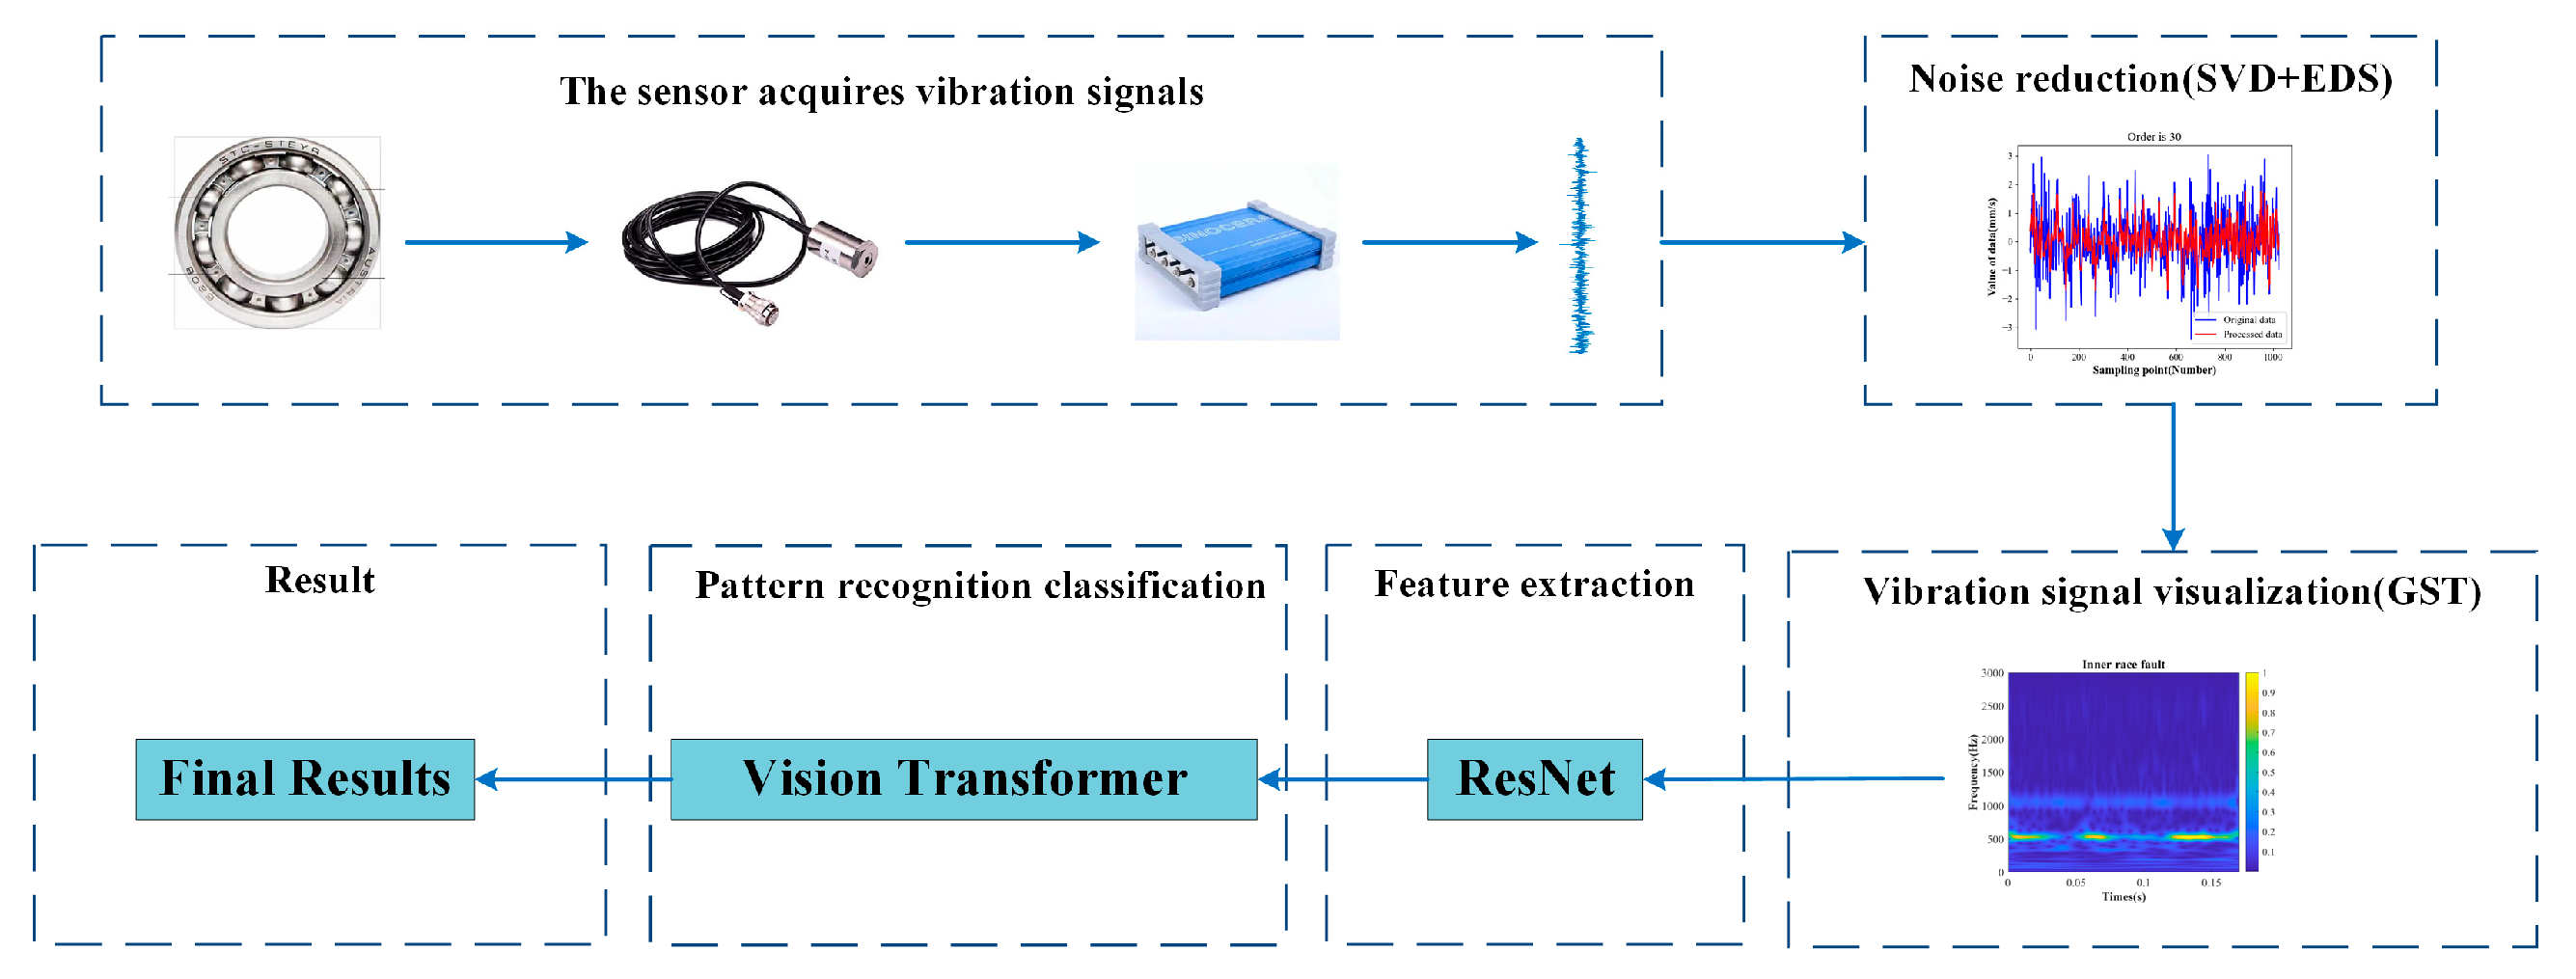
- An experimental platform for the fault diagnosis of rolling bearings in agricultural machinery is built, and a new fault diagnosis method for such bearings with SVD-EDS-GST and ResViT is proposed.
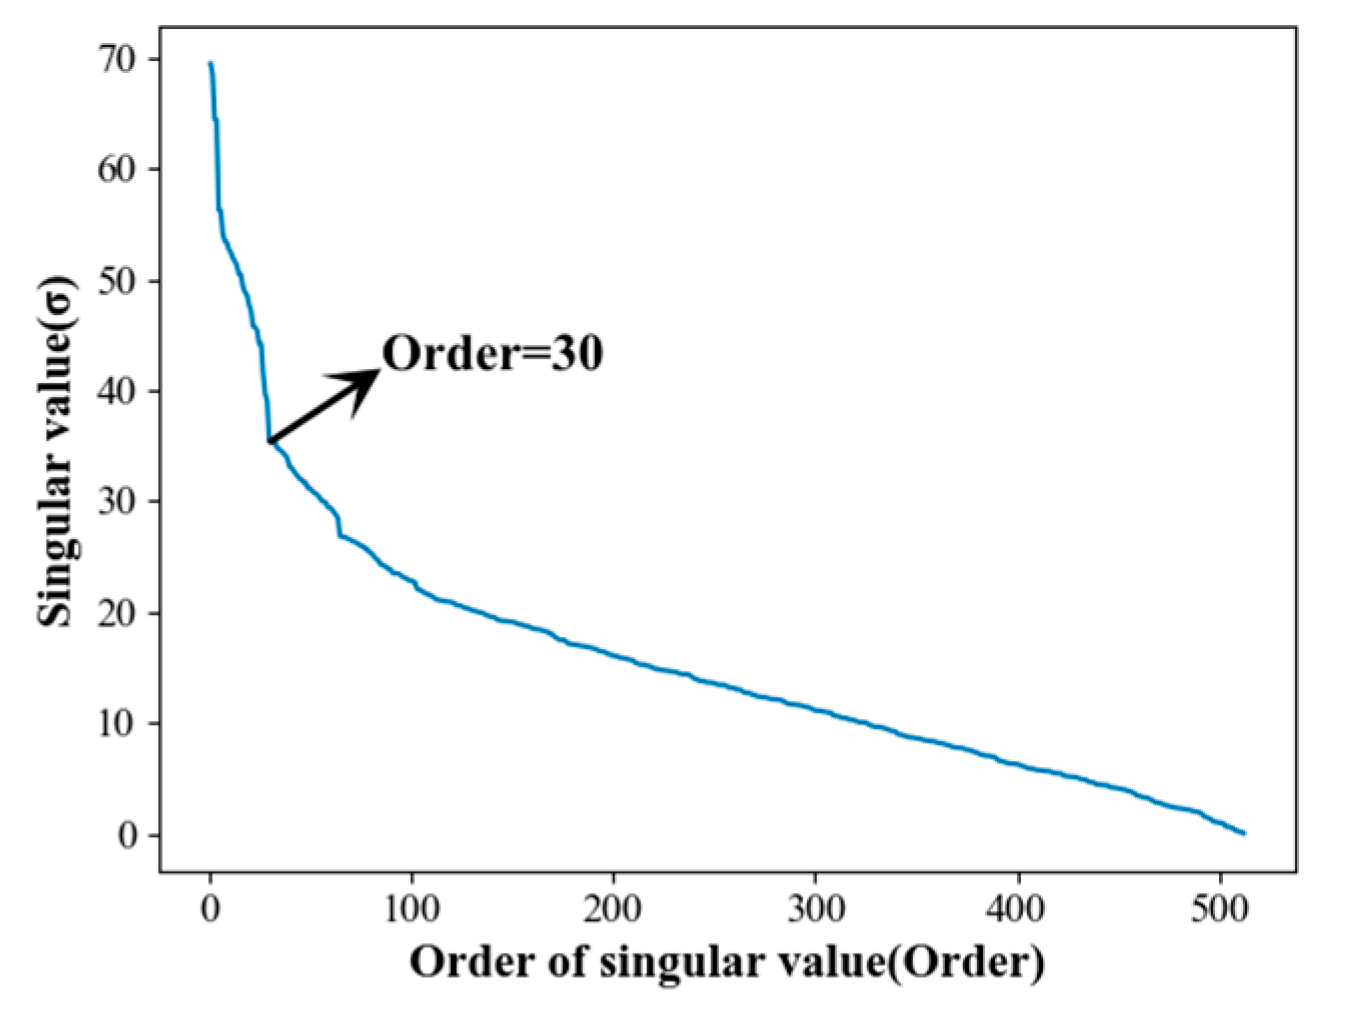
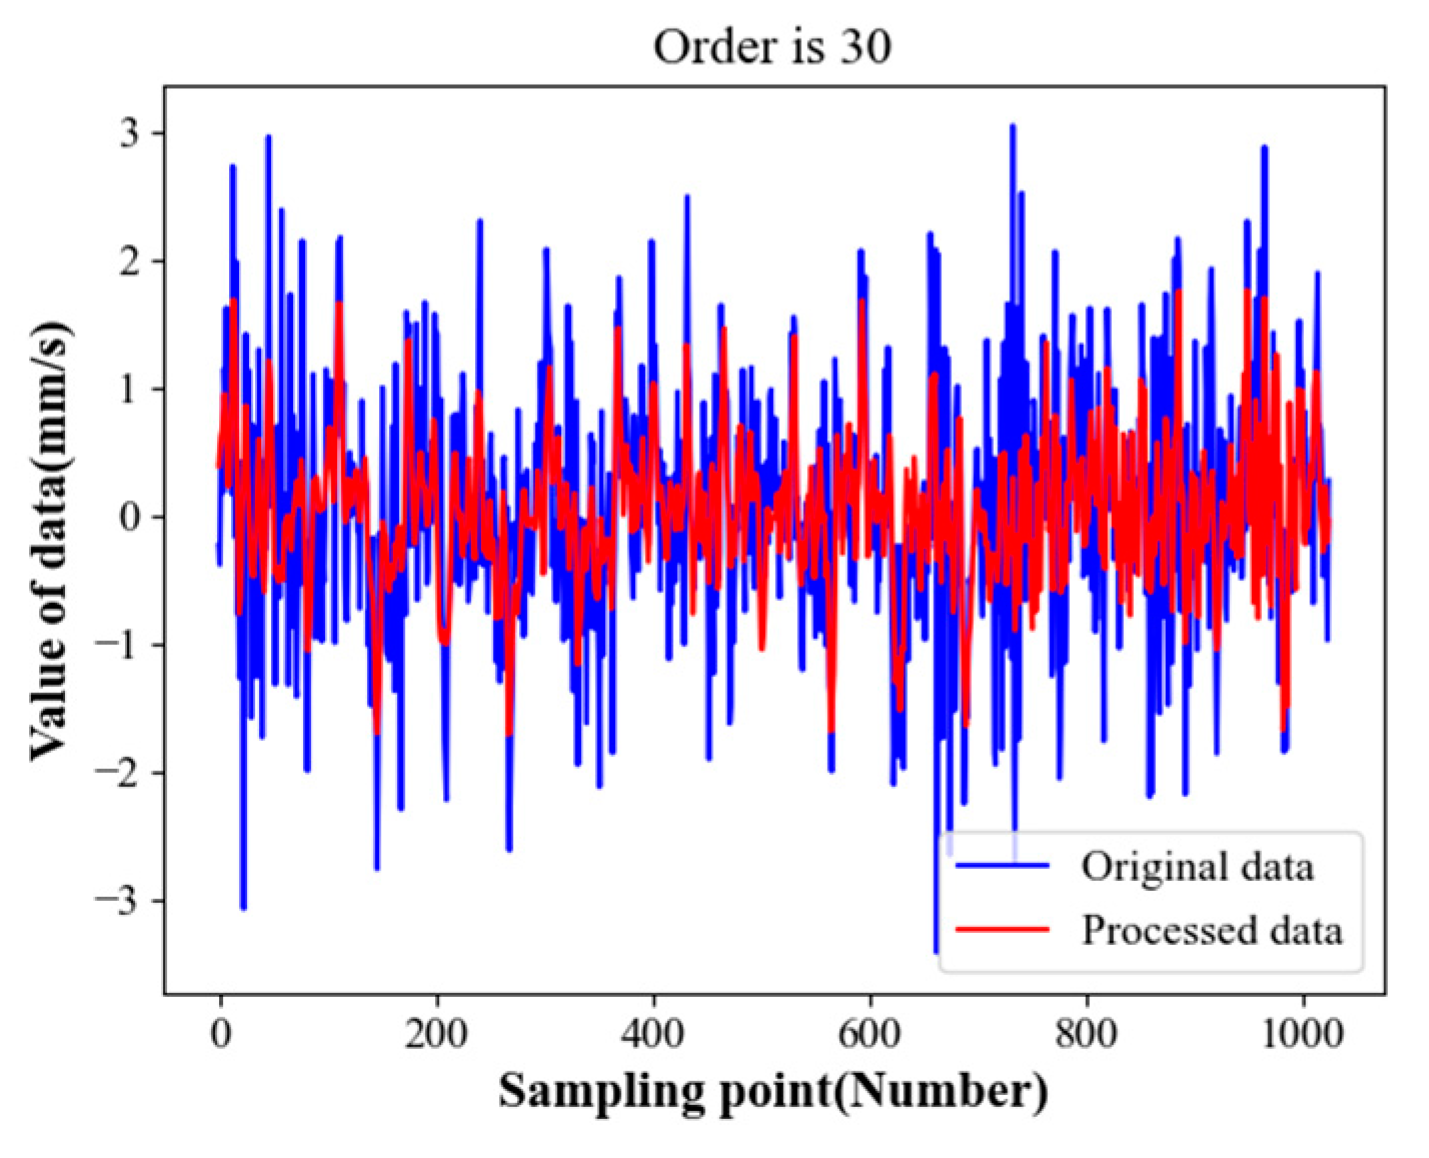
- SVD combined with the EDS is proposed to reduce the noise in vibration signals in order to remove the interference of complex noise and redundant components. The vibration signal noise reduction is realized via matrix reconstruction.
- GST is applied to the vibration signal of rolling bearings in agricultural machinery after noise removal; thus, the one-dimensional vibration signal is converted into a two-dimensional time–frequency image, and a fault data set is established.
- An improved ViT model combined with ResNet34 (ResViT) is proposed. This model uses a ResNet34 network to replace the image segmentation mechanism in the original Vision Transformer model for feature extraction, which makes the training more efficient and has strong robustness to small perturbations. At the same time, considering that the attention mechanism is not sensitive to the element position when processing global information, relative position coding is used instead of absolute position coding in order to better retain spatial information.
2. Basic Principles
2.1. SVD-EDS
2.2. GST
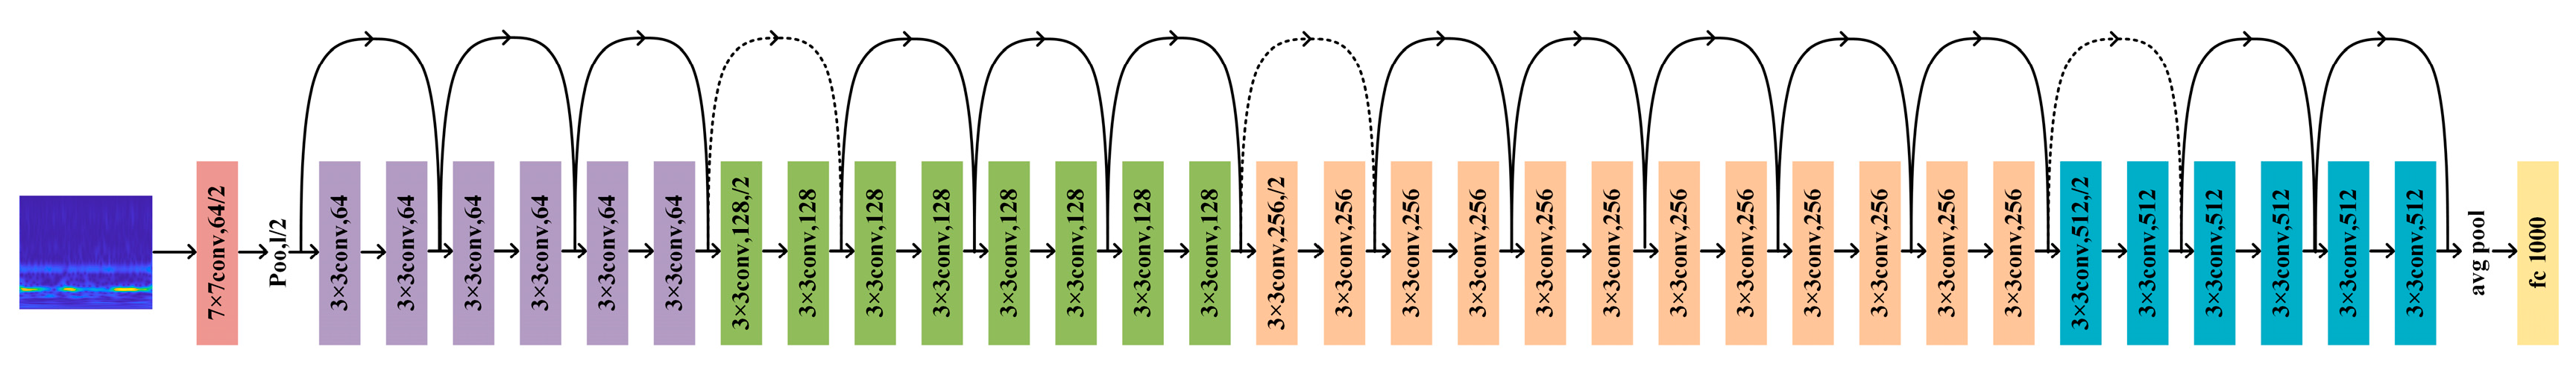
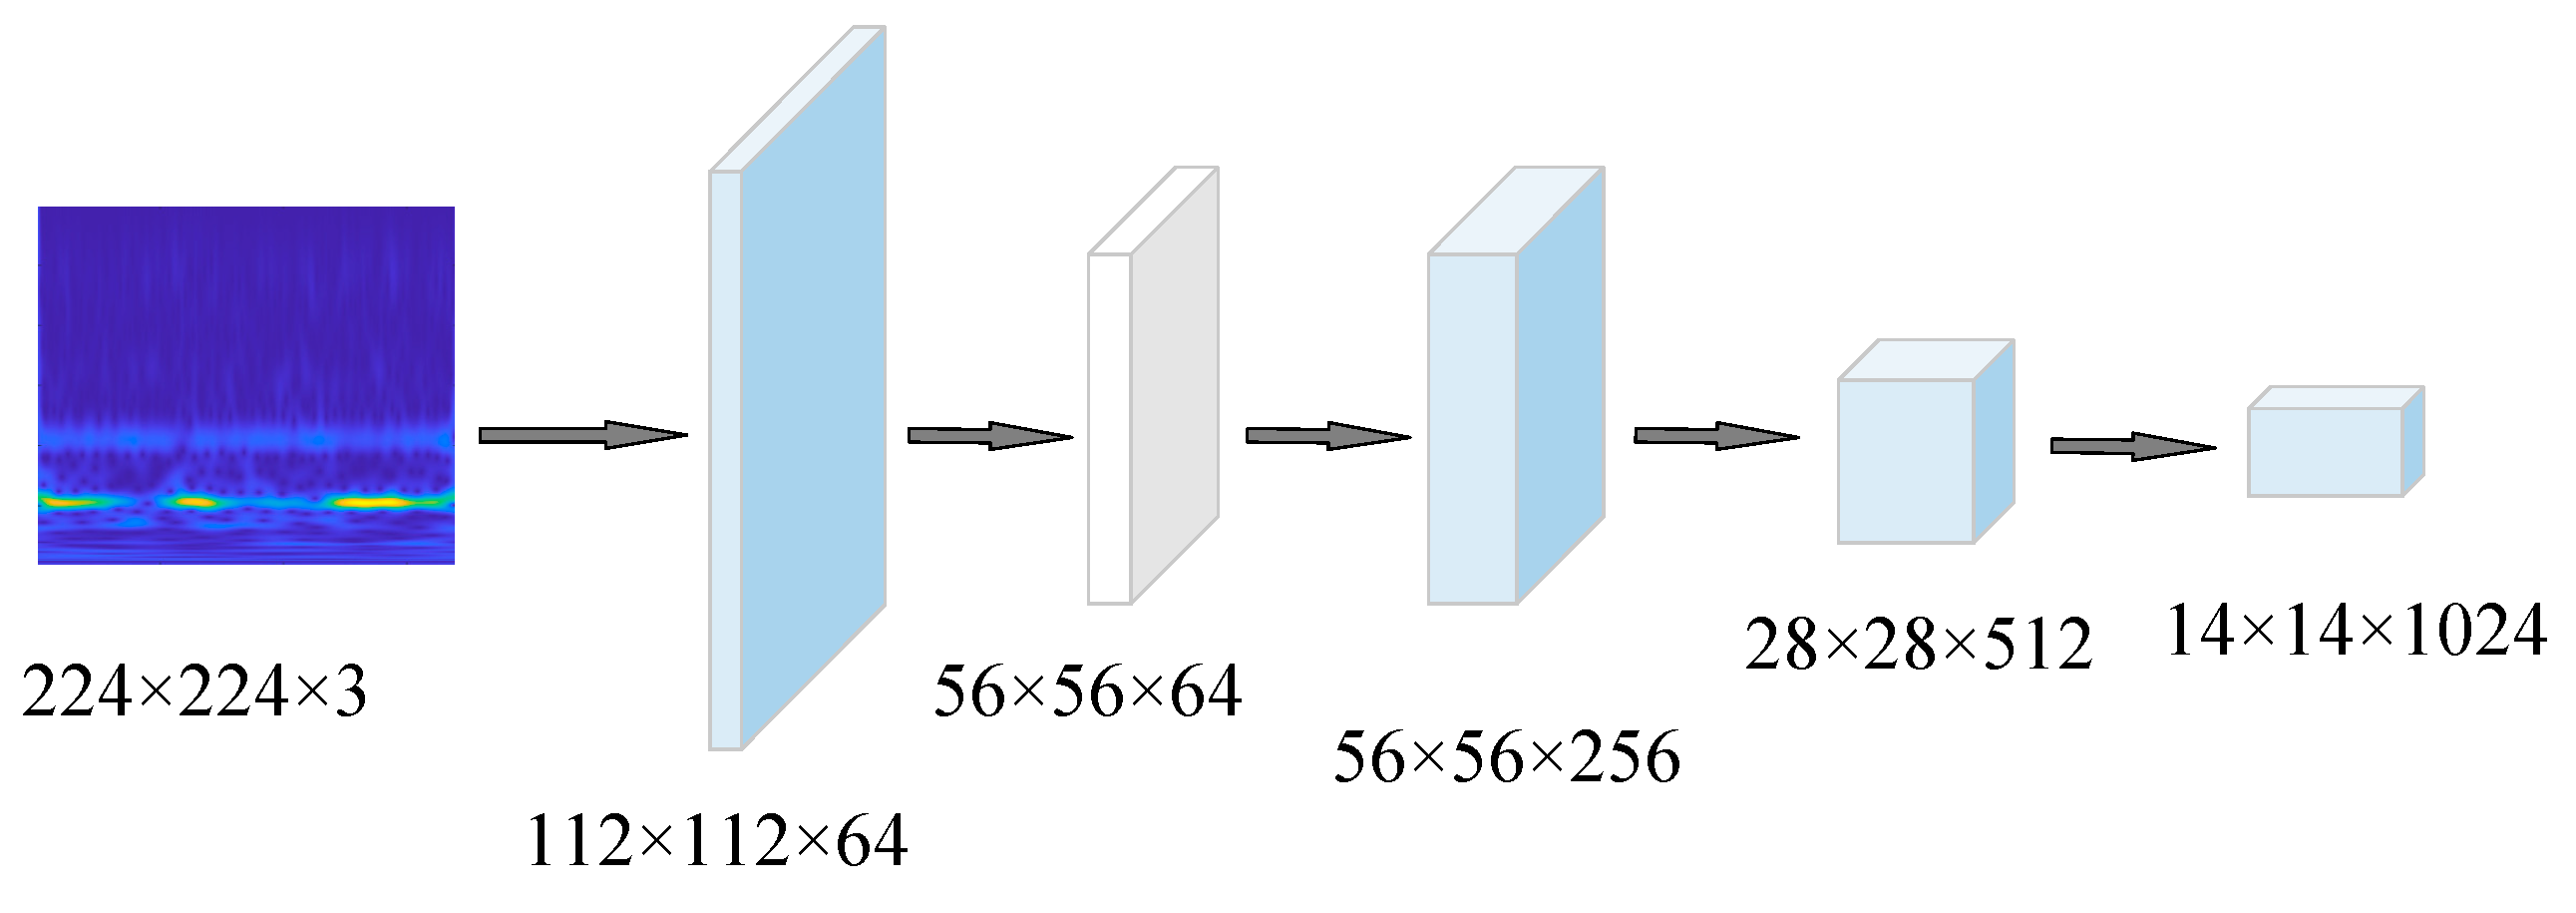
2.3. ResNet
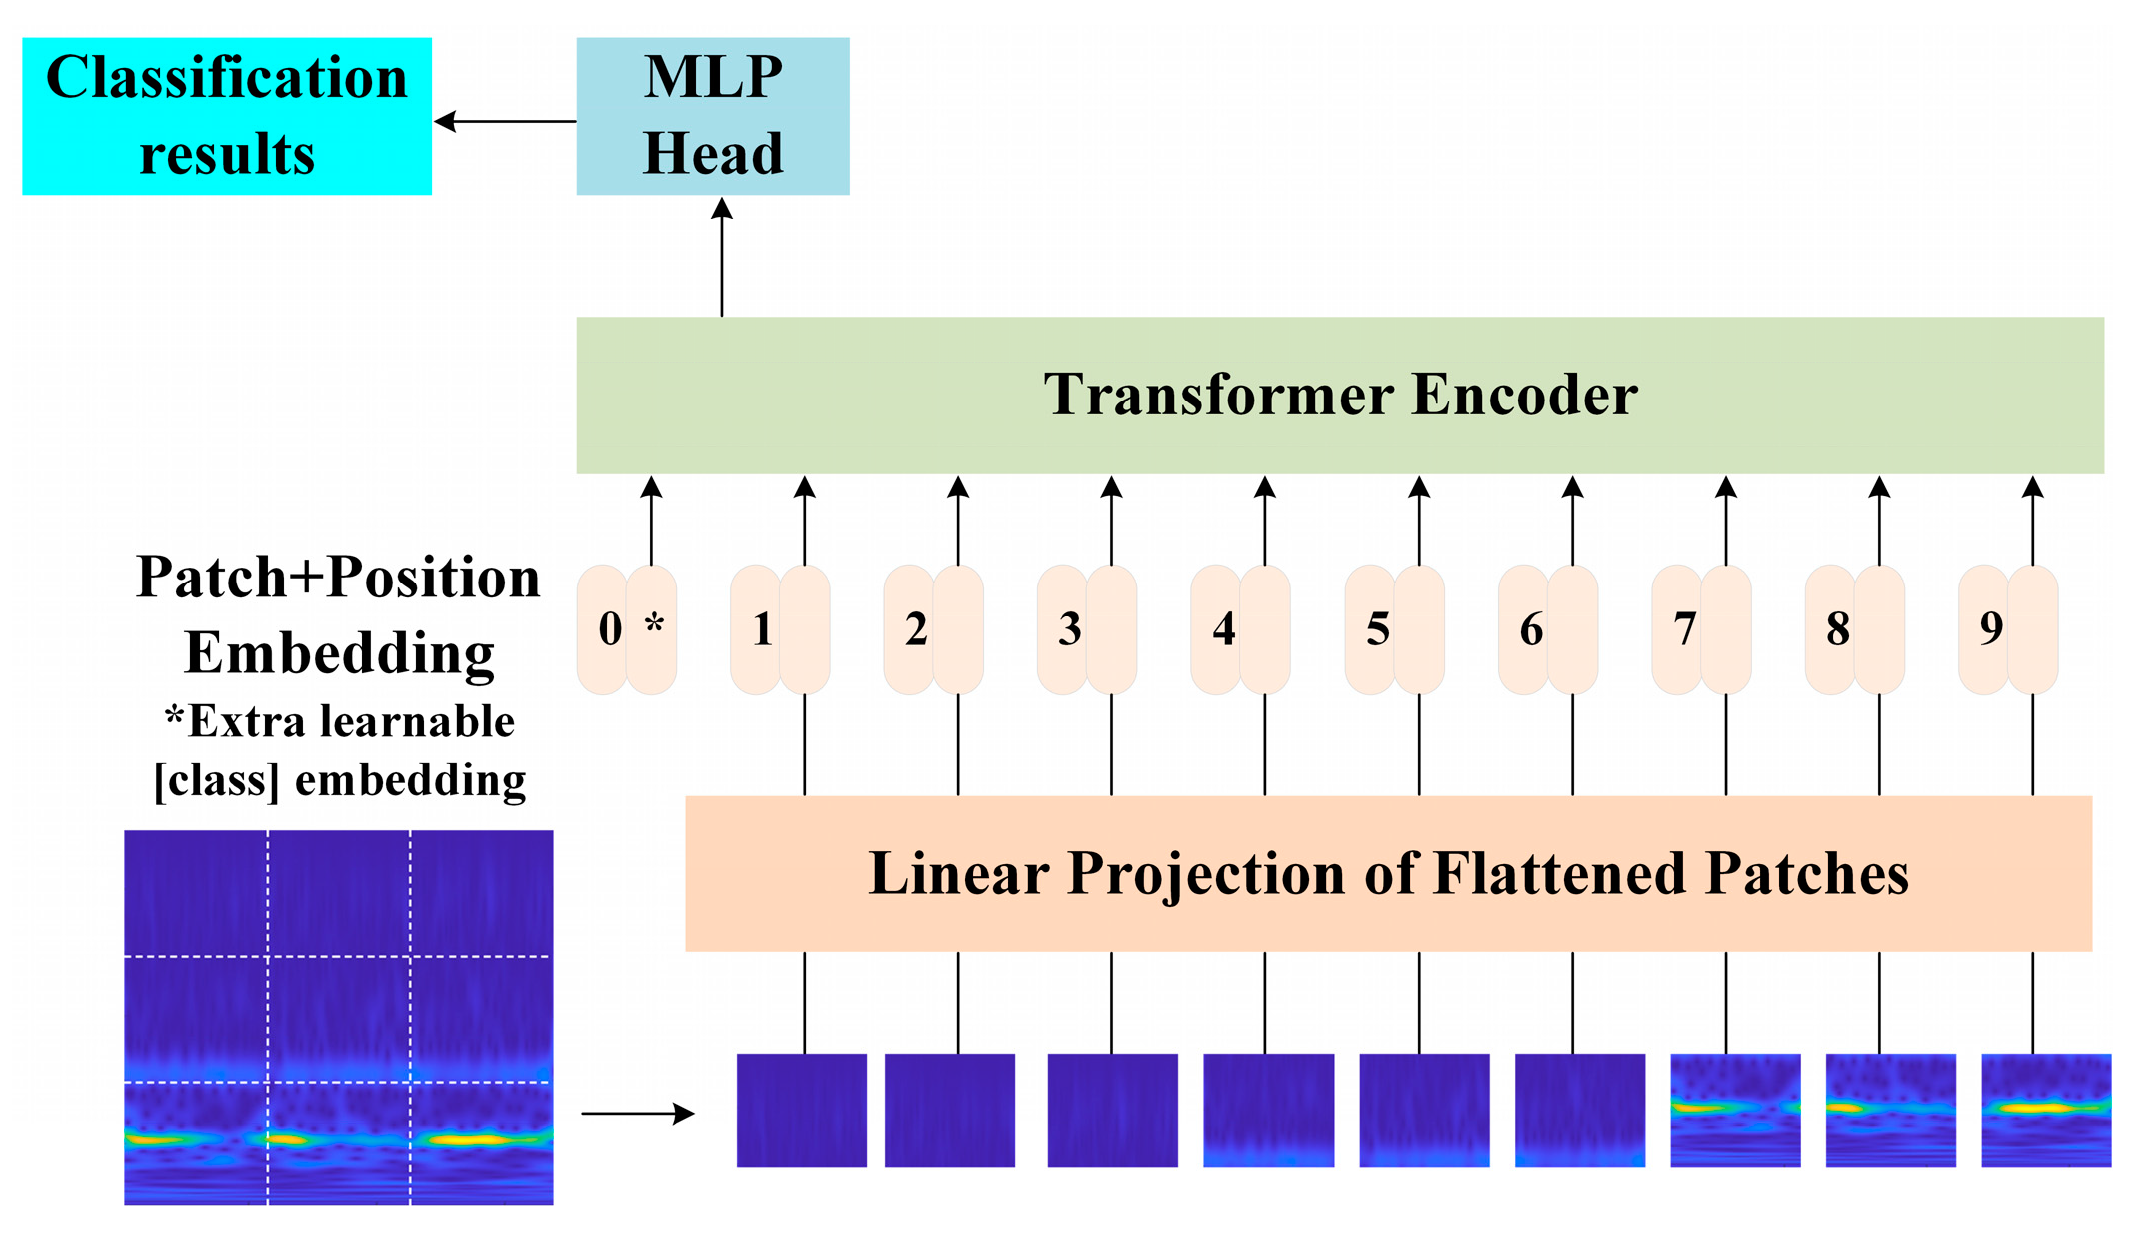
2.4. Vision Transformer
- Patch and Position Embedding module. First, the GST two-dimensional fault image is divided into image blocks of the same size, and then these image blocks are linearly transformed and projected into a low-dimensional space, and the position encoding containing spatial information is added as input to the Transformer Encoder layer [28].
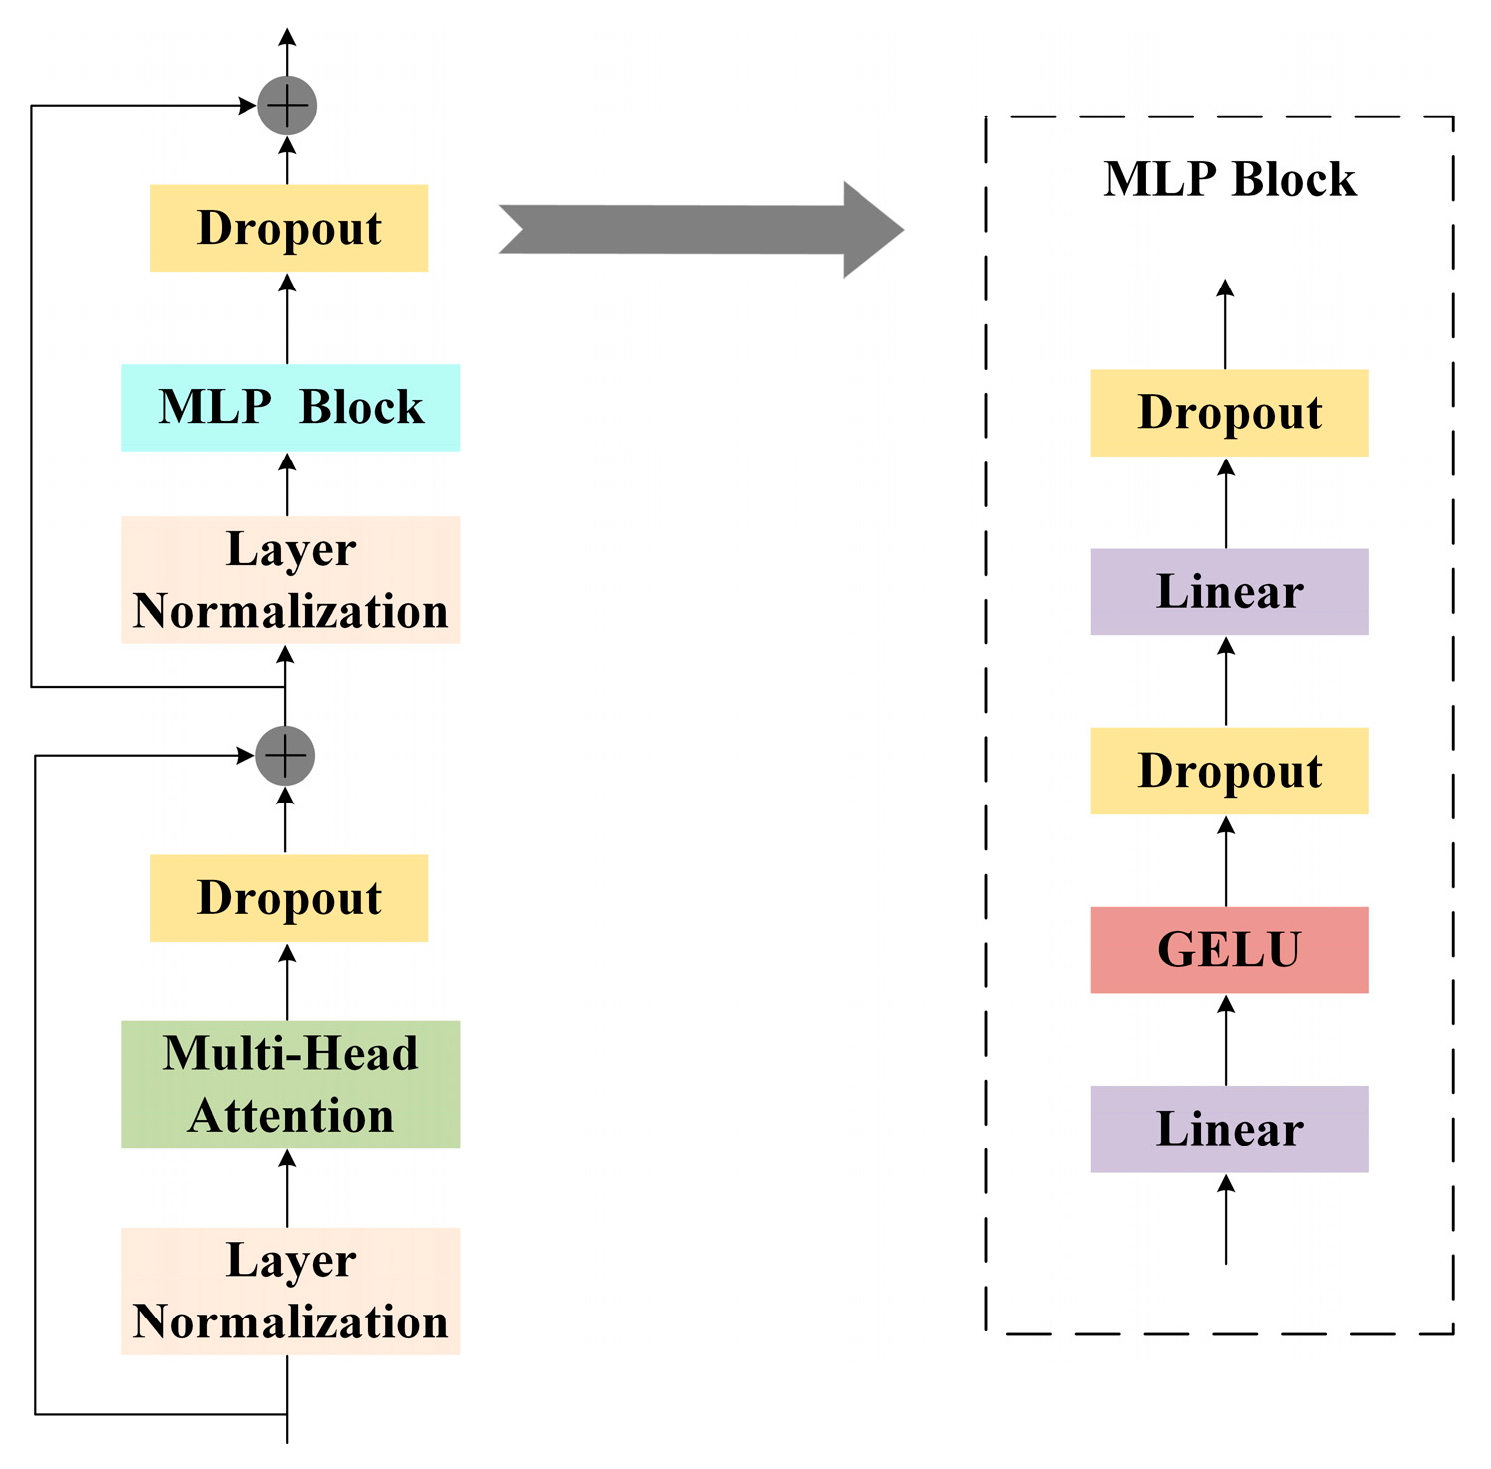
- Transformer Encoder module. Transformer Encoder can efficiently extract the features of input data [29]. Its structure is shown in Figure 3. Input data from the Transformer Encoder are first normalized to improve the training stability. The data capture the in-sequence dependencies through a multi-head self-attention mechanism, and dropout is applied to prevent overfitting. After that, the processed data are fused with the original input using a residual connection and are normalized again. Finally, the data are fed into the MLP block for feature transformation. The original information is retained through residual connections [30].
- Categorization Component. The features output by the Transformer Encoder are fed into the MLP head for classification, resulting in fault classification outcomes.
3. Fault Diagnosis Model
3.1. ResViT Model
3.2. Proposed SVD-EDS-GST and ResViT Fault Diagnosis Model
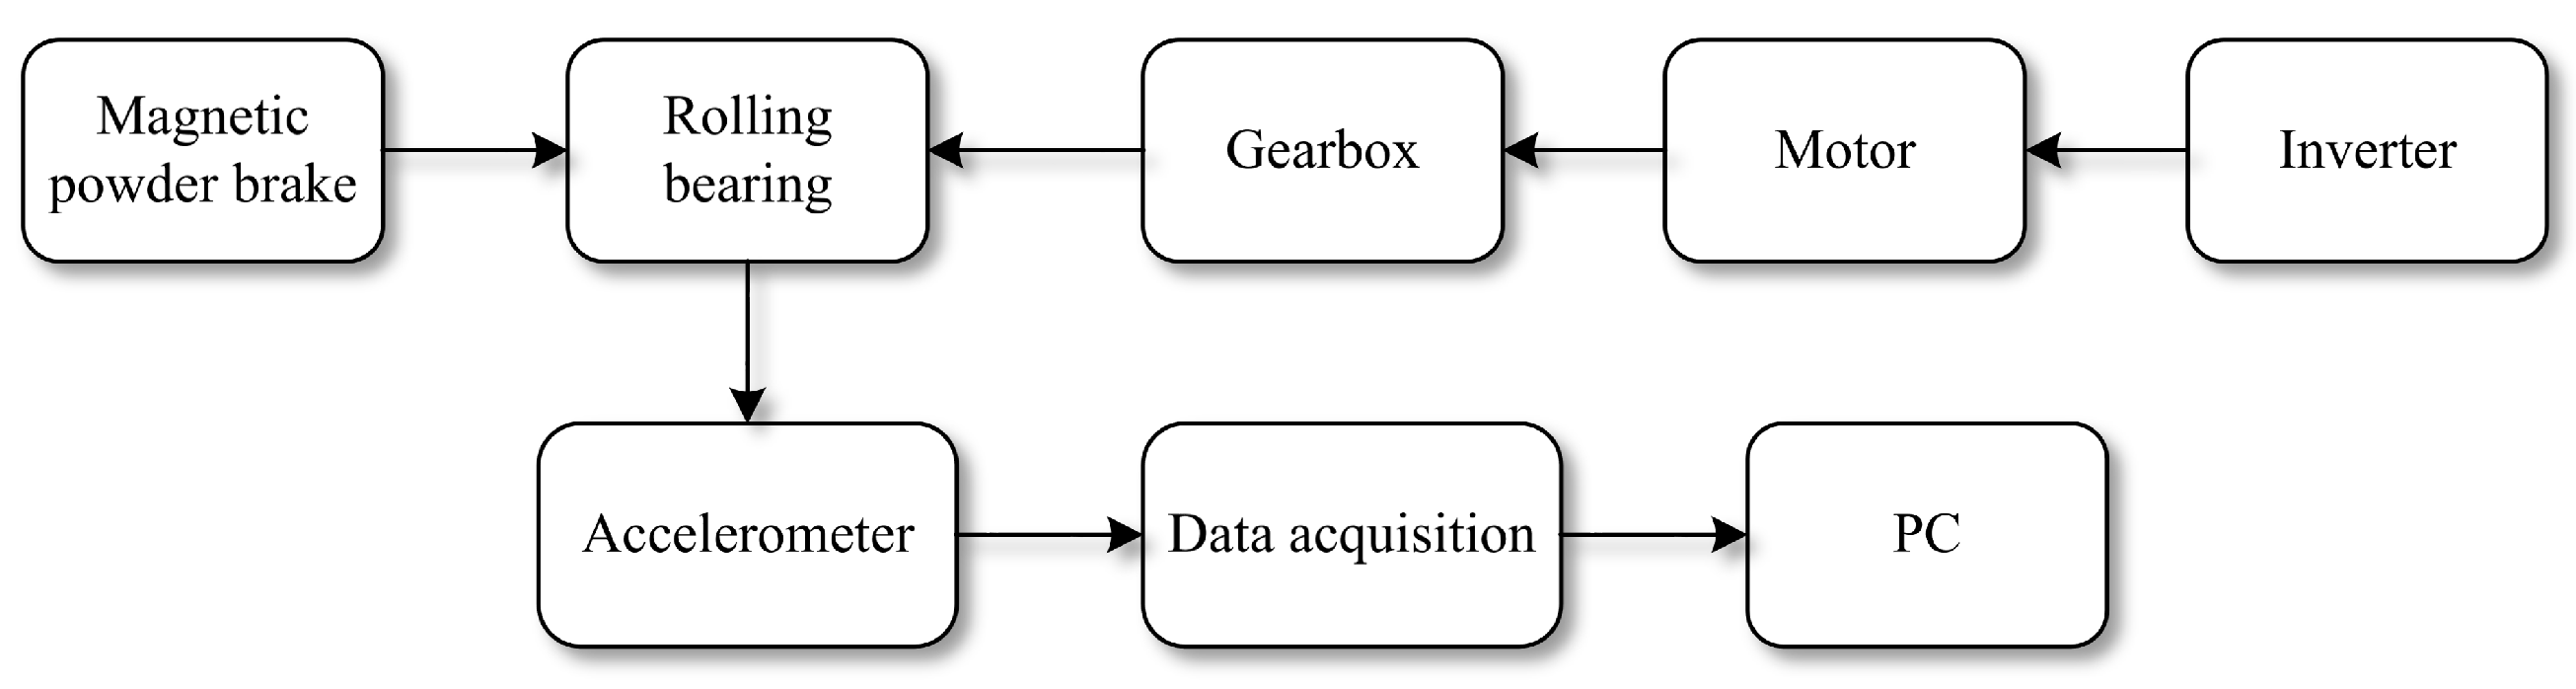
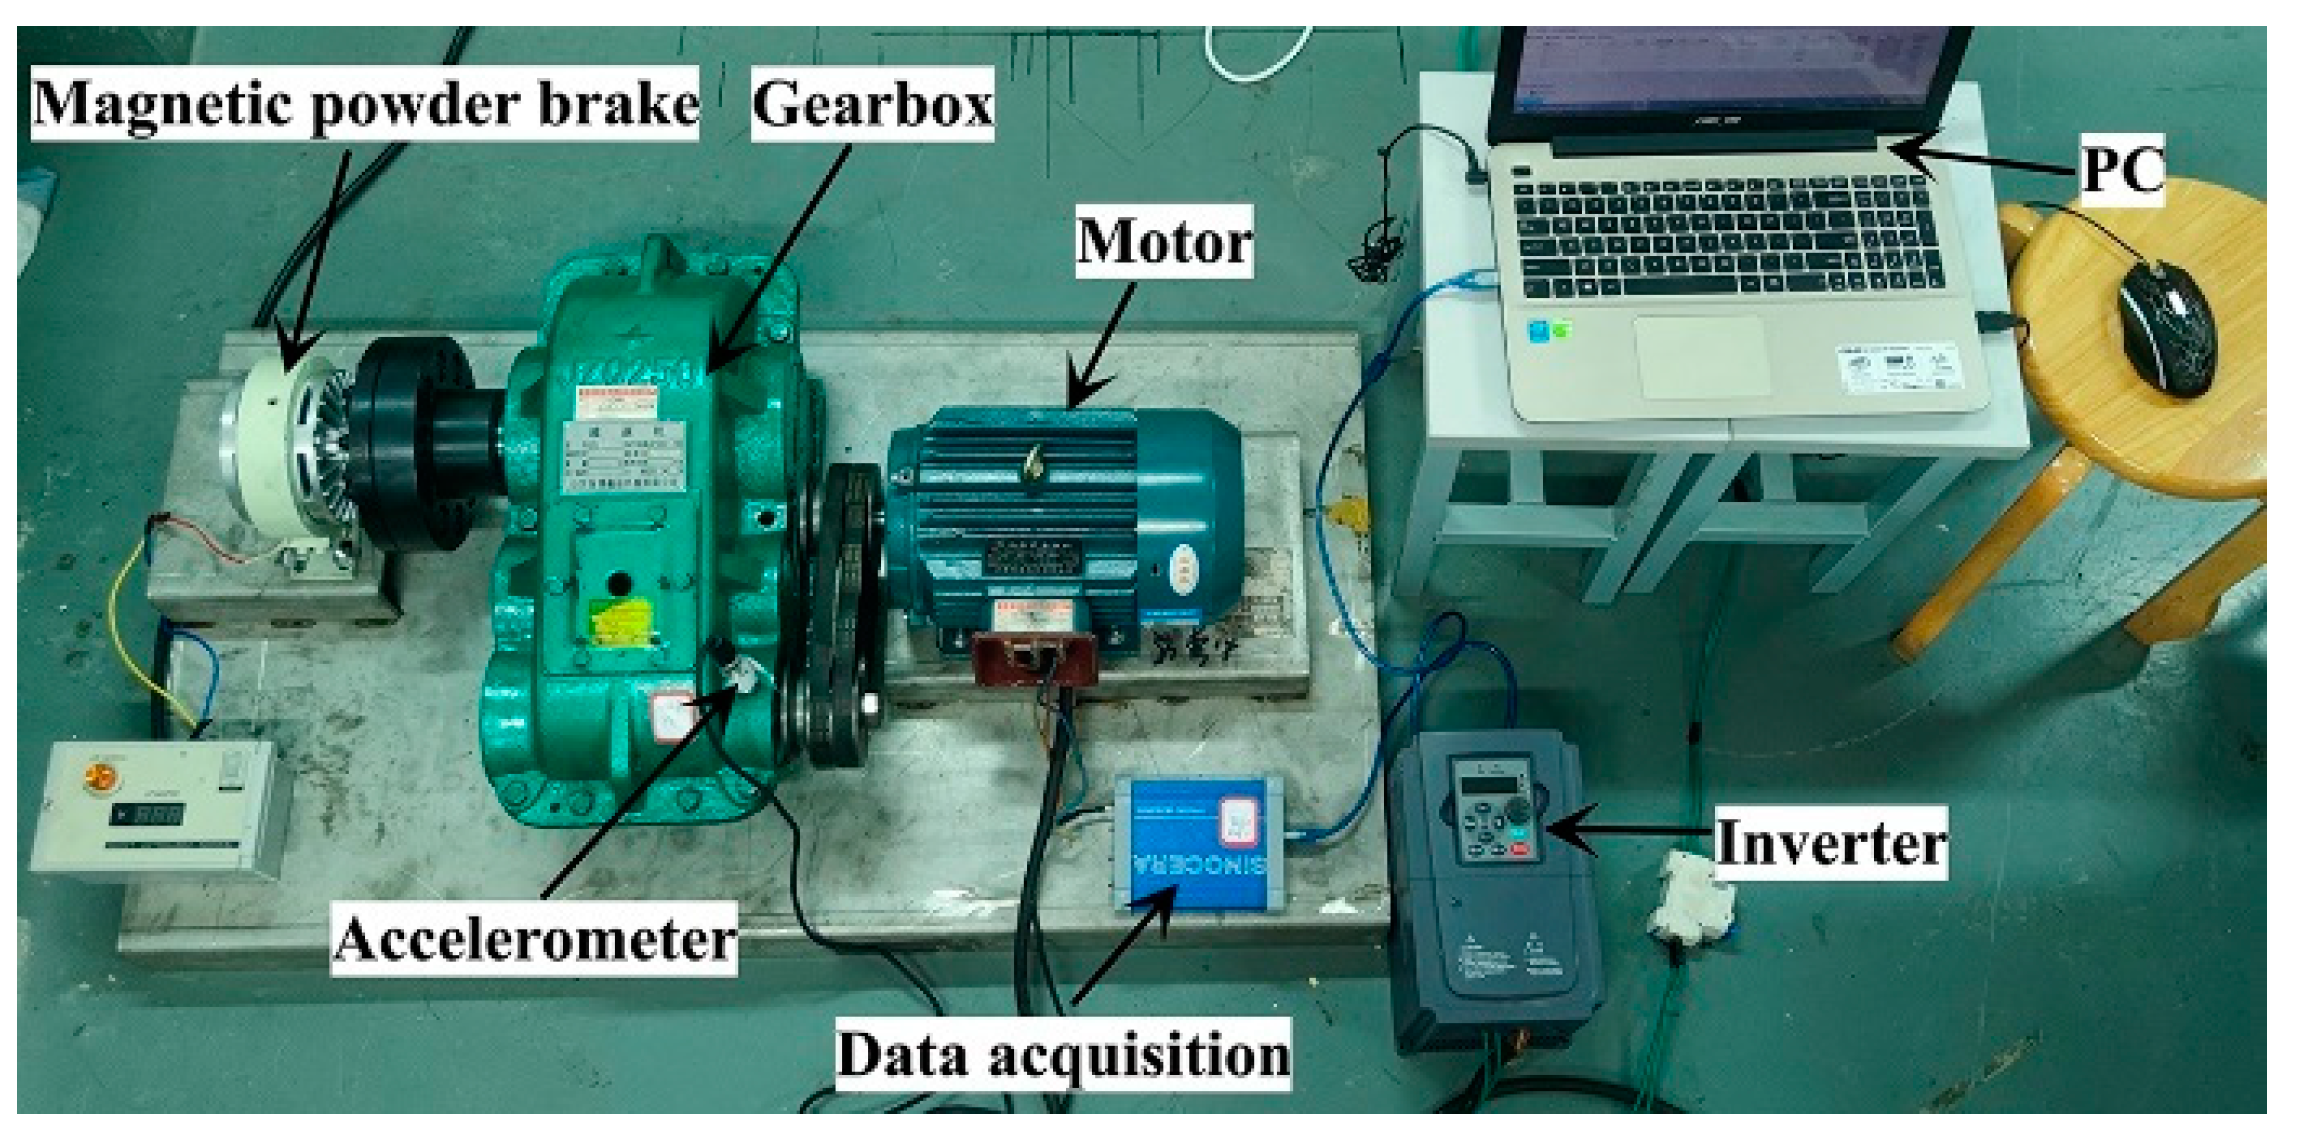
4. Experimental Platform for Rolling Bearing Failure in Agricultural Machinery
5. Results and Discussion
5.1. Vibration Signal Denoising Analysis
5.2. GST 2D Graph Conversion
5.3. Fault Diagnosis Results
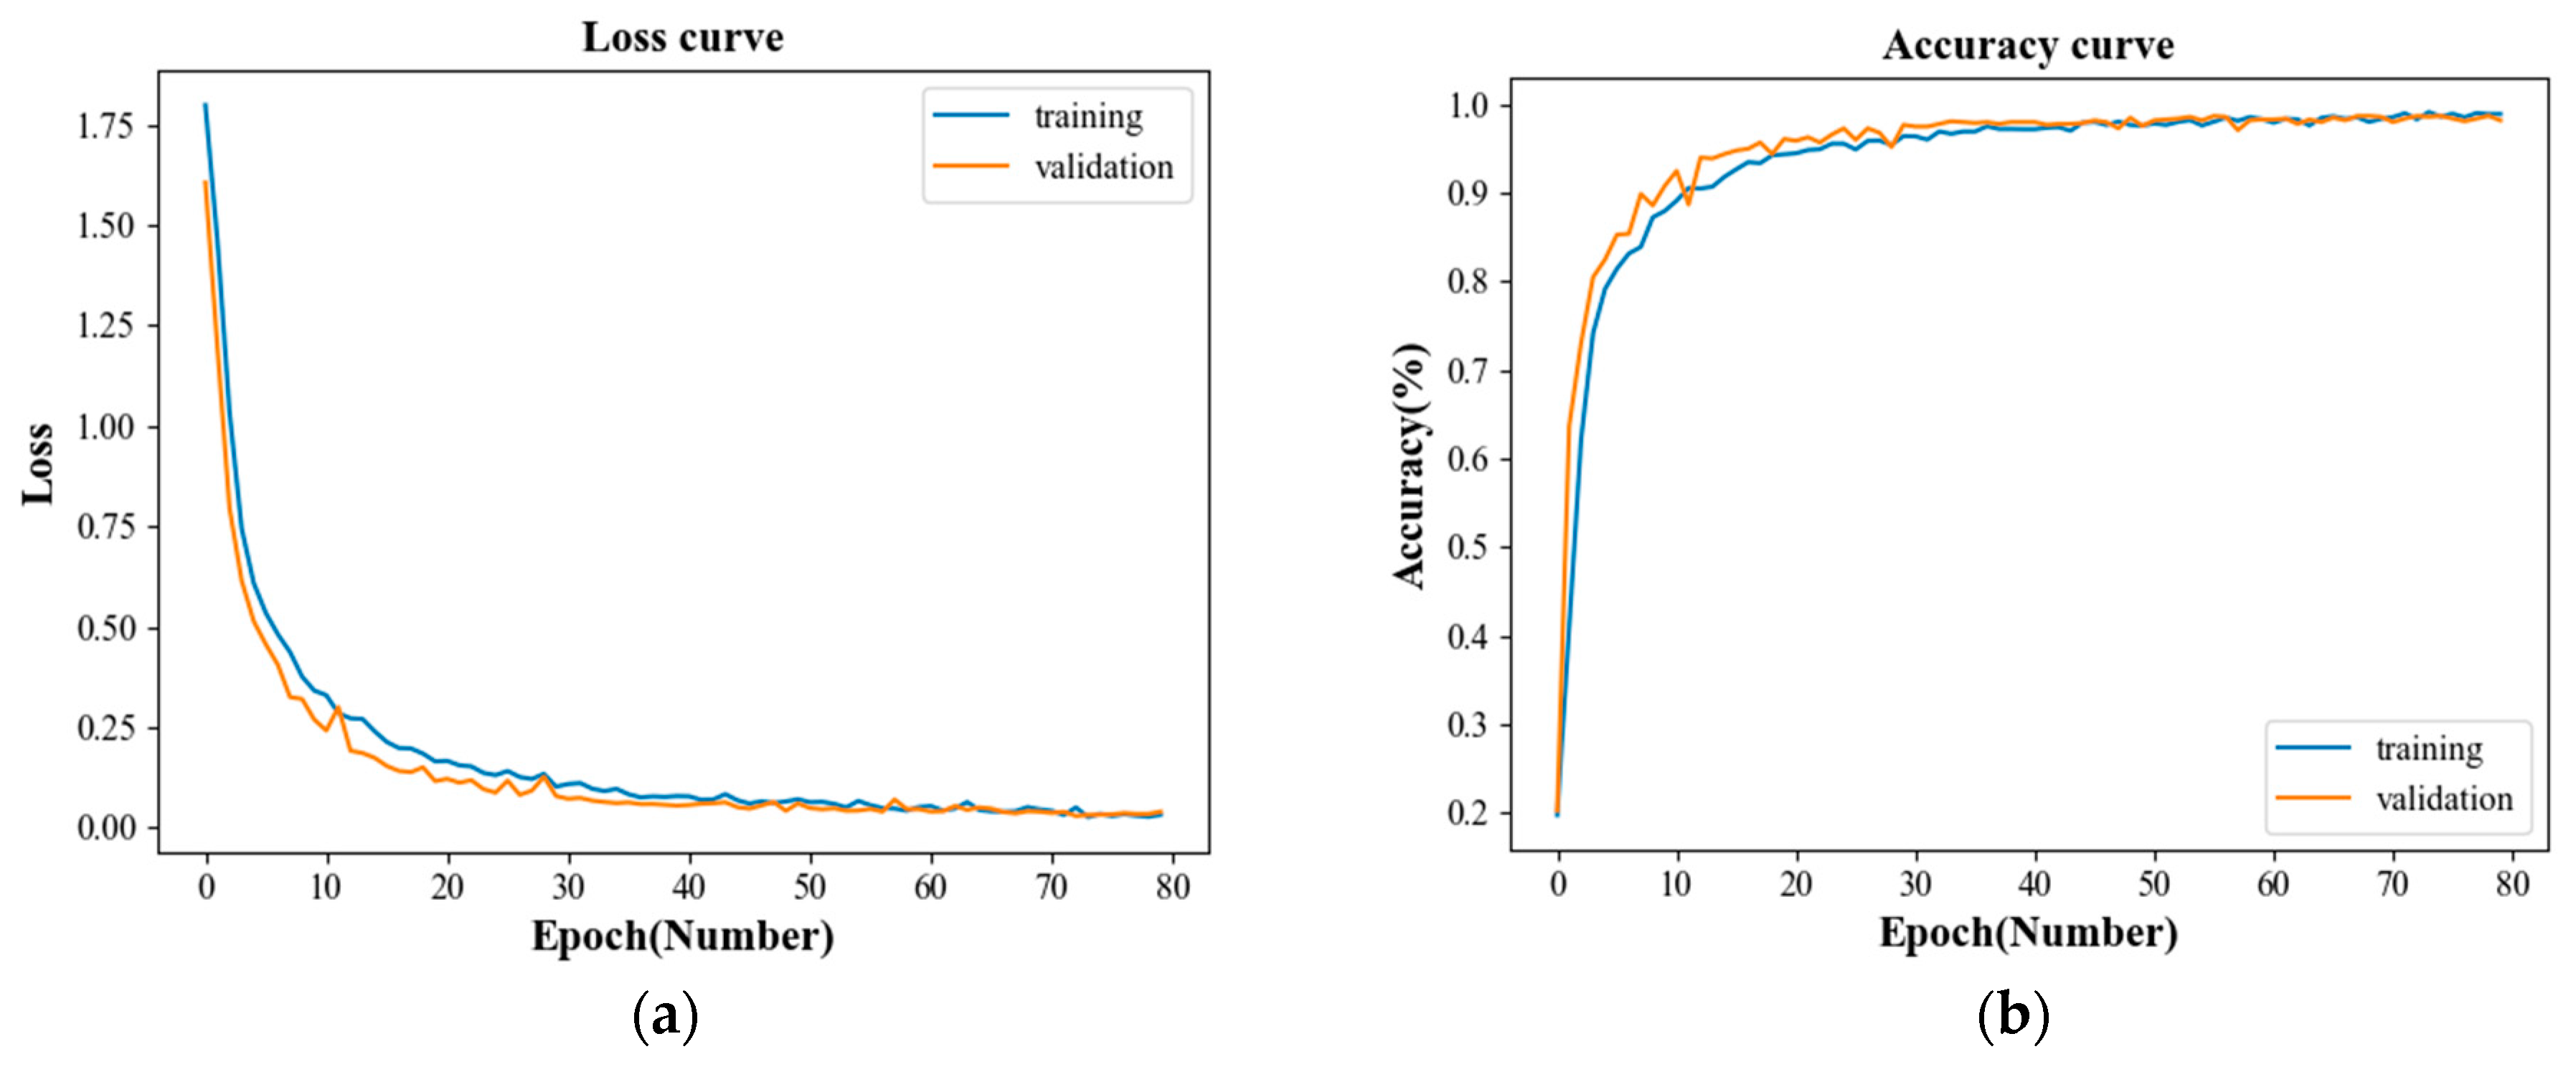
5.3.1. Fault Diagnosis Model Analysis
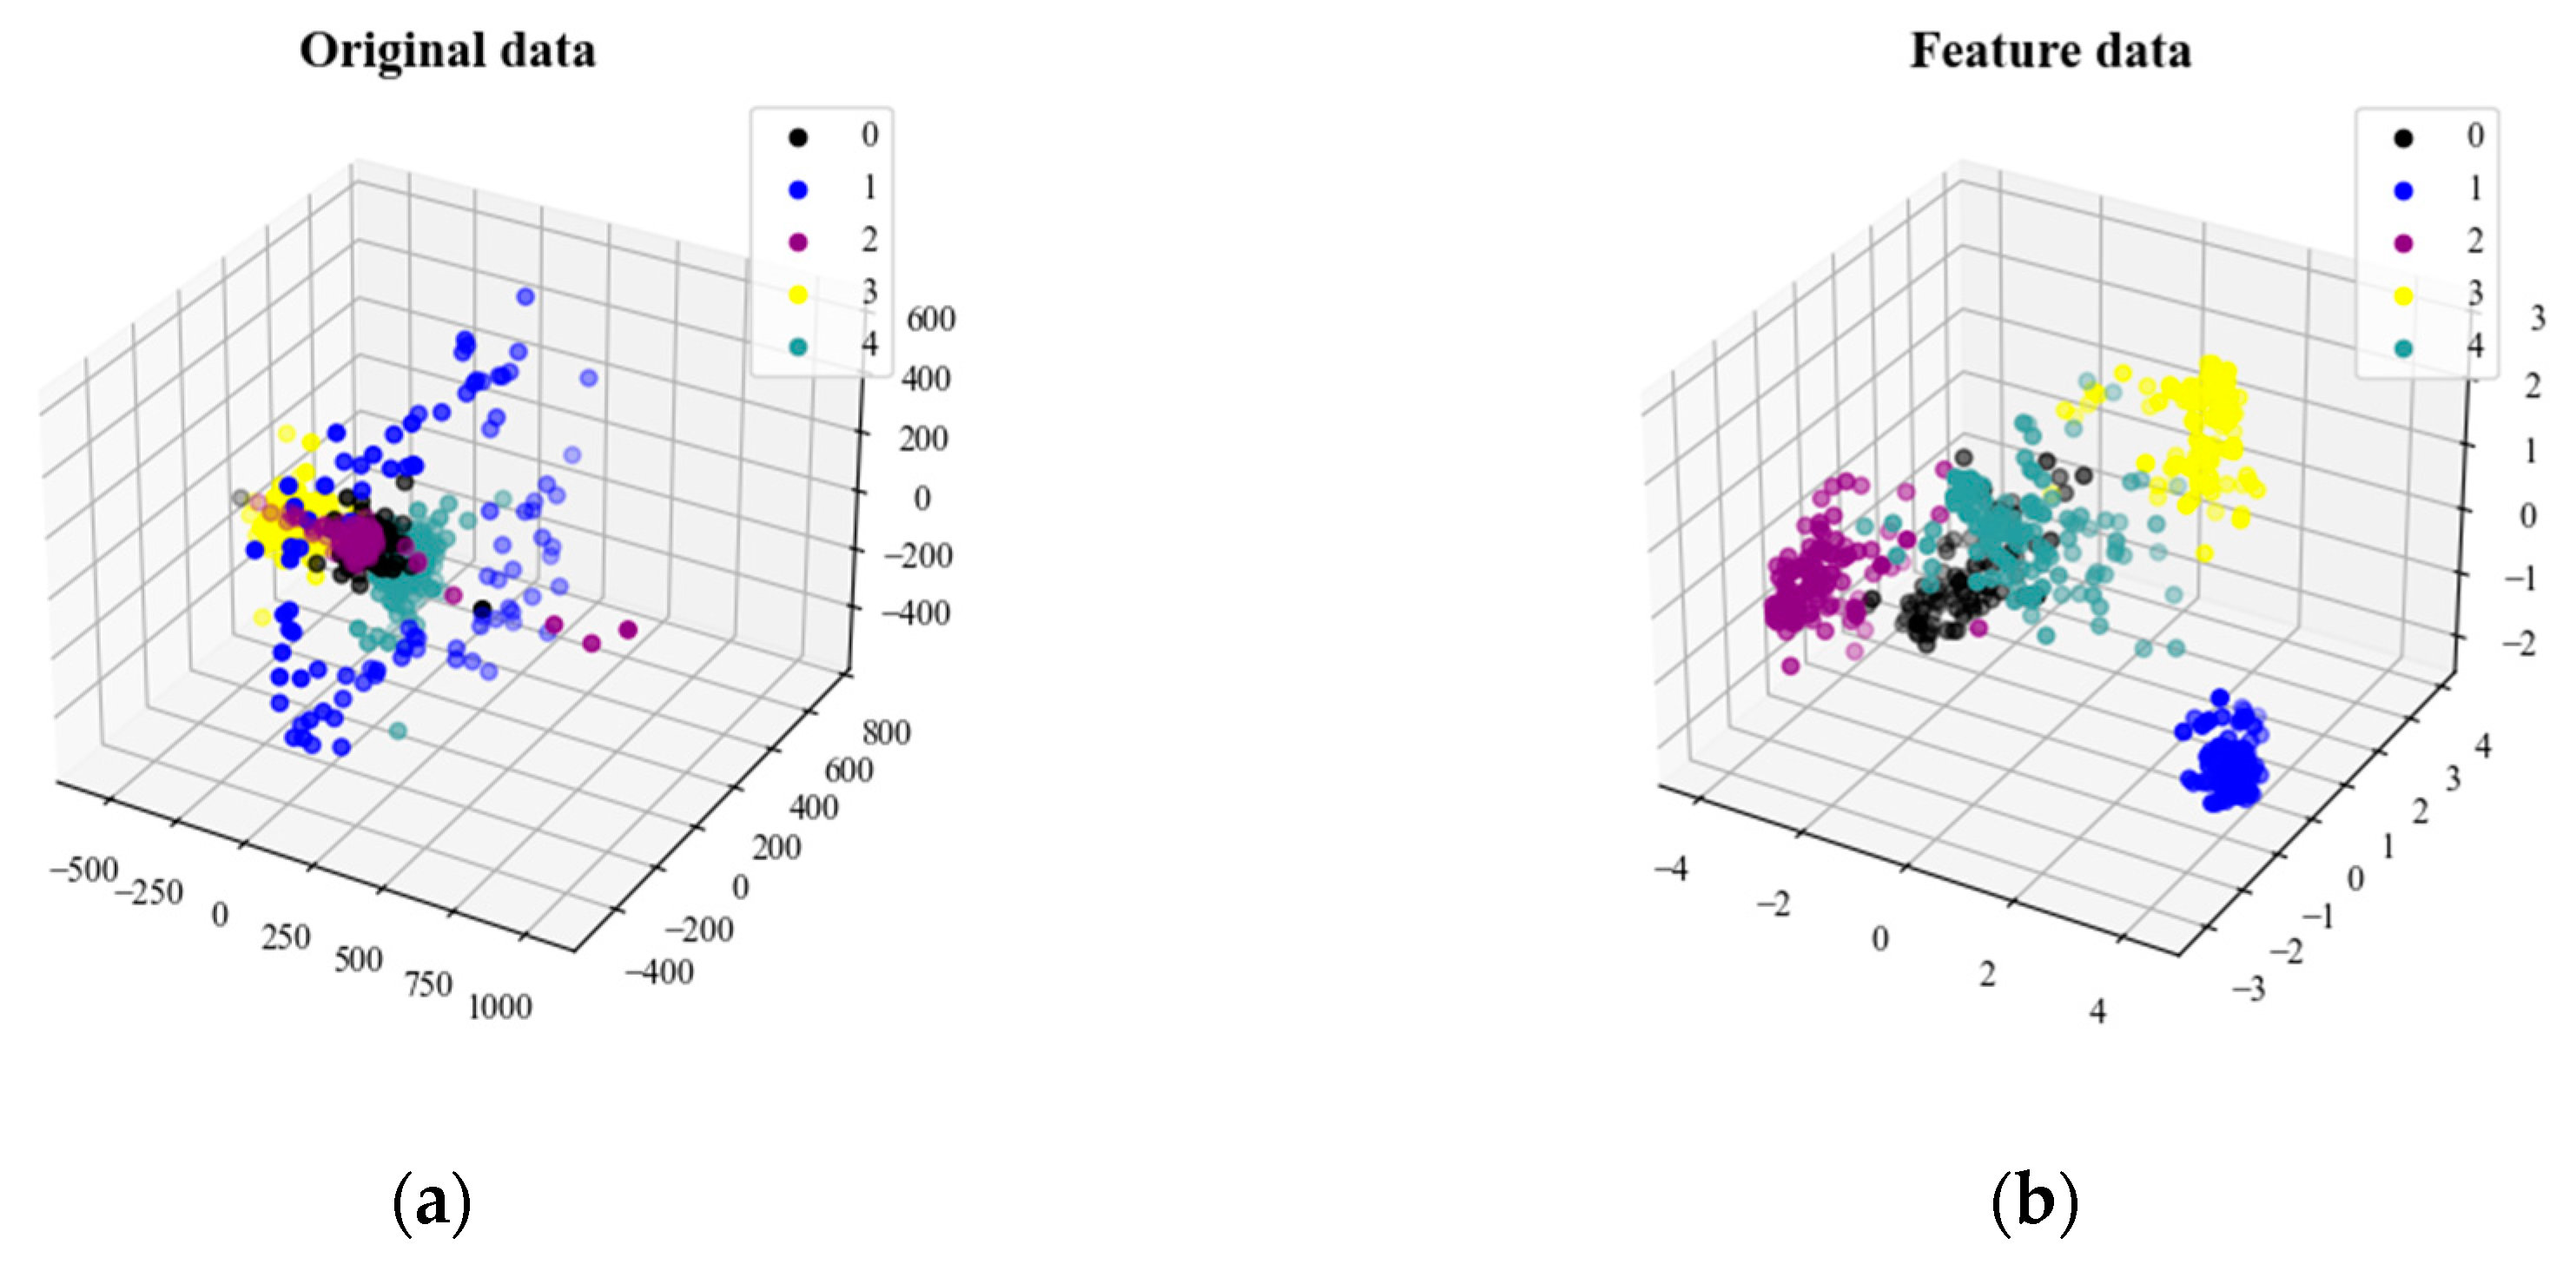
5.3.2. Feature Visualization Analysis
5.3.3. Result Analysis
5.4. Comparative Analysis
6. Conclusions
Author Contributions
Funding
Institutional Review Board Statement
Data Availability Statement
Conflicts of Interest
References
- Zhao, S.; Li, T.; Wang, G.; Zhang, Y. Adjustment of Meat Consumption Structure under the Dual Goals of Food Security and Carbon Reduction in China. Agriculture 2023, 13, 2242. [Google Scholar] [CrossRef]
- Li, C.; Wu, J.; Pan, X.; Dou, H.; Zhao, X.; Gao, Y.; Yang, S.; Zhai, C. Design and Experiment of a Breakpoint Continuous Spraying System for Automatic-Guidance Boom Sprayers. Agriculture 2023, 13, 2203. [Google Scholar] [CrossRef]
- Fargnoli, M.; Lombardi, M. Safety Vision of Agricultural Tractors: An Engineering Perspective Based on Recent Studies (2009–2019). Safety 2020, 6, 1. [Google Scholar] [CrossRef]
- Liu, Z.C.; Fang, L.L.; Jiang, D.; Qu, R.H. A machine-learning-based fault diagnosis method with adaptive secondary sampling for multiphase drive systems. IEEE. Trans. Power Electron. 2022, 37, 8767–8772. [Google Scholar] [CrossRef]
- Cao, H.R.; Shao, H.D.; Zhang, X.; Deng, Q.W.; Yang, X.K.; Xuan, J.P. Unsupervised domain-share CNN for machine fault transfer diagnosis from steady speeds to time-varying speeds. J. Manuf. Syst. 2022, 62, 186–198. [Google Scholar] [CrossRef]
- Rui, L.; Ding, X.X.; Wu, S.S.; Wu, Q.H.; Shao, Y.M. Signal processing collaborated with deep learning: An interpretable FIRNet for industrial intelligent diagnosis. Mech. Syst. Signal Process. 2024, 212, 111314. [Google Scholar] [CrossRef]
- Xie, F.Y.; Li, G.; Liu, H.; Sun, E.G.; Wang, Y. Advancing Early Fault Diagnosis for Multi-Domain Agricultural Machinery Rolling Bearings through Data Enhancement. Agriculture 2024, 14, 112. [Google Scholar] [CrossRef]
- Jiang, W.; Shan, Y.H.; Xue, X.M.; Ma, J.P.; Chen, Z.; Zhang, N. Fault Diagnosis for Rolling Bearing of Combine Harvester Based on Composite-Scale-Variable Dispersion Entropy and Self-Optimization Variational Mode Decomposition Algorithm. Entropy 2023, 25, 1111. [Google Scholar] [CrossRef] [PubMed]
- Liu, Z.Y.; Sun, W.L.; Chang, S.K.; Zhang, K.N.; Ba, Y.J.; Jiang, R.B. Corn Harvester Bearing fault diagnosis based on ABC-VMD and optimized EfficientNet. Entropy 2023, 25, 1273. [Google Scholar] [CrossRef]
- Fan, W.; Yang, C.X.; Chen, C.; He, C.B.; Yuan, Y.; Li, Y. Adaptive feature-oriented dictionary learning and sparse classification framework for bearing compound fault diagnosis. IEEE Trans. Instrum. Meas. 2024, 73, 1–10. [Google Scholar] [CrossRef]
- Mystkowski, A.; Wolniakowski, A.; Idzkowski, A.; Ciężkowski, M.; Ostaszewski, M.; Kociszewski, R.; Kotowski, A.; Kulesza, Z.; Kulesza, S.; Miastkowski, K. Measurement and diagnostic system for detecting and classifying faults in the rotary hay tedder using multilayer perceptron neural networks. Eng. Appl. Artif. Intell. 2024, 133, 108513. [Google Scholar] [CrossRef]
- Luo, Y.H.; Li, C.; Jiang, P.; Shi, Y.X.; Li, B.; Hu, W.W. Research on Tractor Condition Recognition Based on Neural Networks. Agriculture 2024, 14, 584. [Google Scholar] [CrossRef]
- Wang, R.C.; Jia, X.S.; Liu, Z.C.; Dong, E.Z.; Li, S.Y.; Chen, Z.H. Conditional generative adversarial network based data augmentation for fault diagnosis of diesel engines applied with infrared thermography and deep convolutional neural network. Eksploat. I Niezawodn. 2024, 26, 175291. [Google Scholar] [CrossRef]
- Dosovitskiy, A.; Beyer, L.; Kolesnikov, A.; Weissenborn, D.; Zhai, X.; Unterthiner, T.; Dehghani, M.; Minderer, M.; Heigold, G.; Gelly, S.; et al. An image is worth 16x16 words: Transformers for image recognition at scale. arXiv 2010, arXiv:2010.11929. [Google Scholar]
- Acheampong, F.A.; Nunoo-Mensah, H.; Chen, W.Y. Transformer models for text-based emotion detection: A review of BERT-based approaches. Artif. Intell. Rev. 2021, 54, 5789–5829. [Google Scholar] [CrossRef]
- Salamai, A.A.; Ajabnoor, N.; Khalid, W.E.; Ali, M.M.; Murayr, A.A. Lesion-aware visual transformer network for Paddy diseases detection in precision agriculture. Eur. J. Agron. 2023, 148, 126884. [Google Scholar] [CrossRef]
- Jamil, S.; Roy, A.M. An efficient and robust phonocardiography (pcg)-based valvular heart diseases (vhd) detection framework using vision transformer (vit). Comput. Biol. Med. 2023, 158, 106734. [Google Scholar] [CrossRef] [PubMed]
- Wang, Y.G.; Zhou, J. Research on bearing fault diagnosis under mixed working condition based on Vision Transformer hybrid model. In Proceedings of the International Conference on Computer Graphics, Artificial Intelligence, and Data Processing (ICCAID 2023), Qingdao, China, 1–3 December 2023. [Google Scholar]
- Wang, J.Y.; Mo, Z.L.; Zhang, H.; Miao, Q. A deep learning method for bearing fault diagnosis based on time-frequency image. IEEE Access 2019, 7, 42373–42383. [Google Scholar] [CrossRef]
- Wang, J.B.; Lu, Z.X.; Wang, G.M.; Hussain, G.; Zhao, S.H.; Zhang, H.J.; Xiao, M.H. Research on fault diagnosis of HMCVT shift hydraulic system based on optimized BPNN and CNN. Agriculture 2023, 13, 461. [Google Scholar] [CrossRef]
- Thi, T.X.C. Singular value decomposition and applications in data processing and artificial intelligence. HPU2 J. Sci. Nat. Sci. Technol. 2023, 2, 34–41. [Google Scholar]
- Lv, Y.; Zhang, Q.X.; Yuan, R.; Dang, Z.; Ge, M. Local lowest-rank dynamic mode decomposition for transient feature extraction of rolling bearings. ISA Trans. 2023, 133, 539–558. [Google Scholar] [CrossRef] [PubMed]
- Xie, F.Y.; Wang, G.; Zhu, H.Y.; Sun, E.G.; Fan, Q.Y.; Wang, Y. Rolling bearing fault diagnosis based on SVD-GST combined with vision transformer. Electronics 2023, 12, 3515. [Google Scholar] [CrossRef]
- Wang, H.W.; Fang, Z.W.; Wang, H.L.; Li, Y.A.; Geng, Y.D.; Chen, L.; Chang, X. A novel time-frequency analysis method for fault diagnosis based on generalized S-transform and synchroextracting transform. Meas. Sci. Technol. 2023, 35, 36101. [Google Scholar] [CrossRef]
- Cheng, H.; Zhang, Y.; Lu, W.; Yang, Z. A bearing fault diagnosis method based on VMD-SVD and Fuzzy clustering. Int. J. Pattern Recognit. Artif. Intell. 2019, 33, 1950018. [Google Scholar] [CrossRef]
- He, C.B.; Cao, Y.J.; Yang, Y.; Liu, Y.B.; Liu, X.Z.; Cao, Z. Fault diagnosis of rotating machinery based on the improved multidimensional normalization ResNet. IEEE Trans. Instrum. Meas. 2023, 72, 1–11. [Google Scholar] [CrossRef]
- Wen, L.; Li, X.Y.; Gao, L. A transfer convolutional neural network for fault diagnosis based on ResNet-50. Neural Comput. Appl. 2020, 32, 6111–6124. [Google Scholar] [CrossRef]
- Xu, Z.B.; Tang, X.Y.; Wang, Z.G. A multi-information fusion ViT model and its application to the fault diagnosis of bearing with small data samples. Machines 2023, 11, 277. [Google Scholar] [CrossRef]
- Liang, P.F.; Yu, Z.Z.; Wang, B.; Xu, X.F.; Tian, J.Y. Fault transfer diagnosis of rolling bearings across multiple working conditions via subdomain adaptation and improved vision transformer network. Adv. Eng. Inform. 2023, 57, 102075. [Google Scholar] [CrossRef]
- Hou, Y.D.; Wang, J.J.; Chen, Z.G.; Ma, J.L.; Li, T.Z. Diagnosisformer: An efficient rolling bearing fault diagnosis method based on improved Transformer. Eng. Appl. Artif. Intell. 2023, 124, 106507. [Google Scholar] [CrossRef]
- Diao, N.K.; Wang, Z.C.; Ma, H.X.; Yang, W.B. Fault diagnosis of rolling bearing under variable working conditions based on CWT and T-ResNet. J. Vib. Eng. Technol. 2023, 11, 3747–3757. [Google Scholar] [CrossRef]
- Liang, Z.G.; Zhang, L.J.; Wang, X.Z. A novel intelligent method for fault diagnosis of steam turbines based on T-SNE and XGBoost. Algorithms 2023, 16, 98. [Google Scholar] [CrossRef]


| Patch Size | Layers | Hidden Size D | MLP Size | Heads | Params |
|---|---|---|---|---|---|
| 14 × 14 | 12 | 768 | 3072 | 12 | 86M |
| Label | Rolling Bearing Condition | Motor Speed (r/min) | Length | Number of Data Sets | Sampling Frequency (Hz) |
|---|---|---|---|---|---|
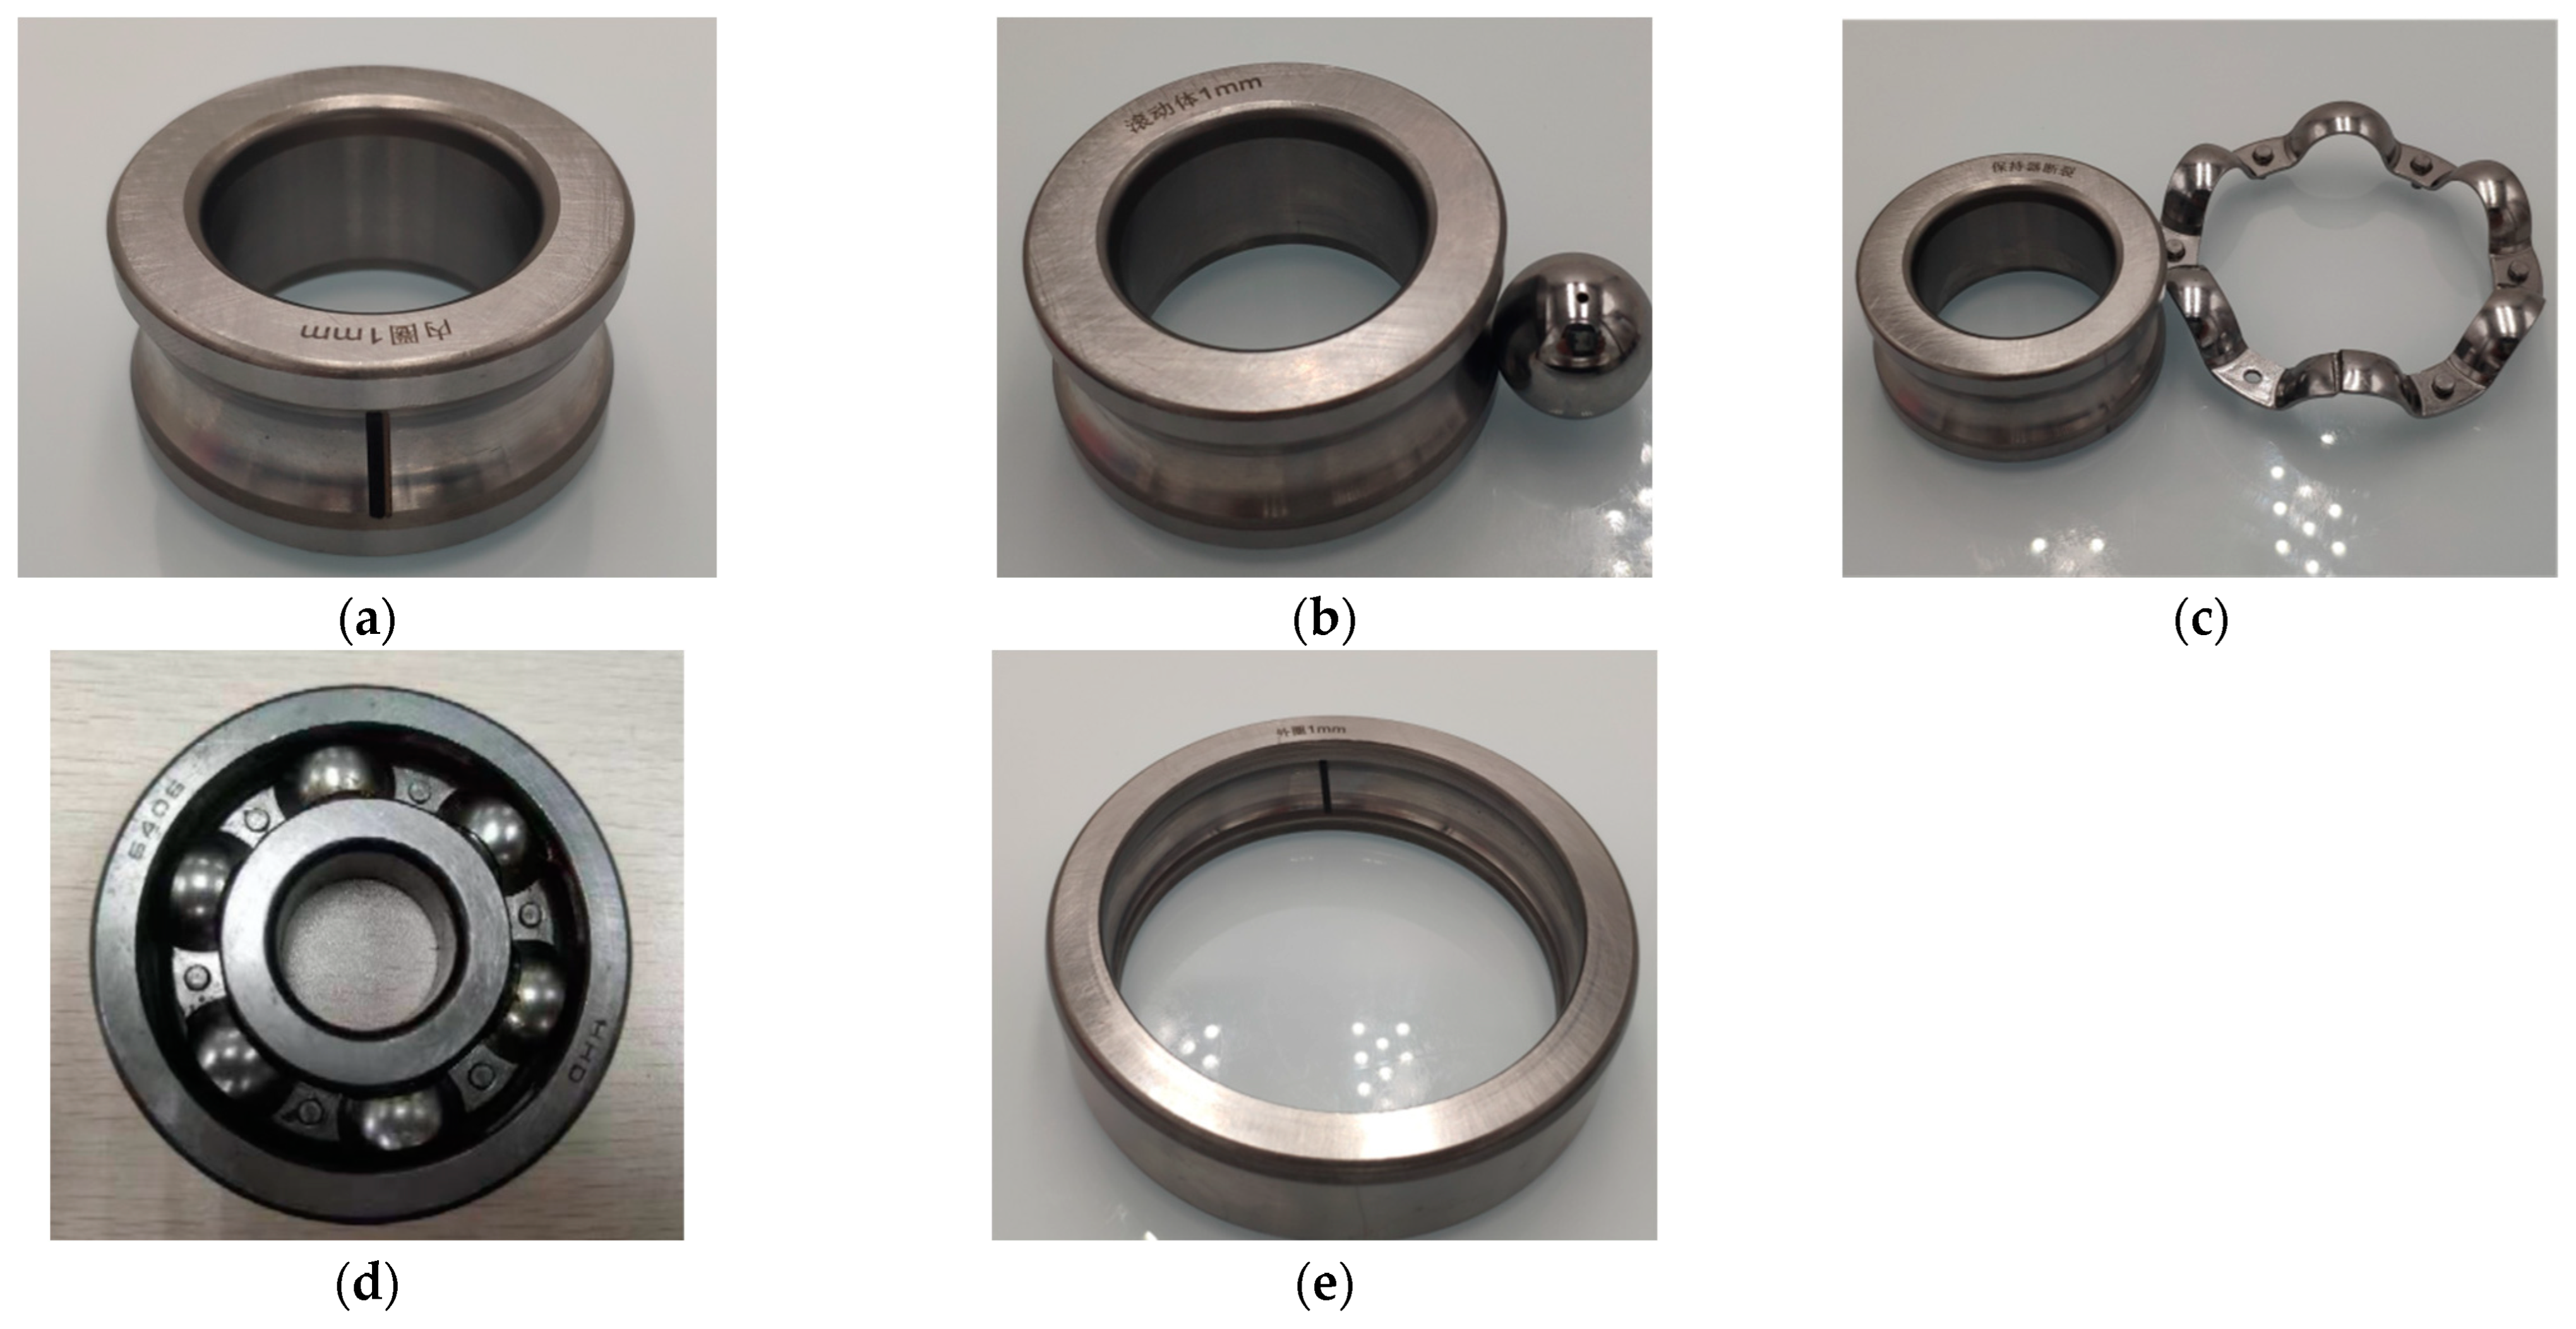
| 1 | Cage fracture | 900 | 1024 | 1000 | 6K |
| 2 | Normal | 900 | 1024 | 1000 | 6K |
| 3 | Inner raceway fault | 900 | 1024 | 1000 | 6K |
| 4 | Ball fault | 900 | 1024 | 1000 | 6K |
| 5 | Outer raceway fault | 900 | 1024 | 1000 | 6K |
| Rolling Bearing Condition | Training Set | Validation Set | Test Set | Label |
|---|---|---|---|---|
| Cage fracture | 700 | 200 | 100 | 0 |
| Normal | 700 | 200 | 100 | 1 |
| Inner raceway fault | 700 | 200 | 100 | 2 |
| Ball fault | 700 | 200 | 100 | 3 |
| Outer raceway fault | 700 | 200 | 100 | 4 |
| Total Array | 3500 | 1000 | 500 |
| Method | Average Accuracy (%) | Standard Deviation (%) |
|---|---|---|
| STFT-ViT | 95.58 | 0.7236 |
| SVD-EDS-GST-2DCNN | 95.24 | 1.2933 |
| SVD-EDS-GST-LSTM | 94.28 | 1.7863 |
| GST-ViT | 91.06 | 0.9834 |
| SVD-EDS-GST-ViT | 98.52 | 0.4266 |
| SVD-EDS-GST-ResViT | 99.08 | 0.4128 |
Disclaimer/Publisher’s Note: The statements, opinions and data contained in all publications are solely those of the individual author(s) and contributor(s) and not of MDPI and/or the editor(s). MDPI and/or the editor(s) disclaim responsibility for any injury to people or property resulting from any ideas, methods, instructions or products referred to in the content. |
© 2024 by the authors. Licensee MDPI, Basel, Switzerland. This article is an open access article distributed under the terms and conditions of the Creative Commons Attribution (CC BY) license (https://creativecommons.org/licenses/by/4.0/).
Share and Cite
Xie, F.; Wang, Y.; Wang, G.; Sun, E.; Fan, Q.; Song, M. Fault Diagnosis of Rolling Bearings in Agricultural Machines Using SVD-EDS-GST and ResViT. Agriculture 2024, 14, 1286. https://doi.org/10.3390/agriculture14081286
Xie F, Wang Y, Wang G, Sun E, Fan Q, Song M. Fault Diagnosis of Rolling Bearings in Agricultural Machines Using SVD-EDS-GST and ResViT. Agriculture. 2024; 14(8):1286. https://doi.org/10.3390/agriculture14081286
Chicago/Turabian StyleXie, Fengyun, Yang Wang, Gan Wang, Enguang Sun, Qiuyang Fan, and Minghua Song. 2024. "Fault Diagnosis of Rolling Bearings in Agricultural Machines Using SVD-EDS-GST and ResViT" Agriculture 14, no. 8: 1286. https://doi.org/10.3390/agriculture14081286