Abstract
Extensive traditional livestock systems currently face various threats, leading to their disappearance. An example of these extensive livestock farming systems is the production of the Lojeña sheep breed in the Sierra de Loja (Granada, Spain), with a census of 24,511 ewes in 2021. The aim of this work is to calculate the carbon footprint (CF) of this local breed in this region. This study is based on data collected from 27 Lojeña sheep farms producing weaned lambs (≤14 kg, 25 farms), fattened lambs (≈25 kg, 7 farms), culled animals (24 farms) and greasy wool (27 farms). Most of these farms (78%) were organically (ORG) certified and seven were conventionally (CONV) managed. The analysed farms represent 93% of the total number of farms producing Lojeña sheep in the Sierra de Loja. The CF was calculated with a “cradle to farm gate” approach. The average C footprints were 27.5 ± 6.8 kg CO2eq kgLW−1 for weaned lambs, 21.8 ± 8.5 kg CO2eq kgLW−1 for fattened lambs, 4.1 ± 2.6 kg CO2eq kgLW−1 for culled animals and 2.2 ± 0.6 kg CO2eq kg−1 for greasy wool, with a not statistically different average CF in ORG than in CONV farms. Enteric fermentation represents the main source of emissions (>60%) in all the products, and external feeding (including transport, and emissions from producing the feed) represents the second one (>10%). There was an inverse relationship between CF and productivity (lambs sold ewe−1 year−1), leading to lower footprints on those farms with the higher productivity. A direct relationship between CF and stocking rate (livestock units ha−1) has been identified.
1. Introduction
Extensive traditional livestock systems currently face various threats that could lead to their disappearance. These include a market that does not economically differentiate extensive and intensive livestock products, a lack of generational turnover, no official administrative definition, climate change, and a bad image due to greenhouse gas (GHG) emissions [1,2]. However, extensive livestock farming is crucial for climate change mitigation and provides various ecosystem services, such as fire prevention, the regulation of nutrient cycles through the incorporation of nutrients into the soil, and biodiversity conservation [3,4]. All these threats are connected to policies that have hindered the continuation of traditional livestock systems or altered the traditional flock. For example, the application of the European Common Agricultural Policy (CAP) subsidy per cow led many small ruminant farms to incorporate cattle, reducing sheep production and increasing overall stocking rates [5].
These changes are observed in Europe, where the ovine census has been reduced from 148,989,285 animals in 2000, to 119,949,047 animals in 2022, a 20% census reduction [6]. This tendency is seen in Spain too, where the total census of sheep was reduced from 23,965,000 animals to 14,452,590 animals, a 40% census reduction in the same period [6]. With fewer small ruminant farms each year, those that remain have more and more animals [7], which leads to the intensification of a traditionally extensive production. As an example, in Spain, the number of sheep farms was reduced from 68,975 in 2009 to 61,131 in 2020, while the average flock size has increased from a 240 ewe farm−1 to a 626 ewe farm−1 in the same period [7]. The average farm size increased from 34.1 ha in 2004 to 44.1 in 2021, a 29% increase. The average livestock unit (LU) per farms rose from 20.4 in 2004 to 40.6 in 2021, a 99% increase. Consequently, the stocking rates increased from 0.6 to 0.92 LU ha−1 during this period [8].
The intensification of livestock systems does not necessarily mean the total abandonment of grazing. However, it can lead to exceeding the carrying capacity of grasslands and the overexploitation of the territory, which often prevents the vegetation from fulfilling its biological cycles. This situation could result in ecosystem degradation and increased dependence on external feed (compound feed), primarily produced from imported commodities [9,10]. This high dependence on external feed reduces farm autonomy and poses a great threat to the food security when international crisis situations occur [11,12].
Pasture-based livestock production systems have mainly developed on lands that are difficult to access or to cultivate. They have made it possible to produce high quality food (meat and milk) [13] in areas that could not be used in any other way. Additionally, many of these areas are of high nature value and are often part of conservation networks, such as the European Natura 2000 Network [4].
An example of the relationship between extensive livestock farming and territory can be seen in the Sierra de Loja, located in the province of Granada (Spain), and the origin of the Lojeña sheep breed [14]. This breed has evolved and is currently raised in this region. According to current Spanish regulations, it is considered “threatened” [15]. The Lojeña is a meat breed raised extensively on the communal pastures of the Sierra de Loja (translated as Loja Mountain Range). This area mainly covers three municipalities in the province of Granada (Loja, Zafarraya, and Alhama de Granada). Even though the Lojeña breed is not highly productive (in meat or wool), it is the only breed adapted to the hilly mountains in the territory and allows the communal pasture conservation, which would disappear without this livestock. The breed’s survival in its traditional system is crucial for the environmental conservation of the pastures in the Sierra de Loja, where the entire current census is pasture-based.
An internationally accepted methodology to calculate the environmental impact of a product or process is the life cycle assessment (LCA), which includes the carbon footprint (CF) [16]. LCA gives a comprehensive view of all the impacts associated with the different phases of production, including the production of inputs (such as animal feed) [17].
Based on the previous information, our working hypothesis proposes that despite the lower performance of the Lojeña sheep breed in an extensive range of relatively unfavourable extensive-range conditions, the carbon footprint is similar to more intensified sheep production systems because of the lower dependence of supplementary feed inputs. Additionally, to our knowledge, this is the first time that such a comprehensive study has been carried out on a high percentage of the census of a breed, covering its original territory. The primary aim of this work is to calculate the CF of most farms with Lojeña sheep herds in Sierra de Loja, analyse the effect of the management system (organic vs. conventional), and identify effective mitigation strategies.
2. Materials and Methods
This study involved conducting interviews with farmers to perform a LCA and calculate the CF of their farms; in accordance with this aim, it was reviewed and approved by the Universidad de Córdoba. All participants were informed about the purpose of the study and voluntarily agreed to participate. Confidential information, including personal and farm-related data, was handled with strict confidentiality and has not been disclosed publicly.
2.1. System Characterisation
2.1.1. Location Description
The farms were in the Sierra de Loja (Granada) [longitude: −4.15, latitude: 37.17] (Figure 1). This mountain range of about 18,000 ha and with a maximum altitude of 1669 m is a homogeneous massif formed by limestone materials, characterised by rugged terrain, with scarce soil and sparse tree cover. The climate offers significant contrasts, and average rainfall ranging from 300 to 700 mm among different areas. The pasture is scarce but sufficient for a small-sized sheep capable of raising a lamb per year under unfavourable conditions [18,19]. The photoperiod of the region ranges between 9 h, 35 min (winter solstice, December) to 14 h, 43 min (summer solstice, June).
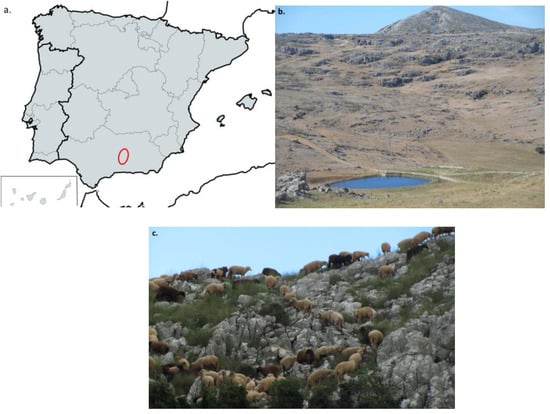
Figure 1.
Sierra de Loja. (a) Location in Spain (red circle); (b) panoramic view of the mountains; (c) sheep flock grazing in the mountains.
2.1.2. Breeding System Description
The productive system of the Lojeña is oriented mainly toward the production of lambs, either up to weaning or fattening, and wool, a low-profit product, is sold to small processors who demand it. Its reproductive management is traditional, preventing mating by keeping the males apart. The sheep do not present a marked seasonal reproductive pattern; summer lambing is avoided, and the main lambing season is spring, followed by autumn, so that the time of the highest feed needs of the flocks coincides with the time of more fodder in the field [20]. The farms usually have management facilities (small indoor pens) for the lambing season when these ewes are housed.
The lambs remain with their mothers until weaning, usually occurring after 70 days and reaching 15 kg of live weight (LW). The lambs can be fattened on the same farms where they were born or sold to feedlots and classification centres to be fattened until slaughtering (4 months of life and an average commercial weight of 22 kgLW).
The feeding system is highly dependent on mountain Mediterranean pastures, which are consumed directly during grazing. Supplementation, mainly with mixtures of grain and hay, is common in all farms, especially for lactating ewes, which have higher requirements. Supplementary feeding is provided mainly during periods of pasture scarcity, such as summer and early autumn.
During the lambing season, while the animals are stabled, the excreta are managed as “solid storage”, according to the definition given by the IPCC [21]. Thus, the manure includes the bedding material, which are removed twice a year. For the rest of the time, there is no manure management, as the animals excrete on pastures.
2.1.3. Functional Unit and System Boundaries
The functional units were defined based on the type of products from the sampled farms, with the ages and weights provided representing the averages for these farms. As a result, the different functional units used are as follows:
- Weaned lamb: 1 kgLW of a lamb sold at 13.7 kgLW and 70 days of life.
- Fattened lamb: 1 kgLW of a lamb sold at 25 kgLW and 120 days of life.
- Culled animals: 1 kgLW of a non-productive adult animal sent to a slaughterhouse.
- Wool: 1 kg of greasy wool.
The system boundaries are “cradle to farm gate”, which include pre-farm and on farm emissions. These emissions are related to feed production, electricity, fuel, and machinery use, as well as animal-related emissions (enteric fermentation, manure management and manure deposition in soils) (Figure 2).
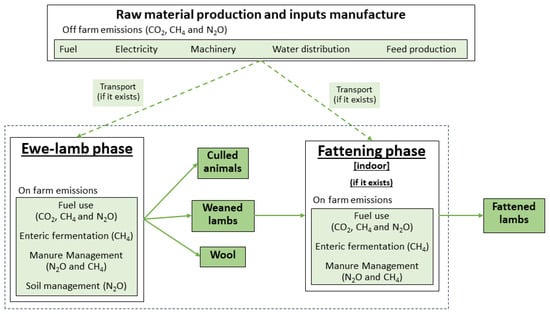
Figure 2.
System boundaries and processes included in the life cycle assessment of Lojeña sheep.
2.1.4. Data Collection
Data were collected from 27 Lojeña sheep farms, representing 93% of the total number of farms producing this local breed and 18.5% of small ruminant census in Sierra de Loja [7]. The data were collected between 2022 and 2023, and the reference year was 2021. Some farms sold different products at the same time (weaned labs and fattened lambs), with seven farms producing fattened lambs in the same farm, and twenty-five producing weaned lambs; all the farms produced wool. Most of the farms (21, 77.8%) were certified as organic (ORG) and only six (22.2%) were conventionally (CONV) managed; so, 76.8% of the sheep population was organically raised.
Direct interviews with farmers were conducted to obtain the data. These included questions about different aspects of farm facilities (surface [ha], a description of the pens, use of the water tap [litres], electricity consumption [kWh], and vehicle use [km]), farm location, animal handling, flock structure (number of ewes, rams and reposition), stocking rate, animal feeding (quantity [kg] and the kind of feed [silage, compound feed, straw, by-products…] provided to animals, specifying their category [ewes, rams, lambs]), and productive data (number of animals sold in each category, their weight [kg] and their age, and the quantity of wool produced [kg], and other production [kg] if applicable). The amount of pasture grazed by the animals was calculated based on the daily requirements of dry matter intake and the contribution of external feed inputs. The voluntary dry matter intake of adult sheep was calculated according to the data reported by Garry et al. [22], with the average DM intake for an adult sheep being 2.36% of their body weight. With the total amount of animal feeding provided, the average daily diet is calculated and, using the calculation of the daily dry matter intake, the amount not covered by the feeding provided was assumed to be covered by grazing. The pasture consumed by lambs before weaning was not considered for the calculation of enteric fermentation emissions. Livestock Units (LUs) were calculated according to MARM [23] and were used to characterise the stocking rate (Table S1).
2.1.5. Statistical Analysis
IBM SPSS® Statistics version 22 software (IBM Corp., Armonk, NY, USA) was used to perform the statistical analyses. The studied farms were categorised into groups according to their productivity in terms of lamb sold ewe−1 year−1: the 75th percentile (farms with the highest productivity), the 25th percentile (farms with the lowest productivity), and the remaining farms. Additionally, farms producing weaned lambs were categorised according to their GHG emissions: the 75th percentile (farms with the highest GHG emissions), the 25th percentile (farms with the lowest GHG emissions), and the remaining farms.
To compare groups, parametric tests were applied. Specifically, ANOVA (Analysis of Variance) was performed, followed by the Student–Newman–Keuls or SNK test, as a post hoc analysis to identify which specific groups differed from each other. Different letters (a, b, c) were used to indicate significant differences between groups. Finally, parametric tests were applied to compare organic and conventional management systems. Specifically, a Student’s t-test was used to analyse the distribution of differences between organic and conventional management in the studied farms.
2.2. Estimation of GHG Emissions
The GHG emissions assessed were as follows: CH4 from enteric fermentation; both CH4 and N2O from manure management; N2O from excreta deposited on soil; emissions associated with the production and transport of external feed; on-farm energy consumption; and the production of machinery. These emissions were converted to kilograms of CO2 equivalent (CO2 eq) using the IPCC’s global warming potential values of 27 for biogenic CH4 and 273 for N2O [24].
To estimate CH4 emissions from enteric fermentation, Tier 2 equations from the 2019 revision of the IPCC guidelines [21] were utilised, with calculations based on the gross energy content of the feed ration. Feed composition values (Table S2) were provided by the leading feed supplier in the region and the nutritional values used for the calculations were taken from national [25,26] and international [27] databases. The CH4 conversion factor was calculated based on the equation provided by Cambra-López et al. [28] (Equation (1)).
where Ym refers to the CH4 conversion factor (% of gross energy in feed converted to CH4), and DE to digestible energy (%).
The emissions from manure management, including CH4 and N2O, were calculated using the IPCC Tier 2 approach from the IPCC guidelines [21]. Data from the Spanish national GHG inventory [29] were utilised to complete these calculations (Table S3). The methodology for these calculations has been detailed previously in Reyes-Palomo et al. [30,31].
Greenhouse gas emissions from the production of external feed input include raw material production, transport and compound feed manufacture. For raw materials, emission factors were selected based on import rates from the 2016–2020 FAOSTAT data [6]. Imported product emission factors were sourced from Agrifootprint 4.0 [32] with SimaPro version 9.0.0.49 PhD software (PRé Consultants, Amersfoort, The Netherlands) using the ReCiPe 2016 Midpoint method. In the case of domestically produced inputs, including organic feed, Spanish-specific emission factors were applied [33]. Emissions related to energy and machinery use were derived from Ecoinvent 3 [34] and ELCD [35].
C sequestration has not been calculated due to the lack of a previous soil analysis, and the fact that applying the IPCC Tier 1 approach would not be appropriate because the Lojeña farming system has not had management changes in the last few decades.
2.3. Allocation
As there was more than one livestock species on most farms, economic allocation (Tables S4 and S5) was used to calculate the indistinguishable emissions of each species, such as machinery use or electricity consumption [36].
2.4. Sensitivity Analysis
A different scenarios sensitivity analysis was carried out to test the effect of the decision process in this study. The different scenarios compared to the based case, which was explained in the previous subsections, were as follows:
- The effect of not differentiating between organic and conventional feed inputs emissions factor
- The use of default Tier 1 emission factors for enteric and manure management emissions.
- The use of the mass allocation method, which allocates emissions based on the fresh weight of the product, regardless of whether the product is weaned, fattened lamb or culled animals’ live weight, or wool.
3. Results
3.1. Inventory Analysis
The technical characterisation of the studied farms is shown in Table 1, and the information for ORG and CONV farms is shown in Table S6. Ewes remain in pastures most of the time, except during lactation (20% of the year on average). The farms studied have a wide range of areas, ranging from 150 to 2 500 ha. Lambs are raised in indoor pens during the fattening phase. The reproduction performance is 0.96 ± 0.16 parities ewe−1 year−1 and 1 ± 0.2 lambs born ewe−1 year−1. Supplementary food is provided to the grazing animals at some time during the year on all farms (mainly summer, when pasture is scarce).

Table 1.
Descriptive and productive data of the Lojeña sheep farms studied in Sierra de Loja.
The 75th percentile of farms, according to their productivity, show significant differences in reproductive data compared to the rest of the groups (Table 2). The fertility rate of the 75th percentile farms is 16% higher than that of the lower 25th percentile; similarly, parities ewe−1 year−1 is 53% higher in the 75th percentile group than in the lower 25th percentile. The number of lambs sold differs by 26% between the 75th percentile and the remaining farms’ group, but it increases to 80% more lamb sold ewe−1 year−1 in the 75th percentile than in the lower 25th percentile.
Table 2.
Comparison of descriptive and productive data from the 75th percentile farms ordered by productivity (lamb sold ewe−1 year−1), the lower 25th percentile and the rest of farms.
3.2. Greenhouse Gas Emissions
The average CF of the different products sold by the different farms were: 27.5 ± 6.8 kg CO2eq kgLW−1 for weaned lambs, 21.8 ± 8.5 kg CO2eq kgLW−1 for fattened lambs, 4.1 ± 2.6 kg CO2eq kgLW−1 for culled animals and 2.2 ± 0.6 kg CO2eq kggreasy wool−1 (Table 3). Most of the emissions were related to enteric fermentation, accounting for 72% for weaned lamb, 67.4% for fattened lambs, 77.4% for culled animals and 73.6% in wool. No differences (p > 0.05) were found between ORG and CONV products.
Table 3.
GHG emissions (kg CO2eq kgFU−1) of the different products from the studied Lojeña farms showing the different sources of emissions differentiating the organic and conventional results.
An inverse relationship (p < 0.01) was identified between CF and productivity (lamb sold ewe−1 year−1), and a direct relationship (p < 0.05) was found between CF and the stocking rate (Figure 3). However, these relationships were not significant when ORG and CONV farms were separately analysed.
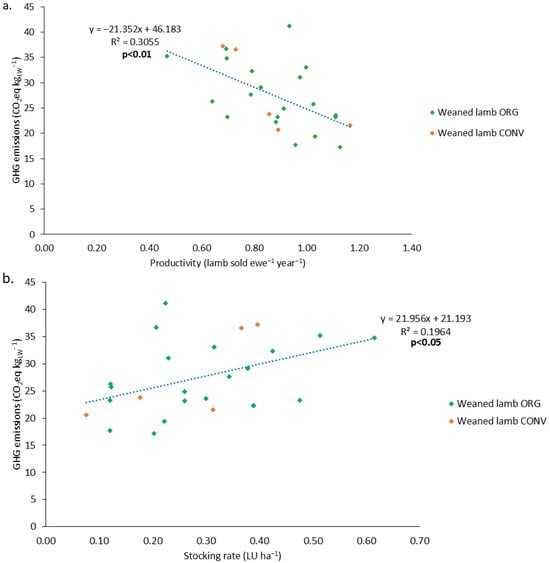
Figure 3.
Relationship between greenhouse gas (GHG) emissions of weaned lambs and (a) productivity; (b) stocking rate. (LW: live weight; LU: livestock units; ORG: organic; CONV: conventional).
When categorising farms by their weaned lamb CF into the lower 25th percentile, the 75th percentile, and the remaining farms, significant differences were found in the fertility and prolificacy parameters. These parameters were higher in farms with a lower CF than in the other groups (Table 4).
Table 4.
Comparison of descriptive and productive data from the lower 25th percentile farms ordered by carbon footprint (kg CO2eq kgLW−1), the 75th percentile and the rest of farms.
3.3. Sensitivity Analysis
To determine if differences in CF arose from decisions made during the calculation process, several key assumptions were tested against the base case scenario performed in this study. One assumption examined was whether using different emission factors for organic and conventional feed raw materials would affect the results. The analysis showed no differences (p > 0.05) (Figure 4).
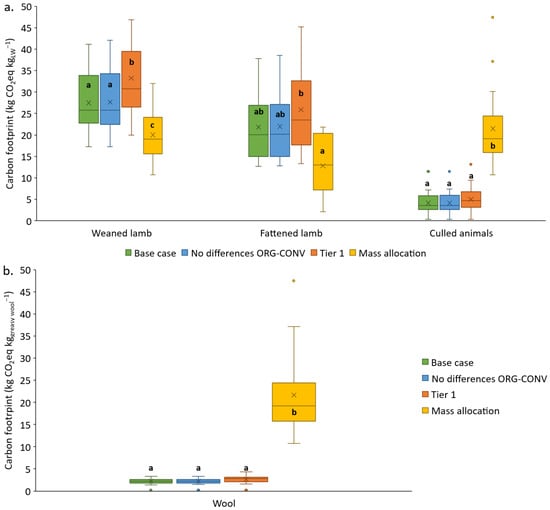
Figure 4.
Comparison of the effects of the different scenarios of calculations for the carbon footprint of products from Lojeña sheep farms (Base case: the calculations explained in this paper; No differences organic and conventional (ORG-CONV): no differences between the emissions factors of organic and conventional feed inputs; Tier 1: use of default values; mass allocation: indistinguishable emissions distributed according to mass allocation). (a) Lambs´ products and culled animals; (b) wool. LW: live weight. a–c letters indicate significant differences between groups. The whiskers represent the zero (0% percentile) and the fourth quartile (100% percentile), the box is represented between the first (25% percentile) and third quartile (75% percentile), the horizontal bar in the box represents the median (50% percentile) and the X represents the mean.
The availability of specific data can significantly impact the calculation of livestock emissions. As illustrated in Figure 4, using Tier 2 data, which include specific information, such as the digestibility and the neutral detergent fibre content of the feed ration, resulted in a lower CF (p < 0.05) compared to using default Tier 1 values. Tier 1 values use generic default emission factors, such as those for enteric fermentation, without considering specific feed characteristics. This trend was consistent across all the studied products, including weaned lambs, fattened lambs, culled animals and greasy wool.
Another consideration was the impact of mass allocation on CF. While it slightly reduced the CF for lamb products, with no differences (p > 0.05) for fattened lambs, it resulted in differences (p < 0.05) for weaned lambs, culled animals, and wool, ultimately increasing the CF for the latter two (Figure 4 and Table S7).
4. Discussion
4.1. Greenhouse Emissions
In a recent review of sheep production LCA, the identified range of emissions for lamb meat was between 3.6 and 25.9 kg CO2eq kgLW−1 and between 2 and 5 kg CO2eq kg greasy wool−1 [37]. The wide ranges shown by previous studies are similar to those in the present study, so the original hypothesis is not rejected. The variability in the CF of weaned lambs is related to the different management practices and productive systems identified in the sheep production [37]
Considering the wide variability in the CF of the different farms, the average result for fattened lambs of this study agrees with previous results. Ripoll-Bosch et al. [38] reported a CF of 13.9, 17.7 and 19.9 kg CO2eq kgLW−1 for 22 kgLW lambs raised in the north of Spain, in pasture-based, mixed and intensive systems, respectively. Additionally, Eldesouky et al. [39] reported 14.06 kg CO2eq kgLW−1 for 90 days of live lambs in dehesa systems. Moreover, comparisons between LCA studies are difficult due to methodological differences, such as the functional unit analysed [40,41], the allocation method [38,42], and the global warming potential factor of the different gases [38,43].
In agreement with other LCA studies about lamb production [37], CH4 emissions from enteric fermentation were the greatest source of GHG emissions, independent of the products studied in those farms. These emissions are dependent on the digestibility of the diet [38]. Therefore, the CH4 emissions decrease when the animals are kept in intensive systems and eat compound feed (such as in the fattening phase), because the diet is more digestible than the pasture-based diet. However, the emissions related to compound feed production and transport increase in those systems. At this point, it is necessary to consider that ruminants can produce high quality protein while eating sources that are not edible by humans [38].
However, many of these works present methodological shortcomings in their calculations, mainly due to the fact that they do not consider the inclusion of carbon (C) sequestration [44], thereby biasing the results in favour of intensive systems [45]. The main limitation of the current study is that carbon sequestration has not been calculated due to the lack of previous soil analyses. Additionally, using the IPCC Tier 1 approach would be inappropriate because the Lojeña farming system has not undergone management changes in recent decades. Nevertheless, in recent years, there is a trend to consider C sequestration within CF studies [46,47], obtaining results that show how, in some cases, C sequestration can significantly reduce and even exceed the total emissions of the system [30,31].
4.2. The Case of the Wool
Besides lambs, these farms produce wool, which is a low-profit by-product nowadays, and in some farms a product that cannot be sold. Researchers and producers are interested in Lojeña sheep wool to characterise and enhance its value, promoting it as a high-quality product for the textile industry [48]. Valorising this wool could contribute to the preservation of this endangered breed.
Regarding CF from wool, most LCA studies on wool utilised primary data from farms in Oceania [37], where it is a more profitable product than in Europe. The average emissions when the economic allocation method is used are higher than the figures obtained in this study. For example, Cottle and Cowie [42] studied Merino farms in Australia and recorded a result of 35.8 kg CO2eq kg greasy wool−1 when economic allocation was used and 8.5 kg CO2eq kg greasy wool−1 when mass allocation was used.
Regrettably, in Spain there is not currently a commercial structure to support wool production [49]. However, even in this scenario, sustainability is a concept towards which many sectors are moving, including the textile sector [40]. With the relatively low environmental impact of this product, wool can be established as a raw material of interest for this sector. This is particularly relevant given that synthetic textiles have been identified as the main source of microplastic pollution [50], and this type of pollution is avoided with wool and other organic textiles [51].
4.3. Low Efficiency in Production of Lojeña Sheep
The relationship between productivity and CF has been previously identified [30]. This shows that the increase in efficiency in extensive flocks does not necessarily have to be related to the intensification, as traditionally proposed [37], but to the increase in productive efficiency, and better reproductive control [38].
Lojeña sheep is a breed raised in a very traditional way, and their productivity is low compared to other breeds in pasture-based Mediterranean systems. This is a handicap for the Lojeña breed CF calculations. For example, the Segureña sheep, another Spanish autochthonous breed raised in extensive and low-input systems in hilly areas, had a prolificacy of 1.3 lamb ewe−1 [52] 20 years ago. This prolificacy could have increased in recent years, making the Segureña breed a more efficient breed than the Lojeña breed, which has an average prolificacy of 1 ± 0.2 lamb born ewe−1 year−1. However, the Lojeña breed is the one adapted to grazing in the rugged and rocky Loja Mountain range.
Díaz-Gaona et al. [53] suggest that enhancing the global sustainability of organic and extensive farms could be achieved by improving their productivity. This improvement might be facilitated by adjusting the conditions and criteria for CAP subsidies to better support environmental conservation, aligning with the goals of eco-schemes. Nevertheless, with the current uncertainty about the CAP subsidies, the objective of the studied farms should be the optimal use of the forage resources and the differentiated market of their organic lambs.
Extensive small ruminant grazing systems, such as the Lojeña systems, provide large socioecological services in marginal areas and high value natural areas [54]. Sheep grazing maintains landscape diversity and pastures, controlling scrubs and contributing to reduce wildfire risk [4,55,56]. The extensive ruminant herds have a crucial role in the organic fertilisation of pasture and seed dispersal [57]. These extensive livestock systems do not contribute only to provisioning and regulation services, but to cultural services. This is the case with the Lojeña breed; even if the CF results of this low productivity system are slightly higher than those reported by other more efficient systems, the maintenance of the breed in the Loja mountains contributes not only to the ecosystem services mentioned above, but also to preventing rural depopulation [14]. Quantifying ecosystem services (provisioning, regulation, cultural, and support services) is generally challenging. Although some authors explore different frameworks to address this [58,59], the interactions between ecosystem services make it difficult to achieve accurate measurements. This aspect is very important, because the livestock grazing is considered necessary for the equilibrium of the Sierra de Loja mountains [19].
5. Conclusions
Extensive sheep farming systems have a very variable environmental impact depending on different management decisions. To our knowledge, this is the first time that such a high percentage (93%) of farms producing a native and endangered breed has been studied in its entire territory of origin. The main source of emissions was enteric fermentation attributable to all the products (weaned lamb, fattened lambs, and greasy wool), followed by supplementary feed. Therefore, reducing the stocking rate is a strategy to reduce the CF, as a direct relationship between CF and stocking rate was identified. Additionally, a relationship between lower emissions and higher productivity (lamb sold ewe−1 year−1) was identified. Hence, improving reproductive efficiency is another strategy to reduce CF. Nevertheless, the results of this study suggest that the Lojeña breed can be considered as the best possible traditionally proven livestock genotype for the hostile and harsh environment in which it roams.
The method used for allocating emissions had a significant impact on the result of CF in the products (weaned lambs), and by-products (culled animals and wool) of the farm. Therefore, to compare systems, it is essential to consider the allocation method followed and to ideally report the two different approaches (mass and economic allocation). Future studies should include carbon sequestration in the calculations to obtain more realistic values of these extensive systems.
Supplementary Materials
The following supporting information can be downloaded at: https://www.mdpi.com/article/10.3390/agriculture14081304/s1, Table S1: Livestock Unit conversion factors; Table S2: Livestock Unit conversion factors; Table S3: Methane Conversion factor used for manure methane emission; Table S4: Product prices used for the economical allocation; Table S5: Allocation of emissions of the farms; Table S6: Description of the Lojeña sheep farms studied in Sierra de Loja differentiating organic and conventional management; Table S7: Mean ± standard deviation of sensibility analysis results.
Author Contributions
Conceptualisation: C.R.-P., C.D.-G. and V.R.-E.; Methodology: C.R.-P.; Software: C.R.-P. and S.S.-F.; Validation: C.D.-G. and V.R.-E.; Formal analysis: C.R.-P. and S.S.-F.; Investigation: C.R.-P.; Resources: C.D.-G. and V.R.-E.; Data acquisition: I.M.-C. and C.R.-P.; Data curation: C.R.-P., C.D.-G., S.S.-F. and I.M.-C.; Writing—original draft: C.R.-P.; Writing—review and editing: C.D.-G., E.A. and V.R.-E.; Visualisation: C.R.-P.; Supervision: C.D.-G., E.A. and V.R.-E.; Project administration: C.D.-G. and V.R.-E.; Funding acquisition: V.R.-E. and C.D.-G. All authors have read and agreed to the published version of the manuscript.
Funding
This research was funded by Asociación para el Desarrollo Sostenible del Poniente Granadino, grant number UCO 12021118. E. Aguilera is supported by a Ramón y Cajal Grant (RYC2022-037863-I) funded by MICIU/AEI /10.13039/501100011033 and by ESF+.
Institutional Review Board Statement
Not applicable.
Data Availability Statement
The raw data supporting the conclusions of this article will be made available by the authors on request.
Acknowledgments
The authors are grateful to Asociación de Ganaderos Criadores de la Raza Ovina Lojeña del Poniente Granadino and every farmer who has provided data for this study, especially to Juan Antonio Moreno Cobo.
Conflicts of Interest
Author Eduardo Aguilera is a member of this non-profit organization Alimentta, Think Tank para la Transición Alimentaria. The remaining authors declare that the research was conducted in the absence of any commercial or financial relationships that could be construed as a potential conflict of interest.
References
- Morales-Jerrett, E.; Mena, Y.; Camúñez-Ruiz, J.A.; Fernández, J.; Mancilla-Leytón, J.M. Characterization of Dairy Goat Production Systems Using Autochthonous Breeds in Andalusia (Southern Spain): Classification and Efficiency Comparative Analysis. Small Rumin. Res. 2022, 213, 106743. [Google Scholar] [CrossRef]
- Belanche, A.; Martín-Collado, D.; Rose, G.; Yáñez-Ruiz, D.R. A Multi-Stakeholder Participatory Study Identifies the Priorities for the Sustainability of the Small Ruminants Farming Sector in Europe. Animal 2021, 15, 100131. [Google Scholar] [CrossRef]
- Aguilera, E.; Diaz-Gaona, C.; Garcia-Laureano, R.; Reyes-Palomo, C.; Guzman, G.I.; Ortolani, L.; Sanchez-Rodriguez, M.; Rodriguez-Estevez, V. Agroecology for Adaptation to Climate Change and Resource Depletion in the Mediterranean Region. A Review. Agric. Syst. 2020, 181, 21. [Google Scholar] [CrossRef]
- Díaz-Gaona, C.; Sánchez-Rodríguez, M.; Gómez-Castro, G.; Rodríguez-Estévez, V. La Ganadería Ecológica En La Gestión de Los Espacios Naturales Protegidos: Andalucía Como Modelo. Arch. Zootec. 2014, 63, 25–54. [Google Scholar] [CrossRef][Green Version]
- Moreno, G.; Pulido, F.J. The Functioning, Management and Persistence of Dehesas. Agrofor. Eur. 2009, 6, 127–160. [Google Scholar] [CrossRef]
- FAOSTAT FAOSTAT Database 2023. Available online: https://www.fao.org/faostat/en/#data (accessed on 26 July 2024).
- INE INEbase. Censo Agrario. Available online: https://www.ine.es/dyngs/INEbase/es/operacion.htm?c=Estadistica_C&cid=1254736176851&menu=resultados&idp=1254735727106#!tabs-1254736195761 (accessed on 12 October 2022).
- FADN. FADN PUBLIC DATABASE SO. Available online: https://agridata.ec.europa.eu/extensions/FADNPublicDatabase/FADNPublicDatabase.html (accessed on 17 April 2024).
- Riedel, J.L.; Casasús, I.; Bernués, A. Sheep Farming Intensification and Utilization of Natural Resources in a Mediterranean Pastoral Agro-Ecosystem. Livest. Sci. 2007, 111, 153–163. [Google Scholar] [CrossRef]
- Díaz Gaona, C.; Rodríguez, V.; Sánchez, M.; Ruz, J.M.; Hervás, C.; Mata, C. Estudio de Los Pastos En Andalucia y Castilla-La Mancha; Asociación Valor Ecológico-Ecovalia: Sevilla, Spain, 2014. [Google Scholar]
- Duncan, J.; Rivera-Ferre, M.; Claeys, P. The Importance of Food Sovereignty for the Farm to Fork Strategy and the New Green Deal: Insights and Limits of the SAM and SAPEA Reports 1; Wageningen University & Research: Wageningen, The Netherlands, 2020. [Google Scholar] [CrossRef]
- Muñoz-Ulecia, E.; Bernués, A.; Briones-Hidrovo, A.; Casasús, I.; Martín-Collado, D. Dependence on the Socio-Economic System Impairs the Sustainability of Pasture-Based Animal Agriculture. Sci. Rep. 2023, 13, 14307. [Google Scholar] [CrossRef]
- McAuliffe, G.A.; Takahashi, T.; Orr, R.J.; Harris, P.; Lee, M.R.F. Distributions of Emissions Intensity for Individual Beef Cattle Reared on Pasture-Based Production Systems. J. Clean. Prod. 2018, 171, 1672–1680. [Google Scholar] [CrossRef]
- Ruiz, F.A.; Lara, C.; Mena, Y.; Moreno, J.A. Caracterización de Los Sitemas de Producción de La Raza Ovina Lojeña. Feagas 2016, 39, 72–76. [Google Scholar]
- MAPA. Real Decreto 45/2019, de 8 de Febrero, Por El Que Se Establecen Las Normas Zootécnicas Aplicables a Los Animales Reproductores de Raza Pura, Porcinos Reproductores Híbridos y Su Material Reproductivo, Se Actualiza El Programa Nacional de Conservación, Mej 2019; pp. 19716–19748. Available online: https://www.boe.es/buscar/doc.php?id=BOE-A-2019-2859 (accessed on 4 August 2024).
- Arca, P.; Vagnoni, E.; Duce, P.; Franca, A. How Does Soil Carbon Sequestration Affect Greenhouse Gas Emissions from a Sheep Farming System? Results of a Life Cycle Assessment Case Study. Ital. J. Agron. 2021, 16, 1789. [Google Scholar] [CrossRef]
- BSI PAS 2050:2011; Specification for the Assessment of the Life Cycle Greenhouse Gas Emissions of Goods and Services. BSI: London, UK, 2011.
- González, A.; Herrera, M.; Rodero, E. La Raza Lojeña I: Estado Actual. Available online: https://helvia.uco.es/bitstream/handle/10396/6508/feagas34-2008.2-3.pdf?sequence=1&isAllowed=y (accessed on 4 August 2024).
- Mena, Y.; Ruiz, F.A.; Gutierrez, R.; Vázquez, M.; Castel, J.M. La Función de La Ganadería En El Mantenimiento y El Aprovechamiento de Loa Montes Mediterráneos. Ambienta 2014, 108, 52–67. [Google Scholar]
- Ruiz, F.A.; Lara, C.; Mena, Y.; Gutiérrez, R. Actions to Increase Sustainability in Sheep Production Systems in Disadvantaged Areas of Mediterranean: Lojeña Sheep Breed. In Proceedings of the Libro de Actas 11th European IFSA Symposium, Berlin, Germany, 1–4 April 2014. [Google Scholar]
- IPCC. 2019 Refinement to the 2006 IPCC Guidelines for National Greenhouse Gas Inventories. 2019. Available online: https://www.ipcc-nggip.iges.or.jp/public/2019rf/vol4.html (accessed on 6 August 2024).
- Garry, B.; McGovern, F.M.; Boland, T.M.; Rinne, M.; Kuoppala, K.; Baumont, R.; Lewis, E.; O’Donovan, M. How Does Herbage Mass Effect Voluntary Dry Matter Intake and in Vivo Organic Matter Digestibility in Sheep and the in Vitro Gas Production of Perennial Ryegrass? Livest. Sci. 2021, 244, 104345. [Google Scholar] [CrossRef]
- MARM Real Decreto 1131/2010; de 10 de Septiembre, Por El Que Se Establecen Los Criterios Para El Establecimiento de Las Zonas Remotas a Efectos de Eliminación de Ciertos Subproductos Animales No Destinados a Consumo Humano Generados En Las Explotaciones Ganaderas. 2010. Available online: https://www.boe.es/diario_boe/txt.php?id=BOE-A-2010-15123 (accessed on 6 August 2024).
- Forster, P.; Storelvmo, T.; Armour, K.; Collins, W.; Dufresne, J.-L.; Frame, D.; Lunt, D.; Mauritsen, T.; Palmer, M.; Watanabe, M.; et al. The Earth’s Energy Budget, Climate Feedbacks and Climate Sensitivity. In Climate Change 2021: The Physical Science Basis. Contribution of Working Group I to the Sixth Assessment Report of the Intergovernmental Panel on Climate Change; Masson-Delmotte, V., Zhai, P., Pirani, A., Connors, S., Péan, C., Berger, S., Caud, N., Chen, Y., Goldfarb, L., Gomis, M., et al., Eds.; Cambridge University Press: Cambridge, UK; New York, NY, USA, 2021; pp. 923–1054. [Google Scholar]
- FEDNA. Tablas FEDNA de Valor Nutritivo de Forrajes y Subproductos Húmedos, 2nd ed.; FEDNA: Madrid, Spain, 2016. [Google Scholar]
- FEDNA. Tablas FEDNA 2019, 4th ed.; Fund. Española para el Desarrollo de la Nutrición Animal (FEDNA): Madrid, Spain, 2019; p. 604. [Google Scholar]
- Feedipedia Feedipedia: An on-Line Encyclopedia of Animal Feeds|Feedipedia. Available online: https://www.feedipedia.org/ (accessed on 19 September 2022).
- Cambra-López, M.; García Rebollar, P.; Estellés, F.; Torres, A. Estimación de Las Emisiones de Los Rumiantes En España: El Factor de Conversión de Metano. Arch. Zootec. 2008, 57, 89–101. [Google Scholar]
- UNFCCC Spain. 2022 Common Reporting Format (CRF) Table | UNFCCC. Available online: https://unfccc.int/documents/461783 (accessed on 27 June 2023).
- Reyes-Palomo, C.; Aguilera, E.; Llorente, M.; Díaz-Gaona, C.; Moreno, G.; Rodríguez-Estévez, V. Carbon Sequestration Offsets a Large Share of GHG Emissions in Dehesa Cattle Production. J. Clean. Prod. 2022, 358, 131918. [Google Scholar] [CrossRef]
- Reyes-Palomo, C.; Aguilera, E.; Llorente, M.; Díaz-Gaona, C.; Moreno, G.; Rodríguez-Estévez, V. Free-Range Acorn Feeding Results in Negative Carbon Footprint of Iberian Pig Production in the Dehesa Agro-Forestry System. J. Clean. Prod. 2023, 418, 138170. [Google Scholar] [CrossRef]
- Durlinger, B.; Koukouna, E.; Broekema, R.; Van Paassen, M.; Scholten, J. Agri-Footprint 4.0-Part 1: Methodology and Basic Principles; Agri-Footprint: Gouda, The Netherlands, 2017. [Google Scholar]
- Aguilera, E.; Guzmán, G.; Alonso, A. Greenhouse Gas Emissions from Conventional and Organic Cropping Systems in Spain. I. Herbaceous Crops. Agron. Sustain. Dev. 2015, 35, 713–724. [Google Scholar] [CrossRef]
- Wernet, G.; Bauer, C.; Steubing, B.; Reinhard, J.; Moreno-Ruiz, E.; Weidema, B. The Ecoinvent Database Version 3 (Part I): Overview and Methodology. Int. J. Life Cycle Assess. 2016, 21, 1218–1230. [Google Scholar] [CrossRef]
- Garraín, D.; Fazio, S.; De la Rua, C.; Recchioni, M.; Lechón, Y.; Mathieux, F. Background Qualitative Analysis of the European Reference Life Cycle Database (ELCD) Energy Datasets–Part II: Electricity Datasets. Springerplus 2015, 4, 30. [Google Scholar] [CrossRef][Green Version]
- de Vries, M.; de Boer, I.J.M. Comparing Environmental Impacts for Livestock Products: A Review of Life Cycle Assessments. Livest. Sci. 2010, 128, 1–11. [Google Scholar] [CrossRef]
- Bhatt, A.; Abbassi, B. Review of Environmental Performance of Sheep Farming Using Life Cycle Assessment. J. Clean. Prod. 2021, 293, 126192. [Google Scholar] [CrossRef]
- Ripoll-Bosch, R.; de Boer, I.J.M.; Bernués, A.; Vellinga, T.V. Accounting for Multi-Functionality of Sheep Farming in the Carbon Footprint of Lamb: A Comparison of Three Contrasting Mediterranean Systems. Agric. Syst. 2013, 116, 60–68. [Google Scholar] [CrossRef]
- Eldesouky, A.; Mesias, F.J.; Elghannam, A.; Escribano, M. Can Extensification Compensate Livestock Greenhouse Gas Emissions? A Study of the Carbon Footprint in Spanish Agroforestry Systems. J. Clean. Prod. 2018, 200, 28–38. [Google Scholar] [CrossRef]
- Wiedemann, S.G.; Simmons, A.; Watson, K.J.L.; Biggs, L. Effect of Methodological Choice on the Estimated Impacts of Wool Production and the Significance for LCA-Based Rating Systems. Int. J. Life Cycle Assess. 2019, 24, 848–855. [Google Scholar] [CrossRef]
- Colley, T.A.; Olsen, S.I.; Birkved, M.; Hauschild, M.Z. Delta Life Cycle Assessment of Regenerative Agriculture in a Sheep Farming System. Integr. Environ. Assess. Manag. 2020, 16, 282–290. [Google Scholar] [CrossRef] [PubMed]
- Cottle, D.J.; Cowie, A.L. Allocation of Greenhouse Gas Production between Wool and Meat in the Life Cycle Assessment of Australian Sheep Production. Int. J. Life Cycle Assess. 2016, 21, 820–830. [Google Scholar] [CrossRef]
- O’Brien, D.; Bohan, A.; McHugh, N.; Shalloo, L. A Life Cycle Assessment of the Effect of Intensification on the Environmental Impacts and Resource Use of Grass-Based Sheep Farming. Agric. Syst. 2016, 148, 95–104. [Google Scholar] [CrossRef]
- Aguilera, E.; Reyes-Palomo, C.; Díaz-Gaona, C.; Sanz-Cobena, A.; Smith, P.; García-Laureano, R.; Rodríguez-Estévez, V. Greenhouse Gas Emissions from Mediterranean Agriculture: Evidence of Unbalanced Research Efforts and Knowledge Gaps. Glob. Environ. Chang. 2021, 69, 102319. [Google Scholar] [CrossRef]
- Knudsen, M.T.; Dorca-Preda, T.; Djomo, S.N.; Pena, N.; Padel, S.; Smith, L.G.; Zollitsch, W.; Hortenhuber, S.; Hermansen, J.E. The Importance of Including Soil Carbon Changes, Ecotoxicity and Biodiversity Impacts in Environmental Life Cycle Assessments of Organic and Conventional Milk in Western Europe. J. Clean. Prod. 2019, 215, 433–443. [Google Scholar] [CrossRef]
- Horrillo, A.; Gaspar, P.; Escribano, M. Organic Farming as a Strategy to Reduce Carbon Footprint in Dehesa Agroecosystems: A Case Study Comparing Different Livestock Products. Animal 2020, 10, 162. [Google Scholar] [CrossRef]
- Escribano, M.; Horrillo, A.; Mesías, F.J. Greenhouse Gas Emissions and Carbon Sequestration in Organic Dehesa Livestock Farms. Does Technical-Economic Management Matters? J. Clean. Prod. 2022, 372, 133779. [Google Scholar] [CrossRef]
- Díaz, E.; Gonzaléz-Ariza, A.; Navas-González, F.J.; Aguilera, M.; López, B.; Iglesias, C.; León, J.M.; Delgado, J.V.; Camacho, M.E.; Arando, A. Caracterización de La Lana Ecológica de La Raza Ovina Lojeña Como Contribución a Su Conservación. Arch. Zootec. 2022, 71, 158–162. [Google Scholar]
- Herrero, M.T. Women and Wool in Dehesas: Gender Overview of the Wool Supply Chain in Spain. In Cultural Landscapes and Biodiversity in the Mediterranean Basin; IUCN: Washington, DC, USA, 2020; pp. 1–62. [Google Scholar]
- Xu, C.; Zhang, B.; Gu, C.; Shen, C.; Yin, S.; Aamir, M.; Li, F. Are We Underestimating the Sources of Microplastic Pollution in Terrestrial Environment? J. Hazard. Mater. 2020, 400, 123228. [Google Scholar] [CrossRef] [PubMed]
- Periyasamy, A.P.; Tehrani-Bagha, A. A Review on Microplastic Emission from Textile Materials and Its Reduction Techniques. Polym. Degrad. Stab. 2022, 199, 109901. [Google Scholar] [CrossRef]
- Delgado, J.V.; Rodríguez, J.V.; León, J.M.; Puntas, J.; Benavente, M.; García, G.; Barba, C. Selection Scheme of the Segureña Breed of Sheep. Arch. Latinoam. Prod. Anim. 2004, 12, 59–62. [Google Scholar]
- Díaz-Gaona, C.; Sánchez-Rodríguez, M.; Rodríguez-Estévez, V. Assessment of the Sustainability of Extensive Livestock Farms on the Common Grasslands of the Natural Park Sierra de Grazalema. Sustainability 2021, 13, 1818. [Google Scholar] [CrossRef]
- Garmendia, E.; Aldezabal, A.; Galan, E.; Andonegi, A.; del Prado, A.; Gamboa, G.; Garcia, O.; Pardo, G.; Aldai, N.; Barron, L.J.R. Mountain Sheep Grazing Systems Provide Multiple Ecological, Socio-Economic, and Food Quality Benefits. Agron. Sustain. Dev. 2022, 42, 47. [Google Scholar] [CrossRef]
- Barba, C.; Fernández-Tomillo, L.; Jiménez, R.; Guzmán, J.R.; García, A. Valor Ecológico Ambiental y Conservación de Razas Ovinas. Arch. Zootec. 2016, 65, 445–448. [Google Scholar]
- Fernández-García, V.; Calvo, L. Landscape Implications of Contemporary Abandonment of Extensive Sheep Grazing in a Globally Important Agricultural Heritage System. Land 2023, 12, 780. [Google Scholar] [CrossRef]
- Cruz Moriana, V.; Mancilla-Leytón, J.M.; Mena, Y.; de Ruiz Morales, F.A. Identification of the Multifunctionality of Andalusian Autochthonous Pastoral Livestock Breeds at the Farm Level. Agriculture 2024, 14, 558. [Google Scholar] [CrossRef]
- dos Santos, M.P.; Morais, T.G.; Domingos, T.; Teixeira, R.F.M. Valuing Ecosystem Services Provided by Pasture-Based Beef Farms in Alentejo, Portugal. Land 2022, 11, 2238. [Google Scholar] [CrossRef]
- Rodríguez-Ortega, T.; Olaizola, A.M.; Bernués, A. A Novel Management-Based System of Payments for Ecosystem Services for Targeted Agri-Environmental Policy. Ecosyst. Serv. 2018, 34, 74–84. [Google Scholar] [CrossRef]


Disclaimer/Publisher’s Note: The statements, opinions and data contained in all publications are solely those of the individual author(s) and contributor(s) and not of MDPI and/or the editor(s). MDPI and/or the editor(s) disclaim responsibility for any injury to people or property resulting from any ideas, methods, instructions or products referred to in the content. |
© 2024 by the authors. Licensee MDPI, Basel, Switzerland. This article is an open access article distributed under the terms and conditions of the Creative Commons Attribution (CC BY) license (https://creativecommons.org/licenses/by/4.0/).